

Abstract
The concept of working memory is key to cognitive functioning. Working memory encompasses the capacity to retain immediately past information, to process this information, and to use it to guide goal-directed behavior. Corvid songbirds are renowned for their high-level cognitive capabilities, but where and how visual information is temporarily retained by neurons in the avian brain in a behaviorally relevant way remains poorly understood. We trained four carrion crows (Corvus corone) on versions of a delayed match-to-sample task that required the crows to remember a visual stimulus for later comparison. While the crows performed the task, we recorded the activity of single neurons in the nidopallium caudolaterale (NCL), a pallial association area of the avian endbrain. We show that many NCL neurons encode information about visual stimuli and temporarily maintain this information after the stimulus disappeared by sustained delay activity. Selective delay activity allows the birds to hold relevant information in memory and correlates with discrimination behavior. This suggests that sustained activity of NCL neurons is a neuronal correlate of visual working memory in the corvid brain and serves to bridge temporal gaps, thereby offering a workspace for processing immediately past visual information.
Keywords: crow, delayed match-to-sample, nidopallium caudolaterale, single-cell recording, songbird
Introduction
Although they lack a layered neocortex, corvids possess high-level cognitive capabilities that match primates in many respects (Emery and Clayton, 2004). The nidopallium caudolaterale (NCL) is a key avian brain area to enable corvids' remarkable behavioral flexibility (Veit and Nieder, 2013). It is an associative forebrain area that is considered to be a functional equivalent of primate prefrontal cortex (PFC) based on its dopaminergic innervation (Divac et al., 1985; Durstewitz et al., 1999), its connectivity (Güntürkün, 2005), and lesion studies (Mogensen and Divac, 1993; Hartmann and Güntürkün, 1998).
One of the best-studied functions of PFC is working memory. As a fundamental ability for any complex behavior, the concept of working memory encompasses the capacity to retain immediately past information, to process this information, and to use it to guide goal-directed behavior. Sustained neuronal activity throughout the memory period of delayed response tasks is widely accepted to reflect active maintenance of the to-be-remembered stimulus in working memory (Fuster and Alexander, 1971; Goldman-Rakic, 1995; Miller et al., 1996; Miller and Cohen, 2001; Fuster, 2008).
Lesion studies point toward NCL as an anatomical substrate for working memory just like PFC (Mogensen and Divac, 1993; Diekamp et al., 2002a), but the underlying neurophysiological processes are less clear. Although sustained delay activity has been described in NCL (Diekamp et al., 2002b; Rose and Colombo, 2005), previous behavioral protocols used for combined behavioral/neurophysiological studies in pigeons did not allow to dissociate activity related to working memory for a stimulus from motor preparatory activity or encoding of reward expectation. Indeed, recent work in pigeons concluded that sustained delay activity in the NCL during a differential outcomes task mainly codes for an upcoming reward and not working memory for the sample stimulus (Milmine et al., 2008a; Browning et al., 2010).
Therefore, we investigated the temporary retention of visual information about the sample stimulus by single neurons in the NCL of behaving crows, corvid songbirds. We used a behavioral protocol known as delayed match-to-sample (DMS) task (and a rule-based variation of the DMS task) that allows to address this specific subcomponent of working memory functions and has been applied successfully in many neurophysiological studies of visual memory in primates (Fuster and Alexander, 1971; Miller et al., 1996; Rainer and Miller, 2002). In DMS tasks, subjects are cued with a sample object and then, after a brief delay, must select that object from a display. To solve the task, the sensory properties of a sample need to be encoded and maintained throughout the delay to be available during a final test period. Importantly, each sample object allowed the same possibility of reward, and the location of the match item in the test phase was randomized and balanced. Therefore, sample-specific cognitive processes related to reward prediction or motor preparation are excluded during the sample and delay periods. The DMS task thus allows an investigation of a pure visual response to the sample during the sample phase and a sensory-related memory maintained during the delay period.
Materials and Methods
Subjects.
Four hand-raised, adult carrion crows (Corvus corone corone), two males and two females, were used in these experiments. Two crows were trained on the DMS task, and two crows were trained on a delayed rule-switching task (Veit and Nieder, 2013). All crows were obtained from the breeding facilities of the institute of Neurobiology, University of Tübingen. The birds were housed in social groups in spacious indoor aviaries. They were maintained on a controlled feeding protocol during the sessions and earned food during and after the daily tests. For details on the birds' housing and diet, see the study by Hoffmann et al. (2011). All animal preparations and procedures fully complied with the National Institutes of Health Guide for Care and Use of Laboratory Animals and were approved by the local ethical committee and authorized by the national authority (Regierungspräsidium).
Apparatus.
The subjects were attached to a wooden perch by a leather jess and placed in an operant conditioning chamber in front of a touchscreen monitor (3M Microtouch, 15 inches, 60 Hz refresh rate). All stimuli were displayed on this monitor. Reward [birdseed pellets or mealworms (Tenebrio molitor larvae)] was delivered by a custom-built automated feeder below the screen. The CORTEX program (National Institute of Mental Health) was used for experimental control and behavioral data acquisition. An infrared light barrier, in combination with a reflector attached to the bird's head, registered when the bird was positioned in front of the screen and facing it.
Behavioral protocol.
We used two behavioral protocols, a DMS task and a rule-switching task. The first four task periods were completely identical in both tasks (Fig. 1, Go-Stimulus, Presample, Sample, Delay/Delay 1). The crows initiated a trial by moving their head into the light barrier when a go stimulus (white square, 11 × 11 mm) was shown on the screen. The crows had to keep their head still throughout the trial; if they moved their head before the response period (as detected by the light barrier), the trial was aborted. After 200 ms, the go stimulus turned off, followed by a 500 ms presample period without any stimulus on the screen. The last 400 ms of this presample period were used to measure neuronal baseline activity. The sample stimulus was presented in the center of the screen for 500 ms and was randomly chosen from a set of four photographs (2 × 2 cm), which was exchanged every day. The screen remained black during the 1000 ms delay (called delay 1 in the rule-switching task), in which the bird had to remember the sample stimulus. All analyses focus on these sample and delay periods (Fig. 1, Encoding/Memory period).
Figure 1.
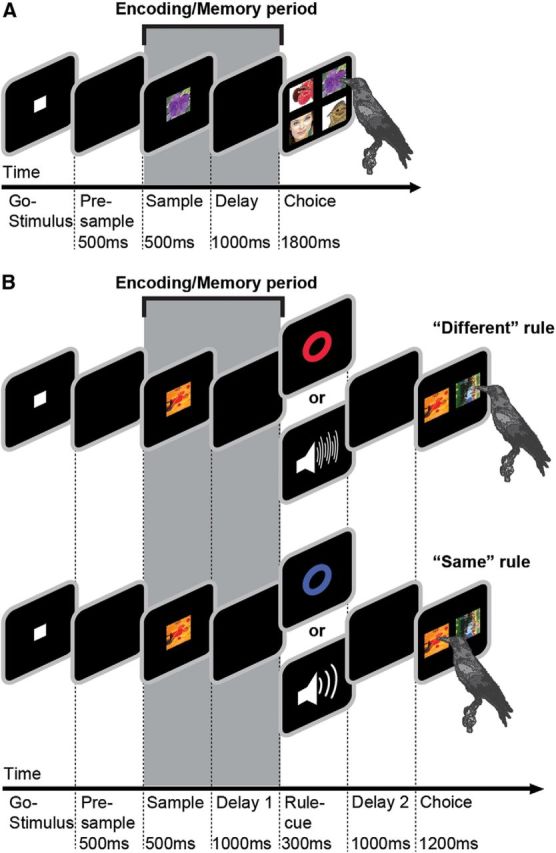
Task protocol and stimuli. A, DMS task. The bird initiated a trial by keeping its head still in front of the monitor (automatically detected) to activate a go stimulus. After a 500 ms presample period, a sample stimulus was presented for 500 ms, followed by a 1000 ms delay. In the choice period, the crow chose the image identical to the sample item from an array of four items to receive a reward. All relevant task parameters were balanced. B, Rule-switching task. Go stimulus, presample, sample, and delay 1 are identical to the DMS task. After the first delay, a rule cue (either visual or auditory) indicated whether the bird was required to choose the same image as the sample image or a different image. The rule cue was followed by another 1000 ms delay. The choice period consisted of two images: the sample image and one other image from the daily set of four images. The shaded area (Encoding/Memory period) marks the analyzed sample and delay periods, which were completely identical in both tasks.
After the delay or delay 1 periods of the DMS and rule-switching tasks, respectively, the two tasks differed in procedure. In the DMS task (Fig. 1A), the choice period immediately followed the delay and consisted of all four sample images (2 × 2 cm each) displaced 6.6 cm apart in the four corners of the screen. In the rule-switching task (Fig. 1B), the birds had to flexibly match or nonmatch the sample image. The rule (matching or nonmatching) was indicated by a cue after the first delay. Each rule could be signaled by either a visual cue (red or blue circle) or an auditory cue (white noise or upward frequency-modulated sweep). The cue period was followed by another delay. In the choice period, two images (one match and one nonmatch) were displayed 6.6 cm apart to the left and right of the center of the screen. For details of the rule-switching protocol, see the study by Veit and Nieder (2013). For either rule, the birds had to remember the sample image to answer the trial correctly.
In both versions of the task, the location of the match image was randomized and balanced. The birds indicated their choices by pecking at the appropriate stimulus. If their choice was correct, the automated feeder delivered feedback via light and sound. The two female birds received partial food reward for ∼50% of correct trials, and the two male birds were rewarded with food for each correct trial. If the birds chose incorrectly, the trial was aborted and a short timeout (3 s) was presented before the start of the next trial. If no response occurred within 1800 ms for the DMS task or 1200 ms for the rule-switching task, the trial was dismissed. All relevant task parameters were balanced.
Surgery and recordings.
All surgeries were performed under sterile conditions while the animals were under general anesthesia. Crows were anesthetized with a ketamine/Rompun mixture (50 mg/kg ketamine and 5 mg/kg xylazine initially and supplemented hourly with 17 mg/kg ketamine and 1.7 mg/kg xylazine, i.m.). The head was placed in the stereotaxic holder that was customized for crows with the anterior fixation point (i.e., beak bar position) 45° below the horizontal axis of the instrument (Karten and Hodos, 1967). Using stereotaxic coordinates (center of craniotomy: anteroposterior, 5 mm; mediolateral, 13 mm), we chronically implanted two microdrives with four electrodes each, a connector for the head stage, and a small head post to hold the reflector for the light barrier. The crows received postoperative analgesics [Butorphanol (Morphasol), 1 mg/kg, i.m.].
We recorded from eight chronically implanted microelectrodes on two custom-built microdrives that were implanted in the left hemisphere in bird I, bird P, and bird D and in both hemispheres in bird K. We used glass-coated tungsten microelectrodes with 2, 4, and 10 MΩ impedance and platinum–iridium electrodes with 1 MΩ impedance (all electrodes from Alpha Omega). The large majority of neurons were recorded with 2 MΩ tungsten electrodes. The electrodes targeted the NCL. We recorded a total of 161 neurons in bird K, 160 neurons in bird I, 207 neurons in bird P, and 134 neurons in bird D.
At the start of each recording session, the electrodes were advanced manually until a good neuronal signal was detected on at least one of the channels of each microdrive. Neurons were not preselected for involvement in the task. Each microdrive had a range of ∼5 mm that was exploited to record from the NCL across different depths over a period of several weeks. Signal amplification, filtering, and digitizing of spike waveforms were accomplished using the Plexon system. For each recording session, the birds were placed in the recording setup, and a head stage containing an amplifier was plugged into the connector implanted on the bird's head and connected to a second amplifier/filter and the Plexon MAP box outside the setup by a cable above and behind the bird's head (all components by Plexon). Spike sorting into single-unit waveforms was performed manually offline using the Plexon system. The analysis includes all neurons that were recorded for at least 10 repetitions of each sample item and had a firing rate of at least 1 Hz during the sample and delay periods. Each recording session lasted between 200 and 500 correct trials in ∼2 h.
Histology.
After the end of recordings, bird K was killed to investigate electrode positions. The bird was anesthetized with sodium pentobarbital (50 mg/kg) and perfused with Ringer's solution, followed by 4% paraformaldehyde in 0.1 m phosphate buffer at pH 7.4. The head was placed in a stereotaxic holder that was customized for crows. The brain was removed from the skull and blocked in sagittal or coronal planes. After postfixation overnight in 4% paraformaldehyde, the brain was transferred to a 20% sucrose in TBS solution for 24 h and then a 30% sucrose in TBS solution for 48 h before sectioning. Cryostat sections were immunohistochemically stained for tyrosine hydroxylase to identify dopaminergic cells that characterize the NCL (Veit and Nieder, 2013). Tracing electrode tracks confirmed that recording locations were within the NCL.
Data analysis.
Neuronal activity during the task was analyzed in different periods of interest. For the sample period, firing rates were measured in a 500 ms window, shifted by 80 ms from sample onset to account for the visual latency of most neurons. Delay-period activity was measured in an 800 ms window at the end of the delay period (delay 1 period of the rule-switching task), i.e., activity during the first 200 ms of the delay period was clipped to exclude potential visual offset activity. A Kruskal–Wallis one-factor ANOVA was used to determine whether the discharge rates for the four different sample images differed significantly (p < 0.05).
For neurons that significantly differentiated between different sample items in their firing rate, we additionally calculated selectivity indices to quantify the strength of the tuning to individual samples (Miller et al., 1996; Vallentin and Nieder, 2010). Selectivity strength is defined as follows:
where FR_max is the firing rate of the cell to the preferred sample item, and FR_min is the firing rate to the least preferred sample item. The preferred and least preferred sample items are defined as the sample items with the highest and lowest firing rate, respectively. Thus, selectivity strength is a value between 0 and 1, with values close to 1 indicating very strong selectivity.
We quantified the discriminability of the preferred and least preferred sample (highest and lowest firing rate) of each cell using a receiver operating characteristic (ROC) analysis derived from signal detection theory (Green and Swets, 1966). The area under the ROC curve (AUROC) measures the amount of overlap between two distributions (in this case, between firing rates of one neuron in trials with the preferred sample and firing rates in trials with the least preferred sample). AUROC is a value between 0.5 and 1, with 0.5 indicating complete overlap (i.e., no difference in firing rates for the preferred and least preferred sample) and 1 indicating perfect separability (i.e., all trials with the preferred sample had a higher firing rate than any trial with the least preferred sample). AUROC values <0.5 indicate that the firing rates for the least preferred sample were higher than for the preferred sample in error trials. AUROC values were calculated in the same windows used for the Kruskal–Wallis test in the sample and delay periods. In addition, a sliding ROC analysis was performed in a 200 ms window that was advanced by a step size of 20 ms to determine the temporal evolution of the AUROC values throughout the trial.
Before averaging peristimulus time histograms (PSTHs) from different neurons, we subtracted the baseline activity of each cell, defined as the last 400 ms of the presample period before the presentation of the sample. We then normalized the firing rates to units of SD from baseline.
The visual latency of each neuron was calculated by averaging the discharge rate of the cell on all correct trials in 10 ms windows. Mean and SD of baseline activity was measured in the last 400 ms of the presample period. The latency was defined as the first time bin within the sample period in which the activity was higher or lower than 3 SDs around the baseline activity and stayed higher or lower for 20 consecutive windows. The latencies calculated in this way usually matched very well with latencies estimated by visual inspection.
All selective neurons (n = 303 in the sample phase, n = 126 in the delay phase) were included in the analysis of firing rates in error trials. Only neurons with at least three error trials each for their preferred and least preferred sample items (n = 192 and n = 82) were included in the ROC analyses of error trials. Error ROC values were obtained by comparing the distribution for the preferred and least preferred sample items of each cell during error trials.
Results
Behavioral performance
Two carrion crows were trained on a working memory task in a touchscreen-controlled operant conditioning setup. The DMS task required the birds to keep arbitrary images in working memory over a short delay period and then select the correct image from an array of four images (Fig. 1A). Two additional crows were trained in a rule-switching task (Veit and Nieder, 2013), which involved a comparable working memory period (Fig. 1B). In both tasks, the crows were required to remember one of four sample images over a short delay. The set of four sample images was exchanged every day to ensure that the birds were able to match arbitrary images and did not rely on item-specific strategies. The location of the correct test item was randomized and balanced.
All birds performed the task proficiently [81.8 ± 0.8 and 93.4 ± 0.5% correct over all recording sessions for bird K and bird I, respectively; chance level, 25% (Fig. 2A); 91.6 ± 0.4 and 90.9 ± 0.4% for bird P and bird D, respectively; chance level, 50% (Fig. 2B)]. The performance for each sample item for each individual recording session was significantly higher than chance for all birds (p < 0.01, binomial test). Moreover, performance on the first trial for each new image was significantly higher than chance (73.4% for bird K, 91.7% for bird I, 87.5% for bird P, 88.4% for bird D; all p < 0.01, binomial test), indicating that the birds could apply the matching concept to arbitrary images and did not have to learn image-specific strategies during the session.
Figure 2.

Behavioral performance. A, Behavioral performance (percentage correct) for bird K and bird I in the DMS task over all recording sessions. Dotted lines indicate chance level. B, Behavioral performance for bird P and bird D in the rule-switching task over all recording sessions. Dotted lines indicate chance level.
General neuronal response properties
We recorded the activity of 662 neurons in the NCL of four carrion crows (Fig. 3). Most individual neurons varied their firing rate related to task events. Figure 4A shows the averaged single-cell activity of all recorded neurons in units of SD from baseline firing rate (mean of 3.7 Hz). The neuronal population histogram shows a prominent visual activation with a relatively long average visual response latency. After the offset of visual activity, the population activity exhibits sustained discharge throughout the delay period.
Figure 3.
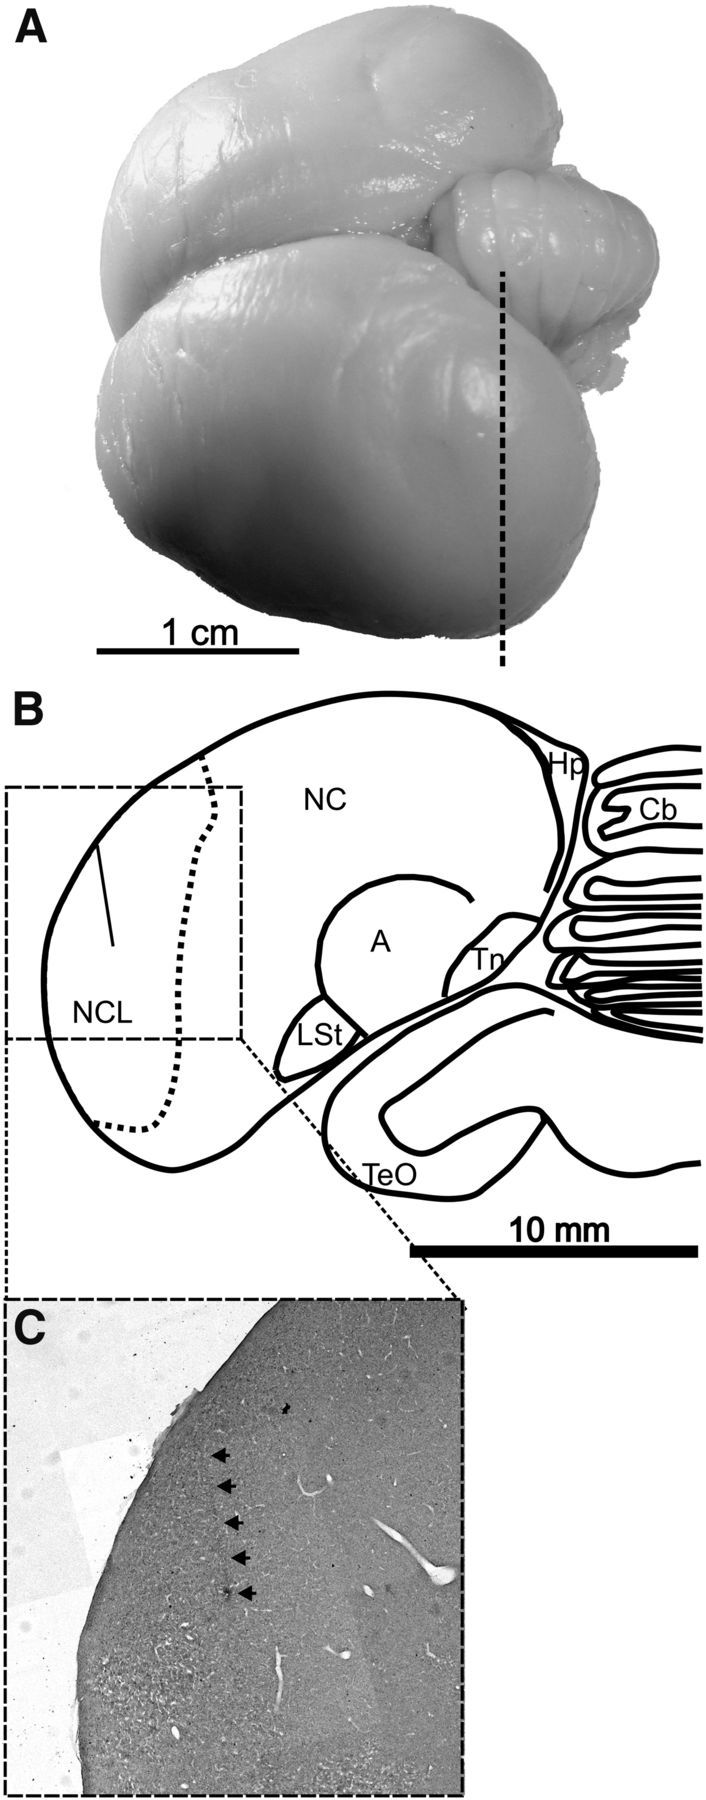
Recording sites in the carrion crow brain. A, Dorsolateral view of a carrion crow brain. Vertical dashed line indicates section level A5.00. B, Coronal section (level A5.00) through the brain of a carrion crow (bird K) illustrating the borders of the NCL in the caudal telencephalon based on immunohistochemistry for tyrosine hydroxylase. The electrode tract within NCL is indicated by a vertical line. A, Arcopallium; Cb, cerebellum; Hp, hippocampal formation; LSt, striatum laterale; NC, nidopallium caudale; Tn, nucleus taeniae amygdalae; TeO, tectum opticum. C, Magnified brain section (coronal plane) from the NCL showing an electrode track (indicated by arrows).
Figure 4.

Visual responses in the NCL. A, Average PSTH of all recorded neurons in units of SD over baseline. The population of NCL neurons shows a visual response during the sample period. There is elevated activity throughout the delay period without visual stimulation. Shadow shows SEM over all neurons. B, Histogram of visual response latencies of those neurons for which response latency could be calculated (n = 162). Dotted line indicates the median.
Neuronal responses to visual stimuli
A neuron was called visually responsive if the average firing rate during the sample period was significantly different from baseline activity (above or below baseline; p < 0.01, Wilcoxon's signed-rank test). Of all neurons, 73.9% (489 of 662) were visually responsive. The median visual latency of these neurons was 144 ms (Fig. 4B) and was comparable for the DMS task (153 ms) and the rule-switching task (139 ms) (p > 0.05, Mann–Whitney U test). In addition, the proportions of visually responding neurons were similar for the DMS task (75.4%, or 242 of 321) and the rule-switching task (72.4%, or 247 of 341) (p > 0.05, χ2 test).
To determine selectivity for different sample images, we compared the firing rates for the different images during a 500 ms window, shifted by 80 ms to account for the visual response latency. A total of 45.8% of the neurons (303 of 662) significantly varied their firing rate in response to the four different sample images during the sample period (p < 0.05, Kruskal–Wallis test). Figure 5, A and B, depicts representative sample-selective neurons. The proportions of sample-selective neurons during the sample phase were similar in the DMS task (46.7%) and rule-switching task (44.9%) (p > 0.05, χ2 test). The sample item that elicited the highest firing rate will be called the preferred item of a neuron and the sample item that resulted in the lowest firing rate the least preferred item. Figure 5C shows normalized population discharge histograms of all neurons selective to the visual display during the sample phase to their preferred and least preferred items, respectively. As a population, the neurons elevated their firing in the sample phase for the preferred item but did not change the firing rate for the least preferred item. On a level of individual neurons, 67% of sample-selective neurons elevated their firing rate above baseline in the sample phase, whereas 23% of selective neurons had suppressed firing rates with respect to their baseline firing rates.
Figure 5.
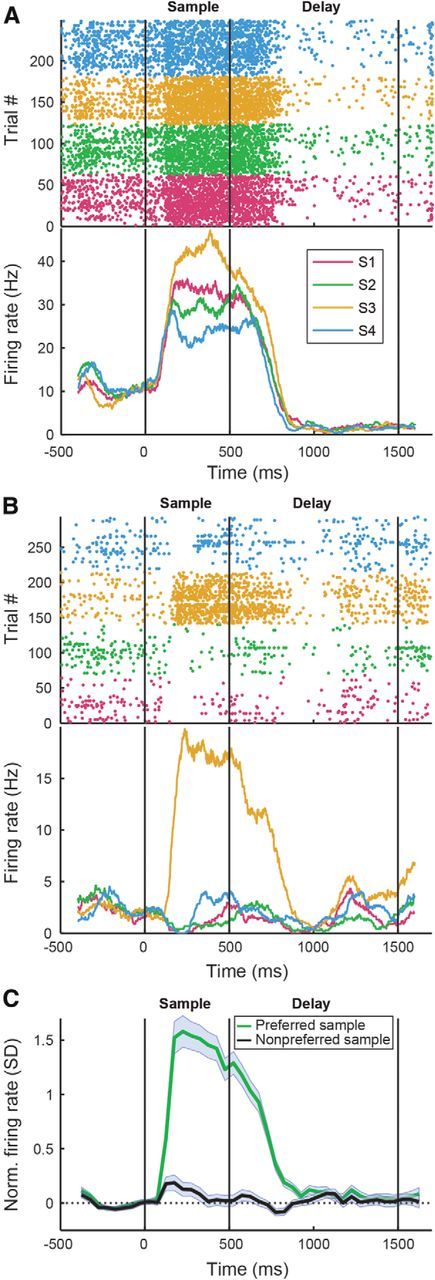
Sample-selective responses in the NCL. A, B, Examples of sample-selective neurons. The top shows dot raster plots for the four different sample items. The bottom shows the PSTH for the same cells, smoothed with a 100 ms boxcar window for illustration. Vertical lines mark the beginning and end of the sample and delay periods. Colors represent responses to the four different sample images. C, Average PSTH for the population of sample-selective neurons for their preferred and least preferred items. Shadows show SEM over neurons, and vertical lines mark the beginning and end of the sample and delay periods. PSTHs for individual neurons were normalized to units of SD over baseline before averaging.
Sample-selective delay activity
During the delay period, 68.3% of all neurons (452 of 662) exhibited discharges different from baseline activity (above or below baseline; p < 0.01, Wilcoxon's signed-rank test). These results were comparable for the DMS task (66.4%, 213 of 321) and the rule-switching task (70.1%, 239 of 341) (p > 0.05, χ2 test). Remarkably, 19% of the neurons (126 of 662) discriminated significantly between the four different sample images during the delay period (p < 0.05, Kruskal–Wallis test), although the images were no longer shown on the screen. Figure 6, A and B, shows two example neurons discriminating between images in the delay phase. These proportions of stimulus-selective neurons during the delay period were similar in the DMS task (19%) and rule-switching task (19.1%) (p > 0.05, χ2 test).
Figure 6.
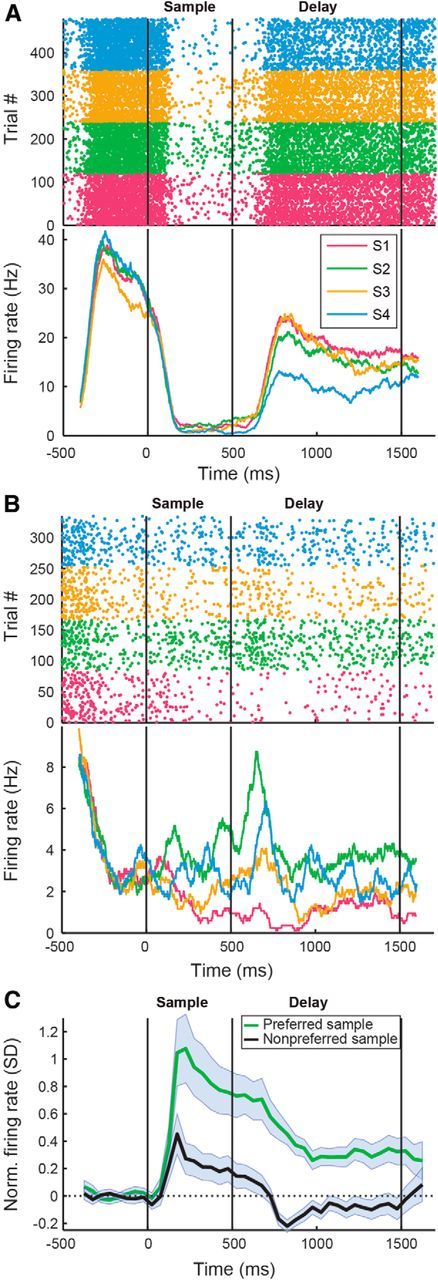
Selective delay activity in the NCL. A, B, Examples of delay-selective neurons. As in Figure 5, A and B. C, Average normalized PSTH for the population of delay-selective neurons for their preferred and least preferred items. As in Figure 5C.
Again, we defined the preferred item of a neuron as the one eliciting the highest firing rate and the least preferred item as the sample image eliciting the lowest firing rate in the delay period. The normalized population discharge histograms of all delay-selective neurons in response to their preferred and least preferred items are depicted in Figure 6C. The delay-selective neurons showed a clear visual response in the sample phase. During the delay period, population activity was elevated for the preferred item (p < 0.001, Wilcoxon's signed-rank test), whereas activity for the least preferred item was lower than baseline (p < 0.001, Wilcoxon's signed-rank test). On the level of individual neurons, 55% of selective neurons had firing rates higher than baseline in the delay period, and 45% had firing rates lower than baseline.
Because the proportions of responsive and selective neurons for the sample and the delay period for both task protocols (DMS and rule-switching) were comparable, we pooled the neurons for additional analyses.
Comparison of stimulus responses and delay activity
Neurons selectively tuned to the same image during both the sample and delay activity would be ideally suited to bridge temporal gaps in the delayed tasks. Indeed, 63.5% (80 of 126) of the 19% selective delay neurons were also tuned during the sample period (Fig. 7A); 45% (36 of 80) of these neurons showed the highest firing rate for the same item during the sample and delay periods. This fraction of neurons with identical preference during sample and delay is higher than expected by chance (p < 0.01, χ2 test). Figure 6B shows a neuron that becomes selective in the sample period and maintains elevated activity for its preferred item throughout the sample and delay periods. The neuron in Figure 5A shows a strong response for one of the items during the sample period, and this selectivity is recovered toward the end of the delay. Although all four birds contributed sample- and delay-selective neurons for all previous analyses, the 36 neurons selectively tuned for the same item in both sample and delay periods stemmed from only two crows (15 from bird I participating in the DMS task and 21 from bird P participating in the rule-switching task).
Figure 7.
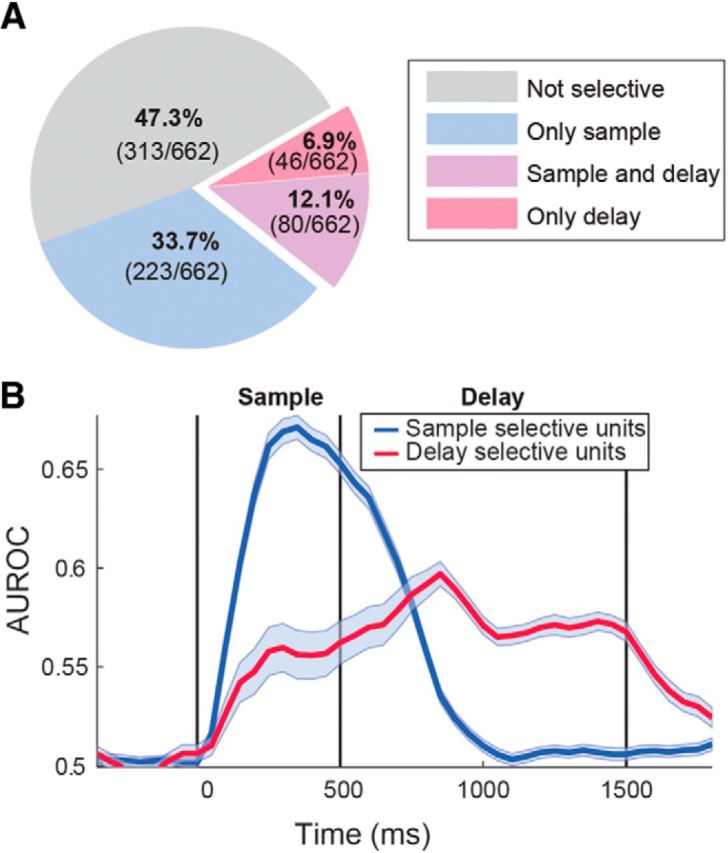
Working memory-related activity in the population of selective neurons. A, Proportion of recorded neurons significantly varying their firing rate in the sample, delay, or sample and delay periods. Numbers in brackets show absolute number of neurons in each category. B, Sliding ROC analysis comparing the preferred item against the least preferred item (highest and lowest firing rates) for the populations of sample-selective (blue) and delay-selective (red) neurons. Shadows indicate SEM over all neurons.
Quality of neuronal selectivity
We used an ROC analysis derived from signal detection theory (Green and Swets, 1966) to quantify how well the preferred item can be discriminated from the least preferred item based on the distribution of the firing rates of one neuron. The AUROC is a value between 0.5 and 1, with 0.5 indicating complete overlap between two distributions (i.e., no discrimination) and 1 indicating perfect separation. For the sample period (measured in the standard 500 ms window), the AUROC value was 0.73 ± 0.01. In the delay period (analyzed in the standard 800 ms window), the AUROC value reached 0.66 ± 0.004. Figure 7B shows the temporal evolution of neuronal discriminability as measured by a sliding ROC analysis. This sliding ROC analysis was calculated separately for both sample- and delay-selective neurons and shows the time course of how these neurons discriminate between the preferred and least preferred samples across the trial.
To further quantify the selectivity for different samples, we calculated a selectivity index that measures the strength of the encoding. The selectivity index is a number between 0 and 1, with values close to 1 indicating very strong selectivity (Miller et al., 1996; Vallentin and Nieder, 2010). The average selectivity index for the population of sample-selective neurons was 0.42 ± 0.01 during the sample phase. The average selectivity index in the delay phase for the population of delay-selective neurons was 0.21 ± 0.01.
Behavioral relevance of selective neurons
To determine whether the selective activity is contributing to maintain an active working memory for the sample image, we analyzed the firing rates of the cells in trials when the bird made a mistake, i.e., chose the wrong image from the test array. We found that the discharge rate for the preferred sample item was significantly reduced by 11.4% during the sample (p < 0.001, Wilcoxon's signed-rank test; Fig. 8A) and by 8% during delay periods (p < 0.01, Wilcoxon's signed-rank test; Fig. 8B) in erroneous trials. Conversely, firing rates for the least preferred item were significantly increased by 10.1% during the delay period (p < 0.05, Wilcoxon's signed-rank rest; Fig. 8B), indicating that the distinction between the preferred and least preferred items was reduced or broke down in error trials.
Figure 8.

Behavioral relevance of selective neurons. A, B, Relative firing rate for the different samples, ranking them from highest to lowest firing rates (black), and firing rate for the same sample items during error trials (gray). Firing rates are normalized so that the firing rate for the preferred sample is 1 and for the nonpreferred sample is 0 in correct trials. Asterisks indicate significant differences (*p < 0.05, **p < 0.01, Wilcoxon's signed rank test). C, D, AUROC values comparing the most and least preferred sample for the population of sample-selective neurons (C) and delay-selective neurons (D). Dotted lines indicate the median. Asterisks indicate significant differences (**p < 0.01, Wilcoxon's signed rank test). AUROC values in error trials (gray) were lower than in correct trials (black).
To further quantify this effect, we calculated AUROC values based on error trial discharges to the preferred and least preferred items. Compared with the AUROC values of the same neurons using correct trials, discriminability was significantly reduced by 6.8% in the sample phase during error trials (p < 0.001, Wilcoxon's signed-rank test; Fig. 8C). In the delay period, discriminability was reduced by 12.6% during error trials (p < 0.001, Wilcoxon's signed-rank test; 18.7% for the DMS task and 8.1% for the rule-switching task; Fig. 8D).
In summary, these findings indicate that individual neurons in the NCL vary their discharge rate in the sample and delay periods depending on the presented sample stimulus. These NCL neurons temporarily store currently important information about visual stimuli and thus represent a neuronal correlate of visual working memory in the avian brain. Encoding of the sample stimulus was weaker in error trials, suggesting that the birds rely on these neurons when choosing the correct item.
Discussion
We demonstrate a neuronal correlate of visual working memory in higher association brain areas of a bird. Neurons in the NCL, a proposed avian analog of the PFC, significantly varied their firing rates in the delay period of delayed tasks according to a visual item stored in working memory. The activity of these neurons was related to the birds' performance in the task, suggesting their critical role in the temporary retention of visual information.
NCL neurons respond highly selectively to visual stimuli
We found that a large fraction (74%) of NCL neurons showed visually evoked responses during the sample phase with relatively long median visual latencies of 144 ms. Such long response latencies are typical for telencephalic association areas that receive highly processed information from secondary visual areas. NCL response latencies mirror visual response latencies in the range between 102 and 196 ms measured in primate PFC (Funahashi et al., 1990; Scalaidhe et al., 1999; Freedman et al., 2003; Nieder and Miller, 2004).
Many neurons (46%) responded selectively to one or several sample images. These sample-selective responses in the sample phase could be the first processing step for discriminating sample items and holding item-specific information through the delay period. The proportion of sample-selective neurons in the NCL is again reminiscent of findings in monkey PFC neurons during comparable tasks. In monkeys discriminating visual images during the DMS and paired association tasks, 34% (Warden and Miller, 2007), 42% (Rainer et al., 1999), and 44% (Rainer et al., 1998) sample-selective units were found. Moreover, the selectivity quality of NCL neurons and PFC neurons is quite comparable. Using the same selectivity index to quantify sample image selectivity, NCL neurons exhibited a value of 0.42 compared with 0.48 in monkey PFC (Rainer et al., 1998).
NCL neurons retain visual information across temporal gaps
A majority of crow NCL neurons exhibited sustained activity different from baseline activity during the delay period. Many corvid NCL neurons responded selectively for individual sample stimuli in the delay period of delayed tasks and thus actively maintained visual short-term information. Previous studies in pigeons provided suggestive evidence that sustained NCL activity encodes a possible correlate of working memory. Diekamp et al. (2002b) used a delayed go/no-go task and found that 21% of neurons in pigeon NCL exhibited activity different from baseline in the delay period. However, as acknowledged by the authors (Diekamp et al., 2002b), such neurons might have represented several sensory, cognitive, and motor components that the task design could not disentangle. For instance, the majority of the neurons responded only after the go cue that required a motor response and promised a reward but not after the no-go cue that did not require a motor response and also never resulted in a rewarded trial. Therefore, delay activity in this study might represent reward expectation and/or movement preparation rather than active encoding and retention of a sensory stimulus, all of which can be reflected in prefrontal delay activity (for review, see Miller and Cohen, 2001). Similarly, Rose and Colombo (2005) found 67% of neurons with sustained delay activity, the majority of which responded only for a to-be-remembered stimulus, but not after the pigeon was instructed to forget the stimulus. A series of elegant follow-up studies demonstrated that this activity was based mainly on reward prediction (Milmine et al., 2008a,b; Browning et al., 2010).
To disentangle possible contributions of different task components for sustained activity, the protocol used in our study balanced all relevant parameters and thus demonstrates a clear neuronal correlate of active short-term maintenance of visual information in the avian brain. Crucially, we found many NCL neurons that responded selectively for individual sample stimuli in the delay period of delayed tasks. Because performance for all samples was comparable, each sample image allowed the same possibility to earn reward. Any influence of reward expectation or value during the delay period was thus equal for the four sample images. Furthermore, each sample image required the same motor actions, and the location of the correct test image was balanced and could not be known during the delay period; activation based on sample-specific motor preparation was thus also excluded. Moreover, we experienced very similar neuronal responses in two different protocols (a DMS task and a rule-based variation of the DMS task) that contained the same visual encoding and visual retention periods but differed in the expected responses directly after the memory period. Any differences in neural activity for the four sample images during the delay period was thus related to item-specific visual working memory.
Our data from the crow NCL can be directly compared with PFC data in nonhuman primates, because similar task protocols and analyses of neuronal data have been used widely to investigate visual working memory in behaving monkeys. Compared with the 19% of sample-selective delay neurons we found in the crow NCL, slightly larger proportions of 28–43% delay-selective PFC neurons seem to be engaged in this task (Miller et al., 1996; Rainer et al., 1998, 1999; Warden and Miller, 2007). A selectivity strength index of 0.21 in NCL neurons in the delay period (corresponding to a 53% increase in firing rate to the preferred vs nonpreferred item) was weaker than the value of 0.44 reported by Rainer et al. (1998) but similar to the value of 0.19 reported by Miller et al. (1996) for monkey PFC.
We found more selective neurons than expected by chance that started discriminating between images in the sample period and showed the strongest responses to the same item also during the delay period. Almost half of the sample-selective and delay-selective neurons showed the highest firing rate for the same item during the sample and delay periods. This property would be expected for conventional mnemonic neurons that respond selectively to an item during stimulus presentation and then carry this preference across time in the delay period to be available for comparison when the choice stimuli appear (Fuster, 2001). However, recordings from monkey PFC also show that delay activity of such association neurons can be more complex than simple maintenance. For instance, delay activity can be subject to experience-dependent dynamics that causes differential responses during sample and delay periods (Rainer and Miller, 2002). Moreover, other task-relevant aspects, such as prospective memory (Rainer et al., 1999), could additionally be encoded by such association neurons. Neurons in higher-order association areas often have complex and diverse response properties that (even simultaneously) reflect distinct, often temporally confined, parameters and are said to have mixed selectivity to multiple aspects of a task (Rigotti et al., 2013). Because “mixed selectivity” seems to be a hallmark of the PFC, analogous neurons underscore the importance of the corvid NCL for avian cognition.
Encoding quality correlates with behavioral performance
Lesion studies in pigeons showed that NCL is causally involved in mastering delayed response tasks (Mogensen and Divac, 1993; Diekamp et al., 2002a). Our study confirms the behavioral relevance of NCL neurons and helps to specify the cognitive roles of NCL activity in a DMS task. When our crows chose the wrong item, the encoding of the sample by the population of selective neurons was weaker in the preceding delay period. The reduced selectivity was based on both a decrease in discharge rate to the preferred item and an increase to the least preferred item, which suggests that the observed effects do not reflect general cognitive factors differing in error trials. Rather, this activity difference points toward a breakdown of the code for the sample item, as has been shown in monkeys (Brody et al., 2003; Nieder, 2012). The decrease in discriminability from correct to error trials was particularly prominent in the delay period, suggesting that neuronal activity in the delay period is more closely correlated with the animals' behavior. Moreover, the effects were stronger in the delay period of the DMS task than in the delay 1 period of the rule-switching task. This was expected given that several error sources may accumulate in the rule-switching task, whereas forgetting the correct item (or encoding the wrong item) during the delay period is the prime source of errors in the DMS task. Thus, if a crow made an error during the rule-switching task, retention during the delay 1 period may still have been intact and stimulus-related encoding equally good for correct and error trials. In summary, the comparison of neural activity in error versus correct trials suggests that NCL neurons were involved in the maintenance of visual sample information during the delay and relevant to the birds' behavior on a trial-by-trial basis. Sustained activity of NCL neurons thus seems to provide a workspace to process relevant information across time and use it for goal-directed behavior.
Footnotes
This work was supported by a PhD stipend from the German National Academic Foundation (L.V.) and German Research Foundation Grant NI 618/3-1 (A.N.).
The authors declare no competing financial interests.
References
- Brody CD, Hernández A, Zainos A, Romo R. Timing and neural encoding of somatosensory parametric working memory in macaque prefrontal cortex. Cereb Cortex. 2003;13:1196–1207. doi: 10.1093/cercor/bhg100. [DOI] [PubMed] [Google Scholar]
- Browning R, Overmier JB, Colombo M. Delay activity in avian prefrontal cortex—sample code or reward code? Eur J Neurosci. 2011;33:726–735. doi: 10.1111/j.1460-9568.2010.07540.x. [DOI] [PubMed] [Google Scholar]
- Diekamp B, Gagliardo A, Güntürkün O. Nonspatial and subdivision-specific working memory deficits after selective lesions of the avian prefrontal cortex. J Neurosci. 2002a;22:9573–9580. doi: 10.1523/JNEUROSCI.22-21-09573.2002. [DOI] [PMC free article] [PubMed] [Google Scholar]
- Diekamp B, Kalt T, Güntürkün O. Working memory neurons in pigeons. J Neurosci. 2002b;22:RC210. doi: 10.1523/JNEUROSCI.22-04-j0002.2002. (1–5) [DOI] [PMC free article] [PubMed] [Google Scholar]
- Divac I, Mogensen J, Björklund A. The prefrontal “cortex” in the pigeon. Biochemical evidence. Brain Res. 1985;332:365–368. doi: 10.1016/0006-8993(85)90606-7. [DOI] [PubMed] [Google Scholar]
- Durstewitz D, Kröner S, Güntürkün O. The dopaminergic innervation of the avian telencephalon. Prog Neurobiol. 1999;59:161–195. doi: 10.1016/S0301-0082(98)00100-2. [DOI] [PubMed] [Google Scholar]
- Emery NJ, Clayton NS. The mentality of crows: convergent evolution of intelligence in corvids and apes. Science. 2004;306:1903–1907. doi: 10.1126/science.1098410. [DOI] [PubMed] [Google Scholar]
- Freedman DJ, Riesenhuber M, Poggio T, Miller EK. A comparison of primate prefrontal and inferior temporal cortices during visual categorization. J Neurosci. 2003;23:5235–5246. doi: 10.1523/JNEUROSCI.23-12-05235.2003. [DOI] [PMC free article] [PubMed] [Google Scholar]
- Funahashi S, Bruce CJ, Goldman-Rakic PS. Visuospatial coding in primate prefrontal neurons revealed by oculomotor paradigms. J Neurophysiol. 1990;63:814–831. doi: 10.1152/jn.1990.63.4.814. [DOI] [PubMed] [Google Scholar]
- Fuster JM. The prefrontal cortex—an update: time is of the essence. Neuron. 2001;30:319–333. doi: 10.1016/S0896-6273(01)00285-9. [DOI] [PubMed] [Google Scholar]
- Fuster JM. The prefrontal cortex. Ed 4. San Diego: Academic; 2008. [Google Scholar]
- Fuster JM, Alexander GE. Neuron activity related to short-term memory. Science. 1971;173:652–654. doi: 10.1126/science.173.3997.652. [DOI] [PubMed] [Google Scholar]
- Goldman-Rakic PS. Cellular basis of working memory. Neuron. 1995;14:477–485. doi: 10.1016/0896-6273(95)90304-6. [DOI] [PubMed] [Google Scholar]
- Green DM, Swets JA. Signal detection theory and psychophysics. New York: Wiley; 1966. [Google Scholar]
- Güntürkün O. The avian “prefrontal cortex” and cognition. Curr Opin Neurobiol. 2005;15:686–693. doi: 10.1016/j.conb.2005.10.003. [DOI] [PubMed] [Google Scholar]
- Hartmann B, Güntürkün O. Selective deficits in reversal learning after neostriatum caudolaterale lesions in pigeons: possible behavioral equivalencies to the mammalian prefrontal system. Behav Brain Res. 1998;96:125–133. doi: 10.1016/S0166-4328(98)00006-0. [DOI] [PubMed] [Google Scholar]
- Hoffmann A, Rüttler V, Nieder A. Ontogeny of object permanence and object tracking in the carrion crow, Corvus corone. Anim Behav. 2011;82:359–367. doi: 10.1016/j.anbehav.2011.05.012. [DOI] [Google Scholar]
- Karten HJ, Hodos W. A stereotaxic atlas of the brain of the pigeon (Columba livia) Baltimore: Johns Hopkins UP; 1967. [Google Scholar]
- Miller EK, Cohen JD. An integrative theory of prefrontal cortex function. Annu Rev Neurosci. 2001;24:167–202. doi: 10.1146/annurev.neuro.24.1.167. [DOI] [PubMed] [Google Scholar]
- Miller EK, Erickson CA, Desimone R. Neural mechanisms of visual working memory in prefrontal cortex of the macaque. J Neurosci. 1996;16:5154–5167. doi: 10.1523/JNEUROSCI.16-16-05154.1996. [DOI] [PMC free article] [PubMed] [Google Scholar]
- Milmine M, Rose J, Colombo M. Sustained activation and executive control in the avian prefrontal cortex. Brain Res Bull. 2008a;76:317–323. doi: 10.1016/j.brainresbull.2008.02.009. [DOI] [PubMed] [Google Scholar]
- Milmine M, Watanabe A, Colombo M. Neural correlates of directed forgetting in the avian prefrontal cortex. Behav Neurosci. 2008b;122:199–209. doi: 10.1037/0735-7044.122.1.199. [DOI] [PubMed] [Google Scholar]
- Mogensen J, Divac I. Behavioural effects of ablation of the pigeon-equivalent of the mammalian prefrontal cortex. Behav Brain Res. 1993;55:101–107. doi: 10.1016/0166-4328(93)90012-F. [DOI] [PubMed] [Google Scholar]
- Nieder A. Supramodal numerosity selectivity of neurons in primate prefrontal and posterior parietal cortices. Proc Natl Acad Sci U S A. 2012;109:11860–11865. doi: 10.1073/pnas.1204580109. [DOI] [PMC free article] [PubMed] [Google Scholar]
- Nieder A, Miller EK. A parieto-frontal network for visual numerical information in the monkey. Proc Natl Acad Sci U S A. 2004;101:7457–7462. doi: 10.1073/pnas.0402239101. [DOI] [PMC free article] [PubMed] [Google Scholar]
- Rainer G, Miller EK. Timecourse of object-related neural activity in the primate prefrontal cortex during a short-term memory task. Eur J Neurosci. 2002;15:1244–1254. doi: 10.1046/j.1460-9568.2002.01958.x. [DOI] [PubMed] [Google Scholar]
- Rainer G, Asaad WF, Miller EK. Selective representation of relevant information by neurons in the primate prefrontal cortex. Nature. 1998;393:577–579. doi: 10.1038/31235. [DOI] [PubMed] [Google Scholar]
- Rainer G, Rao SC, Miller EK. Prospective coding for objects in primate prefrontal cortex. J Neurosci. 1999;19:5493–5505. doi: 10.1523/JNEUROSCI.19-13-05493.1999. [DOI] [PMC free article] [PubMed] [Google Scholar]
- Rigotti M, Barak O, Warden MR, Wang XJ, Daw ND, Miller EK, Fusi S. The importance of mixed selectivity in complex cognitive tasks. Nature. 2013;497:585–590. doi: 10.1038/nature12160. [DOI] [PMC free article] [PubMed] [Google Scholar]
- Rose J, Colombo M. Neural correlates of executive control in the avian brain. PLoS Biol. 2005;3:e190. doi: 10.1371/journal.pbio.0030190. [DOI] [PMC free article] [PubMed] [Google Scholar]
- Scalaidhe SP, Wilson FA, Goldman-Rakic PS. Face-selective neurons during passive viewing and working memory performance of rhesus monkeys: evidence for intrinsic specialization of neuronal coding. Cereb Cortex. 1999;9:459–475. doi: 10.1093/cercor/9.5.459. [DOI] [PubMed] [Google Scholar]
- Vallentin D, Nieder A. Representations of visual proportions in the primate posterior parietal and prefrontal cortices. Eur J Neurosci. 2010;32:1380–1387. doi: 10.1111/j.1460-9568.2010.07427.x. [DOI] [PubMed] [Google Scholar]
- Veit L, Nieder A. Abstract rule neurons in the endbrain support intelligent behaviour in corvid songbirds. Nat Commun. 2013;4:2878. doi: 10.1038/ncomms3878. [DOI] [PubMed] [Google Scholar]
- Warden MR, Miller EK. The representation of multiple objects in prefrontal neuronal delay activity. Cereb Cortex. 2007;17(Suppl 1):i41–i50. doi: 10.1093/cercor/bhm070. [DOI] [PubMed] [Google Scholar]