

Abstract
Visualization using the immediate early gene Arc revealed sparser and more robust odor representations in the anterior piriform cortex of adult rats when odor was associated with water reward over 2–3 d. Rewarded odor “mixtures” resulted in rats responding to either component odor similarly, and, correspondingly, the odor representations became more similar as indexed by increased overlap in piriform Arc-expressing (Arc+) pyramidal neurons. The increased overlap was consistent with the rats' generalization from component odors. Discriminating among highly similar odor mixtures for reward led to increased differentiation of the neural representations as indexed by a reduction in overlap for piriform Arc+ pyramidal neurons after training. Similar odor mixture discrimination also required more trials to criterion. The visible reduction in the overlap of odor representations indexes pattern separation. The Arc visualization of odor representations in the anterior piriform network suggests that odor objects are widely distributed representations and can be rapidly modified by reward training in adult rats. We suggest that dynamic changes such as those observed here in piriform odor encoding are at the heart of perceptual learning and reflect the continuing plastic nature of mature associative cortex as an outcome of successful problem solving.
Keywords: Arc, catFISH, olfactory coding, olfactory learning, pattern separation, piriform
Introduction
In the brain, the activity of ensembles of neurons represents features of the external world. However, how experience modifies neuronal activity patterns to influence our perceptions and memories remains elusive. The anterior piriform cortex (aPC) is a prototypical ensemble-encoding network in the mammalian brain. In the adult rodent aPC, spatially organized inputs from the olfactory bulb activate layer II/III pyramidal neurons throughout the cortex to create “odor objects” lacking spatial order (Wilson and Sullivan, 2011). Odor experience readily modifies pyramidal cell properties in the aPC (Chapuis and Wilson, 2012; Saar et al., 2012; Morrison et al., 2013). Hence, it provides us with a model system for studying plasticity processes in an associative cortex and, here, using immediate early gene activation techniques permits us to visualize experience-dependent remodeling of perceptual objects.
In the present experiments, we use cellular compartment analysis of temporal activity by fluorescence in situ hybridization (catFISH) to visualize activation of the immediate early gene Arc and directly assess ensemble encoding of odors in aPC. Our results provide images of ensemble pattern reorganizations in appetitive learning paradigms that support, or require, such changes in the odor objects for behavioral success. All odor discriminations required only a few days of training before Arc visualization. The reward-contingent changes in representations are not seen in animals given random odor and reward associations over the same time intervals.
Materials and Methods
Animals.
Sprague Dawley rats (8–10 weeks old) of both sexes (n = 54 total) were assigned randomly to groups. Rats were housed in polycarbonate cages (at least two same-sex rats per cage) on a 12 h light/dark cycle with food and water ad libitum except behavioral experiments. Rats were adapted to 1 h of water access daily for 4–5 d before behavioral training. During conditioning, rats were given 25 ml water daily. All procedures were approved by the Memorial University Institutional Animal Care Committee in compliance with the guidelines of the Canadian Council on Animal Care.
Odorants.
Odorants (Sigma-Aldrich) were diluted with mineral oil to specific concentrations. Concentrations were chosen as recommended for mice (Bodyak and Slotnick, 1999). Odorants (10 ml) were freshly prepared for each experiment. Odorants used were 2% by volume of peppermint, 1% of vanillin, 2% of peppermint plus vanillin (50:50 mixture), 2% of amyl acetate, 2% of 1-heptanol plus 1-octanol (a 53:47 mixture), and 2% 1-heptanol plus 1-octanol (a 55:45 mixture). The latter two odors were used previously by Doucette et al. (2007), whereas the other odors have all been used in early odor preference learning (Yuan et al., 2002; Mukherjee et al., 2014).
Behavioral apparatus.
All behavior training was conducted in a Knosys olfactometer. Discrimination training methods were as described previously (Slotnick and Restrepo, 2005). Polyvinyl carbonate bottles were used for each odor. The C-flex tubing used by the control pinch valves was changed for each new odor.
Olfactometer rule learning.
Initially, rats were trained in the IN-BEGIN program for 3 d. Odor sampling and water delivery were given through the same port. For the first 20–30 trials, snout insertion breaking the light beam activated water delivery, and 30 μl of water were delivered for each lick. Subsequently, odor delivery on the spout signaled availability of water. The separation between odor delivery and water availability increased from 0.05 to 1 s over trials. Positive odors (S+) were introduced for 2.5 s. The subject could respond by either licking a minimum of six times for water reward or rejecting the odor. A 5 s intertrial interval was used. Rats underwent 100 trials/d and rapidly acquired this behavior.
Odor discrimination training and testing.
Odor discrimination was conducted using the IN-D2 software and consisted of introducing a negative odor (S−) in addition to the S+. Intertrial intervals were fixed at 6 s, during which rats were unable to initiate trials. To initiate a trial, rats were required to leave the port for 1 s. If the response criterion was met, reward was given after S+ delivery or withheld after S−. After training blocks of 20 trials (10 S+ and 10 S− odors randomly delivered), rats refrained from licking in response to the S− odor. Rats in the random groups completed the same number of trials as the associative groups, but water was delivered randomly and they were not required to discriminate between the two odors.
Performance was evaluated in each block of 20 trials. The equation (n positive responses to S+ + n negative responses to S−)/20 × 100 was used to determine the percentage of correct responses. Rats reaching ≥85% correct responses over three blocks were considered successful learners (Belnoue et al., 2011). Two to 3 d were typically required to achieve this criterion.
Two untrained control groups were also examined. A group used only in Experiment 1 consisted of naive rats exposed to the peppermint and vanillin in the same manner as experimental rats before they were killed. In addition, a group of caged rats receiving daily water similar to that received by the trained rats and exposed to clean charcoal-filtered air for 1.5 h before being killed was used to estimate the background “noise” level of Arc expression. Arc-expressing (Arc+) cells in caged animals were very few (0.13 ± 0.03%, n = 5); therefore, the subtraction of the noise Arc level was omitted in our experimental calculations.
Brain collection and dissection.
Rats were killed 24 h after discrimination training. Individual rats were put in a covered plastic jar connected to the olfactometer air delivery channel. Rats were exposed to clean charcoal-filtered air for 1.5 h before odors were delivered via C-flex tubing from the olfactometer for a 5 min period. Two 5 min odor deliveries were interleaved by 20 min. Rats were quickly anesthetized by isoflurane and decapitated, and brains were rapidly removed (∼2 min) and flash frozen in 2-methylbutane immersed in ethanol/dry ice slurry. Brains were preserved in a −80°C freezer until cryosectioned for in situ hybridization.
Tissue processing.
Right hemispheres were used during tissue sectioning. Each block usually contained four to six hemisections to include all the behavioral groups from a particular experiment. OCT medium (Tissue-Tek) was used to mold brains together in the same block. Coronal tissue sections (20 μm) were collected every 200 μm on 2% 3-aminopropyltriethoxysilane-treated slides (Snowcoat; Leica) using a cryostat set at −20°C. Five to six slides (taken evenly through the rostral-to-caudal range of the aPC) were taken for fluorescent in situ hybridization and stored at −20°C.
Fluorescence in situ hybridization.
The fluorescent in situ hybridization method used was described previously (Guzowski and Worley, 2001). In short, digoxigenin-conjugated full-length Arc riboprobes were extracted using a commercial transcript kit (Ambion). The yield and integrity of the riboprobes were ensured by purifying on a mini quick-spin RNA column (Roche Diagnostics), and 2 μl of probe was subjected to gel electrophoresis analysis before use. Slides were removed from the freezer and thawed for 10–15 min at room temperature before fixing in 4% paraformaldehyde. After fixation, slides were bathed in acetic anhydride and then treated in a 1:1 methanol/acetone (−20°C) solution. Prehybridization buffer was applied to the slides, which were then incubated for 60 min in a humid chamber. Thereafter, slides were incubated overnight with 100 ng of Arc probe in a hybridization oven at 56°C. All solutions used for first-day in situ hybridization were made in DEPC (OmniPur)-treated water (0.1%). The next day, slides were washed in a series of SSC buffers, treated with RNase A at 37°C, submerged in 2% H2O2/SSC buffer solution, blocked with normal sheep serum, and incubated with anti-digoxigenin–horseradish peroxidase antibody (Roche Diagnostics) overnight at 4°C. The following day, slides were labeled with Cy3 (1:50) using a tyramide signal amplification labeling kit (PerkinElmer Life and Analytical Sciences). Subsequently, cell nuclei were counterstained with 4′-6-diamidino-2-phenylindole (DAPI; 1:2000; Sigma-Aldrich). Finally, sections were coated by applying Vectashield antifade medium (Vector Laboratories). Slides were coverslipped and sealed with clear nail polish.
Image acquisition.
Image stacks were collected using an Olympus Fluoview FV1000 confocal microscope as described previously (Guzowski and Worley, 2001). Briefly, images of pyramidal cell layers (II/III) were taken at 20× with photomultiplier tube assignments, confocal aperture size, and contrast remaining constant for each slide. Two standardized-sized areas (∼0.8 mm2 each; one in lateral and one in medial aPC) were scanned. Z-stacks (1.0 μm optical thickness) throughout the thickness (20 μm) of each section of lateral and medial aPC were acquired from three to four slides spread evenly over the rostral-to-caudal range. The average count of the lateral and medial regions was used for the final count.
Image analysis.
Offline image analysis was performed using NIH ImageJ software. The total numbers of DAPI cells were assessed using the NIH ImageJ automatic cell counting application. Foci, cytoplasmic, and double labeling of Arc were counted manually. Labeling of cells as foci, cytoplasmic, and double was achieved by checking multiple optical sections (20% mid-range of the Z-stack) that comprised each individual cell (Miyashita et al., 2009). Counting was performed by the same individual throughout the experiment to maintain consistency. In a subset of animals, a second individual blind to conditions performed counts for comparison after work with a standardized set for visual training. Observations were highly consistent across the two observers.
Statistics.
OriginPro 9.0 software was used to analyze all datasets. Data were reported as mean ± SEM. Two-sample, two-tailed Student's t tests were used for statistical comparisons. Differences between groups were considered significant when p values were <0.05.
Results
Arc mRNA appears first in the nucleus within 5 min of neuronal activity that engages its transcription. Twenty five minutes later, initial Arc mRNA has translocated to the cytoplasm and a second event can initiate new transcription of nuclear Arc (Guzowski et al., 2005). The in situ hybridization methodology permits comparison of two separate odor events.
Odor input specificity of Arc catFISH
We initially exposed naive rats to two 5 min episodes of odor, either peppermint followed 25 min later by vanillin or peppermint on both occasions (Fig. 1a1, top). Animals were killed immediately after the second episode and processed for Arc catFISH. Cells that expressed Arc in the cytoplasm only were active during the first odor episode (peppermint), whereas cells that expressed Arc only in the nuclei were active during the second odor episode, and cells expressing Arc in both nuclei and cytoplasm were activated by both odor episodes (Fig. 1a1, bottom). Comparing the overlap ratio (the proportion of cells with double staining relative to the total number of Arc+ cells) demonstrates that repeated peppermint exposure was associated with significantly greater overlap (25.68 ± 2.11%, n = 7) than peppermint/vanillin exposure (17.85 ± 2.84%, n = 7, t = 2.21, p = 0.047; Fig. 1a2). In any given exposure, the total number of cells that were Arc+ was ∼5% of the total neurons. This proportion is consistent with previous estimates of aPC representations of odor encoding (Poo and Isaacson, 2009; Stettler and Axel, 2009) and typical of the sparse encoding of cortical structures generally (Olshausen and Field, 2004).
Figure 1.
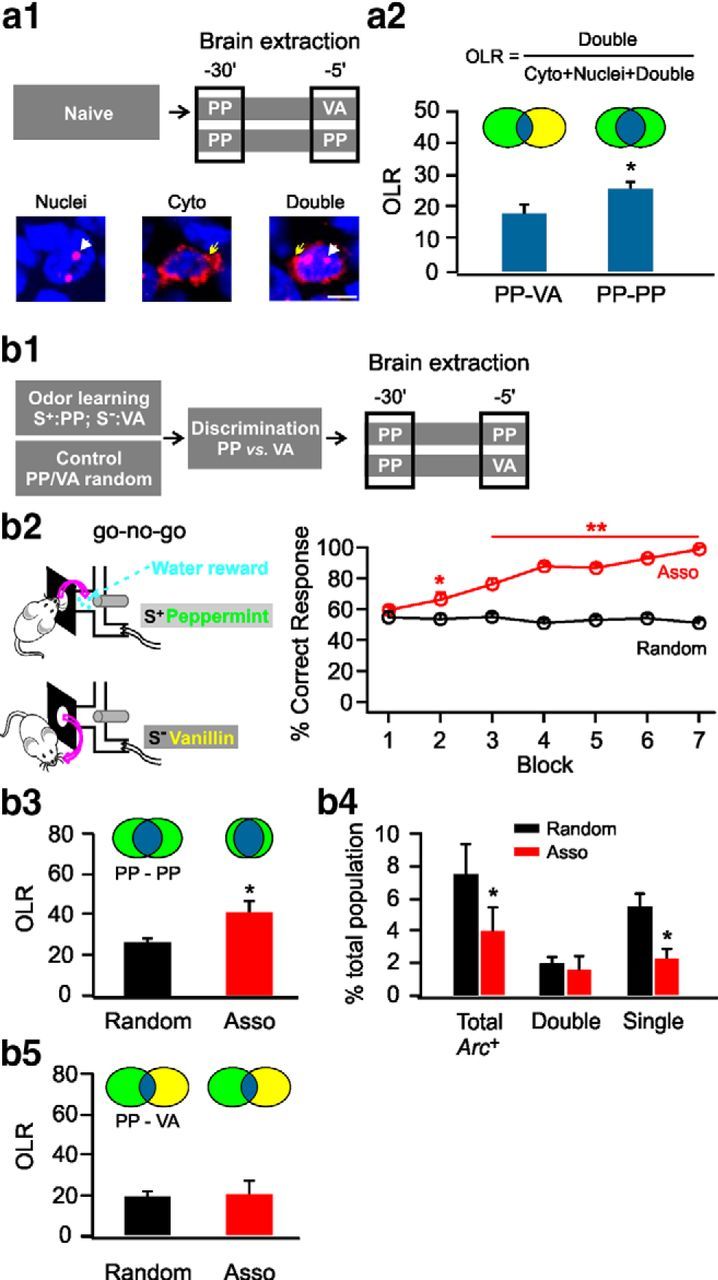
Contrast enhancement after odor associative learning. a1, Schematic of brain extraction protocol in naive rats (top) and example images for Arc+ cells (bottom). Blue indicates nuclei staining by DAPI. Red indicates Arc staining. White arrows indicate Arc staining in nuclei. Yellow arrows indicate Arc cytoplasm staining. Scale bar, 10 μm. a2, Overlap ratios (OLRs) of the cell ensembles of the two odor episodes. Cyto, cytoplasmic; PP, peppermint; VA, vanillin. b1, Schematic of odor associative training and brain extraction protocol. b2, Go–no-go behavioral paradigm (left) and percentage correct responses in the associative (Asso) group and the random group (right). b3, OLRs of the cell ensembles representing two peppermint episodes. b4, Percentage Arc+ cells over the number of total cells measured by DAPI staining. b5, OLRs of the cell ensembles representing two different odor episodes (peppermint and vanillin). *p < 0.05, **p < 0.01.
Sharpening of the odor map by positive associative training
To assess the representation of odor memories in aPC, we water deprived rats and trained them in a go–no-go discrimination task in which a positive odor stimulus (S+) was paired with water reward and a negative odor stimulus (S−) was unrewarded. Control rats received random rewards with exposure to either odor. A correct response was defined as licking only in the presence of the rewarded odor or not licking in the presence of the unrewarded odor.
In the first discrimination experiment, rats were trained with peppermint as S+ and vanillin as S− (Fig. 1b1). Rats quickly learned within the first three blocks (20 trials each; randomized 10 S+/10 S−) to lick at the water port only in the presence of peppermint (n = 10, t = 5.07, p = 8.01E−5 compared with the random group). Twenty-four hours after the seventh block when discrimination was nearly perfect (98 ± 1.53%, t = 18.67, p = 3.15E−13; Fig. 1b2), a subset of rats were given two episodes of peppermint exposure and killed for catFISH. The overlap ratio of cell ensembles in the S+ associative rats was significantly greater (41.01 ± 5.67%) than in the random group (25.58 ± 3.15%, n = 5, t = 2.38, p = 0.045; Fig. 1b3). The overlap ratio of the random rats was not different from naive rats (25.68 ± 2.11%, n = 7; Fig. 1a2), suggesting no effect of random pairings on initial ensembles. After associative learning, pyramidal cells are activated more reliably by peppermint odor and the same cell is likely to respond to both episodes of peppermint. The total Arc+ cells were fewer in the associative group (3.94 ± 0.56%, n = 5) relative to those in the random group (7.48 ± 1.08%, n = 5, t = 2.91, p = 0.020; Fig. 1b4). The reduction of total Arc+ cells was attributable to a reduction in the cells responding to only one episode (2.40 ± 0.56% in the associative group vs 5.52 ± 0.77% in the random group, n = 5, t = 3.29, p = 0.011), whereas the percentage of double-stained cells responding to both episodes of peppermint were similar in the two groups (1.54 ± 0.24% in the associative group vs 1.96 ± 0.44% in the random group, n = 5, t = 0.83, p = 0.431; Fig. 1b4). The reduction in single episode activated cells suggests that the S+ odor representation in the associative group had become sharper with a larger proportion of more reliably activated cells. However, when comparing peppermint and vanillin representations after training, there were no differences in ensemble overlap between discriminating (21.10 ± 5.94%) and random (20.10 ± 2.10%, n = 5, t = 0.159, p = 0.877) groups (Fig. 1b5). This suggests that the strengthened peppermint representation was related to the acquisition of discriminative behavior, but decorrelation between the two ensembles did not occur.
Peppermint odor was originally selected because it has been used widely in rat pup odor preference learning. Vanillin was chosen as being distinct from peppermint spatially in the olfactory bulb (http://gara.bio.uci.edu/). Consistent with the change in odor representations from spatial patterns in the olfactory bulb, to sparse random networks in the aPC (Wilson and Sullivan, 2011), there was no clustering of Arc+ neurons for either odor in the aPC.
Odor mixture associative training leads to merging of odor ensembles
In our second experiment, we examined Arc+ ensembles after training with a mixture of peppermint and vanillin combined as the S+, whereas amyl acetate served as the S− (Fig. 2a). After successful discriminative performance, rats were able to respond positively to single component peppermint (99 ± 1%, n = 5, t = 17.01, p = 1.45E−7 compared with control) or vanillin (95 ± 1.58%, n = 5, t = 12.68, p = 1.41E−6 compared with control; Fig. 2b1). Arc+ responses to peppermint and vanillin individually revealed that the overlap ratio between the two different component ensembles was significantly greater in the associative learning group (44.31 ± 4.78%) than the random group (23.81 ± 5.31%, n = 5, t = 2.87, p = 0.010; Fig. 2b2). This demonstrates that the aPC directly supports merging of the ensemble patterns when they have been rewarded as part of a mixture.
Figure 2.

Odor mixture associative learning merges neuronal ensembles of odor components. a, Schematic of odor mixture associative training and brain extraction protocol. b1, Go–no-go behavioral paradigm (left) and percentage correct responses in the associative (Asso) group and the random group (right). b2, Representative images of Arc+ cells in the aPC (left) and overlap ratios (OLRs) of the cell ensembles representing peppermint (PP) and vanillin (VA; right). Arrows indicate double-stained Arc+ cells. Scale bar, 20 μm. *p < 0.05, **p < 0.01.
Similar odor discrimination training leads to pattern separation
In our final experiment, we examined ensemble overlap ratios in rats required to perform challenging odor discrimination problem using two very similar odor mixtures (1-heptanol and 1-octanol; S+, 53%/47%; S−, 55%/45%; Fig. 3a). Chapuis and Wilson (2012) found that, with simple odor discrimination, decorrelation of ensembles was not observed in electrophysiological sampling, but with challenging discriminations, decorrelation occurred. Rats experienced difficulty in discriminating these odor mixtures and were unable to discriminate after eight blocks of training (Fig. 3b1), when rats in the easier discrimination task had performed nearly perfectly (Fig. 1b2). Continued training eventually led to successful discrimination in the associative group (98 ± 1.22% vs random group: 43 ± 2% at the 16th block, n = 5, t = 23.45, p = 1.16E−8; Fig. 3b1). A significant decrease in the Arc+ overlap between these odor pairs occurred in the associatively trained group (12.54 ± 1.01%, n = 5) relative to the random condition (23.95 ± 0.82%, n = 5, t = 8.75, p = 2.28E−5; Fig. 3b2). Easy and difficult discriminations both induce remodeling of naive ensemble representations, but only the difficult discrimination leads to the reduced overlap of ensemble activity characteristic of pattern separation and likely necessary for its successful behavioral solution.
Figure 3.

Similar odor discrimination learning promotes pattern separation. a, Schematic of similar odor discrimination training and brain extraction protocol. b1, Go–no-go behavioral paradigm (left) and percentage correct responses in the associative (Asso) group and the random group (right). b2, Representative images of Arc+ cells in the aPC (left) and overlap ratios (OLRs) of the cell ensembles representing S+ (1-heptanol plus 1-octanol, 53%/47% mixture) and S− (1-heptanol plus 1-octanol, 55%/45% mixture; right). Arrows indicate double-stained Arc+ cells. hept+Octa, 1-heptanol plus 1-octanol; Scale bar, 20 μm. **p < 0.01.
Unexpectedly, the difficult and easy odor discriminations demonstrated a similar degree of ensemble overlap among rats receiving random odor plus reward (easy odor pair in Fig. 1b5: 20.10 ± 2.10% vs difficult odor pair in Fig. 3b2: 23.95 ± 0.82%, n = 5, t = 1.71, p = 0.125), suggesting that the degree of initial overlap of Arc+ cell ensembles does not predict behavioral discrimination ability.
Discussion
Wilson and Sullivan (2011) have proposed that the aPC generates odor objects. Direct visualization of those objects here as indexed by neuronal transcription of the immediate early gene Arc is consistent with the sparse ensemble characteristics seen previously in the aPC (Poo and Isaacson, 2009; Stettler and Axel, 2009). Here, in the adult rat, such representations appear rapidly modifiable (within the few days required for successful behavior). We have visualized three forms of aPC representational plasticity: (1) an increase in consistent ensemble participation together with a reduction in ensemble size for an S+; (2) an increase in ensemble overlap for components when odor mixtures signal reward; and (3) a decrease in ensemble overlap when a discrimination among highly similar odor mixtures is required, the mechanistic definition of pattern separation. These outcomes are supported by observations from electrophysiological population sampling (Chapuis and Wilson, 2012). Chapuis and Wilson demonstrated that cell response profiles were decorrelated for a series of odors in anesthetized rats after training in challenging odor discriminations. Decorrelation was not seen with simple discriminations, consistent with the present observations. After training with odors signaling similar outcomes, the correlations among cell response profiles increased, similar to the increased overlap seen here in Experiment 2. The data are consistent with Chapuis and Wilson's proposal that pattern completion and pattern separation both occur in the aPC.
However, the present experiment did not directly assess pattern completion. Although it is possible to suggest that training on peppermint plus vanillin and then successfully solving the go–no-go task to either peppermint or vanillin alone is pattern completion, it is more parsimonious to suggest that this is an example of each component changing to be more similar to the mixture (Linster and Smith, 1997). It is clear that there is increased overlap when both components are associated simultaneously with reward. Similarly, there is decreased overlap when components are differentially associated with reward and no reward. These results contrast with the recent report in Drosophila in which ensemble odor representation in the mushroom bodies predict behavioral discrimination performance but are not altered by discrimination training (Campbell et al., 2013). In the present study, the representation of peppermint did not differ in naive rats from those given random odor and reward experience, but with systematically paired odor and reward, peppermint representations were invariably modified.
A feature not predicted from the Chapuis and Wilson experiments was the finding of a smaller but more reliable representation of the S+ after reward pairing. Electrophysiological testing does not permit the documentation of spatial sharpening for rewarded stimuli revealed by Arc. Previous work with c-Fos supports this characterization because animals well trained in odor discriminations have smaller aPC c-Fos representations (Roullet et al., 2005). However, only Arc methodology permits the assessment of the increased reliability of the representation because it allows a given odor to be compared with itself. The present study does not address changes that may occur when an odor is systemically unrewarded. There was a trend in the data for such odors to have larger representations, but this did not reach significance and will require additional experimentation. It would also be of interest to know whether punishment and nonreward differ in their impact on aPC ensembles.
There are a number of possible mechanisms to support the changes observed here. Increases in the strength of connections through LTP-like changes with concomitant increases in lateral inhibition (Brosh and Barkai, 2009; Saar et al., 2012) or even LTD-like changes of weak cells could account for the increased reliability of cell participation, as well as the smaller ensembles, characteristic of associative representations (Gdalyahu et al., 2012). Changes in overlap of two odor representations could also relate to Hebbian mechanisms supporting reward-congruent and -incongruent activation patterns. In rat pups, we have shown both LTP and norepinephrine-mediated enhancement of connectivity in aPC (Morrison et al., 2013), but whether a norepinephrine effect occurs in the present paradigm is unknown.
The present data demonstrate the ability of sparse random cortical networks in the adult mammalian brain to be rapidly tuned by consequential environmental feedback to optimize perceptual representations. We suggest that the suite of changes seen here in ensemble representations with discrimination training contribute to the neuronal substrate of perceptual expertise.
Footnotes
This work was supported by Canadian Institutes of Health Research Operating Grant MOP-102624 (Q.Y.) and Natural Sciences and Engineering Research Council of Canada Discovery Grant 418451-2013 (Q.Y.). We thank Dr. Diano Marrone at Wilfrid Laurier University for providing us with Arc plasmid and technical support. Drs. Qinlong Hou and Jules Dore assisted us in the initial establishment of Arc catFISH used in this study.
The authors declare no competing financial interests.
References
- Belnoue L, Grosjean N, Abrous DN, Koehl M. A critical time window for the recruitment of bulbar newborn neurons by olfactory discrimination learning. J Neurosci. 2011;31:1010–1016. doi: 10.1523/JNEUROSCI.3941-10.2011. [DOI] [PMC free article] [PubMed] [Google Scholar]
- Bodyak N, Slotnick B. Performance of mice in an automated olfactometer: odor detection, discrimination and odor memory. Chem Senses. 1999;24:637–645. doi: 10.1093/chemse/24.6.637. [DOI] [PubMed] [Google Scholar]
- Brosh I, Barkai E. Learning-induced enhancement of feedback inhibitory synaptic transmission. Learn Mem. 2009;16:413–416. doi: 10.1101/lm.1430809. [DOI] [PubMed] [Google Scholar]
- Campbell RA, Honegger KS, Qin H, Li W, Demir E, Turner GC. Imaging a population code for odor identity in the Drosophila mushroom body. J Neurosci. 2013;33:10568–10581. doi: 10.1523/JNEUROSCI.0682-12.2013. [DOI] [PMC free article] [PubMed] [Google Scholar]
- Chapuis J, Wilson DA. Bidirectional plasticity of cortical pattern recognition and behavioral sensory acuity. Nat Neurosci. 2012;15:155–161. doi: 10.1038/nn.2966. [DOI] [PMC free article] [PubMed] [Google Scholar]
- Doucette W, Milder J, Restrepo D. Adrenergic modulation of olfactory bulb circuitry affects odor discrimination. Learn Mem. 2007;14:539–547. doi: 10.1101/lm.606407. [DOI] [PMC free article] [PubMed] [Google Scholar]
- Gdalyahu A, Tring E, Polack PO, Gruver R, Golshani P, Fanselow MS, Silva AJ, Trachtenberg JT. Associative fear learning enhances sparse network coding in primary sensory cortex. Neuron. 2012;75:121–132. doi: 10.1016/j.neuron.2012.04.035. [DOI] [PMC free article] [PubMed] [Google Scholar]
- Guzowski JF, Worley PF. Cellular compartment analysis of temporal activity by fluorescence in situ hybridization (catFISH) Curr Protoc Neurosci Chapter. 2001;1 doi: 10.1002/0471142301.ns0108s15. Unit 1.8. [DOI] [PubMed] [Google Scholar]
- Guzowski JF, Timlin JA, Roysam B, McNaughton BL, Worley PF, Barnes CA. Mapping behaviorally relevant neural circuits with immediate-early gene expression. Curr Opin Neurobiol. 2005;15:599–606. doi: 10.1016/j.conb.2005.08.018. [DOI] [PubMed] [Google Scholar]
- Linster C, Smith BH. A computational model of the response of honey bee antennal lobe circuitry to odor mixtures: overshadowing, blocking and unblocking can arise from lateral inhibition. Behav Brain Res. 1997;87:1–14. doi: 10.1016/S0166-4328(96)02271-1. [DOI] [PubMed] [Google Scholar]
- Miyashita T, Kubik S, Haghighi N, Steward O, Guzowski JF. Rapid activation of plasticity-associated gene transcription in hippocampal neurons provides a mechanism for encoding of one-trial experience. J Neurosci. 2009;29:898–906. doi: 10.1523/JNEUROSCI.4588-08.2009. [DOI] [PMC free article] [PubMed] [Google Scholar]
- Morrison GL, Fontaine CJ, Harley CW, Yuan Q. A role for the anterior piriform cortex in early odor preference learning: evidence for multiple olfactory learning structures in the rat pup. J Neurophysiol. 2013;110:141–152. doi: 10.1152/jn.00072.2013. [DOI] [PMC free article] [PubMed] [Google Scholar]
- Mukherjee B, Morrison GL, Fontaine CJ, Hou Q, Harley CW, Yuan Q. Unlearning: NMDA receptor-mediated metaplasticity in the anterior piriform cortex following early odor preference training in rats. J Neurosci. 2014;34:5143–5151. doi: 10.1523/JNEUROSCI.0128-14.2014. [DOI] [PMC free article] [PubMed] [Google Scholar]
- Olshausen BA, Field DJ. Sparse coding of sensory inputs. Curr Opin Neurobiol. 2004;14:481–487. doi: 10.1016/j.conb.2004.07.007. [DOI] [PubMed] [Google Scholar]
- Poo C, Isaacson JS. Odor representations in olfactory cortex: “sparse” coding, global inhibition, and oscillations. Neuron. 2009;62:850–861. doi: 10.1016/j.neuron.2009.05.022. [DOI] [PMC free article] [PubMed] [Google Scholar]
- Roullet F, Liénard F, Datiche F, Cattarelli M. Fos protein expression in olfactory-related brain areas after learning and after reactivation of a slowly acquired olfactory discrimination task in the rat. Learn Mem. 2005;12:307–317. doi: 10.1101/lm.89605. [DOI] [PMC free article] [PubMed] [Google Scholar]
- Saar D, Reuveni I, Barkai E. Mechanisms underlying rule learning-induced enhancement of excitatory and inhibitory synaptic transmission. J Neurophysiol. 2012;107:1222–1229. doi: 10.1152/jn.00356.2011. [DOI] [PubMed] [Google Scholar]
- Slotnick B, Restrepo D. Olfactometry with mice. Curr Protoc Neurosci Chapter. 2005;8 doi: 10.1002/0471142301.ns0820s33. Unit 8.20. [DOI] [PubMed] [Google Scholar]
- Stettler DD, Axel R. Representations of odor in the piriform cortex. Neuron. 2009;63:854–864. doi: 10.1016/j.neuron.2009.09.005. [DOI] [PubMed] [Google Scholar]
- Wilson DA, Sullivan RM. Cortical processing of odor objects. Neuron. 2011;72:506–519. doi: 10.1016/j.neuron.2011.10.027. [DOI] [PMC free article] [PubMed] [Google Scholar]
- Yuan Q, Harley CW, McLean JH, Knöpfel T. Optical imaging of odor preference memory in the rat olfactory bulb. J Neurophysiol. 2002;87:3156–3159. doi: 10.1152/jn.00917.2001. [DOI] [PubMed] [Google Scholar]