

Abstract
The corticostriatal axis is the main input stage of the basal ganglia and is crucial for their role in motor behavior. Synchronized oscillations might mediate interactions between cortex and striatum during behavior, yet direct evidence remains sparse. Here, we show that, during motor behavior, low- and high-frequency oscillations jointly couple cortex and striatum via cross-frequency interactions. We investigated neuronal oscillations along the corticostriatal axis in rats during rest and treadmill running. We found prominent theta and gamma oscillations in cortex and striatum, the peak frequencies of which scaled with motor demand. Theta and gamma oscillations were functionally coupled through phase-amplitude coupling. Furthermore, theta oscillations were phase coupled between structures. Together, local phase-amplitude coupling and corticostriatal theta phase coupling mediated the temporal correlation of gamma bursts between the cortex and striatum. The coordination of fast oscillations through coherent phase-amplitude coupling may be a general mechanism to regulate neuronal interactions along the corticostriatal axis and beyond.
Keywords: amplitude correlation, corticostriatal axis, motor behavior, oscillations, phase-amplitude coupling, phase coherence
Introduction
The striatum is the main input structure of the basal ganglia (Alexander et al., 1986; Parent and Hazrati, 1995) and is thought to be involved in reinforcement learning and procedural memory (Bar-Gad et al., 2003; Schultz et al., 2003; Graybiel, 2005; Yin and Knowlton, 2006). Furthermore, the striatum also has an important role in motor behavior. It receives massive projections from sensorimotor cortex (Webster, 1961; Flaherty and Graybiel, 1995) and is the main site of dopamine depletion after degeneration of neurons in the substantia nigra, which leads to Parkinson's disease (Albin et al., 1989). One of the cardinal symptoms of this disorder is bradykinesia or akinesia (i.e., slowing or cessation of movements). Therefore, intact corticostriatal information processing is essential for intact motor functioning (Graybiel et al., 1994; Turner and Desmurget, 2010). However, it is not clear how neuronal activity along the corticostriatal axis is functionally coordinated during motor behavior.
Synchronized oscillations have been proposed as an effective means of communication between brain structures (Varela et al., 2001; Siegel et al., 2012), including the basal ganglia (Boraud et al., 2005). In support of this notion, several studies have reported neuronal oscillations in the striatum (Courtemanche et al., 2003; Berke et al., 2004; Masimore et al., 2005; DeCoteau et al., 2007a) and their synchronization with cortical oscillations (Costa et al., 2006; Dejean et al., 2007; Sharott et al., 2009; Dzirasa et al., 2010; Koralek et al., 2013). However, striatal oscillations have so far mainly been studied in cognitive tasks and in response to rewarding events (DeCoteau et al., 2007b; Tort et al., 2008; Berke, 2009; van der Meer and Redish, 2009; Kalenscher et al., 2010; Leventhal et al., 2012). Therefore, little is known about the role of oscillations in mediating motor processes along the corticostriatal axis. Furthermore, it remains unclear how oscillations in different frequency ranges may interact during motor behavior.
Inspired by work on the hippocampal–striatal axis (Tort et al., 2008), we hypothesized that interactions between oscillations at different frequencies may be key to coordinate processing between the cortex and striatum. In particular, we hypothesized that coherent slow oscillations between structures may coordinate fast local oscillations through cross-frequency phase-amplitude coupling. To test this, we investigated neuronal oscillations along the sensorimotor corticostriatal axis of rats performing a nonrewarded treadmill task. This allowed us to study corticostriatal interactions during pure motor behavior.
Materials and Methods
Subjects
Experiments were performed in five male brown Norway rats (Rattus norvegicus; Charles River Laboratories). All procedures were approved by the ethics committee of the Hamburg State Department for Health and Consumer Protection, Division for Food Security and Veterinary Affairs (permission no. 62/03) and performed according to national laws and guidelines for animal protection and experimentation. Rats were housed in groups of 2–4 animals in standard cages under a 12 h light/dark cycle. Water and food were available ad libitum and weights were monitored regularly.
Behavioral task
Rats were trained to run on a motor-driven treadmill (TSE Systems) placed in a dark, sound-attenuating chamber. We observed running behavior with an infrared camera connected to a monitor outside the chamber. Performance was quantified by registering breaks of infrared light beams attached to the back end of the running lanes. If animals stopped to run, they would be carried to the back by the moving belt and break the beam. Beam breaks could be elicited once every 5 s at maximum. Limits of subsequent 5 s epochs were marked by TTL pulses sent by the treadmill control software. We used these epochs for all basic steps of data analysis.
During recordings, each trial of the task consisted of 1 × 60 s rest and 4 × 60 s running at 4 different speeds. There was a start period between rest and running during which speed quickly increased; this period was not included in analyses. Speeds always increased abruptly by 4 cm/s. Different animals performed in partly overlapping speed ranges, resulting in a total number of six linearly separated speeds between 16 and 36 cm/s.
Implantations
After initial training in the task, we implanted rats with microdrives carrying 12 individually moveable tungsten electrodes (diameter: 75 μm; impedance: 0.8–1.2 MΩ; FHC). Operations were performed under general anesthesia. Rats received an initial intraperitoneal dose of ketamine (75 mg/kg; Ketamin Gräub, Dr. E. Gräub AG, Bern, Switzerland) and xylazinhydrochloride (6 mg/kg bodyweight; Rompun; Bayer). Anesthesia was maintained through ventilation with isoflurane (Isofluran; Baxter Deutschland) and a mixture of N2O/O2 (70/30%).
We placed three electrodes in sensorimotor cortex and striatum of each hemisphere. All target locations were determined using the rat brain atlas of Paxinos and Watson (2005). Cortical electrodes targeted locations between +2.8 to −2.5 mm in anterior–posterior (AP) and 1.9–3.0 mm in medial—lateral (ML) directions with reference to bregma. Striatal electrodes targeted dorsolateral (i.e., sensorimotor) regions of the striatum between +1.6 and 0 mm AP and between 2.7 and 4.0 ML. Intracranial signals were referenced against screws placed over frontal and posterior regions of the skull. We varied dorsal–ventral positions of electrodes each day before recordings. Across recordings, the mean distance between electrodes within areas of the same hemisphere was 1.07 mm for cortical electrodes (min/max: 0.52/1.65 mm) and 0.88 mm for striatal electrodes (min/max: 0.18/1.75 mm). The mean distance between cortical and striatal electrodes was 3.26 mm within the same hemisphere (min/max: 2.16/4.24 mm) and 6.67 mm across hemispheres (min/max: 6.04/7.82 mm).
Recordings
Recordings were started after a minimum recovery time of 1 week after surgery. We recorded local field potentials (LFPs) with a Cheetah 32 system (Neuralynx) from animals during rest and running on the treadmill. LFP signals were amplified, sampled at 3787 Hz, and filtered between 1 and 475 Hz.
Data analysis
Preprocessing.
All data analyses were performed in MATLAB (The MathWorks). First, LFPs were down sampled to 1000 Hz sampling frequency. Second, the LFPs were digitally filtered at 256 Hz (low-pass) and at integer multiples of 50 Hz (band-stop) to remove line noise components. We applied fourth-order Butterworth filters in forward and reverse directions in all filtering procedures to avoid phase distortions of signals. Filtered LFPs were cut into nonoverlapping 5 s epochs using triggers sent by the treadmill control software. All basic analysis steps were performed on these epochs.
We evaluated the quality of LFP signals using three methods. First, individual trials of raw LFPs were visually inspected before filtering and channels containing obvious artifacts were marked as invalid. Second, the noise threshold of each epoch's signal (Quiroga et al., 2004) was determined and epochs were marked as invalid that contained amplitude values higher than seven times the threshold. Third, signal stability was evaluated by applying Levene's test for equal variances to root mean square values of 500 ms data segments (Moran et al., 2008). We marked epochs as invalid when the null hypothesis of equal variances could be rejected at an α-level of 0.01.
Time-frequency transformations.
Time-frequency transformations (TFR) of single-epoch data were obtained by convolution of signal x with complex wavelet kernels w as follows:
 |
where t and f denote time and frequency, respectively, and ⊗ is the convolution operation. We used Morlet wavelets w (Tallon-Baudry and Bertrand, 1999) as given by the following equation:
 |
where σt is the SD of the signal in the time domain and A is a normalization factor ensuring conservation of energy. Morlet wavelets are Gaussian shaped in the time and frequency domain, with their SDs related by σt = . The SD in the frequency domain at frequency f is given by σf = f/q, where q is the width of the wavelet. We used constant spectral widths q of 6 or 12 and temporal widths l = 3σt in the present study.
Wavelet transformations of signals were computed in steps of 1 ms at frequencies between 2 and 128 Hz, logarithmically scaled in steps of 21/32. Because of broad temporal widths of wavelets at low frequencies, we restricted all subsequent spectral analyses to the center 2 s of each 5 s epoch.
Power and phase-coupling analyses.
We computed the frequency-dependent power powx(f) of signal x(t) as the temporal mean of the squared norm of its time-frequency transformation TFRx(t,f) as follows:
 |
where <…> is the averaging operation. Before final statistical analyses, we multiplied power at each frequency with squared frequency to account for the 1/f2 decay of spectral power (Miller et al., 2009; Siegel et al., 2009). We quantified the change in power between rest and running as a z-score by subtracting the average rest power across electrodes from running power of each electrode and normalizing these differences by the SD of rest power across electrodes.
We computed complex, time- and frequency-dependent cross-spectral vectors crsxy(t, f) of two signals, x(t) and y(t) by taking the product of their conjugated TFRs as follows:
 |
where * denotes the complex conjugate. We computed frequency-dependent phase-locking values plv(f) as the norm of the temporal mean of the complex argument of crsxy(t, f) as follows:
 |
We obtained frequency-dependent, complex coherency vectors cohxy(f) as the temporal mean of crsxy(t, f) normalized by the square root of the power of signals x(t) and y(t) as follows:
 |
Imaginary coherence values, icohxy(f), were derived as the imaginary part of cohxy(f).
Phase-amplitude coupling.
We first quantified cross-frequency coupling between phase and amplitude values of low- and high-frequency components as described in (Canolty et al., 2006). Here, the magnitude, M(f), and phase, ϕ(f), of phase-amplitude coupling across time at frequency f are given as the norm and argument, respectively, of the temporal correlation of phase components θx(t, f) of signal x(t) and amplitude components Ay(t, f) of signal y(t) as follows:
 |
and
 |
Phase components θx(t, f) and amplitude components Ay(t, f) are obtained as the argument and norm, respectively, of time-frequency transforms TFRx(t, f) and TFRy(t, f). For cross-frequency analyses, we focused on the frequency ranges that showed the most prominent and consistent oscillatory components across animals and structures. Therefore, we computed phase-amplitude coupling matrices for all pairs of phase frequencies, f1, between 2 and 11.3 Hz and amplitude frequencies, f2, between 22.6 and 128 Hz in steps of 21/32 Hz. To account for differences in signal amplitude, we normalized raw TFR values at each frequency by their time-average amplitude before coupling analyses. We computed phase-amplitude coupling matrices for each data epoch and averaged complex values of each pair across epochs and trials. Magnitudes and phases from individual pairs were smoothed with a 2D Hanning window with a full-width-half-maximum size of 21/8 octaves before final averaging. Final statistics were computed by pooling across pairs.
As control analysis, we determined phase-amplitude coupling by computing a phase-modulation index based on mutual information as described in Hurtado et al. (2004) and discussed in Tort et al. (2010). In brief, for each pair of signals, x(t) and y(t), and each pair of phase frequencies, f1, and amplitude frequencies, f2, we extracted phase time series θx, f1(t) and amplitude time series Ay, f2(t) from corresponding time-frequency transforms. We sorted amplitudes Ay, f2(t) according to their corresponding phases θx, f1(t) into bins b of 2π/18 radians width each (from −π to +π) and calculated the average (<>) across amplitudes Ay, f2, f1(b) in each phase bin. We normalized amplitudes in individual phase bins by the sum of amplitudes in all bins N according to the following equation:
 |
We then computed the entropy measure, H, as
 |
and obtained the modulation index
 |
where Hmax = log(N). Statistics were obtained and smoothing was accomplished in the same way as for the vector norm approach.
Power correlations
We computed temporal correlations, r(f), between power time courses, powx(t,f), and powy(t,f), of signals x(t) and y(t) at frequencies f as follows:
 |
where N is the number of data points and σx(f) and σy(f) are the temporal SDs of power time courses, powx(t, f) and powy(t, f), respectively. Power values were log-transformed before correlation analyses. To approximate normal distributions of data values, correlation coefficients r were Fisher z-transformed before statistical analyses.
To account for artificially high correlations between signals due to volume conduction effects, we computed same-frequency power correlations between orthogonal signals (Hipp et al., 2012). In brief, we orthogonalized signals x(t) and y(t) in the frequency domain via their time-frequency transforms, TFRx(t, f) and TFRy(t, f), according to the following equation:
 |
where Y⊥X(t, f) is the time-frequency transform of signal y(t) orthogonalized to the time-frequency transform of signal x(t). We orthogonalized all signals in both directions and took the average of power correlations before statistical analyses.
Phase coupling/phase-amplitude coupling to amplitude correlation relationship.
We investigated the temporal relationship between low-frequency (2–11.3 Hz) phase coupling and high-frequency (22.6–128 Hz) amplitude correlation by computing Pearson's linear correlation coefficients across single epochs of all corticostriatal electrode pairs. Similarly, to investigate the relationship between local phase-amplitude coupling and corticostriatal amplitude correlation, we computed correlation coefficients between phase-amplitude coupling at cortical and striatal electrodes and amplitude correlation between electrodes of a given pair, again for all corticostriatal electrode pairs at phase frequencies of 2–11.3 Hz, amplitude frequencies of 22.6–128 Hz, and amplitude correlation frequencies of 32–128 Hz. Phase-locking and amplitude correlation values of each epoch were Fisher z-transformed before the correlation analysis. Furthermore, phase-locking, phase-amplitude coupling, and amplitude correlation values were z-scored for each electrode pair to rule out that a potential correlation across epochs could be driven by the variance across electrode pairs. Statistics were obtained as the p-values of the correlation at each frequency pair and subjected to cluster-based permutation tests. We smoothed the final correlation matrices in the same way as phase-amplitude coupling estimates.
Peak-frequency analyses.
We computed power, phase coupling, and same-frequency power correlation spectra of low-frequency (2–16 Hz) and high-frequency (32–128 Hz) ranges at a finer resolution using wavelet widths q of 12 instead of 6. We linearly interpolated spectra to a frequency resolution of 21/512 between octaves using cubic splines. Peak frequencies were determined with a maximum operation.
We chose the spectral ranges for peak-frequency analyses by visual inspection of power and phase-coupling spectra. Limits were 5.7 (22.5) and 11.31 (23.5) Hz for the low-frequency range and 45.3 (25.5) and 90.51 (26.5) Hz for the high-frequency range, thus spanning one octave centered on 8 and 64 Hz, respectively.
We used across-trial averages of individual electrodes or electrode pairs for comparison of resting and average running peaks in agreement with statistics for basic spectral analyses. For speed-based peak-frequency analyses, peak frequencies were determined at each speed of each trial. We computed linear regression coefficients using running speed as predictor on peak frequencies from all trials that exhibited an increase of peak frequency between rest and average running activity.
Animals performed at overlapping, but not identical, speed ranges. In addition, behavioral and signal quality evaluation could result in different numbers of trials per animal contributing to the data pools at each speed. To determine whether increases of peak frequencies may be confounded by unequal trial numbers per animal, peak frequencies were compared at speeds 3 (24 cm/s) and 4 (28 cm/s) that all animals had to perform taking into account only trials with valid data from both speeds. All significant results of peak frequency changes passed this test.
Statistics.
For all parameters, we obtained single-trial estimates by taking the median across all epochs with the same running speed of each trial (three epochs minimum). For statistical tests, we either used single-trial estimates or averages across single-trial estimates. In the latter case, a minimum of three trials per average was required. In general, only trials were considered that included both valid rest and running data. All results are given as mean ± SEM unless stated otherwise.
We tested the statistical significance of all spectral measures (imaginary coherence, power correlation, phase-amplitude coupling) through comparison of estimates obtained from pairs of raw TFRs with those obtained from pairs of TFRs in which the values of one TFR were circularly shifted in time by a random amount (randomization approach). We calculated one estimate of the parameter of interest from both raw and time-shifted data of each epoch and averaged values in exactly the same way. The two distributions were statistically compared by means of paired Wilcoxon tests. α levels of 0.05 were assumed for all basic statistical analyses.
We performed cluster-based permutation tests to account for multiple comparisons in the case of cross-frequency analyses. To this end, for all frequency pairs, we transformed p-values into z-scores and thresholded these z-scores at α levels of 0.01 (one-sided) to define clusters. We compared the cluster sums of z-scores of the original data to the maxima of cluster sums obtained from n = 1000 random permutations under the null hypothesis. Clusters were judged as significant at α levels of 0.05.
Results
We simultaneously recorded LFPs from 12 electrodes implanted in the sensorimotor cortex (M1 and S1) and dorsolateral striatum of rats during rest and running on a treadmill (Fig. 1). Each trial started with 60 s of rest, followed by four periods of 60 s running at four of six linearly separated speeds between 16 and 36 cm/s. Speed increased abruptly by 4 cm/s after each 60 s period. We detected running errors as the animals broke a light beam at the end of the running lane. For all analyses, we only considered data epochs free of such running errors that passed all criteria of signal quality evaluation (see Materials and Methods). In total, we included data from 16 cortical and 20 striatal electrodes from five rats (between one and 12 electrodes from each rat). Simultaneous corticostriatal recordings were included from three rats. The average number of trials per electrode was 41 trials (min/max: 4/89 trials).
Figure 1.

Experimental approach. A, LFPs were recorded simultaneously from 12 microelectrodes implanted in primary sensorimotor cortex and striatum of rats (three electrodes in each structure and hemisphere). Hemisphere drawing at AP = 0 adapted from Paxinos and Watson (2005). B, Rats adapted their running to the speed of a belt moving opposite to their running direction. Colored traces (blue, cortex; red, striatum) show exemplary raw and band-pass-filtered LFPs from resting and running epochs.
Power
To assess neuronal oscillations in the cortex and striatum, we examined the spectral content of LFPs during rest and running averaged across all speeds. Across electrodes from all animals, in both structures and during both behavioral states, power spectra of the LFP exhibited prominent peaks around 8 Hz (theta band) and 64 Hz (gamma band; Fig. 2A,B). These oscillatory features were clearly visible even in raw LFP traces (Fig. 1B). The comparison of LFP power between rest and running revealed two main effects. First, on top of a broadband increase, we observed frequency-specific increases of power from rest to running in the cortex and striatum (Fig. 2A,B) at ∼4, 8, and 64 Hz. Second, in cortex and striatum, the peak frequencies of the prominent oscillations in the theta and gamma range increased from rest to running. Theta peak frequencies significantly increased from 7.2 Hz during rest to 8.2 Hz during running in the cortex (p < 10−3) and from 7.6 to 8.1 Hz in the striatum (p < 0.05). Gamma peak frequencies increased from 58.0 to 67.6 Hz in the cortex (p < 0.01) and from 56.3 to 65.2 Hz in the striatum (p < 10−4).
Figure 2.

LFP power. A, Top, Average normalized cortical LFP power during rest and running. Power was normalized by 1/frequency2. Bottom, Change in cortical power between rest and running. Both plots show the mean ± SEM; n = 16 electrodes. B, Same as A, but for striatal LFP power (n = 20 electrodes). C, Average normalized cortical and striatal power spectra of individual animals (mean ± SEM). D, Cortical theta and gamma oscillation frequencies increase with running speed. Linear regressions are shown with 95% confidence limits (dashed lines). Circles at speed 0 cm/s mark peak frequencies during rest. Insets, Average power spectra for different running speeds normalized by peak power. Insets and regression plots use the same color-speed mapping. Dashed lines in insets depict resting spectra. E, Scaling of oscillation frequencies in the striatum.
These effects were highly consistent across individual animals (Fig. 2C). In each animal, we found clearly identifiable oscillatory peaks in the theta and gamma range, as well as increases in power from rest to running. Furthermore, the change in theta and gamma peak frequencies from rest to running was also significant in the majority of individual structures and animals (p < 0.01 in 5 of 8 cases for theta and 7 of 8 cases for gamma peak frequencies).
The change in oscillatory frequencies may reflect a general change in behavioral state from rest to motor activity. Alternatively, oscillations may be more specifically linked to motor behavior. To test for such a specific link, we investigated whether oscillatory frequencies also reflected the speed of running. Across all animals, for each trial and running speed, we determined individual theta and gamma peak frequencies (Fig. 2C,D). Regression analyses revealed that theta and gamma peak frequencies significantly increased with running speed in the cortex [theta: p < 10−3, slope 0.04 Hz/(cm/s); gamma: p < 10−45, slope: 1.97 Hz/(cm/s)] and in the striatum [theta: p < 10−68, slope: 0.11 Hz/(cm/s); gamma: p < 10−57, slope: 0.95 Hz/(cm/s)]. Because we pooled the data across single trials from animals that performed at partly differing speeds, unequal numbers of trials per animal entered the data pools at each speed. To rule out that this strategy, together with a systematic difference of oscillatory frequencies across animals, caused the observed increase of frequencies with running speed, we compared theta and gamma peak frequencies between the speeds 24 and 28 cm/s, which all animals performed. Both peak frequencies significantly increased from 24 to 28 cm/s in cortex (theta: p < 10−10, gamma: p < 10−14) and in striatum (theta: p < 10−27, gamma: p < 10−54), which rules out the sampling bias concern.
In summary, during rest and running, we found prominent and consistent theta and gamma oscillations in the cortex and striatum, the peak frequencies of which were related to the speed of running.
Phase-amplitude coupling
Next, we investigated whether theta and gamma oscillations were functionally coupled. Previous studies have demonstrated that the phase of slow oscillations can modulate the amplitude of faster oscillations (Jensen and Colgin, 2007; Canolty and Knight, 2010). In particular, gamma amplitudes have been shown to be coupled to theta phase in the motor cortex (Igarashi et al., 2013) and the striatum (Tort et al., 2008) of awake behaving rats. Therefore, we tested for such a phase-amplitude coupling between slow (2–11 Hz) and fast (23–128 Hz) oscillations in the cortex and striatum.
Indeed, we found significant phase-amplitude coupling between low-frequency and high-frequency neuronal activity during rest and running in the cortex (Fig. 3A) and striatum (p < 0.05 for significant clusters and p < 0.01 at peak frequencies marked in Fig. 3B). Across all animals, in both structures, phase-amplitude coupling was strongest at phase frequencies <4 Hz during rest (delta band) and around 6 Hz (theta band) during running. During rest, phase-amplitude coupling exhibited two distinct peaks at amplitude frequencies <64 Hz and >64 Hz. In other words, during rest, low-frequency phases modulated the amplitude of neuronal activity in distinct low and high-gamma bands. In contrast, during running, phase-amplitude coupling showed only a prominent single peak in the high-gamma band >64 Hz. A control analysis using a different measure of phase-amplitude coupling that is also sensitive to multimodal phase-amplitude distributions (Hurtado et al., 2004; Tort et al., 2010) confirmed our findings with qualitatively identical results.
Figure 3.

Phase-amplitude coupling. A, Average coupling (large panels) and phase of coupling (small panels) between low-frequency phase (x-axis) and high-frequency amplitude (y-axis) of cortical LFPs during rest and running (n = 16 electrodes). White contour lines indicate clusters of significant phase-amplitude coupling (p < 0.05). In small panels, color saturation is reduced in areas of nonsignificant coupling (p > 0.05). During rest (left panels), white squares and triangles mark peaks of phase-amplitude coupling in low (32–64 Hz) and high (64–128 Hz) gamma ranges, respectively. During running (right), the white circle marks phase-amplitude coupling peak in the high-gamma range. B, Average phase-amplitude coupling and its phase for striatal LFPs (n = 20 electrodes). C, Preferred low-frequency phases of low- and high-gamma amplitudes of cortical LFPs displayed on a standard cosine. Frequency bands and markers are as in A and B. D, Same as C, but for striatal LFPs.
As for cortical and striatal power, phase-amplitude coupling was highly consistent across individual animals. In each animal, we observed significant phase-amplitude coupling between 5.7 and 81.2 Hz in cortex and striatum (all 8 of 8 cortical and striatal cases p < 10−3).
The two peaks of phase-amplitude coupling during rest suggested a coupling of distinct neuronal activities in the low and high-gamma bands. To provide further support for this hypothesis, we investigated whether the preferred phase of phase-amplitude coupling differed between the low-gamma and high-gamma band (Fig. 3C, D). Indeed, during rest, phase-amplitude coupling in the low-gamma and high-gamma bands peaked at significantly different phases of low-frequency oscillations (p < 10−6). Coupling of low-gamma oscillations (<64 Hz) was strongest at the rising flank of low-frequency oscillations in the cortex and striatum (cortex: −49°; striatum: −82°). In contrast, high-gamma oscillations (>64 Hz) preferentially coupled to the falling flank of low-frequency oscillations (cortex: +60°; striatum: +83°). In addition, during running, high-gamma oscillations were preferentially coupled to the peak and falling flank of theta oscillations (cortex: +40°; striatum: +34°).
In summary, in the cortex and striatum, we found a low-frequency phase modulation of two distinct gamma-band oscillations during rest and a prominent theta phase modulation of high-gamma-band activity during running.
Corticostriatal phase coupling
The above analyses revealed similar neuronal oscillations in the cortex and striatum. Therefore, we next investigated whether these oscillations were phase coupled between both structures. We quantified phase coupling using the imaginary coherence, which takes into account only nonzero phase coupling. This precluded measuring any spurious phase coupling that may be caused by volume conduction. Across all animals and during both conditions, imaginary coherence significantly (p < 0.05) differed from zero in a broad-frequency range and peaked in the theta range (Fig. 4A). This peak of imaginary coherence in the theta range was particularly prominent during running. Again, this effect was consistent across individual animals. In all animals, we found significant imaginary coherence of positive sign at individual running peaks (p < 0.05 in 3 of 3 animals). The sign of the theta peak of imaginary coherence suggested that cortical theta oscillations were leading striatal oscillations. In fact, this phase shift could also be identified directly by comparing the theta-filtered LFP traces simultaneously recorded in both structures (Fig. 1B).
Figure 4.

Corticostriatal phase coupling. A, Average corticostriatal imaginary coherence (mean ± SEM; n = 91 electrode pairs). Colored line segments at bottom indicates significant coherence (p < 0.05). B, Peak frequency of corticostriatal imaginary coherence in the theta range increases with running speed. Linear regression is shown with 95% confidence limits (dashed lines). Circle at speed 0 cm/s marks peak frequency during rest. Insets, Average imaginary coherence spectra for different running speeds normalized by peak coherence. Insets and regression plots use the same color-speed mapping. Dashed lines in insets depict resting spectra.
In analogy to the analysis of local oscillations, we investigated whether the peak frequency of corticostriatal phase coupling in the theta range was also modulated by behavior. Indeed, the phase-coupling peak significantly increased from 7.3 to 7.9 Hz from rest to running (p < 10−3), which was also the case for individual animals (p < 0.05 for 2 of 3 animals). Furthermore, regression analyses of peak frequencies (Fig. 4B) showed a significant increase of peak frequencies with running speed [p < 0.05, slope: 0.037 Hz/(cm/s)]. Again, a control analysis directly comparing speeds 24 and 28 cm/s indicated that this effect was not due to different numbers of trials per animal entering the data pools for each speed (p < 10−5).
In summary, we found that theta oscillations were phase coupled along the corticostriatal axis during motor behavior.
Amplitude correlation through coherent phase-amplitude coupling
The above analyses revealed two main features of corticostriatal theta oscillations. First, within the cortex and striatum, the phase of theta oscillations modulated the amplitude of gamma oscillations. Second, theta oscillations were phase coupled between structures. Therefore, we hypothesized that, if both effects were sufficiently strong, then together they may entail a correlation of the amplitude of gamma oscillations between structures (Fig. 5A). In other words, the coherence of theta oscillations between structures, together with local phase-amplitude coupling, may lead to a correlated amplitude modulation of gamma oscillations across structures.
Figure 5.

Mechanism of coherent phase-amplitude coupling and amplitude correlation. A, Schematic illustration of the hypothesized mechanism coordinating corticostriatal gamma bursts. Theta oscillations are phase coupled between cortex and striatum, and through local phase-amplitude coupling within cortex and striatum coherently modulate gamma amplitudes in both structures, leading to a correlation of gamma amplitudes. B, Average corticostriatal amplitude correlation spectra (mean ± SEM; n = 91 electrode pairs). Colored line segments at bottom indicate significant amplitude correlation (p < 0.05).
We tested this hypothesis by quantifying the correlation of power time courses of all possible pairs of cortical and striatal LFPs. Importantly, we computed correlations after the pairwise orthogonalization of signals, which, similar to imaginary coherence, precluded measuring any spurious correlations that may be due to volume conduction (Hipp et al., 2012). As hypothesized, we found significant correlations (p < 0.05) between cortical and striatal amplitudes in the gamma frequency range (Fig. 5B). Notably, amplitude correlations peaked at similar frequencies as the phase-amplitude coupling. During rest, amplitude correlations peaked below and >64 Hz, whereas during running, there was only a single peak in the high-gamma band >64 Hz.
Again, the effects were consistent across individual animals. In each animal, we observed significant corticostriatal amplitude correlation in the gamma-band during rest and running (p < 0.05 for all 3 animals and both conditions).
Phase coupling and phase-amplitude coupling predict amplitude correlation
The observed gamma-band amplitude correlation is compatible with the hypothesized mechanism of being caused by an interaction between long-range phase coupling and local phase-amplitude coupling. However, the observed effects may also be coincidental. There may be phase coupling, phase-amplitude coupling and amplitude correlation without a direct mechanistic relationship between these phenomena. Therefore, we sought to provide more direct evidence for such a mechanistic relationship. To this end, we tested directly for a correlation between corticostriatal theta phase coupling and local phase-amplitude coupling and gamma amplitude-correlation across nonoverlapping 5 s epochs. If corticostriatal phase coupling together with local phase-amplitude coupling caused the amplitude correlation between structures, then epochs with stronger or weaker theta phase coupling or theta-gamma phase-amplitude coupling should also show stronger or weaker gamma amplitude correlation, respectively. Furthermore, a correlation between phase coupling or phase-amplitude coupling and amplitude correlation should be expressed at those phase and amplitude frequencies that showed local phase-amplitude coupling within the cortex and striatum.
This is what we found. First, we tested for a correlation between corticostriatal theta phase coupling and gamma amplitude correlation at the average phase (5.7 Hz) and amplitude (81.2 Hz) peak frequencies of cortical and striatal phase-amplitude coupling and found a significant correlation (p < 10−9). Stronger theta phase coupling predicted stronger gamma amplitude correlation (Fig. 6A). This effect was consistent across individual animals (p < 10−4 for all 3 animals). Next, we investigated whether this effect was also specific for the combination of frequencies with local phase-amplitude coupling by testing for a significant correlation across all possible frequency pairs of phase coupling and amplitude correlation (Fig. 6B). This analysis revealed that the correlation between phase coupling and amplitude correlation indeed showed a peak at frequencies that closely matched the peak frequencies of local phase-amplitude coupling (Fig. 6B).
Figure 6.
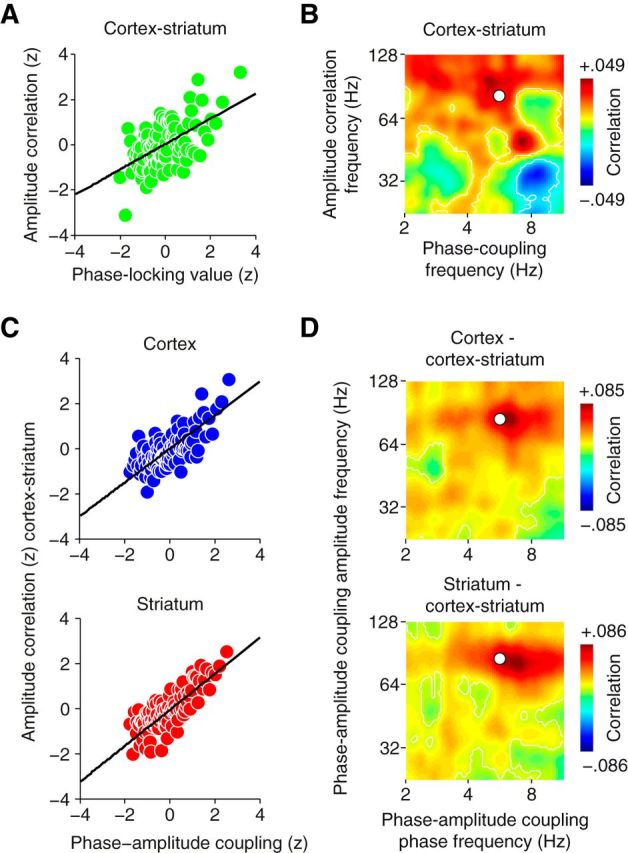
Strength of phase coupling and phase-amplitude coupling predicts amplitude correlation. A, Correlation between corticostriatal phase coupling and amplitude correlation at the average phase (5.7 Hz) and amplitude (81.2 Hz) peak frequencies of cortical and striatal phase-amplitude coupling. B, Correlation matrix of corticostriatal low-frequency phase coupling and high-frequency amplitude correlation. The white circle marks the average frequency pair of cortical and striatal phase-amplitude coupling shown in A. C, Correlation between cortical (top) and striatal (bottom) phase-amplitude coupling and corticostriatal amplitude correlation at the same frequency pair of phase-amplitude coupling as in A. D, Correlation matrices of cortical (top) and striatal (bottom) phase-amplitude coupling and corticostriatal amplitude correlation at the amplitude correlation peak frequency of 85 Hz. White circle as in B. A–D show data from running epochs (n = 41492). Black lines in A and C denote linear regression. White contour lines in B and D indicate clusters of significant correlation (p < 0.05).
Second, we repeated the same type of analysis to also test whether local phase-amplitude coupling in the cortex and striatum predicted gamma amplitude correlation between these structures. There was a significant correlation between cortical (p < 10−18; Fig. 6C, top) and striatal (p < 10−24; Fig. 6C, bottom) phase-amplitude coupling and corticostriatal gamma amplitude correlation at the peak frequencies of phase-amplitude coupling (5.7 to 81.2 Hz) and amplitude correlation (85 Hz). Again, this effect was consistent across individual animals (p < 10−5 for all 3 animals). Furthermore, for both cases, phase-amplitude coupling in the cortex and in the striatum, this effect was frequency specific (Fig. 6D). The correlation analysis across all pairs of phase-amplitude coupling frequencies exhibited maxima at 6.4 Hz phase frequency and 86.7 Hz amplitude frequency for cortex (Fig. 6D, top) and 6.7 Hz phase frequency and 83 Hz amplitude frequency for striatum (Fig. 6D, bottom), closely matching the peak frequencies of phase-amplitude coupling.
In summary, we found a temporal correlation of the amplitude of gamma oscillations between the cortex and striatum. The strength of this amplitude correlation was predicted by both, the strength of corticostriatal theta phase coupling and the strength of local phase-amplitude coupling within the cortex and striatum.
Discussion
Here, we report prominent theta and gamma oscillations in the cortex and striatum that may coordinate corticostriatal processing through coherent phase-amplitude coupling.
Our findings extend previous results from behaving rodents that indicate a functional role of synchronous theta and gamma oscillations in corticostriatal processing. Previous studies linked corticostriatal theta and/or gamma oscillations to cognitive tasks, general behavioral states, and arousal (DeCoteau et al., 2007b; Dejean et al., 2007; Tort et al., 2008; Berke, 2009; Koralek et al., 2013). Here, we show that corticostriatal oscillations are strongly modulated by motor behavior in a pure motor task that required neither learning nor reward. These results add to a growing body of evidence showing that, beyond the corticostrital axis, theta (Semba and Komisaruk, 1978; Mackay, 1997; Bland and Oddie, 2001; Buzsáki, 2002; Igarashi et al., 2013) and gamma (Murthy and Fetz, 1996; Mackay, 1997; Donoghue et al., 1998; Niell and Stryker, 2010; Igarashi et al., 2013) oscillations are modulated during motor behavior. In particular, theta amplitude and peak frequency scale with movement speed in the hippocampus (Vanderwolf, 1969; McFarland et al., 1975). Similarly, gamma amplitude scales with movement speed in the striatum (Masimore et al., 2005) and gamma amplitude or peak frequency scales with movement speed in the hippocampus (Chen et al., 2011; Ahmed and Mehta, 2012). Our data extend these findings by showing that the peak frequencies of corticostriatal theta and gamma oscillations scale with movement speed. This suggests that theta and gamma oscillations are also involved in corticostriatal processing in the most basic functional domain of the corticobasal ganglia system, motor behavior (Marsden, 1982; Phillips et al., 1993; Mink, 1996; Turner and Desmurget, 2010).
Phase coupling of neuronal oscillations has been proposed as a flexible mechanism to regulate the effective connectivity between neuronal populations (Varela et al., 2001; Fries, 2005; Siegel et al., 2012). Indeed, there is growing evidence in favor of this notion for various corticocortical (Roelfsema et al., 1997; Jones and Wilson, 2005; Pesaran et al., 2008; Siegel et al., 2008; Gregoriou et al., 2009; Hipp et al., 2011; Bosman et al., 2012; Liebe et al., 2012; Salazar et al., 2012; Phillips et al., 2013) and corticosubcortical (Tort et al., 2008; Fujisawa and Buzsáki, 2011) interactions. Several studies have suggested that phase coupling of oscillations may also subserve neuronal communication along the corticostriatal axis (Costa et al., 2006; Dejean et al., 2007; Berke, 2009; Sharott et al., 2009; Dzirasa et al., 2010; Syed et al., 2011; Koralek et al., 2013). Our data suggest that phase-coupled oscillations, specifically in the theta range, may support interactions between the cortex and striatum during motor behavior. The prominent frequency scaling of coherent theta oscillations with running speed further supports this notion.
Furthermore, our results add to a growing number of studies demonstrating that low-frequency oscillations can modulate high-frequency oscillations by means of phase-amplitude coupling (Lakatos et al., 2005; Canolty et al., 2006; Siegel et al., 2009; Fujisawa and Buzsáki, 2011; Spaak et al., 2012; de Hemptinne et al., 2013). We confirm that such phase-amplitude coupling is a prominent feature in the sensorimotor cortex (Igarashi et al., 2013) and striatum (Tort et al., 2008) of behaving rats and show that this coupling is characteristically modulated by running behavior. During rest, the amplitude of low- and high-gamma oscillations was modulated by the phase of low-frequency activity below the theta band (<5 Hz). This low-frequency entrainment of gamma oscillations may reflect an idling rhythm controlling high-frequency processes during periods when no movement is required (Dejean et al., 2011). During running, however, the amplitude modulation by slow subtheta activity vanished and high-gamma oscillations were strongly modulated by the phase of theta (4–8 Hz) oscillations. This is in excellent agreement with frequencies of phase-amplitude coupling found previously in the striatum in a maze task (Tort et al., 2008). Together with the observed theta phase coupling between structures, this phase-amplitude coupling suggests that theta oscillations, in particular, may play an important role for corticostriatal processing during motor behavior.
Our data provide, to our knowledge, the first evidence that these two phenomena, large-scale phase coupling and local phase-amplitude coupling, interact to coordinate the occurrence of fast neuronal oscillations between brain regions. Critically, we did not only find that amplitudes of gamma oscillations were indeed correlated between the cortex and striatum, but also that this amplitude correlation was predicted by corticostriatal theta-phase coupling and local phase-amplitude coupling within both structures. The correlation of gamma amplitudes was stronger when the phase of theta oscillations was more tightly coupled between the two structures and when theta-gamma phase-amplitude coupling was stronger within cortex and striatum. Furthermore, this link between the different coupling measures was most prominent for those theta and gamma frequencies that showed maximum phase-amplitude coupling within structures. This provides critical evidence that corticostriatal theta-phase coupling, cortical and striatal theta-gamma phase-amplitude coupling, and the temporal coordination of gamma oscillations are mechanistically linked.
What might be the functional role of gamma amplitude correlations driven by this link? Bursts of local gamma oscillations may reflect a modulation of local processing that is temporally structured (i.e., pulsed) by local theta oscillations. Therefore, coherence of theta oscillations between structures may provide the large-scale temporal scaffold that coordinates local processing. This coordination may serve two purposes. First, interactions between two or more distant neuronal populations may be enhanced when local processing bound to gamma bursts does not fluctuate randomly between populations, but when it is temporally aligned between sending and receiving populations. Second, such temporal alignment of local processing between sending populations may also facilitate the integration of coordinated inputs by receiving target populations. Therefore, amplitude correlations mediated by coherent phase-amplitude coupling may coordinate local neuronal processes for their large-scale interaction.
Local gamma oscillations may define phase slots to multiplex information across different theta phases (Lisman and Jensen, 2013). In the hippocampus, this mechanism has been hypothesized to multiplex spatial information on theta oscillations (Lisman and Jensen, 2013). A similar mechanism may subserve motor sequence encoding along the corticostriatal axis (Fukai, 1999). Alternatively, local gamma oscillations may boost the postsynaptic impact of neurons by synchronizing presynaptic spiking activity (Salinas and Sejnowski, 2001). Local gamma oscillations may also shape the local encoding of information through rhythmic inhibition (Fries et al., 2007) and subserve a phase-dependent encoding of information (Siegel et al., 2009).
Several recent studies point to multiple functionally distinct oscillatory rhythms within the gamma band in cortex (Colgin et al., 2009; Igarashi et al., 2013) and striatum (Berke, 2009; van der Meer and Redish, 2009; Kalenscher et al., 2010). Consistent with this, we found evidence for distinct low-gamma-band (<64 Hz) and high-gamma-band (>64 Hz) oscillations that were differentially modulated by behavior. During rest, gamma oscillations peaked at <64 Hz and both slow and fast gamma rhythms were phase modulated by local low-frequency processes. In contrast, during running, gamma oscillations peaked at >64 Hz and only fast gamma rhythms were phase modulated by theta oscillations. It has been shown that slow (∼50 Hz) striatal gamma oscillations peak before movement onset in rodents (Masimore et al., 2005; van der Meer and Redish, 2009). Furthermore, in the motor cortex of rats, slow and fast gamma oscillations peak during holding of a lever and movement execution, respectively (Igarashi et al., 2013). Together with our findings, this indicates that slow and fast gamma rhythms along the corticostriatal axis may subserve static and dynamic motor states, respectively.
It should be noted that pairwise correlation analyses, used here, do not allow for unequivocally determining causal relationships. Therefore, the demonstrated correlation among phase coupling, phase-amplitude coupling, and amplitude correlation may also result from other causal relationships than those proposed here. For example, gamma amplitudes may be correlated through common input and may entrain local theta phases, leading to local phase-amplitude coupling. These two processes together would then give rise to phase coupling between structures. Manipulative experimental approaches or multivariate analysis techniques (Cadieu and Koepsell, 2010; Canolty et al., 2010, 2012) may be leveraged in future studies to dissociate these alternatives.
In summary, we propose that coordination through coherent phase-amplitude coupling may be a general mechanism regulating large-scale interactions in the brain. Indeed, our results accord well with several other recent findings compatible with this mechanism in other forebrain networks. Coherent slow oscillations coordinate local spiking and/or gamma oscillations between the prefrontal cortex and hippocampus (Jones and Wilson, 2005; Sirota et al., 2008); among the ventral tegmental area, prefrontal cortex, and hippocampus (Fujisawa and Buzsáki, 2011); and between the striatum and hippocampus (Tort et al., 2008). Therefore, coordination through coherent phase-amplitude coupling may be a general mechanism to orchestrate local processing on a larger spatiotemporal scale.
Footnotes
This work was supported by the European Union (Grants IST-2000-28127, MRTN-CT-2005-019247, and FP7-ICT-270212 to A.K.E.). We thank Benjamin M. Grieb and Jörg F. Hipp for helpful discussions and Hannah Walter for help with illustrations.
The authors declare no competing financial interests.
References
- Ahmed OJ, Mehta MR. Running speed alters the frequency of hippocampal gamma oscillations. J Neurosci. 2012;32:7373–7383. doi: 10.1523/JNEUROSCI.5110-11.2012. [DOI] [PMC free article] [PubMed] [Google Scholar]
- Albin RL, Young AB, Penney JB. The functional anatomy of basal ganglia disorders. Trends Neurosci. 1989;12:366–375. doi: 10.1016/0166-2236(89)90074-X. [DOI] [PubMed] [Google Scholar]
- Alexander GE, DeLong MR, Strick PL. Parallel organization of functionally segregated circuits linking basal ganglia and cortex. Annu Rev Neurosci. 1986;9:357–381. doi: 10.1146/annurev.ne.09.030186.002041. [DOI] [PubMed] [Google Scholar]
- Bar-Gad I, Morris G, Bergman H. Information processing, dimensionality reduction and reinforcement learning in the basal ganglia. Prog Neurobiol. 2003;71:439–473. doi: 10.1016/j.pneurobio.2003.12.001. [DOI] [PubMed] [Google Scholar]
- Berke JD. Fast oscillations in cortical-striatal networks switch frequency following rewarding events and stimulant drugs. Eur J Neurosci. 2009;30:848–859. doi: 10.1111/j.1460-9568.2009.06843.x. [DOI] [PMC free article] [PubMed] [Google Scholar]
- Berke JD, Okatan M, Skurski J, Eichenbaum HB. Oscillatory entrainment of striatal neurons in freely moving rats. Neuron. 2004;43:883–896. doi: 10.1016/j.neuron.2004.08.035. [DOI] [PubMed] [Google Scholar]
- Bland BH, Oddie SD. Theta band oscillation and synchrony in the hippocampal formation and associated structures: the case for its role in sensorimotor integration. Behav Brain Res. 2001;127:119–136. doi: 10.1016/S0166-4328(01)00358-8. [DOI] [PubMed] [Google Scholar]
- Boraud T, Brown P, Goldberg JA, Graybiel AM, Magill PJ. Oscillations in the basal ganglia: the good, the bad, and the unexpected. In: Bolam JP, Ingham CA, Magill PJ, editors. The basal ganglia VIII. New York, NY: Springer; 2005. pp. 1–24. [Google Scholar]
- Bosman CA, Schoffelen JM, Brunet N, Oostenveld R, Bastos AM, Womelsdorf T, Rubehn B, Stieglitz T, De Weerd P, Fries P. Attentional stimulus selection through selective synchronization between monkey visual areas. Neuron. 2012;75:875–888. doi: 10.1016/j.neuron.2012.06.037. [DOI] [PMC free article] [PubMed] [Google Scholar]
- Buzsáki G. Theta oscillations in the hippocampus. Neuron. 2002;33:325–340. doi: 10.1016/S0896-6273(02)00586-X. [DOI] [PubMed] [Google Scholar]
- Cadieu CF, Koepsell K. Phase coupling estimation from multivariate phase statistics. Neural Computing. 2010;22:3107–3126. doi: 10.1162/NECO_a_00048. [DOI] [Google Scholar]
- Canolty RT, Knight RT. The functional role of cross-frequency coupling. Trends Cogn Sci. 2010;14:506–515. doi: 10.1016/j.tics.2010.09.001. [DOI] [PMC free article] [PubMed] [Google Scholar]
- Canolty RT, Edwards E, Dalal SS, Soltani M, Nagarajan SS, Kirsch HE, Berger MS, Barbaro NM, Knight RT. High gamma power is phase-locked to theta oscillations in human neocortex. Science. 2006;313:1626–1628. doi: 10.1126/science.1128115. [DOI] [PMC free article] [PubMed] [Google Scholar]
- Canolty RT, Ganguly K, Kennerley SW, Cadieu CF, Koepsell K, Wallis JD, Carmena JM. Oscillatory phase coupling coordinates anatomically dispersed functional cell assemblies. Proc Natl Acad Sci U S A. 2010;107:17356–17361. doi: 10.1073/pnas.1008306107. [DOI] [PMC free article] [PubMed] [Google Scholar]
- Canolty RT, Cadieu CF, Koepsell K, Knight RT, Carmena JM. Multivariate phase-amplitude cross-frequency coupling in neurophysiological signals. IEEE Trans Biomed Eng. 2012;59:8–11. doi: 10.1109/TBME.2011.2172439. [DOI] [PMC free article] [PubMed] [Google Scholar]
- Chen Z, Resnik E, McFarland JM, Sakmann B, Mehta MR. Speed controls the amplitude and timing of the hippocampal gamma rhythm. PLoS One. 2011;6:e21408. doi: 10.1371/journal.pone.0021408. [DOI] [PMC free article] [PubMed] [Google Scholar]
- Colgin LL, Denninger T, Fyhn M, Hafting T, Bonnevie T, Jensen O, Moser MB, Moser EI. Frequency of gamma oscillations routes flow of information in the hippocampus. Nature. 2009;462:353–357. doi: 10.1038/nature08573. [DOI] [PubMed] [Google Scholar]
- Costa RM, Lin SC, Sotnikova TD, Cyr M, Gainetdinov RR, Caron MG, Nicolelis MA. Rapid alterations in corticostriatal ensemble coordination during acute dopamine-dependent motor dysfunction. Neuron. 2006;52:359–369. doi: 10.1016/j.neuron.2006.07.030. [DOI] [PubMed] [Google Scholar]
- Courtemanche R, Fujii N, Graybiel AM. Synchronous, focally modulated beta-band oscillations characterize local field potential activity in the striatum of awake behaving monkeys. J Neurosci. 2003;23:11741–11752. doi: 10.1523/JNEUROSCI.23-37-11741.2003. [DOI] [PMC free article] [PubMed] [Google Scholar]
- DeCoteau WE, Thorn C, Gibson DJ, Courtemanche R, Mitra P, Kubota Y, Graybiel AM. Oscillations of local field potentials in the rat dorsal striatum during spontaneous and instructed behaviors. J Neurophysiol. 2007a;97:3800–3805. doi: 10.1152/jn.00108.2007. [DOI] [PubMed] [Google Scholar]
- DeCoteau WE, Thorn C, Gibson DJ, Courtemanche R, Mitra P, Kubota Y, Graybiel AM. Learning-related coordination of striatal and hippocampal theta rhythms during acquisition of a procedural maze task. Proc Natl Acad Sci U S A. 2007b;104:5644–5649. doi: 10.1073/pnas.0700818104. [DOI] [PMC free article] [PubMed] [Google Scholar]
- de Hemptinne C, Ryapolova-Webb ES, Air EL, Garcia PA, Miller KJ, Ojemann JG, Ostrem JL, Galifianakis NB, Starr PA. Exaggerated phase-amplitude coupling in the primary motor cortex in Parkinson disease. Proc Natl Acad Sci U S A. 2013;110:4780–4785. doi: 10.1073/pnas.1214546110. [DOI] [PMC free article] [PubMed] [Google Scholar]
- Dejean C, Gross CE, Bioulac B, Boraud T. Synchronous high-voltage spindles in the cortex-basal ganglia network of awake and unrestrained rats. Eur J Neurosci. 2007;25:772–784. doi: 10.1111/j.1460-9568.2007.05305.x. [DOI] [PubMed] [Google Scholar]
- Dejean C, Arbuthnott G, Wickens JR, Le Moine C, Boraud T, Hyland BI. Power fluctuations in beta and gamma frequencies in rat globus pallidus: association with specific phases of slow oscillations and differential modulation by dopamine D1 and D2 receptors. J Neurosci. 2011;31:6098–6107. doi: 10.1523/JNEUROSCI.3311-09.2011. [DOI] [PMC free article] [PubMed] [Google Scholar]
- Donoghue JP, Sanes JN, Hatsopoulos NG, Gaál G. Neural discharge and local field potential oscillations in primate motor cortex during voluntary movements. J Neurophysiol. 1998;79:159–173. doi: 10.1152/jn.1998.79.1.159. [DOI] [PubMed] [Google Scholar]
- Dzirasa K, Phillips HW, Sotnikova TD, Salahpour A, Kumar S, Gainetdinov RR, Caron MG, Nicolelis MA. Noradrenergic control of cortico-striato-thalamic and mesolimbic cross-structural synchrony. J Neurosci. 2010;30:6387–6397. doi: 10.1523/JNEUROSCI.0764-10.2010. [DOI] [PMC free article] [PubMed] [Google Scholar]
- Flaherty AW, Graybiel AM. Motor and somatosensory corticostriatal projection magnifications in the squirrel monkey. J Neurophysiol. 1995;74:2638–2648. doi: 10.1152/jn.1995.74.6.2638. [DOI] [PubMed] [Google Scholar]
- Fries P. A mechanism for cognitive dynamics: neuronal communication through neuronal coherence. Trends Cogn Sci. 2005;9:474–480. doi: 10.1016/j.tics.2005.08.011. [DOI] [PubMed] [Google Scholar]
- Fries P, Nikolić D, Singer W. The gamma cycle. Trends Neurosci. 2007;30:309–316. doi: 10.1016/j.tins.2007.05.005. [DOI] [PubMed] [Google Scholar]
- Fujisawa S, Buzsáki G. A 4 Hz oscillation adaptively synchronizes prefrontal, VTA, and hippocampal activities. Neuron. 2011;72:153–165. doi: 10.1016/j.neuron.2011.08.018. [DOI] [PMC free article] [PubMed] [Google Scholar]
- Fukai T. Sequence generation in arbitrary temporal patterns from theta-nested gamma oscillations: a model of the basal ganglia-thalamo-cortical loops. Neural Netw. 1999;12:975–987. doi: 10.1016/S0893-6080(99)00057-X. [DOI] [PubMed] [Google Scholar]
- Graybiel AM. The basal ganglia: learning new tricks and loving it. Curr Opin Neurobiol. 2005;15:638–644. doi: 10.1016/j.conb.2005.10.006. [DOI] [PubMed] [Google Scholar]
- Graybiel AM, Aosaki T, Flaherty AW, Kimura M. The basal ganglia and adaptive motor control. Science. 1994;265:1826–1831. doi: 10.1126/science.8091209. [DOI] [PubMed] [Google Scholar]
- Gregoriou GG, Gotts SJ, Zhou H, Desimone R. High-frequency, long-range coupling between prefrontal and visual cortex during attention. Science. 2009;324:1207–1210. doi: 10.1126/science.1171402. [DOI] [PMC free article] [PubMed] [Google Scholar]
- Hipp JF, Engel AK, Siegel M. Oscillatory synchronization in large-scale cortical networks predicts perception. Neuron. 2011;69:387–396. doi: 10.1016/j.neuron.2010.12.027. [DOI] [PubMed] [Google Scholar]
- Hipp JF, Hawellek DJ, Corbetta M, Siegel M, Engel AK. Large-scale cortical correlation structure of spontaneous oscillatory activity. Nat Neurosci. 2012;15:884–890. doi: 10.1038/nn.3101. [DOI] [PMC free article] [PubMed] [Google Scholar]
- Hurtado JM, Rubchinsky LL, Sigvardt KA. Statistical method for detection of phase-locking episodes in neural oscillations. J Neurophysiol. 2004;91:1883–1898. doi: 10.1152/jn.00853.2003. [DOI] [PubMed] [Google Scholar]
- Igarashi J, Isomura Y, Arai K, Harukuni R, Fukai T. A θ-γ oscillation code for neuronal coordination during motor behavior. J Neurosci. 2013;33:18515–18530. doi: 10.1523/JNEUROSCI.2126-13.2013. [DOI] [PMC free article] [PubMed] [Google Scholar]
- Jensen O, Colgin LL. Cross-frequency coupling between neuronal oscillations. Trends Cogn Sci. 2007;11:267–269. doi: 10.1016/j.tics.2007.05.003. [DOI] [PubMed] [Google Scholar]
- Jones MW, Wilson MA. Theta rhythms coordinate hippocampal-prefrontal interactions in a spatial memory task. PLoS Biol. 2005;3:e402. doi: 10.1371/journal.pbio.0030402. [DOI] [PMC free article] [PubMed] [Google Scholar]
- Kalenscher T, Lansink CS, Lankelma JV, Pennartz CM. Reward-associated gamma oscillations in ventral striatum are regionally differentiated and modulate local firing activity. J Neurophysiol. 2010;103:1658–1672. doi: 10.1152/jn.00432.2009. [DOI] [PubMed] [Google Scholar]
- Koralek AC, Costa RM, Carmena JM. Temporally precise cell-specific coherence develops in corticostriatal networks during learning. Neuron. 2013;79:865–872. doi: 10.1016/j.neuron.2013.06.047. [DOI] [PubMed] [Google Scholar]
- Lakatos P, Shah AS, Knuth KH, Ulbert I, Karmos G, Schroeder CE. An oscillatory hierarchy controlling neuronal excitability and stimulus processing in the auditory cortex. J Neurophysiol. 2005;94:1904–1911. doi: 10.1152/jn.00263.2005. [DOI] [PubMed] [Google Scholar]
- Leventhal DK, Gage GJ, Schmidt R, Pettibone JR, Case AC, Berke JD. Basal ganglia beta oscillations accompany cue utilization. Neuron. 2012;73:523–536. doi: 10.1016/j.neuron.2011.11.032. [DOI] [PMC free article] [PubMed] [Google Scholar]
- Liebe S, Hoerzer GM, Logothetis NK, Rainer G. Theta coupling between V4 and prefrontal cortex predicts visual short-term memory performance. Nat Neurosci. 2012;15:456–462. S1–S2. doi: 10.1038/nn.3038. [DOI] [PubMed] [Google Scholar]
- Lisman JE, Jensen O. The θ-γ neural code. Neuron. 2013;77:1002–1016. doi: 10.1016/j.neuron.2013.03.007. [DOI] [PMC free article] [PubMed] [Google Scholar]
- Mackay WA. Synchronized neuronal oscillations and their role in motor processes. Trends Cogn Sci. 1997;1:176–183. doi: 10.1016/S1364-6613(97)01059-0. [DOI] [PubMed] [Google Scholar]
- Marsden CD. The mysterious motor function of the basal ganglia: the Robert Wartenberg Lecture. Neurology. 1982;32:514–539. doi: 10.1212/WNL.32.5.514. [DOI] [PubMed] [Google Scholar]
- Masimore B, Schmitzer-Torbert NC, Kakalios J, Redish AD. Transient striatal gamma local field potentials signal movement initiation in rats. Neuroreport. 2005;16:2021–2024. doi: 10.1097/00001756-200512190-00010. [DOI] [PubMed] [Google Scholar]
- McFarland WL, Teitelbaum H, Hedges EK. Relationship between hippocampal theta activity and running speed in the rat. J Comp Physiol Psychol. 1975;88:324–328. doi: 10.1037/h0076177. [DOI] [PubMed] [Google Scholar]
- Miller KJ, Sorensen LB, Ojemann JG, den Nijs M. Power-law scaling in the brain surface electric potential. PLoS Comput Biol. 2009;5:e1000609. doi: 10.1371/journal.pcbi.1000609. [DOI] [PMC free article] [PubMed] [Google Scholar]
- Mink JW. The basal ganglia: focused selection and inhibition of competing motor programs. Prog Neurobiol. 1996;50:381–425. doi: 10.1016/S0301-0082(96)00042-1. [DOI] [PubMed] [Google Scholar]
- Moran A, Bergman H, Israel Z, Bar-Gad I. Subthalamic nucleus functional organization revealed by parkinsonian neuronal oscillations and synchrony. Brain. 2008;131:3395–3409. doi: 10.1093/brain/awn270. [DOI] [PubMed] [Google Scholar]
- Murthy VN, Fetz EE. Synchronization of neurons during local field potential oscillations in sensorimotor cortex of awake monkeys. J Neurophysiol. 1996;76:3968–3982. doi: 10.1152/jn.1996.76.6.3968. [DOI] [PubMed] [Google Scholar]
- Niell CM, Stryker MP. Modulation of visual responses by behavioral state in mouse visual cortex. Neuron. 2010;65:472–479. doi: 10.1016/j.neuron.2010.01.033. [DOI] [PMC free article] [PubMed] [Google Scholar]
- Parent A, Hazrati LN. Functional anatomy of the basal ganglia. I. The cortico-basal ganglia-thalamo-cortical loop. Brain Res Brain Res Rev. 1995;20:91–127. doi: 10.1016/0165-0173(94)00007-C. [DOI] [PubMed] [Google Scholar]
- Paxinos G, Watson C. The rat brain in stereotaxic coordinates. Amsterdam: Elsevier Academic; 2005. [Google Scholar]
- Pesaran B, Nelson MJ, Andersen RA. Free choice activates a decision circuit between frontal and parietal cortex. Nature. 2008;453:406–409. doi: 10.1038/nature06849. [DOI] [PMC free article] [PubMed] [Google Scholar]
- Phillips JG, Bradshaw JL, Iansek R, Chiu E. Motor functions of the basal ganglia. Psychol Res. 1993;55:175–181. doi: 10.1007/BF00419650. [DOI] [PubMed] [Google Scholar]
- Phillips JM, Vinck M, Everling S, Womelsdorf T. A long-range fronto-parietal 5- to 10-hz network predicts “top-down” controlled guidance in a task-switch paradigm. Cereb Cortex. 2013 doi: 10.1093/cercor/bht050. doi: 10.1093/cercor/bht050. Advance online publication. [DOI] [PMC free article] [PubMed] [Google Scholar]
- Quiroga RQ, Nadasdy Z, Ben-Shaul Y. Unsupervised spike detection and sorting with wavelets and superparamagnetic clustering. Neural Comput. 2004;16:1661–1687. doi: 10.1162/089976604774201631. [DOI] [PubMed] [Google Scholar]
- Roelfsema PR, Engel AK, König P, Singer W. Visuomotor integration is associated with zero time-lag synchronization among cortical areas. Nature. 1997;385:157–161. doi: 10.1038/385157a0. [DOI] [PubMed] [Google Scholar]
- Salazar RF, Dotson NM, Bressler SL, Gray CM. Content-specific fronto-parietal synchronization during visual working memory. Science. 2012;338:1097–1100. doi: 10.1126/science.1224000. [DOI] [PMC free article] [PubMed] [Google Scholar]
- Salinas E, Sejnowski TJ. Correlated neuronal activity and the flow of neural information. Nat Rev Neurosci. 2001;2:539–550. doi: 10.1038/35086012. [DOI] [PMC free article] [PubMed] [Google Scholar]
- Schultz W, Tremblay L, Hollerman JR. Changes in behavior-related neuronal activity in the striatum during learning. Trends Neurosci. 2003;26:321–328. doi: 10.1016/S0166-2236(03)00122-X. [DOI] [PubMed] [Google Scholar]
- Semba K, Komisaruk BR. Phase of the theta wave in relation to different limb movements in awake rats. Electroencephalogr Clin Neurophysiol. 1978;44:61–71. doi: 10.1016/0013-4694(78)90105-0. [DOI] [PubMed] [Google Scholar]
- Sharott A, Moll CK, Engler G, Denker M, Grün S, Engel AK. Different subtypes of striatal neurons are selectively modulated by cortical oscillations. J Neurosci. 2009;29:4571–4585. doi: 10.1523/JNEUROSCI.5097-08.2009. [DOI] [PMC free article] [PubMed] [Google Scholar]
- Siegel M, Donner TH, Oostenveld R, Fries P, Engel AK. Neuronal synchronization along the dorsal visual pathway reflects the focus of spatial attention. Neuron. 2008;60:709–719. doi: 10.1016/j.neuron.2008.09.010. [DOI] [PubMed] [Google Scholar]
- Siegel M, Warden MR, Miller EK. Phase-dependent neuronal coding of objects in short-term memory. Proc Natl Acad Sci U S A. 2009;106:21341–21346. doi: 10.1073/pnas.0908193106. [DOI] [PMC free article] [PubMed] [Google Scholar]
- Siegel M, Donner TH, Engel AK. Spectral fingerprints of large-scale neuronal interactions. Nat Rev Neurosci. 2012;13:121–134. doi: 10.1038/nrn3137. [DOI] [PubMed] [Google Scholar]
- Sirota A, Montgomery S, Fujisawa S, Isomura Y, Zugaro M, Buzsáki G. Entrainment of neocortical neurons and gamma oscillations by the hippocampal theta rhythm. Neuron. 2008;60:683–697. doi: 10.1016/j.neuron.2008.09.014. [DOI] [PMC free article] [PubMed] [Google Scholar]
- Spaak E, Bonnefond M, Maier A, Leopold DA, Jensen O. Layer-specific entrainment of gamma-band neural activity by the alpha rhythm in monkey visual cortex. Curr Biol. 2012;22:2313–2318. doi: 10.1016/j.cub.2012.10.020. [DOI] [PMC free article] [PubMed] [Google Scholar]
- Syed EC, Sharott A, Moll CK, Engel AK, Kral A. Effect of sensory stimulation in rat barrel cortex, dorsolateral striatum and on corticostriatal functional connectivity. Eur J Neurosci. 2011;33:461–470. doi: 10.1111/j.1460-9568.2010.07549.x. [DOI] [PubMed] [Google Scholar]
- Tallon-Baudry C, Bertrand O. Oscillatory gamma activity in humans and its role in object representation. Trends Cogn Sci. 1999;3:151–162. doi: 10.1016/S1364-6613(99)01299-1. [DOI] [PubMed] [Google Scholar]
- Tort AB, Kramer MA, Thorn C, Gibson DJ, Kubota Y, Graybiel AM, Kopell NJ. Dynamic cross-frequency couplings of local field potential oscillations in rat striatum and hippocampus during performance of a T-maze task. Proc Natl Acad Sci U S A. 2008;105:20517–20522. doi: 10.1073/pnas.0810524105. [DOI] [PMC free article] [PubMed] [Google Scholar]
- Tort AB, Komorowski R, Eichenbaum H, Kopell N. Measuring phase-amplitude coupling between neuronal oscillations of different frequencies. J Neurophysiol. 2010;104:1195–1210. doi: 10.1152/jn.00106.2010. [DOI] [PMC free article] [PubMed] [Google Scholar]
- Turner RS, Desmurget M. Basal ganglia contributions to motor control: a vigorous tutor. Curr Opin Neurobiol. 2010;20:704–716. doi: 10.1016/j.conb.2010.08.022. [DOI] [PMC free article] [PubMed] [Google Scholar]
- van der Meer MAA, Redish AD. Low and high gamma oscillations in rat ventral striatum have distinct relationships to behavior, reward, and spiking activity on a learned spatial decision task. Front Integr Neurosci. 2009;3:9. doi: 10.3389/neuro.07.009.2009. [DOI] [PMC free article] [PubMed] [Google Scholar]
- Vanderwolf CH. Hippocampal electrical activity and voluntary movement in the rat. Electroencephalogr Clin Neurophysiol. 1969;26:407–418. doi: 10.1016/0013-4694(69)90092-3. [DOI] [PubMed] [Google Scholar]
- Varela F, Lachaux JP, Rodriguez E, Martinerie J. The brainweb: phase synchronization and large-scale integration. Nat Rev Neurosci. 2001;2:229–239. doi: 10.1038/35067550. [DOI] [PubMed] [Google Scholar]
- Webster KE. Cortico-striate interrelations in the albino rat. J Anat. 1961;95:532–544. [PMC free article] [PubMed] [Google Scholar]
- Yin HH, Knowlton BJ. The role of the basal ganglia in habit formation. Nat Rev Neurosci. 2006;7:464–476. doi: 10.1038/nrn1919. [DOI] [PubMed] [Google Scholar]