

Abstract
Visual responsiveness of cortical neurons changes depending on the brain state. Neural circuit mechanism underlying this change is unclear. By applying the method of in vivo two-photon functional calcium imaging to transgenic rats in which GABAergic neurons express fluorescent protein, we analyzed changes in visual response properties of cortical neurons when animals became awakened from anesthesia. In the awake state, the magnitude and reliability of visual responses of GABAergic neurons increased whereas the decay of responses of excitatory neurons became faster. To test whether the basal forebrain (BF) cholinergic projection is involved in these changes, we analyzed effects of electrical and optogenetic activation of BF on visual responses of mouse cortical neurons with in vivo imaging and whole-cell recordings. Electrical BF stimulation in anesthetized animals induced the same direction of changes in visual responses of both groups of neurons as awakening. Optogenetic activation increased the frequency of visually evoked action potentials in GABAergic neurons but induced the delayed hyperpolarization that ceased the late generation of action potentials in excitatory neurons. Pharmacological analysis in slice preparations revealed that photoactivation-induced depolarization of layer 1 GABAergic neurons was blocked by a nicotinic receptor antagonist, whereas non–fast-spiking layer 2/3 GABAergic neurons was blocked only by the application of both nicotinic and muscarinic receptor antagonists. These results suggest that the effect of awakening is mediated mainly through nicotinic activation of layer 1 GABAergic neurons and mixed nicotinic/muscarinic activation of layer 2/3 non–fast-spiking GABAergic neurons, which together curtails the visual responses of excitatory neurons.
Keywords: brain state, cholinergic projection, GABAergic interneuron, transgenic rat, two-photon functional Ca2+ imaging, visual cortex
Introduction
To understand the neural mechanisms underlying visual perception and cognition, it is necessary to record the activity of visual cortical neurons in awake animals. Traditionally, studies in visual cortex were conducted in anesthetized animals with few exceptions (Wurtz, 1969; Livingstone and Hubel, 1981; Wörgötter et al., 1998). However, an increasing number of recent studies have focused on response properties of cortical neurons in awake animals and found that, in locomotion and other behavioral states, the visually evoked firing rates of cortical neurons were higher or their membrane potentials were more depolarized (Sawinski et al., 2009; Niell and Stryker, 2010; Bennett et al., 2013; Polack et al., 2013). In addition, inhibitory activities in the cortex were stronger in the awake than anesthetized animals so as to sharpen responses to visual stimulation (Haider et al., 2013). However, the neural circuit mechanisms underlying these awake effects are not well understood, although the properties of canonical neural circuits in visual cortex are well known (Douglas and Martin, 2004).
To elucidate neural circuit mechanisms of awake effects it is important to identify recorded neurons as inhibitory or excitatory because inhibitory interneurons or their subgroups play specific roles in the operation of neural circuits in the cortex (Cobb et al., 1995; Pouille and Scanziani, 2001; Pouille et al., 2009; Adesnik et al., 2012; Atallah et al., 2012; Lee et al., 2012; Wilson et al., 2012; for review, see Isaacson and Scanziani, 2011). In most previous studies, however, cortical neurons were not classified as excitatory or inhibitory or further subdivided, such as fast-spiking (FS) or non–fast-spiking (non-FS) neurons, except for a few recent reports (Lee et al., 2012; Wilson et al., 2012; Polack et al., 2013). Therefore, how excitatory and inhibitory neurons or their subtypes differentially change their visual responsiveness according to the shift of the brain state from the anesthetized to the awake is not well understood.
Regarding mechanism, it is suggested that acetylcholine (ACh) is involved in brain state-dependent changes in the activity of cortical neurons through the basal forebrain (BF) cholinergic projection system (Herrero et al., 2008; Goard and Dan, 2009; Hasselmo and Sarter, 2011; Alitto and Dan, 2012; Lee and Dan, 2012; Picciotto et al., 2012; Pinto et al., 2013; Polack et al., 2013). However, it is not clear whether this system plays a role in changes in the visual responsiveness of inhibitory and excitatory neurons in a differential manner and how cortical neural circuits are modulated by the BF cholinergic system.
To address these questions, we compared the visual response properties of the same cortical neurons between the awake and anesthetized states, and with and without cholinergic activation. In GABAergic interneurons, we found that the magnitude and reliability of visual responses were increased by awakening through cholinergic activation. Excitatory neurons did not show these changes, but the decay time of visual responses was curtailed through cholinergic activation of non–FS GABAergic neurons, suggesting that cortical neurons become responsible more faithfully to fast-changing visual stimuli in the awake than anesthetized state.
Materials and Methods
Animal preparations.
All experimental procedures were performed in accordance with the guidelines of the Animal Experiment Committee of RIKEN Brain Science Institute. Vesicular GABA transporter (VGAT)-Venus transgenic rats of either sex that express Venus in GABAergic neurons were used at postnatal days 40–60. These rats were generated as reported previously (Uematsu et al., 2008). A small custom-made head plate to stabilize the animal's head under a two-photon microscope was attached over the occipital region of the left hemisphere under ketamine/xylazine anesthesia. After recovery from anesthesia, animals were habituated to the experimental setup to see visual stimuli without movement. When one session of visual stimulation was finished, a small drop of water was given to animals together with a beep. This was repeated until the animals learned to see the visual stimuli without moving their eyes. Training procedures were performed usually 10 times for 3–4 d in a water-deprived condition. In experiments in which two-photon recordings were made both in the anesthetized and awake states, the animals were anesthetized initially with isoflurane (0.8%–1.4%) or fentanyl (0.2 ml/h) with dormicum (0.2 ml/h). After recordings in the anesthetized state, anesthesia was discontinued and recordings were interrupted for ∼30–60 min until the EEG showed desynchronized waves. In part of the experiments, recordings were performed initially in the awake state and then in the anesthetized state. The level of anesthesia and awakening was monitored by the cortical EEG, which was recorded through bone screws placed on the skull by an amplifier (A-M Systems, model 177). Usually, eye movement was also monitored with an infrared camera (Watec, WAT-902B).
In experiments in which the nucleus basalis magnocellularis (NB) was electrically stimulated, VGAT-Venus or GAD67-GFP (Δneo) mice of either sex were used at P60-P90. In the experiments in which cholinergic fibers were optically stimulated, ChAT-ChR2-EYFP/VGAT-Venus double transgenic mice, which were generated by cross-breeding ChAT-ChR2(H134R)-EYFP line 6 BAC transgenic mice with VGAT-Venus mice, of either sex, were used at P60-P90. ChAT-ChR2(H134R)-EYFP line 6 BAC transgenic mice were obtained from The Jackson Laboratory. For two-photon imaging and in vivo whole-cell recording, the mice were anesthetized with urethane (1.7 mg/g body weight). The part of the skull and dura mater over the primary visual cortex were removed, and the exposed cortex was covered with agarose (1.5%–2.0% in Ringer's solution). The animal's body temperature was maintained at 36.0°C–36.5°C by a rectal thermoprobe feeding back to a heating pad (ATC-402, Unique Medical).
Optical imaging of intrinsic signals.
To identify the binocular region of the primary visual cortex, we adopted the fast method of optical imaging of intrinsic signals, as reported previously (Kameyama et al., 2010). Visual responses to a temporally periodic stimulus were extracted from continuously recorded images by Fourier analysis. The images were obtained using a CCD camera (CS8310Bi, Toshiba Teli) combined with a 50 × 28 mm tandem lens (Nikon). A surface vascular image and intrinsic signal images were obtained using green (540 ± 10 nm) and red (652 ± 10 nm) illumination lights, respectively. The camera was focused 400 μm below the pial surface at the recording session of intrinsic signals.
The periodic stimulus was generated by a visual stimulus generator (ViSaGe, Cambridge Research Systems). The bar-shaped stimulus (2 × 64 or 2 × 53 deg) was drifted to right or left at the temporal frequency of 8 s/cycle. The stimulus of the drifting bar was presented to each eye. The power of intrinsic signals at the stimulus frequency was calculated for each eye, and then the binocular region of the visual cortex was determined.
In vivo two-photon laser scanning microscopy.
Bolus loading of visual cortical cells was performed with fura-2 AM (Invitrogen) and sulforhodamine 101 (SR101) (Invitrogen), as described previously (Sohya et al., 2007). Images of cells stained with the dyes were visualized with an upright microscope (BX61WI, Olympus) equipped with a water-immersion objective lens (LUMPLANFL40 or 20XW, NA 0.8, Olympus) and the laser scanning microscope system (FV1000-MPE, Olympus), which was coupled with a mode-locked Ti:sapphire laser (MaiTai HP DeepSee, Spectra-physics). The mode-locked lasers were set at the wavelength of 800 and 950 nm for excitation of fura-2 and Venus/EGFP/SR101, respectively. Emitted fluorescence was divided into long-wavelength (>570 nm) and short-wavelength light with a dichroic mirror (570 nm, Olympus), and short-wavelength light was further filtered through a bandpass filter (510–550 nm, Olympus). Both wavelengths of emitted fluorescence were detected simultaneously using two photomultiplier tube detectors. The microscope objective was shielded from possible stray light by covering the space over the animal's head with lightproof cloth.
Data acquisition and visual stimulation.
For two-photon functional Ca2+ imaging, the fluorescence of fura-2 in the areas of 320 × 320 μm was measured at 295–296 ms/frame with a line scan mode. After recording of neural activity, fluorescence from Venus and SR101 was simultaneously monitored by applying the above-mentioned dichroic mirrors and filters. In each animal, images were obtained from 2 to 3 planes separated by at least 15 μm at a depth of 110–230 μm from the surface of the visual cortex. Time-lapse images were realigned to remove tangential drifts by ImageJ software, and cell regions in the images were contoured with a MATLAB program (MathWorks). Square-wave gratings (0.08 cycle/deg for rats and 0.04 cycle/deg for mice) at 100% contrast were moved on an LCD monitor (Flexscan L788, 19 inch, Eizo Nanao) in 12 directions at 30 degree steps (0–330 degrees). These 12 patterns of visual stimuli (3 and 5 s before, 3 and 5 s during, and 10 and 15 s after the presentation of each stimulus for rats and mice, respectively) were presented 4–6 times in a randomly shuffled order. The LCD monitor covered 80 × 50 degrees of the visual field at a viewing distance of 28 cm.
Data analysis of fura-2 signals.
Time courses of changes in fluorescence intensity of an individual cell were extracted by averaging pixel values within the cell contour. A fura-2 signal was detected as a decrease in the fluorescence intensity, which was calculated as −ΔF/F0, in which ΔF = F − F0. The baseline fluorescence intensity, F0, was obtained by averaging the fluorescence intensities of the cell during the prestimulus period. The possible out-of-focus contamination of fluorescence was measured in nearby blood vessels and subtracted from the raw fluorescence intensity. The fura-2 signals of the 4–6 trials were averaged to reduce noise. The response amplitudes at each of the 12 direction angles of stimulus were defined as the mean values of the averaged signals during the corresponding stimulus periods. Cells were defined as visually responsive when one of the averaged signals was larger than 2 SDs of the baseline signals during the prestimulation periods.
Activation of the BF cholinergic system.
To stimulate the BF cholinergic projection system to the cortex in the anesthetized mice, we performed electrical stimulation of the NB and optical activation of cholinergic fibers that expressed channelrhodopsin 2 (ChR2). For electrical stimulation, a bipolar tungsten electrode was inserted into the brain to reach the NB using a micromanipulator under a guidance of the stereotaxic atlas of the mouse brain. The tip of electrodes was confirmed to be located in the NB by changes in EEG from slow waves to fast waves by electrical stimulation (0.5 ms pulses at 100 Hz for 2 s). For activation of cholinergic fibers in the cortex of ChAT-ChR2-EYFP/VGAT-Venus mice, photostimulation was performed using a 473 nm laser either through the objective lens of the two-photon microscope in the in vivo preparations (10–30 ms pulses at 10 Hz for 2 s, 18 mW/mm2) or through an optical fiber (700 μm in diameter) connected to a blue laser generator (Shanghai Laser & Optics Century, S8) in the slice preparations (single pulses of 10 ms duration given at 20 s intervals, 20 mW/mm2).
In vivo electrophysiology.
Whole-cell recordings from GABAergic neurons in layers 1 and 2/3 or pyramidal neurons in layer 2/3 of the visual cortex were performed under two-photon microscopy. GABAergic neurons were identified based on their expression of Venus or GFP, whereas pyramidal cells were targeted for recording using the shadow-patch method. Recording electrodes were pulled from borosilicate glass capillary with filaments (0.86 mm inner diameter, 1.5 mm outer diameter). The resistance of these electrodes with the following internal solution was 4–6 mΩ. The composition of the internal solution was as follows (in mm): K-gluconate 130, MgCl2 2, CaCl2 0.1, HEPES 10, EGTA 0.2, MgATP 4, Na3GTP 0.3, Na-phosphocreatine 10, and AlexaFluor-594 0.05, pH adjusted to 7.2–7.4 with KOH. The osmolarity of the solution was 275–290 mOsm. Membrane potentials were recorded in the current-clamp mode using a multiclamp amplifier (700B, Molecular Devices), filtered at 2–5 kHz, digitized at 10 kHz, and fed into a personal computer with an NI-DAQ board (PCI-MIO-16E-4, National Instruments). Data analysis was performed using the MATLAB program.
Slice preparation.
ChAT-ChR2-EYFP/VGAT-Venus double transgenic mice or ChAT-ChR2-EYFP transgenic mice, at P18–P23, were anesthetized with isoflurane and then decapitated. The brains were rapidly removed and placed in cold ACSF. Sagittal slices of the visual cortex (300 μm thick) were obtained using a tissue slicer (LEICA, VT1200S, Leica Microsystems). Slices were placed in an incubating chamber of oxygenated ACSF at 35°C for 30 min and then at room temperature (25°C) for at least 30 min before recording. The ACSF had the following composition (in mm): NaCl 124, KCl 3.0, CaCl2 2.0, MgCl2 1.0, NaH2PO4 1.25, NaHCO3 26.0, and glucose 10.0, pH 7.4. The ACSF was bubbled continuously with 95% O2–5% CO2. The flow rate of the ACSF was ∼2.5 ml/min. Whole-cell recordings were made from pyramidal cells in layer 2/3, and GABAergic neurons in layers 1 and 2/3 of the visual cortex under infrared differential interference contrast optics. GABAergic neurons in cortical slices were visualized with an epifluorescence microscope (BX51WI, Olympus). We identified FS and non-FS GABAergic neurons by injecting depolarizing currents of 50–400 pA for 500 ms, as reported previously (Sarihi et al., 2008). The membrane potentials were recorded in the current-clamp mode with a multiclamp amplifier (700B, Molecular Devices), filtered at 2–5 kHz and digitized at 10 kHz, and fed into a personal computer with NI-DAQ board (PCI-MIO-16E-4, National Instruments). The analysis was made using Igor 4.01 program. Recording electrodes, the composition of the internal solution, and other procedures for recording membrane potentials were essentially the same as described above.
Pharmacological analysis.
To address whether cholinergic receptors are involved in the changes observed in the visual cortex in vivo, we applied atropine sulfate (Sigma-Aldrich), an antagonist for mAChRs, topically to the cortical surface at a concentration of 1 mm (Alitto and Dan, 2012). To analyze types of cholinergic receptors in slice preparations of the visual cortex, we applied atropine sulfate at a concentration of 20 μm and mecamylamine (Tocris Bioscience), an antagonist for nAChRs, at a concentration of 10 μm through the perfusion medium. We also applied methyllycaconitine citrate (Tocris Bioscience), a selective antagonist for α7 nicotinic receptors, at 50 nm, and dihydro-β-erhthroidine hydrobromide (DHβE, Tocris Bioscience), a selective antagonist for non-α7 nicotinic receptors at 500 nm. In experiments in which cholinergic fibers were activated by blue light, possible excitatory synaptic transmission from neurons other than the recorded cells was blocked by adding an antagonist for NMDA receptors, d,l-APV (Sigma-Aldrich) at 100 μm, and an antagonist for AMPA receptors, CNQX (Sigma-Aldrich) at 20 μm.
Statistical analysis.
In the present study, values are given as the mean ± SEM, unless otherwise mentioned. For statistical analysis, values in the anesthetized and awake states or without and with NB stimulation from the same cells were compared with paired t test, and values between two different groups of cells were compared with unpaired t test. t test was used because the values plotted in representative neurons showed the normal distribution. Statistical evaluation of the normal distribution was made using the Kolmogorov–Smirnov test. In case the distribution of values was not normal, the Mann–Whitney U test was used.
Results
Visual responses of GABAergic and excitatory neurons in the anesthetized and awake states
To perform long-lasting recordings of visual responses of GABAergic interneurons and excitatory neurons in the visual cortex in both the anesthetized and awake states, we used transgenic rats in which GABAergic neurons express Venus fluorescent protein (Uematsu et al., 2008). As reported previously in the mouse visual cortex (Sohya et al., 2007), we injected fura-2 AM, a Ca2+-sensitive indicator, together with SR101, which stains astrocytes, through glass micropipettes into the binocular zone of the primary visual cortex. The primary visual cortex was identified with optical imaging of cortical intrinsic signals evoked by visual stimulation (Kameyama et al., 2010). By injecting the dyes into several cortical sites separated by 200–300 μm, we could stain almost all the cells in a cube of ∼400 × 400 × 200 (depth) μm in layer 2/3 of the visual cortex.
As reported previously in the mouse visual cortex (Kameyama et al., 2010), the three groups of cells, Venus-positive and SR101-negative cells (GABAergic interneurons), Venus-negative and SR101-negative cells (excitatory neurons), and Venus-negative and SR101-positive cells (astrocytes), were identified in an optical slice of the visual cortex of anesthetized rats (Fig. 1A). After recording visual responses from these cells, anesthesia was discontinued and recordings were interrupted for 30–60 min until the EEG showed desynchronized waves indicating an awake state (Fig. 1C). Then recordings were repeated from the same group of cells using identical parameters of visual stimuli as before. During the presentation of visual stimuli, the animals usually did not move their eyes because they had been trained to do so by the water deprivation method (see Materials and Methods). Eye movements were monitored with an infrared camera (Fig. 1B). If eye movements were detected, the data were discarded. Significant visual responses were defined as those that showed the largest change in fluorescence intensity during the visual stimulation >2 SDs of the baseline intensity during the prestimulation period (Kameyama et al., 2010). In the present study, we analyzed 12 GABAergic neurons and 25 excitatory neurons from which significant visual responses were recorded in both the anesthetized and awake states. These neurons were located in layer 2/3 of the visual cortex. Another five GABAergic neurons and 12 excitatory neurons had significant visual responses only in the anesthetized state, and 12 GABAergic neurons and 35 excitatory neurons had significant visual responses only in the awake state. These neurons and astrocytes were not included in the present study.
Figure 1.

In vivo two-photon imaging of visual responses of cells in the rat visual cortex in the anesthetized and awake states. A, Image of an optical plane of the cortex of a VGAT-Venus transgenic rat at P60. This plane was obtained at the depth of 140 μm from the cortical surface. Scale bar, 30 μm. Green, white, and red cells represent GABAergic neurons, excitatory neurons, and astrocytes, respectively. B, A setup of the experiments. Gratings on the screen were drifting in a given direction, and eye movements were monitored by an infrared camera. EEG was recorded to confirm that the animals were awake or not. C, Representative EEGs indicating the anesthetized and awake states. Calibration: bottom right, 5 s, 100 μV. D, Responses of a GABAergic neuron to grating stimuli moving in the direction indicated at top in the anesthetized and awake conditions. Top, Oblique gratings are not shown for simplicity. Gray traces represent responses to each trial of visual stimuli. Solid traces represent averaged traces of 4 trials of visual stimuli. Vertical columns in gray represent the period when visual stimuli were given for 3 s. E, Responses of an excitatory neuron. Other conventions are the same as in D.
Increase in the magnitude and reliability of visual responses of GABAergic neurons on awakening
In functional calcium imaging of cell activities, we found that the amplitude of visual responses of most GABAergic neurons increased when the brain state shifted from the anesthetized to awake condition (Fig. 1D). On the other hand, most excitatory neurons did not show enhanced visual responses even on awakening (Fig. 1E). These observations were confirmed by a group analysis. The mean amplitude of visual responses of the 12 GABAergic neurons in the anesthetized state (mean ± SEM, 9.6 ± 1.7%) increased by 64% on average and attained a value of 15.7 ± 2.0% in the awake state (Fig. 2A, left). The difference was statistically significant (p < 0.05, paired t test). On the other hand, the mean amplitude of the 25 excitatory neurons increased only by 16% on average from a value of 11.3 ± 0.8% in the anesthetized state to 13.1 ± 1.1% in the awake state (Fig. 2A, right). The difference between these two values was not significant (p = 0.19, paired t test).
Figure 2.
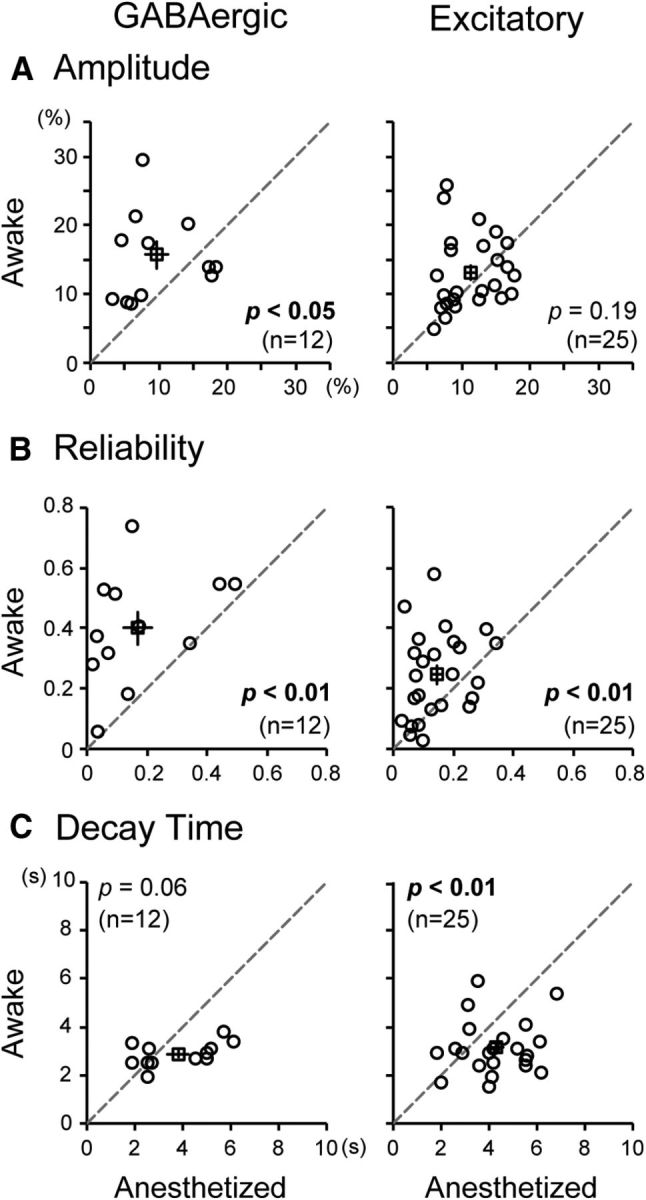
Awakening effects on visual responses of GABAergic (left column) and excitatory neurons (right column) in the rat visual cortex. A–C, Amplitude (A), reliability (B), and decay time (C) of visual responses of each cell in the anesthetized versus awake states, respectively. Statistical significance of the difference (paired t test) and the number of cells are indicated in each graph. Open squares represent mean values; vertical and horizontal lines indicate SEM of the mean.
In GABAergic neurons, we also found that the variability of visual responses from trial to trial decreased in the awake state, as shown by Figure 1D (gray traces). In other words, the response reliability increased when the brain state shifted from the anesthetized to awake condition. To quantify this finding, we calculated a reliability index (RI) of responses to each set of visual stimuli for each cell as follows:
 |
where Cor represents a Pearson's correlation coefficient between two vectors, Resi,s (t) is the response to the s-th stimulus at the i-th trial, i and j are trial numbers, and s is a stimulus number.
The mean RI of the 12 GABAergic neurons in the anesthetized state was 0.17 ± 0.05, which significantly (p < 0.01, paired t test) increased to 0.40 ± 0.06 in the awake state (Fig. 2B, left). A similar difference was seen also in excitatory neurons (Fig. 2B, right). The mean RI of the 25 excitatory neurons was 0.15 ± 0.02 in the anesthetized state and 0.25 ± 0.03 in the awake state. The difference between these two values was significant (p < 0.01, paired t test).
Faster decay of visual responses of excitatory neurons in the awake state
In most excitatory neurons, we found that the decay of visual responses following the peak during the presentation of drifting grating stimuli was faster in the awake than in the anesthetized state (Fig. 3A). To analyze this finding quantitatively, we calculated the decay time constant (τ) by fitting the exponential curve (Fig. 3, blue lines). In the 25 excitatory neurons, the mean value of τ in the awake state was 3.1 ± 0.2 s, which was significantly (p < 0.01, paired t test) shorter than that (4.3 ± 0.3 s) in the anesthetized state (Fig. 2C, right). In the 12 GABAergic neurons, the mean τ value in the awake state (2.9 ± 0.2 s) also seemed to be smaller than that in the anesthetized state (3.8 ± 0.5 s), although the difference (p = 0.06) did not reach the statistical significance (Fig. 2C, left).
Figure 3.

Faster decay of visual responses of excitatory neurons in the awake than the anesthetized state. A, Black and red traces represent visual responses of a representative excitatory neuron in the anesthetized and awake states of a rat, respectively. Blue curves represent the exponential fits to the responses. Decay time constants are 2.7 and 1.3 s, respectively. Vertical column in gray represents the period when visual stimuli were given. B, Visual responses of a representative excitatory neuron in an anesthetized mouse with and without electrical stimulation of NB. Decay time constants are 5.0 and 2.3 s, respectively. Other conventions are the same as in A.
Regarding the orientation tuning property of visual responses, we found that the half-width of tuning curve of visual responses was not significantly changed with the brain state shift in both types of neurons. The mean half-width of eight GABAergic neurons that had a measurable orientation-tuning curve was 56.0 ± 4.3° in the awake state and 56.5 ± 5.0° in the anesthetized state. These two values were not significantly different (p = 0.51, paired t test). Also, the mean half-width of the 19 orientation-selective excitatory neurons in the awake state of 56.8 ± 2.6° was not significantly (p = 0.49, paired t test) different from that (54.4 ± 2.1°) in the anesthetized state.
Changes in visual responses by electrical stimulation of the nucleus basalis
The changes in the magnitude and kinetics of visual responses of GABAergic and excitatory neurons by awakening might be induced by activation of the BF cholinergic projection system. To test this possibility, we activated the BF cholinergic system and analyzed changes in visual responses of cortical GABAergic and excitatory neurons. For this, we used two methods: electrical stimulation of NB and optogenetic activation of cholinergic fibers. Electrical stimulation was used because blue light illumination of the cortex for optogenetic activation interferes with two-photon calcium signal imaging of neuronal activities. Optogenetic activation was used because electrical stimulation might concomitantly activate noncholinergic neurons. In these and subsequent experiments, we used mice because of the availability of double-transgenic animals for optogenetic activation. No notable species difference was reported between the mouse and rat in the BF cholinergic projection to the cerebral cortex (Lehmann et al., 1980; Kitt et al., 1994). We found that electrical stimulation of NB in anesthetized VGAT-Venus or GAD67-GFP (Δneo) mice induced changes in visual responses of GABAergic neurons in the visual cortex similar to awakening rats. The NB stimulation was given for 2 s during the initial part of visual stimulation because the 2 s stimulation induced a desynchronization of EEG, which lasted longer than 5 s. As shown in Figure 4, the amplitude of visual responses of a GABAergic neuron was enhanced by NB stimulation (Fig. 4A), whereas that of an excitatory neuron was not significantly changed (Fig. 4B). The group data indicate that the mean amplitude of visual responses of 26 GABAergic neurons was significantly (p < 0.01, paired t test) enhanced by NB stimulation to 13.1 ± 1.2% from the control value, 10.4 ± 1.1% (Fig. 5A, left). On the other hand, the mean amplitude of 135 excitatory neurons was not significantly (p = 0.54) changed (Fig. 5A, right). The mean values without and with NB stimulation were 14.3 ± 0.6% and 14.6 ± 0.5%, respectively.
Figure 4.

Effects of NB stimulation on visual responses of GABAergic and excitatory neurons. A, B, Responses of a GABAergic neuron (A) and an excitatory neuron (B) to grating stimuli moving in the direction indicated at top in the anesthetized mouse without (top) and with (bottom) electrical stimulation of NB. The time when electrical stimulation was given is indicated by vertical short bars (for 2 s). Vertical columns in gray indicate the time when visual stimuli were given (for 5 s). The other conventions are the same as in Figure 1D, E.
Figure 5.

Effects of NB stimulation on visual responses of GABAergic (left column) and excitatory (right column) neurons in the visual cortex of anesthetized mice. A–C, Amplitude (A), reliability (B), and decay time (C) of visual responses of each cell with (ordinates) and without (abscissa) electrical stimulation of NB. The other conventions are the same as in Figure 2.
The reliability of visual responses of GABAergic neurons was increased by electrical stimulation of NB (Fig. 5B, left). The mean RI of the 26 GABAergic neurons without NB stimulation was 0.21 ± 0.03, and that with stimulation was 0.32 ± 0.03. The difference between these two values was significant (p < 0.01, pair t test). On the other hand, the mean RI of the 135 excitatory neurons was not significantly (p = 0.14) changed by NB stimulation (Fig. 5B, right). Consistent with awakening experiments, the decay time of visual responses of excitatory neurons became faster on average upon electrical stimulation of NB (Fig. 5C, right; see also Fig. 3B), whereas that of GABAergic neurons was not significantly (p = 0.15) changed (Fig. 5C, left). The mean decay time of the 135 excitatory neurons was 5.8 ± 0.2 s without NB stimulation and 4.8 ± 0.2 s with stimulation. The difference between these two values was significant (p < 0.01, pair t test). The half-width of orientation tuning curve of visual responses was not significantly changed by NB stimulation in both types of cells. The mean half-width of nine GABAergic neurons that had measurable orientation-tuning curves was 70.0 ± 2.5° with NB stimulation and 67.0 ± 2.5° without stimulation. These two values were not significantly different (p = 0.27, paired t test). Also, the mean half-width of 71 orientation-selective excitatory neurons with NB stimulation was 63.0 ± 1.3°, which was not significantly (p = 0.14, paired t test) different from that (62.0 ± 1.3°) without stimulation.
We then examined whether the NB-stimulation effects were dependent on activation of ACh receptors. We applied atropine, an antagonist for mAChRs, to the cortical surface of anesthetized VGAT-Venus mice at a concentration of 1 mm (Goard and Dan, 2009). In consequence, NB stimulation did not enhance the amplitude of visual responses in most GABAergic neurons (Fig. 6A, left): the mean amplitude for 14 GABAergic neurons without NB stimulation (9.0 ± 1.0%) was not significantly (p = 0.39) different from that with NB stimulation (9.6 ± 1.4%). Also, the mean RI without NB stimulation (0.18 ± 0.04) was not markedly changed from that with stimulation (0.26 ± 0.05), although the difference was statistically marginal (p = 0.05; Fig. 6B, left). The decay time of 88 excitatory neurons without NB stimulation (4.9 ± 0.2 s) was also not significantly (p = 0.99) different from that with NB stimulation (5.1 ± 0.2 s; Fig. 6C, right). Thus, topically applied atropine blocked the enhancing effect of NB stimulation on visual responses of GABAergic neurons and the decay-hastening effect on responses of excitatory neurons.
Figure 6.
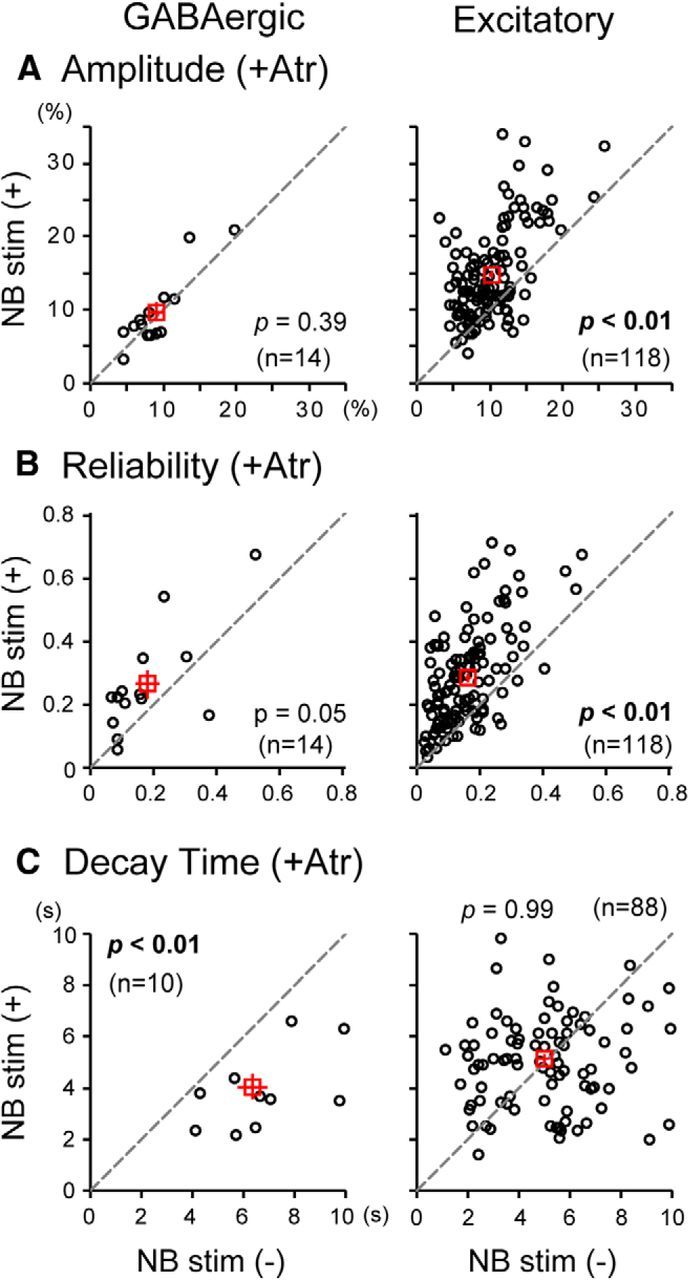
Presence or absence of the effect of NB stimulation with atropine (Atr) on visual responses of GABAergic (left column) and excitatory (right column) neurons. A–C, Amplitude (A), reliability (B), and decay time (C) of visual responses of each cell with (ordinates) and without (abscissa) NB stimulation. A, The mean amplitudes of 118 excitatory neurons with and without NB stimulation were 14.8 ± 0.6% and 10.2 ± 0.4%, respectively. B, The mean RIs of the 118 excitatory neurons with and without NB stimulation were 0.28 ± 0.01 and 0.16 ± 0.01, respectively. C, The mean decay times of responses of 10 GABAergic neurons with and without NB stimulation were 4.1 ± 0.5 s and 6.4 ± 0.6 s, respectively.
It is to be noted, however, that these effects might not be a selective action of the antagonist because atropine can also block nAChRs in a certain concentration range (Zwart and Vijverberg, 1997). With the topical application of antagonists to the cortical surface, it is not possible to control the concentration of antagonists on neurons located at various depths from the surface. Therefore, we did not further test other antagonists in the in vivo preparations and instead used slice preparations in which it is possible to control concentrations of antagonists and identify receptor types with specificity. The results from these slice preparations will be described later.
Changes in visual responses of GABAergic neurons by optical activation of cholinergic axons
To selectively stimulate the BF cholinergic system, we used ChAT-ChR2-EYFP/VGAT-Venus mice that express ChR2 in cholinergic neurons in addition to Venus in GABAergic neurons. It was reported that illumination of the cortical surface by blue light activated cholinergic axons in the sensorimotor and visual cortices of transgenic mice (Arroyo et al., 2012; Kalmbach et al., 2012; Pinto et al., 2013). We also confirmed that photostimulation of the visual cortical surface by blue light induced desynchronization of EEG (Fig. 7C). Because blue light illumination interferes with two-photon calcium signal imaging, we recorded membrane potentials from neurons in layers 1 and 2/3 of the visual cortex through patch-pipette electrodes. Initially, we tested the effectiveness of photostimulation of cholinergic axons on spontaneous activity of GABAergic neurons in layer 1 without visual stimulation. In three of four cells, the photostimulation (30 ms pulses at 10 Hz for 2 s) of the cortical surface induced membrane depolarization, which often generated action potentials with slightly variable latencies, as shown in Figure 7B. The mean membrane potentials (−50 ± 2 mV) before photosimulation were significantly (p < 0.01, paired t test) changed to −44 ± 2 mV during photostimulation. Also, the frequency of spontaneous generation of action potentials (2.1 ± 1.8 spikes/s) was increased to 5.5 ± 0.8 spikes/s. We then confirmed that photostimulation of the same parameters had no effect on cortical neurons (18 GABAergic and 11 excitatory neurons) in control mice that did not express ChR2.
Figure 7.

Whole-cell recordings of responses of a GABAergic neuron in layer 1 of the visual cortex of an anesthetized mouse to photostimulation of ChR2-expressing cholinergic axons and to visual stimulation. A, Two-photon image of a GABAergic neuron labeled with Alexa-594 through a recording pipette. Scale: bottom right, 20 μm. B, Action potentials evoked by a train of photostimulation (30 ms pulses at 10 Hz for 2 s) given as indicated in the bottom traces. Calibration: right, 1 s, 10 mV. C, Change in EEG frequency by the photostimulation. Top, EEG before photostimulation. Bottom, EEG during photostimulation. Calibration: bottom, 5 s, 200 μV. D–F, Membrane potential changes of the cell in response to visual stimulation before (D), during (E), and after (F) photostimulation, respectively. Visual stimuli moving in the direction as indicated at top were given during the shaded period. E, The period when photostimulation was simultaneously given is indicated by blue horizontal line. Calibration: right, 2 s, 10 mV.
We next analyzed the effect of photostimulation of cholinergic axons on visual responses of cortical neurons, as measured by the frequency of action potential generation. As shown in Figure 7D–F, visual responses of a layer 1 GABAergic neuron to nonoptimal stimuli became stronger with cholinergic activation, although responses to optimal stimuli were not further enhanced. We analyzed effects of photoactivation of cholinergic terminals on visual responses of seven GABAergic neurons located in cortical layer 1: Two did not generate action potentials in response to visual stimulation, whereas the other five generated action potentials in response to visual stimuli. In these five cells, visual responses were enhanced by cholinergic activation, as summarized in Figure 8C (blue circles). The mean firing rates per second of the five cells were 3.0 ± 1.0 and 11.2 ± 2.2 before and during photostimulation, respectively. The difference between these two values was significant (p < 0.01, paired t test). From layer 2/3 of the visual cortex, we recorded membrane potentials of eight GABAergic neurons. Six of the eight cells generated action potentials in response to visual stimulation. In those six cells, visual responses were enhanced on average by photostimulation of cholinergic axons, as shown in Figure 8C (red circles). The mean firing rates per second were 6.8 ± 2.0 and 9.9 ± 2.7 before and during photostimulation, respectively. The difference was significant (p < 0.05, paired t test).
Figure 8.
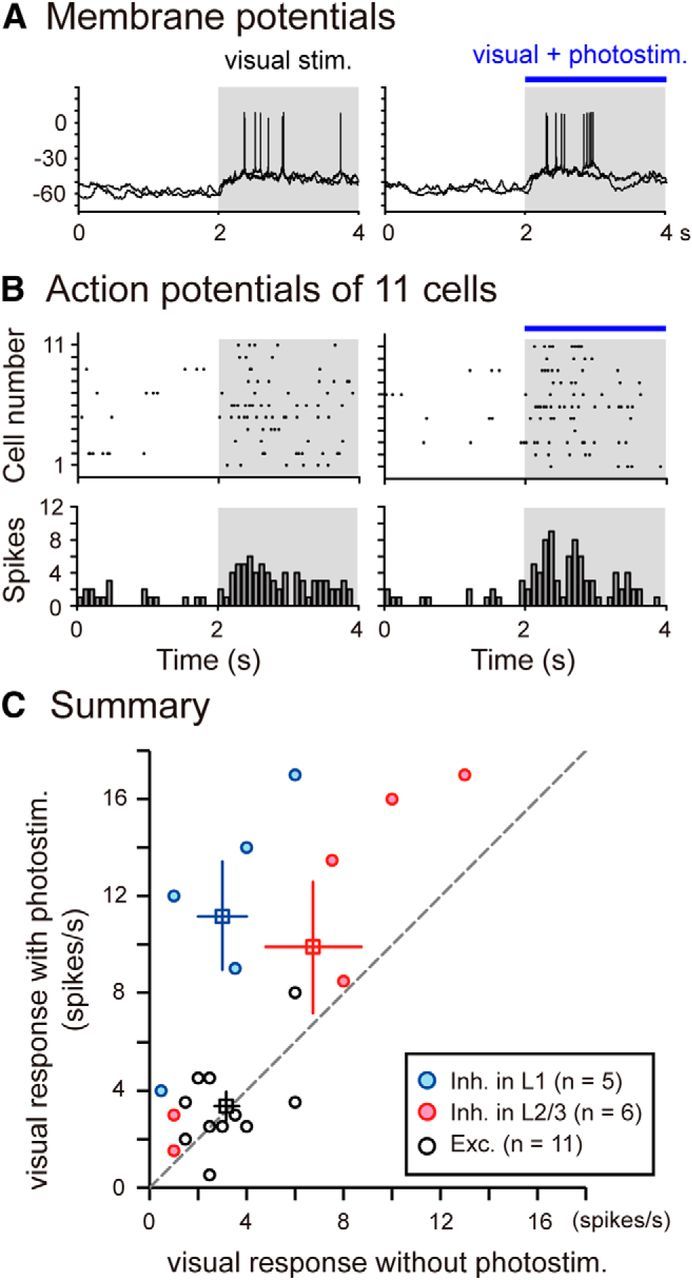
Curtailment of late responses of excitatory neurons by cholinergic activation and summary of the results of the in vivo patch-clamp recording experiments in the visual cortex of an anesthetized mouse. A, Examples of membrane potentials of an excitatory neuron that generated action potentials in response to visual stimulation without (left traces) and with (right traces) photoactivation of cholinergic fibers. Superposition of two traces. Shaded area represents the period when visual stimuli were given. Right, Blue horizontal line indicates the period when photostimulation was simultaneously given. B, Raster display (top) and cumulative histogram (bottom) of action potentials generated before and during visual stimulation of 11 excitatory neurons without (left) and with (right) photoactivation of cholinergic fibers. In the raster display, dots in the same horizontal line represent action potentials from the same cells. C, Plots of firing rates of each of visually responsive cells between visual stimulation without (abscissa) versus with (ordinates) photoactivation of cholinergic fibers. Squares with vertical and horizontal bars represent the means of the values in the same color and SEMs, respectively.
In 15 excitatory neurons, 11 generated action potentials in response to visual stimulation. The mean firing rates per second were 3.2 ± 0.5 and 3.4 ± 0.6 before and during photoactivation, respectively (Fig. 8C, black circles). The difference was not significant (p = 0.74). In most of these visually responsive excitatory neurons, photostimulation of cholinergic axons accelerated the decay phase of visual responses. As shown in Figure 8A (right), action potentials were generated only during the initial phase of visual stimulation and hyperpolarization of the membrane potential was induced in the late phase when the photostimulation was simultaneously applied to the cortex. On the other hand, the peak amplitude of the visually evoked depolarization of membrane potentials was not notably changed by the photoactivation (−62 mV to −45 mV before and −61 mV to −43 mV during the photoactivation). The initial rising slope of the depolarization was also not changed (129 mV/s before and 128 mV/s during the photoactivation). The decrease in the number of action potentials in the late phase of visual stimulation was confirmed in a raster display of action potentials of the 11 excitatory neurons (Fig. 8B). To quantify this finding, we calculated the number of spikes in the early and late halves of the visual stimulation period. The proportions of the spike number in the early and late phases of visual responses were 63% and 37% before and 77% and 23% during the photoactivation, respectively. The total number of spikes in the whole visual stimulation period did not notably change: 70 before and 74 during photoactivation.
Roles of muscarinic and nicotinic receptors in neural circuits of the visual cortex
Because receptors for ACh are classified into two major subtypes, mAChRs and nAChRs, there are questions of which receptor types play a role in the cholinergic actions and at which site of cortical neural circuits they operate. As mentioned earlier, the topical application of antagonists to the in vivo cortex at the high concentration might induce nonselective actions, and thus the effects observed might not reflect the results of selective blockade of target receptors. To overcome these problems, we used slice preparations of the visual cortex of ChAT-ChR2-EYFP/VGAT-Venus mice or ChAT-ChR2-EYFP mice and applied antagonists at a given concentration through the perfusion medium. As mentioned above, illumination of the cortical surface by blue light activated cholinergic axons in the cortex. Thus, we observed the effects of photostimulation on membrane potentials of GABAergic neurons in cortical layers 1 and 2/3 and excitatory neurons in layer 2/3, and then analyzed effects of antagonists on photostimulation-induced changes. Because GABAergic neurons can be subclassified, we divided GABAergic neurons into FS and non-FS types, as reported previously (Sarihi et al., 2008).
Initially, we tested whether each subtype of GABAergic neurons in layer 1 or layer 2/3 and pyramidal cells in layer 2/3 show any response to photostimulation. Whole-cell recordings were performed from 55 layer 1 GABAergic neurons, 38 layer 2/3 GABAergic neurons of the non-FS type, 12 layer 2/3 GABAergic neurons of the FS type, and 14 layer 2/3 pyramidal cells. All of the GABAergic neurons in layer 1 were of the non-FS type. We found that 36 (65%) layer 1 GABAergic neurons and 24 (63%) layer 2/3 GABAergic neurons of the non-FS type showed a depolarization with a peak amplitude of 0.3 to 2.7 (1.1 ± 0.1) mV and a variable duration (150–400 ms in most cases; Fig. 9A–C) in response to photostimulation, whereas only one of the layer 2/3 GABAergic neurons of the FS type and one of the pyramidal cells in layer 2/3 responded to photostimulation. Thus, we focused the analysis on the former two groups of GABAergic neurons. The mean onset latency, initial rising slope, and decay (τ) of photostimulation-induced depolarization were 4.9 ± 0.7 ms, 18.1 ± 4.2 mV/s, and 139.9 ± 24.9 ms, respectively, for 12 layer 1 GABAergic neurons in which all of these parameters were measured and 3.5 ± 0.4 ms, 42.0 ± 6.8 mV/s, and 78.7 ± 14.2 ms, respectively, for 13 layer 2/3 non-FS GABAergic neurons.
Figure 9.
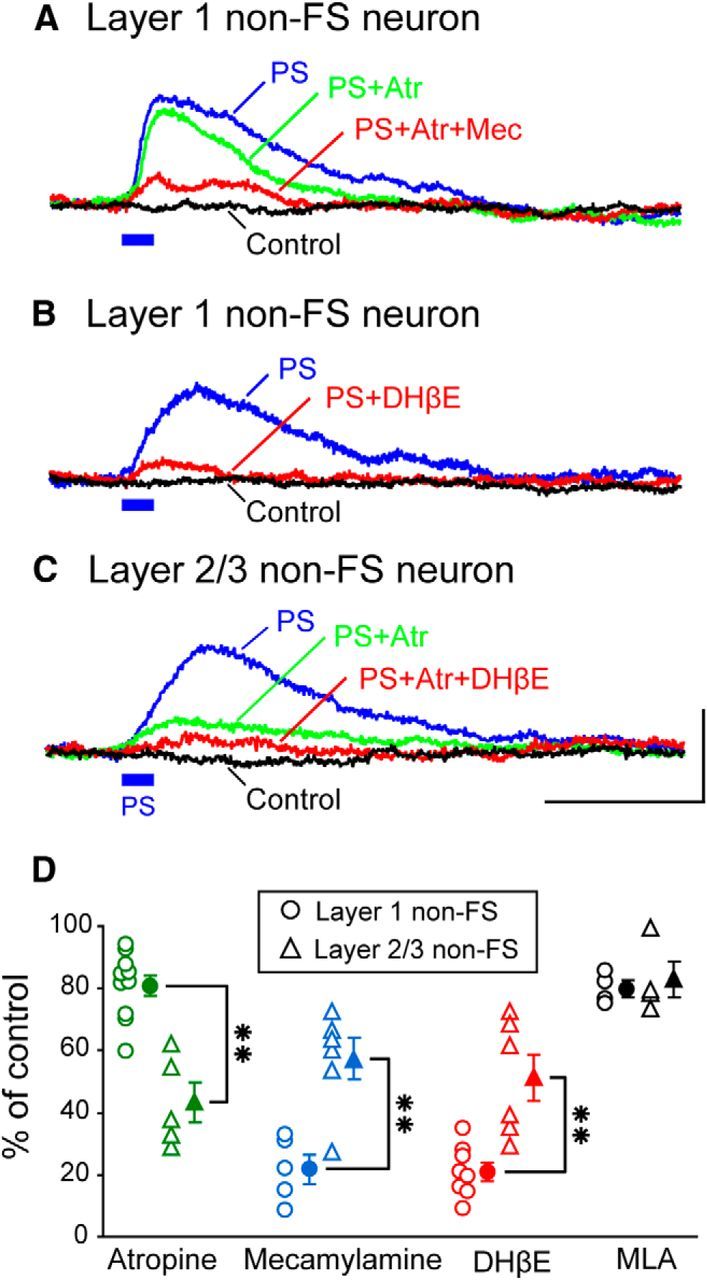
Effects of antagonists for subtypes of AChRs on photostimulation-induced responses of GABAergic neurons in slice preparations of the mouse visual cortex. A, Membrane potential of a layer 1 GABAergic neuron of the non-FS type. The time when photostimulation (PS) was given is indicated by short horizontal bar in blue. Trace indicated by PS represents changes in membrane potential induced by photostimulation of cholinergic fibers. Trace indicated by Control represents membrane potentials without photostimulation. Traces indicated by PS+Atr and PS+Atr+Mec represent PS-induced responses during a single application of atropine and the simultaneous application of atropine and mecamylamine, respectively. B, Membrane potential of a layer 1 GABAergic neuron of the non-FS type. Trace indicated by PS+DHβE represents PS-induced responses during an application of DHβE, an antagonist for non-α7 nAChRs. Other conventions are the same as in A. C, Membrane potentials of a layer 2/3 GABAergic neuron of the non-FS type. Trace indicated by PS+Atr+DHβE represents PS-induced responses during an application of DHβE in addition to atropine. Other conventions are the same as in A. Calibration: bottom right, 50 ms, 0.5 mV, which also apply to A and B. D, The percentage of the peak amplitude of photostimulation-induced depolarization to the control value for each of layer 1 GABAergic neurons of the non-FS type (circles) and layer 2/3 GABAergic neurons of the non-FS type (triangles) during the application of antagonists as indicated in the abscissa. The mean and SEM of 10 layer 1 neurons and five layer 2/3 non-FS neurons for atropine were 80.9 ± 3.4% and 43.3 ± 9.0%, respectively. Those of five layer 1 non-FS neurons and six layer 2/3 non-FS neurons for mecamylamine were 21.8 ± 2.8% and 57.4 ± 6.6%, respectively. Those of eight layer 1 non-FS neurons and six layer 2/3 non-FS neurons for DHβE were 21.0 ± 2.9% and 51.2 ± 7.6%, respectively. Those of four layer 1 non-FS neurons and four layer 2/3 non-FS neurons for methyllycaconitine citrate (MLA), an antagonist for α7 nAChRs, were 79.7 ± 2.8% and 83.0 ± 5.7%, respectively. **Significant difference between two values (p < 0.01, unpaired t test).
Then we performed the pharmacological analysis in these two groups of interneurons. In layer 1 GABAergic neurons, an application of atropine at a concentration of 20 μm only slightly depressed the photostimulation-induced depolarization (Fig. 9A, green trace). When mecamylamine, a selective antagonist for nAChRs, was added at a concentration of 10 μm, the photostimulation-induced depolarization was almost completely blocked (Fig. 9A, red trace), suggesting that the cholinergic action on layer 1 GABAergic neurons is mainly mediated through nicotinic receptors. To confirm this, we applied mecamylanine alone to five layer 1 GABAergic neurons and found that the photostimulation-induced depolarization was strongly depressed (Fig. 9D, blue circles, third column). Nicotinic receptors in the cerebral cortex are generally subdivided into α7 and non-α7 receptors (Lindstrom, 1997). Therefore, we tested antagonists selective for each of the two subtypes of nicotinic receptors. The application of DHβE, an antagonist for non-α7 nicotinic receptors, at 500 nm almost completely blocked photostimulation-induced depolarization of layer 1 GABAergic neurons, as shown in Figure 9B (see also Fig. 9D, fifth column). On the other hand, an application of methyllycaconitine citrate, an antagonist for α7 nicotinic receptors, at 50 nm was not effective (Fig. 9D, seventh column).
In layer 2/3, we recorded 24 photostimulation-responsive GABAergic neurons of the non-FS type. In most of these cells, the photostimulation-induced depolarization was strongly depressed by atropine (Fig. 9C, green traces; see also Fig. 9D, triangles in the second column). On the other hand, a single application of mecamylamine was mostly ineffective in layer 2/3 GABAergic neurons of the non-FS type (Fig. 9D, triangles in the fourth column). Also, a single application of DHβE did not completely block the photostimulation-induced responses of layer 2/3 GABAergic neurons of the non-FS type (Fig. 9D, triangles in the sixth column).
From these results and previous reports on the neural circuits in superficial layers of the visual cortex, it is possible to localize operation sites of the two types of cholinergic receptors in the circuits (Fig. 10).
Figure 10.

A model circuit of the cholinergic curtailing action on visual responses of excitatory neurons. In layer 1 (L1) and layer 2/3 (L2/3) of the visual cortex, cholinergic inputs from NB exert excitatory or facilitatory actions mainly on GABAergic neurons of the non-FS type (nFs), although a less effective action on excitatory (Exc) neurons cannot be excluded. In layer 1, nicotinic receptors of the non-α7 type at nFs neurons operate with slow kinetics and large charge transfer that is reported to induce the delayed generation of bursts of action potentials. Activities of these interneuron pathways through activation of the BF cholinergic system may be responsible for making the decay of visual responses of excitatory neurons faster. This pathway is called the curtailment pathway as indicated by an arrow. N, Nicotinic acetylcholine receptors; M, muscarinic acetylcholine receptors.
Discussion
Awakening enhances visual responses of inhibitory interneurons and curtails those of excitatory neurons
In the present study, we recorded visual responses from the same set of cortical neurons in the two different states of the brain and found that the response amplitude of GABAergic neurons was increased and the reliability of their responses to repeated stimuli was improved when the brain was shifted from the anesthetized to awake states. These results provide a mechanistic basis for the previous suggestions that inhibitory activities in the cortex are stronger when the animals become awake (Rudolph et al., 2007; Haider et al., 2013). We also found that the decay of responses of excitatory neurons to drifting grating stimuli became faster and thus the responses were less sustained. This finding is consistent with a recent report that visual responses of cortical neurons became briefer during wakefulness, although in this report the responses of the same cells were not directly compared between the two different states, and the cells were not classified as GABAergic or non-GABAergic (Haider et al., 2013). Collectively, our results suggest that the shortening of visual responses of cortical excitatory neurons during wakefulness may be ascribable to an active curtailing mechanism of visual responses, as shown in Figure 10.
Using in vivo whole-cell patch-clamp recordings, we demonstrate that briefer visual responses of excitatory neurons during wakefulness may result from the late activation of inhibitory neurons by the BF cholinergic system. Because cholinergic activation is involved in the awakening effect (for review, see Hasselmo and Sarter, 2011; Lee and Dan, 2012; Picciotto et al., 2012) and GABAergic neurons are the main target of the BF cholinergic projection (Beaulieu and Somogyi, 1991; Kawaguchi, 1997; Letzkus et al., 2011; Alitto and Dan, 2012; Arroyo et al., 2012), it is reasonable to suggest that the faster decay of visual responses of pyramidal cells during wakefulness may be due to the enhancement of activities of GABAergic neurons through cholinergic activation. Functionally, the faster decay of visual responses of excitatory neurons may imply that excitatory neurons become responsible more faithfully to fast moving or rapidly changing visual stimuli. In other words, the temporal fidelity of neuronal responsiveness is improved by awakening through cholinergic activation of the inhibitory circuits. Thus, the present findings have uncovered the neural circuit mechanism for previous results showing that electrical stimulation of the BF in anesthetized rats increases the reliability of visual cortical neurons' responses to natural movie stimulation (Goard and Dan, 2009), and optogenetic activation of the BF in awake, behaving mice improves the performance of a visual discrimination task (Pinto et al., 2013).
Involvement of the BF cholinergic system in awakening effects
We found that electrical stimulation of the NB of anesthetized mice induced changes in visual responsiveness of cortical GABAergic and excitatory neurons similar to those observed in the awakening rats. It is possible that the effects induced by electrical stimulation of the NB in the mice might be contaminated with an activation of neurons other than cholinergic projection neurons because the NB also contains GABAergic and glutamatergic neurons, which project to the cortex (Rye et al., 1984; Freund and Meskenaite, 1992; Henny and Jones, 2008; McKenna et al., 2013). Although we cannot exclude this possibility, the results obtained with the photostimulation of the BF cholinergic system suggest that it is unlikely. We observed that the selective activation of ChR2-expressing cholinergic fibers by blue light induced effects similar to those induced by electrical stimulation of the NB. For example, the photostimulation promoted visual stimulation-induced generation of action potentials of GABAergic neurons and suppressed generation of action potentials of pyramidal cells in the late phase of visual responses. Therefore, it is possible to conclude that the awakening effects observed in the rat are ascribable mostly, if not all, to activation of the BF cholinergic system.
It is generally thought that awakening, in particular attention, improves perceptual and cognitive function of the brain. In the sensory system, arousal or awakening is known to increase the sensitivity for detecting spatially or temporally near-threshold stimuli (Maunsell and Cook, 2002). As demonstrated in the present study in rats, the shift of the brain state from anesthetized to awake conditions resulted in the enhancement of response amplitude of GABAergic neurons and the curtailment of responses of pyramidal cells to visual stimuli, which suggests the improvement of temporal resolution of responses. These changes were mimicked by activation of the BF cholinergic system in mice, as mentioned above. Therefore, the present results are consistent with the previous suggestion that the awakening effects on perception and cognition, such as improvements in visual contrast sensitivity or acoustic discrimination, are mediated through the activation of the BF cholinergic system (Bhattacharyya et al., 2013; Froemke et al., 2013).
Roles of nicotinic and muscarinic receptors in cell type-specific awakening effects
It is well known that ACh exerts its various modulatory actions through two types of receptors, nAChRs and mAChRs in the brain (for review, see Picciotto et al., 2012). The former receptors are a family of ACh-gated cation channels that consist of various subtypes, and α7 subunits represent the most primordial form of this family (Lindstrom, 1997). Recently, it was reported that photostimulation of ChR2-expressing cholinergic axons elicits slow, non-α7 nicotinic receptor-mediated responses in layer 1 interneurons and a subset of non-FS interneurons (late spiking cells and ChAT expressing bipolar cells) in layer 2/3 of the mouse visual cortex (Christophe et al., 2002; Arroyo et al., 2012). These responses are characterized by very slow kinetics and large charge transfer and thus delayed generation of bursts of action potentials (Arroyo et al., 2012). These interneurons are suggested to inhibit layer 2/3 pyramidal cells (Letzkus et al., 2011; Arroyo et al., 2012; Pfeffer et al., 2013). Considering these previous reports, it is reasonable to suggest that the activity of these interneuron pathways through activation of the BF cholinergic system may be responsible for accelerating the decay of excitatory responses of pyramidal cells.
Muscarinic receptors are G-protein-coupled receptors and play various modulatory roles in the brain (for review, see Wess, 2003). With immunohistochemistry, it was reported that a proportion of interneurons in layers 2/3 and 5 of the rodent neocortex are mAChR-positive (Zilles et al., 1989; van der Zee and Luiten, 1999). Those interneurons in cortical layer 2/3 may be of the non-FS type because FS interneurons were reported to be unresponsive to ACh in layer 2/3 of the rat visual cortex (Kawaguchi, 1997; Gulledge et al., 2007). Thus, non-FS interneurons in cortical layer 2/3 are expected to have mAChRs, but FS interneurons are not. In the experiments using slice preparations, indeed, we confirmed that photostimulation of cholinergic fibers induced depolarization of layer 2/3 non-FS cells, which was largely blocked by atropine. Because layer 2/3 non-FS interneurons are suggested to directly inhibit pyramidal cells (for review, see Freund and Katona, 2007), it is possible that the cholinergic activation of mAChRs of those interneurons may inhibit pyramidal cells through dendritic GABA receptors (Fig. 10). In the visual cortex, GABAergic neurons in layer 2/3 probably include FS interneurons, even if they are the minority group of interneurons in layer 2/3 (Rudy et al., 2011). These layer 2/3 FS interneurons also receive inhibitory inputs from layer 2/3 non-FS interneurons (Pfeffer et al., 2013; Pi et al., 2013; Xu et al., 2013). Thus, the cholinergic activation of mAChRs of layer 2/3 non-FS interneurons is expected also to induce inhibition of FS interneurons that in turn disinhibit pyramidal cells (Fig. 10). This pathway may not be effective, however, because layer 2/3 non-FS interneurons are inhibited by layer 1 interneurons that are also activated by NB stimulation.
In conclusion, in the awake state, the BF cholinergic system activates layer 1 non-FS interneurons resulting in the delayed inhibition of visual responses of pyramidal cells and also activates layer 2/3 non-FS interneurons, which together control the powerful inhibitory action of FS interneurons on pyramidal cells. Thus, it is reasonable to hypothesize that these pathways may play a role in controlling not only the gain but also durability of visual responses.
Footnotes
We thank Dr. Andrea Benucci for helpful comments on the manuscript and Dr. Atsushi Miyawaki for providing pCS2-Venus.
The authors declare no competing financial interests.
References
- Adesnik H, Bruns W, Taniguchi H, Huang ZJ, Scanziani M. A neural circuit for spatial summation in visual cortex. Nature. 2012;490:226–231. doi: 10.1038/nature11526. [DOI] [PMC free article] [PubMed] [Google Scholar]
- Alitto HJ, Dan Y. Cell-type-specific modulation of neocortical activity by basal forebrain input. Front Syst Neurosci. 2012;6:79. doi: 10.3389/fnsys.2012.00079. [DOI] [PMC free article] [PubMed] [Google Scholar]
- Arroyo S, Bennett C, Aziz D, Brown SP, Hestrin S. Prolonged disynaptic inhibition in the cortex mediated by slow, non-α7 nicotinic excitation of a specific subset of cortical interneurons. J Neurosci. 2012;32:3859–3864. doi: 10.1523/JNEUROSCI.0115-12.2012. [DOI] [PMC free article] [PubMed] [Google Scholar]
- Atallah BV, Bruns W, Carandini M, Scanziani M. Parvalbumin-expressing interneurons linearly transform cortical responses to visual stimuli. Neuron. 2012;73:159–170. doi: 10.1016/j.neuron.2011.12.013. [DOI] [PMC free article] [PubMed] [Google Scholar]
- Beaulieu C, Somogyi P. Enrichment of cholinergic synaptic terminals on GABAergic neurons and coexistence of immunoreactive GABA and choline acetyltransferase in the same synaptic terminals in the striate cortex of the cat. J Comp Neurol. 1991;304:666–680. doi: 10.1002/cne.903040412. [DOI] [PubMed] [Google Scholar]
- Bennett C, Arroyo S, Hestrin S. Subthreshold mechanisms underlying state-dependent modulation of visual responses. Neuron. 2013;80:350–357. doi: 10.1016/j.neuron.2013.08.007. [DOI] [PMC free article] [PubMed] [Google Scholar]
- Bhattacharyya A, Veit J, Kretz R, Bondar I, Rainer G. Basal forebrain activation controls contrast sensitivity in primary visual cortex. BMC Neurosci. 2013;14:55. doi: 10.1186/1471-2202-14-55. [DOI] [PMC free article] [PubMed] [Google Scholar]
- Christophe E, Roebuck A, Staiger JF, Lavery DJ, Charpak S, Audinat E. Two types of nicotinic receptors mediate an excitation of neocortical layer I interneurons. J Neurophysiol. 2002;88:1318–1327. doi: 10.1152/jn.2002.88.3.1318. [DOI] [PubMed] [Google Scholar]
- Cobb SR, Buhl EH, Halasy K, Paulsen O, Somogyi P. Synchronization of neuronal activity in hippocampus by individual GABAergic interneurons. Nature. 1995;378:75–78. doi: 10.1038/378075a0. [DOI] [PubMed] [Google Scholar]
- Douglas RJ, Martin KA. Neuronal circuits of the neocortex. Annu Rev Neurosci. 2004;27:419–451. doi: 10.1146/annurev.neuro.27.070203.144152. [DOI] [PubMed] [Google Scholar]
- Freund TF, Katona I. Perisomatic inhibition. Neuron. 2007;56:33–42. doi: 10.1016/j.neuron.2007.09.012. [DOI] [PubMed] [Google Scholar]
- Freund TF, Meskenaite V. Gamma-aminobutyric acid-containing basal forebrain neurons innervate inhibitory interneurons in the neocortex. Proc Natl Acad Sci U S A. 1992;89:738–742. doi: 10.1073/pnas.89.2.738. [DOI] [PMC free article] [PubMed] [Google Scholar]
- Froemke RC, Carcea I, Barker AJ, Yuan K, Seybold BA, Martins AR, Zaika N, Bernstein H, Wachs M, Levis PA, Polley DB, Merzenich MM, Schreiner CE. Long-term modification of cortical synapses improves sensory perception. Nat Neurosci. 2013;16:79–88. doi: 10.1038/nn.3274. [DOI] [PMC free article] [PubMed] [Google Scholar]
- Goard M, Dan Y. Basal forebrain activation enhances cortical coding of natural scenes. Nat Neurosci. 2009;12:1444–1449. doi: 10.1038/nn.2402. [DOI] [PMC free article] [PubMed] [Google Scholar]
- Gulledge AT, Park SB, Kawaguchi Y, Stuart GJ. Heterogeneity of phasic cholinergic signaling in neocortical neurons. J Neurophysiol. 2007;97:2215–2229. doi: 10.1152/jn.00493.2006. [DOI] [PubMed] [Google Scholar]
- Haider B, Häusser M, Carandini M. Inhibition dominates sensory responses in the awake cortex. Nature. 2013;493:97–100. doi: 10.1038/nature11665. [DOI] [PMC free article] [PubMed] [Google Scholar]
- Hasselmo ME, Sarter M. Modes and models of forebrain cholinergic neuromodulation of cognition. Neuropsychopharmacology. 2011;36:52–73. doi: 10.1038/npp.2010.104. [DOI] [PMC free article] [PubMed] [Google Scholar]
- Henny P, Jones BE. Projections from basal forebrain to prefrontal cortex comprise cholinergic, GABAergic and glutamatergic inputs to pyramidal cells or interneurons. Eur J Neurosci. 2008;27:654–670. doi: 10.1111/j.1460-9568.2008.06029.x. [DOI] [PMC free article] [PubMed] [Google Scholar]
- Herrero JL, Roberts MJ, Delicato LS, Gieselmann MA, Dayan P, Thiele A. Acetylcholine contributes through muscarinic receptors to attentional modulation in V1. Nature. 2008;454:1110–1114. doi: 10.1038/nature07141. [DOI] [PMC free article] [PubMed] [Google Scholar]
- Isaacson JS, Scanziani M. How inhibition shapes cortical activity. Neuron. 2011;72:231–243. doi: 10.1016/j.neuron.2011.09.027. [DOI] [PMC free article] [PubMed] [Google Scholar]
- Kalmbach A, Hedrick T, Waters J. Selective optogenetic stimulation of cholinergic axons in neocortex. J Neurophysiol. 2012;107:2008–2019. doi: 10.1152/jn.00870.2011. [DOI] [PMC free article] [PubMed] [Google Scholar]
- Kameyama K, Sohya K, Ebina T, Fukuda A, Yanagawa Y, Tsumoto T. Difference in binocularity and ocular dominance plasticity between GABAergic and excitatory cortical neurons. J Neurosci. 2010;30:1551–1559. doi: 10.1523/JNEUROSCI.5025-09.2010. [DOI] [PMC free article] [PubMed] [Google Scholar]
- Kawaguchi Y. Selective cholinergic modulation of cortical GABAergic cell subtypes. J Neurophysiol. 1997;78:1743–1747. doi: 10.1152/jn.1997.78.3.1743. [DOI] [PubMed] [Google Scholar]
- Kitt CA, Höhmann C, Coyle JT, Price DL. Cholinergic innervation of mouse forebrain structures. J Comp Neurol. 1994;341:117–129. doi: 10.1002/cne.903410110. [DOI] [PubMed] [Google Scholar]
- Lee SH, Dan Y. Neuromodulation of brain states. Neuron. 2012;76:209–222. doi: 10.1016/j.neuron.2012.09.012. [DOI] [PMC free article] [PubMed] [Google Scholar]
- Lee SH, Kwan AC, Zhang S, Phoumthipphavong V, Flannery JG, Masmanidis SC, Taniguchi H, Huang ZJ, Zhang F, Boyden ES, Deisseroth K, Dan Y. Activation of specific interneurons improves V1 feature selectivity and visual perception. Nature. 2012;488:379–383. doi: 10.1038/nature11312. [DOI] [PMC free article] [PubMed] [Google Scholar]
- Lehmann J, Nagy JI, Atmadia S, Fibiger HC. The nucleus basalis magnocellularis: the origin of a cholinergic projection to the neocortex of the rat. Neuroscience. 1980;5:1161–1174. doi: 10.1016/0306-4522(80)90195-5. [DOI] [PubMed] [Google Scholar]
- Letzkus JJ, Wolff SB, Meyer EM, Tovote P, Courtin J, Herry C, Lüthi A. A disinhibitory microcircuit for associative fear learning in the auditory cortex. Nature. 2011;480:331–335. doi: 10.1038/nature10674. [DOI] [PubMed] [Google Scholar]
- Lindstrom J. Nicotinic acetylcholine receptors in health and disease. Mol Neurobiol. 1997;15:193–222. doi: 10.1007/BF02740634. [DOI] [PubMed] [Google Scholar]
- Livingstone MS, Hubel DH. Effects of sleep and arousal on the processing of visual information in the cat. Nature. 1981;291:554–561. doi: 10.1038/291554a0. [DOI] [PubMed] [Google Scholar]
- Maunsell JH, Cook EP. The role of attention in visual processing. Philos Trans R Soc Lond B Biol Sci. 2002;357:1063–1072. doi: 10.1098/rstb.2002.1107. [DOI] [PMC free article] [PubMed] [Google Scholar]
- McKenna JT, Yang C, Franciosi S, Winston S, Abarr KK, Rigby MS, Yanagawa Y, McCarley RW, Brown RE. Distribution and intrinsic membrane properties of basal forebrain GABAergic and parvalbumin neurons in the mouse. J Comp Neurol. 2013;521:1225–1250. doi: 10.1002/cne.23290. [DOI] [PMC free article] [PubMed] [Google Scholar]
- Niell CM, Stryker MP. Modulation of visual responses by behavioral state in mouse visual cortex. Neuron. 2010;65:472–479. doi: 10.1016/j.neuron.2010.01.033. [DOI] [PMC free article] [PubMed] [Google Scholar]
- Pfeffer CK, Xue M, He M, Huang ZJ, Scanziani M. Inhibition of inhibition in visual cortex: the logic of connections between molecularly distinct interneurons. Nat Neurosci. 2013;16:1068–1076. doi: 10.1038/nn.3446. [DOI] [PMC free article] [PubMed] [Google Scholar]
- Pi HJ, Hangya B, Kvitsiani D, Sanders JI, Huang ZJ, Kepecs A. Cortical interneurons that specialize in disinhibitory control. Nature. 2013;503:521–524. doi: 10.1038/nature12676. [DOI] [PMC free article] [PubMed] [Google Scholar]
- Picciotto MR, Higley MJ, Mineur YS. Acetylcholine as a neuromodulator: cholinergic signaling shapes nervous system function and behavior. Neuron. 2012;76:116–129. doi: 10.1016/j.neuron.2012.08.036. [DOI] [PMC free article] [PubMed] [Google Scholar]
- Pinto L, Goard MJ, Estandian D, Xu M, Kwan AC, Lee SH, Harrison TC, Feng G, Dan Y. Fast modulation of visual perception by basal forebrain cholinergic neurons. Nat Neurosci. 2013;16:1857–1863. doi: 10.1038/nn.3552. [DOI] [PMC free article] [PubMed] [Google Scholar]
- Polack PO, Friedman J, Golshani P. Cellular mechanisms of brain state-dependent gain modulation in visual cortex. Nat Neurosci. 2013;16:1331–1339. doi: 10.1038/nn.3464. [DOI] [PMC free article] [PubMed] [Google Scholar]
- Pouille F, Scanziani M. Enforcement of temporal fidelity in pyramidal cells by somatic feed-forward inhibition. Science. 2001;293:1159–1163. doi: 10.1126/science.1060342. [DOI] [PubMed] [Google Scholar]
- Pouille F, Marin-Burgin A, Adesnik H, Atallah BV, Scanziani M. Input normalization by global feedback inhibition expands cortical dynamic range. Nat Neurosci. 2009;12:1577–1585. doi: 10.1038/nn.2441. [DOI] [PubMed] [Google Scholar]
- Rudolph M, Pospischil M, Timofeev I, Destexhe A. Inhibition determines membrane potential dynamics and control action potential generation in awake and sleeping cat cortex. J Neurosci. 2007;27:5280–5290. doi: 10.1523/JNEUROSCI.4652-06.2007. [DOI] [PMC free article] [PubMed] [Google Scholar]
- Rudy B, Fishell G, Lee S, Hjerling-Leffler J. Three groups of interneurons account for nearly 100% of neocortical GABAergic neurons. Dev Neurobiol. 2011;71:45–61. doi: 10.1002/dneu.20853. [DOI] [PMC free article] [PubMed] [Google Scholar]
- Rye DB, Wainer BH, Mesulam MM, Mufson EJ, Saper CB. Cortical projections arising from the basal forebrain: a study of cholinergic and noncholinergic components employing combined retrograde tracing and immunohistochemical localization of choline acetyltrasnferase. Neuroscience. 1984;13:627–643. doi: 10.1016/0306-4522(84)90083-6. [DOI] [PubMed] [Google Scholar]
- Sarihi A, Jiang B, Komaki A, Sohya K, Yanagawa Y, Tsumoto T. Metabotropic glutamate receptor type 5-dependent long-term potentiation of excitatory synapses on fast-spiking GABAergic neurons in mouse visual cortex. J Neurosci. 2008;28:1224–1235. doi: 10.1523/JNEUROSCI.4928-07.2008. [DOI] [PMC free article] [PubMed] [Google Scholar]
- Sawinski J, Wallace DJ, Greenberg DS, Grossmann S, Denk W, Kerr JN. Visually evoked activity in cortical cells imaged in freely moving animals. Proc Natl Acad Sci U S A. 2009;106:19557–19562. doi: 10.1073/pnas.0903680106. [DOI] [PMC free article] [PubMed] [Google Scholar]
- Sohya K, Kameyama K, Yanagawa Y, Obata K, Tsumoto T. GABAergic neurons are less selective to stimulus orientation than excitatory neurons in layer II/III of visual cortex, as revealed by in vivo functional Ca2+ imaging in transgenic mice. J Neurosci. 2007;27:2145–2149. doi: 10.1523/JNEUROSCI.4641-06.2007. [DOI] [PMC free article] [PubMed] [Google Scholar]
- Uematsu M, Hirai Y, Karube F, Ebihara S, Kato M, Abe K, Obata K, Yoshida S, Hirabayashi M, Yanagawa Y, Kawaguchi Y. Quantitative chemical composition of cortical GABAergic neurons revealed in transgenic Venus-expressing rats. Cereb Cortex. 2008;18:315–330. doi: 10.1093/cercor/bhm056. [DOI] [PubMed] [Google Scholar]
- van der Zee EA, Luiten PG. Muscarinic acetylcholine receptors in the hippocampus, neocortex and amygdala: a review of immunocytochemical localization in relation of learning and memory. Prog Neurobiol. 1999;58:409–471. doi: 10.1016/S0301-0082(98)00092-6. [DOI] [PubMed] [Google Scholar]
- Wess J. Novel insight into muscarinic acetylcholine receptor function using gene targeting technology. Trends Pharmacol Sci. 2003;24:414–420. doi: 10.1016/S0165-6147(03)00195-0. [DOI] [PubMed] [Google Scholar]
- Wilson NR, Runyan CA, Wang FL, Sur M. Division and subtraction by distinct cortical inhibitory networks in vivo. Nature. 2012;488:343–348. doi: 10.1038/nature11347. [DOI] [PMC free article] [PubMed] [Google Scholar]
- Wörgötter F, Suder K, Zhao Y, Kerscher N, Eysel UT, Funke K. State-dependent receptive-field restructuring in the visual cortex. Nature. 1998;396:165–168. doi: 10.1038/24157. [DOI] [PubMed] [Google Scholar]
- Wurtz RH. Visual receptive fields of striate cortex neurons in awake monkeys. J Neurophysiol. 1969;32:727–742. doi: 10.1152/jn.1969.32.5.727. [DOI] [PubMed] [Google Scholar]
- Xu H, Jeong HY, Tremblay R, Rudy B. Neocortical somatostatin-expressing GABAergic interneurons disinhibit the thalamorecipient layer 4. Neuron. 2013;77:155–167. doi: 10.1016/j.neuron.2012.11.004. [DOI] [PMC free article] [PubMed] [Google Scholar]
- Zilles K, Schröder H, Schröder U, Horvath E, Werner L, Luiten PG, Maelicke A, Strosberg AD. Distribution of cholinergic receptors in the rat and human neocortex. EXS. 1989;57:212–228. doi: 10.1007/978-3-0348-9138-7_22. [DOI] [PubMed] [Google Scholar]
- Zwart R, Vijverberg HP. Potentiation and inhibition of neuronal nicotinic receptors by atropine: competitive and noncompetitive effects. Mol Pharmacol. 1997;52:886–895. doi: 10.1124/mol.52.5.886. [DOI] [PubMed] [Google Scholar]