

Abstract
Genome-wide association studies indicated the homeobox-containing transcription factor Engrailed-2 (En2) as a candidate gene for autism spectrum disorders (ASD). Accordingly, En2 knock-out (En2−/−) mice show anatomical and behavioral “ASD-like” features, including decreased sociability and learning deficits. The molecular pathways underlying these deficits in En2−/− mice are not known. Deficits in signaling pathways involving neurofibromin and extracellular-regulated kinase (ERK) have been associated with impaired learning. Here we investigated the neurofibromin-ERK cascade in the hippocampus of wild-type (WT) and En2−/− mice before and after spatial learning testing. When compared with WT littermates, En2−/− mice showed impaired performance in the Morris water maze (MWM), which was accompanied by lower expression of the activity-dependent gene Arc. Quantitative RT-PCR, immunoblotting, and immunohistochemistry experiments showed a marked downregulation of neurofibromin expression in the dentate gyrus of both naive and MWM-treated En2−/− mice. ERK phosphorylation, known to be induced in the presence of neurofibromin deficiency, was increased in the dentate gyrus of En2−/− mice after MWM. Treatment of En2−/− mice with lovastatin, an indirect inhibitor of ERK phosphorylation, markedly reduced ERK phosphorylation in the dentate gyrus, but was unable to rescue learning deficits in MWM-trained mutant mice. Further investigation is needed to unravel the complex molecular mechanisms linking dysregulation of neurofibromin-dependent pathways to spatial learning deficits in the En2 mouse model of ASD.
Keywords: autism, hippocampus, kinase, Morris water maze, neurodevelopmental disorder, neurofibromatosis
Introduction
Engrailed-2 (En2) is a homeodomain transcription factor involved in regionalization and patterning of the midbrain/hindbrain region (Joyner, 1996; Gherbassi and Simon, 2006). Recent studies demonstrate that En2 is also widely expressed in the postnatal brain and suggest that it might control the structure and function of learning-related circuits (Tripathi et al., 2009; Brielmaier et al., 2012; Sgadò et al., 2013a). Genetic studies associated En2 to autism spectrum disorders (ASD; Gharani et al., 2004; Benayed et al., 2009), and an abnormal expression and methylation of the En2 gene was found in the cerebellum of ASD patients (James et al., 2013). En2−/− mice display neuropathological changes related to ASD, including cerebellar hypoplasia (Joyner et al., 1991; Kuemerle et al., 1997) and loss of forebrain GABAergic interneurons (Tripathi et al., 2009; Sgadò et al., 2013a). ASD-related behavioral deficits, including increased seizure susceptibility (Tripathi et al., 2009), reduced sociability, and impaired cognitive flexibility (Cheh et al., 2006; Brielmaier et al., 2012) were also detected in En2−/− mice. Spatial learning and memory defects, such as those detected in the Morris water maze (MWM), are especially robust in En2−/− mice (Brielmaier et al., 2012) and might be relevant to the cognitive impairments observed in ASD patients (Dawson et al., 2002).
The cellular and molecular underpinnings of impaired cognition in the En2 ASD model remain unknown. Deficits in signaling pathways involving neurofibromin have been associated with impaired learning in neurodevelopmental disorders. Neurofibromin is the product of the NF1 gene, whose mutation causes neurofibromatosis type 1, a complex genetic syndrome characterized by nervous system tumors, behavioral and motor delays, and cognitive disabilities (Gutmann et al., 2012). Neurofibromin is a Ras-GTPase that negatively regulates Ras and its downstream ERK (Fasano and Brambilla, 2011) and AKT/mTOR (Dasgupta et al., 2005; Johannessen et al., 2005) pathways. Deficits in neurofibromin signaling pathways have been associated with impaired learning: mice with an Nf1 heterozygous null mutation showed enhanced phosphorylation of ERK, leading to impaired long-term potentiation and hippocampal-dependent learning (Cui et al., 2008). Interestingly, these effects seem to be mediated by loss of Nf1 in inhibitory neurons (Cui et al., 2008), whose number is markedly reduced in the hippocampus of En2−/− mice (Sgadò et al., 2013a). We therefore investigated the neurofibromin/ERK pathway in the hippocampus of WT and En2−/− mice following a spatial learning test in the MWM.
Materials and Methods
Animals.
Experiments were conducted in conformity with the European Community Directive 2010/63/EU and were approved by the Italian Ministry of Health. Animals were housed in a 12 h light/dark cycle with food and water available ad libitum. En2 mutants were originally generated on a mixed 129Sv × C57BL/6 genetic background (Joyner et al., 1991) and then backcrossed at least five times into a C57BL/6 background (Sgadò et al., 2013a). Male and female WT and En2−/− age-matched adult littermates (3–5 months old; weight 25–35 g) obtained from heterozygous matings were used. A previous study showed that learning abilities did not differ between genders in both WT and En2−/− mice (Brielmaier et al., 2012). Fifty-two mice (26 per genotype) were used in this study, divided in three groups. The first group comprised 22 mice (11 per genotype) subjected to MWM. Animals were killed at the end of MWM and brains dissected. For RT-PCR and immunoblotting, four hippocampi per genotype were dissected and frozen in dry ice; for immunohistochemistry, four brains per genotype were fixed by 4% paraformaldehyde perfusion; and for in situ hybridization, three brains per genotype were frozen on dry ice. The second group comprised 14 mice (7 per genotype) treated with lovastatin and subjected to MWM. Brains from these mice (n = 4 per genotype) were fixed by 4% paraformaldehyde perfusion at the end of MWM and used for immunohistochemistry. A third group of naive mice (eight per genotype) was not subjected to MWM and used as control. Their brains were dissected as described above and used for RT-PCR/immunoblotting (four per genotype) and immunohistochemistry (four per genotype).
Antibodies.
Primary antibodies were as follows: rabbit polyclonal anti-neurofibromin (Santa Cruz Biotechnologysc-67, 1:500 for immunoblotting; 1:100 for immunohistochemistry), mouse monoclonal anti-β-tubulin (β-Tub; Santa Cruz Biotechnology sc-53140; 1:20,000), goat polyclonal anti-En2 (Abcam ab45867; 1:250), rabbit polyclonal anti-ERK1/2 (Santa Cruz Biotechnology sc-153; 1:2000), rabbit polyclonal anti-phospho-ERK1/2 (Cell Signaling Technologies 4370, 1:1500 for immunoblotting; 1:500 for immunohistochemistry), mouse monoclonal GAPDH (Santa Cruz Biotechnology sc-32233; 1:10,000), rabbit polyclonal anti-GABA (Sigma; 1:2000), mouse monoclonal anti-parvalbumin (PV; Sigma-Aldrich; 1:2000), rabbit polyclonal anti-somatostatin (SOM; Peninsula-Bachem; 1:2000), and rabbit polyclonal anti-neuropeptide Y (NPY; Peninsula-Bachem; 1:2000). Peroxidase-conjugated, goat anti-rabbit or goat anti-mouse secondary antibodies (Santa Cruz Biotechnology; 1:10,000–20,000) were used for immunoblotting. For immunohistochemistry, appropriate biotin-conjugated secondary antibodies were incubated with streptavidin-conjugated fluorophores (Alexa Fluor 488/594; Life Technologies) for immunofluorescence or avidin–biotin–peroxidase complex (ABC kit; Vector Laboratories) for diaminobenzidine staining.
MWM.
Impaired MWM performance is indicative of ASD-like cognitive rigidity (Moy et al., 2006). Experiments were performed according to van Praag et al. (1999). Mice were trained for 9 d (two trials a day) to locate and escape onto a submerged platform in a circular tank (80 cm diameter) filled with opaque water (22 ± 1°C). For each mouse, the start position was pseudorandomized across trials, and the hidden platform remained in the same quadrant for all trials across all training sessions. A spatial probe trial was performed 4 h after the last trial on day 9 of training; time spent, number of crossings, and proximity to platform in all quadrants were scored (Maei et al., 2009). All animals were killed at the end of the spatial probe trial session and brains dissected. Data were acquired using EthoVision (Noldus Information Technology). To test the effect of lovastatin on MWM performance, mice were given subcutaneous injections of 10 mg/kg lovastatin (Mevinolin; Sigma) for 3 d before the first training day and then 6 h before training every day (Li et al., 2005). Lovastatin solution was prepared as described previously (Li et al., 2005).
In situ hybridization.
In situ hybridization was performed as previously described (Sgadò et al., 2013a) using an Arc-specific digoxigenin-labeled riboprobe (nucleotides 358–1355 of the rat cDNA sequence NM_019361; 96% homologous to the mouse Arc sequence NM_018790.3). Digital images of three dorsal hippocampus sections per animal were analyzed using ImageJ (http://rsb.info.nih.gov/ij/). Arc mRNA staining was calculated in a contour encompassing the CA1 and CA3 subfields, whereas background staining was calculated in a contour placed over the corpus callosum from the same section. Mean optical density values (normalized to the contour area) were calculated by subtracting the aspecific background to Arc-specific signal.
Quantitative RT-PCR and immunoblotting.
Total RNAs and proteins were extracted from dissected hippocampi using a protocol allowing their simultaneous extraction from the same sample. Protocols were as described previously (Dunleavy et al., 2013; Sgadò et al., 2013a; Allegra et al., 2014). RT-PCR primers were as follows: NF1 forward 5′-GGCTGCTCATCAATATCATTC-3′, reverse 5′-AACTGGAACGGAAGGCAATG-3′ (NM_010897.2); mouse mitochondrial ribosomal protein L41 (internal standard) forward 5′-GGTTCTCCCTTTCTCCCTTG-3′, reverse 5′-GCACCCCGACTCTTAGTGAA-3′ (NM_001031808.2). Immunoblots were revealed and quantified using chemiluminescence followed by densitometry using ImageJ; β-Tub and GAPDH were used as internal standards.
Immunohistochemistry and cell counts.
Immunohistochemistry was performed as described previously (Sgadò et al., 2013a; Allegra et al., 2014). To count neurofibromin-positive cells, three to five sections at the level of the dorsal hippocampus were analyzed per animal. Multiple images from each section were acquired at 20× objective magnification using a Zeiss Observer Z1 microscope, and then assembled using the MosaiX tool of the Zeiss AxioVision v4.8.1 software to reconstruct the entire section. Light intensity and microscope settings were optimized initially and then kept constant to maintain the same exposure through the single microphotographs and sections overall. Cell counts were then performed on tiff-converted mosaic images using ImageJ (http://rsb.info.nih.gov/ij/). Neurofibromin-stained cells were counted in the hilus, granule cell layer, and pyramidal cell layers over two to three counting boxes of 100 × 100 μm each. Cell densities were expressed as the number of labeled cells per counting window (100 × 100 μm). To establish a consistent guideline for counting individual cells, only cells larger than 5 μm with a clearly visible soma were counted. Signals smaller than 5 μm were excluded to avoid counting neurites, nerve terminals, and false signals.
To count pERK-positive cells, three to five sections at the level of the dorsal hippocampus were analyzed per animal. Multiple bright-field images from each section were acquired at 20× magnification using a Zeiss Axio Imager M2 microscope, and then assembled using Adobe Photoshop. Cell counts were then performed on tiff-converted mosaic images using ImageJ (http://rsb.info.nih.gov/ij/). pERK-stained cells were counted in the hilus, granule cell layer, and pyramidal cell layers over two to three counting boxes of 100 × 100 μm each. Cell densities were expressed as the number of labeled cells per counting window (100 × 100 μm). For densitometric analysis of pERK staining, acquired black and white images were inverted. Two separate contours were drawn for each digital image: positive staining was calculated in the entire mossy fiber pathway (from the hilus to the CA3 region), whereas background was calculated over the corpus callosum. Mean optical density values (normalized to the contour area) were calculated by subtracting the nonspecific background to pERK-specific signal in the mossy fibers. All counts and measurements were performed by an experimenter blind of genotypes.
Statistics.
Statistical analyses were performed by GraphPad software. Student's t test or ANOVA followed by appropriate post hoc test was used, with statistical significance level set at p < 0.05.
Results
Spatial memory was assessed in 11 WT and 11 mutant mice subjected to MWM. Even if both genotypes showed significant decrease in escape latency to reach the hidden platform during trials (two-way repeated-measures ANOVA, main effect of training day, F(8,197) = 13.41, p < 0.001), En2−/− mice reached the goal less efficiently than WT mice (main effect of genotype, F(1,197) = 17.15, p < 0.001), starting from training day 3 (genotype × training day interaction, F(8,197) = 2.66, p = 0.009; Fig. 1A). Similar results were obtained for the path length (data not shown). During the probe trial, WT mice showed closer proximity to the platform, as compared with En2−/− mutants (Fig. 1B; one-way ANOVA followed by Holm–Sidak post hoc test, *p = 0.027, **p = 0.007). Lack of quadrant selectivity in En2−/− but not WT mice was also detected in number of crossings (Fig. 1C), but not time spent (Fig. 1D) in the target quadrant (one-way ANOVA followed by Holm–Sidak post hoc test, *p < 0.05, **p < 0.01, and ***p < 0.001). We then analyzed Arc mRNA levels in the hippocampus after MWM to verify learning-induced gene expression. In situ hybridization showed that Arc transcript was significantly lower in CA1, CA3, and granule cell layer (GCL) of En2−/− mice compared with WT (Student's t test, p = 0.0211 for CA1, p = 0.0044 for CA3; n = 3 per genotype; Fig. 1E). These experiments extend the notion that En2−/− adult mice display marked deficits in a hippocampal-dependent spatial learning task.
Figure 1.

En2−/− mice show impaired spatial learning in the MWM test. A, Escape latency during training. B, Proximity to platform in target and opposite quadrants during probe trial. C, Number of crossings in target and opposite quadrants during probe trial. D, Time spent in target and opposite quadrants during probe trial. WT, Open circles; En2−/−, black squares; T, target quadrant; OP, quadrant opposite to target. *p < 0.05, **p < 0.01, and ***p < 0.001 (one-way ANOVA followed by Holm–Sidak post hoc test; n = 11 per genotype). E, Representative in situ hybridization on WT and En2−/− hippocampi and quantification of Arc mRNA signal in the CA1 and CA3 pyramidal cell layers (*p < 0.05, **p < 0.01; Student's t test, WT vs En2−/−; n = 3 per genotype). Scale bar, 200 μm.
We next investigated neurofibromin expression in WT and En2−/− mice before and after the MWM test. Real-time RT-PCR experiments revealed significantly lower levels of Nf1 mRNA in the hippocampus of En2−/− naive mice compared with WT. Nf1 mRNA levels were significantly increased after MWM in both genotypes, but remained lower in En2−/− mice (two-way ANOVA followed by Tukey's post hoc test, p < 0.05 for all comparisons; n = 4 per genotype per treatment group; Fig. 2A). Immunoblotting confirmed that neurofibromin levels were lower in the hippocampus of En2−/− naive mice compared with WT. MWM significantly increased neurofibromin in the WT but not En2−/− hippocampus, as compared with naive animals (two-way ANOVA followed by Tukey's post hoc test, p < 0.05 for all comparisons; n = 4 per genotype per treatment group; Fig. 2B,D). Accordingly, immunohistochemistry experiments revealed a significantly lower number of neurofibromin-positive neurons in the hilus of En2−/− naive mice compared with WT. A significantly higher number of neurofibromin-positive hilar neurons was present in WT mice following MWM as compared with naive animals, whereas this increase was not detected in the En2−/− hilus (two-way ANOVA followed by Tukey's post hoc test, p < 0.001 for all comparisons; n = 4 per genotype per treatment group; Fig. 2C,E). Intensity of neurofibromin staining in the GCL and CA3/CA1 pyramidal layers (Fig. 2F–H) and number of neurofibromin-positive cells in the stratum radiatum of the CA1 (Fig. 2I) did not differ across genotypes in both naive and MWM-trained groups (two-way ANOVA followed by Tukey's post hoc test, p > 0.05 for all comparisons; n = 4 per genotype per treatment group). Thus, in basal conditions, adult En2−/− mice display a marked reduction of neurofibromin levels in the hippocampus, mainly due to a reduced number of neurofibromin-positive neurons in the hilus. Most importantly, MWM testing did not increase hippocampal neurofibromin protein levels in En2−/− mice, as instead observed in WT littermates. Impaired neurofibromin-dependent pathways might therefore underlie spatial learning deficits in En2−/− mice.
Figure 2.
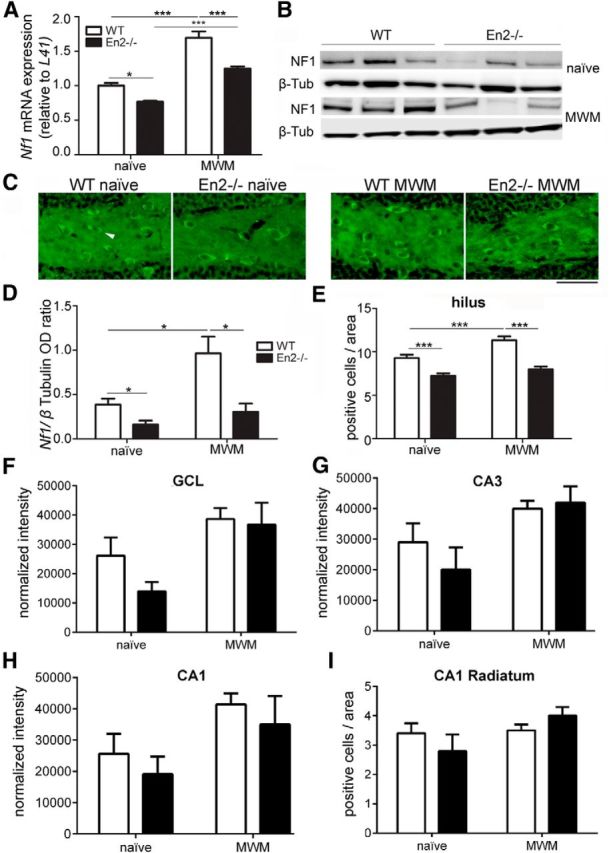
Reduced neurofibromin expression in the En2−/− hippocampus. A, Quantification of Nf1 mRNA expression in the hippocampus of WT and En2−/− mice, before (naive) and after MWM. B, Representative neurofibromin (NF1) immunoblottings from naive and MWM-trained mice of both genotypes. Three samples per genotype and treatment group are shown. C, Representative immunostainings of the hilus from naive and MWM mice of both genotypes. Arrowhead indicates an example of neurofibromin-positive neurons. D, Quantification of immunoblotting experiments (OD, optical density). E, Quantification of neurofibromin-positive cells in the hilus. F–H, Densitometric analysis of neurofibromin immunostaining in the GCL (F), CA3 pyramidal layer (G), and CA1 pyramidal layer (H). I, Counts of neurofibromin-positive cells in the CA1 stratum radiatum. *p < 0.05, ***p < 0.001 (two-way ANOVA followed by Tukey's post hoc test; n = 4 per genotype per treatment group). Scale bar, 80 μm.
In the hilus, neurofibromin colocalized with En2 protein expressed in SOM and NPY but not PV interneurons (Fig. 3A). Neurofibromin was widely expressed throughout the hippocampus, whereas the phosphorylated form of the neurofibromin target ERK was mainly restricted to the axonal compartment of GCL neurons (mf; Fig. 3B). Few scattered pERK-positive cells were also detected in the GCL and other hippocampal subfields in naive WT mice (Fig. 4A,B).
Figure 3.

Neurofibromin and pERK expression in the hippocampus. A, Representative double immunostainings of neurofibromin (NF1; green) and En2, NPY, SOM, and PV (red) in the WT hilus. Arrowheads indicate examples of NF1-positive NPY and SOM interneurons. B, Double immunostaining of NF1 (red) and pERK (green) in the WT hippocampus. mf, mossy fibers. Scale bars: A, 50 μm; B, 250 μm. C, Left, Representative ERK1/2 and pERK1/2 immunoblottings on hippocampal extracts from naive and MWM-trained WT and En2−/− mice. GAPDH is used as internal standard. Right, Quantification of immunoblotting experiments (n = 4 per genotype); pERK levels were normalized to total ERK. Normalization to GAPDH gave similar results (data not shown). Abbreviation: OD, optical density.
Figure 4.

pERK staining in the hippocampus of naive and MWM-trained WT and En2−/− mice. A, Representative pERK immunostainings on whole dorsal hippocampi. B, Details of pERK immunostaining in the hilus and CA3 of the same mice as in A. White arrowhead indicates a pERK-positive hilar neuron. Genotypes and treatments as indicated. mf, mossy fibers. Scale bars: A, 300 μm; B, 150 μm.
The reduced expression of neurofibromin suggests that pERK might also be affected in the En2−/− hippocampus. Immunoblotting experiments showed that pERK and total ERK levels did not differ across genotypes in the whole hippocampus of both naive and MWM-trained mice (two-way ANOVA, p > 0.05; Fig. 3C). We then performed immunostainings to investigate ERK phosphorylation in hippocampal subfields of WT and En2−/− mice before and after MWM. pERK-positive neurons were scarcely detected in the hilus of naive WT and En2−/− mice, but clearly visible in both genotypes following MWM (Fig. 4A,B). Following MWM, a significantly higher number of pERK-positive neurons was present in hilus of En2−/− mice, as compared with WT (two-way ANOVA followed by Tukey's post hoc test, p < 0.0001, En2−/− MWM vs WT MWM; n = 4 per genotype and treatment group; Fig. 7A). Thus, neurofibromin deficiency results in increased pERK in En2−/− hilar neurons. A significantly higher number of pERK-positive neurons was also detected in the GCL of both WT and En2−/− mice after MWM, as compared with naive controls (two-way ANOVA followed by Tukey's post hoc test, p < 0.001 for all comparisons; n = 4 per genotype and treatment group; Fig. 7B); following MWM, the number of pERK-positive GCL neurons was significantly higher in En2−/− mice compared with WT (two-way ANOVA followed by Tukey's post hoc test, p < 0.01, En2−/− MWM vs WT MWM; n = 4 per genotype and treatment group; Fig. 7B). Comparable pERK staining was detected in the inner molecular layer (iml) of WT and En2−/− mice following MWM (Fig. 4B). Conversely, the number of pERK-positive CA3 neurons was significantly increased after MWM in both genotypes (two-way ANOVA followed by Tukey's post hoc test, p < 0.001 for all comparisons; n = 4 per genotype and treatment group; Figs. 4B, 7C). However, following MWM, the number of pERK-positive CA3 neurons was significantly lower in En2−/− mice compared with WT (two-way ANOVA followed by Tukey's post hoc test, p < 0.05, En2−/− MWM vs WT MWM; n = 4 per genotype; Fig. 7C). MWM testing did not markedly alter pERK immunoreactivity in the mossy fibers in both genotypes (Fig. 7D).
Figure 7.

Quantification of lovastatin effect on ERK phosphorylation in the hippocampus of MWM-trained WT and En2−/− mice. Graphs show the quantification of pERK staining in different hippocampal subfields of lovastatin-treated, MWM-trained (MWM + Lova) WT and En2−/− mice, as compared with untreated WT and En2−/− mice, before (naive) and after (MWM) MWM training (Fig. 4 for representative pERK immunostainings from naive and MWM-trained WT and En2−/− mice). A–C, Counts of pERK-positive neurons in the hilus (A), GCL (B), and CA3 (C). D, pERK staining in the mossy fibers. *p < 0.05, **p < 0.01, ***p < 0.001, and ****p < 0.0001 (two-way ANOVA followed by Tukey's post hoc test; n = 4 per genotype and treatment group).
Previous studies showed that neurofibromin deficiency in Nf1+/− mice results in increased pERK levels in GABAergic neurons (Cui et al., 2008). Indeed, neurofibromin is expressed in NPY- and SOM-positive GABAergic hilar interneurons (Fig. 3A). Thus, we sought to determine which interneuron subtypes expressed neurofibromin and pERK in WT and En2−/− mice before and after MWM. Double stainings for neurofibromin and GABA confirmed that neurofibromin is expressed in hilar interneurons in both WT and En2−/− mice after MWM (Fig. 5). Neurofibromin-expressing GABAergic neurons were identified as SOM- and NPY-positive (Fig. 5) but not PV-positive (data not shown) interneurons. Interestingly, interneurons coexpressing neurofibromin and SOM were less present in MWM-trained En2−/− mice, as compared with MWM-trained WT controls (Fig. 5), whereas the number of interneurons coexpressing neurofibromin and NPY was comparable between these groups of animals (Fig. 5). Neurofibromin-positive neurons did not express pERK in both WT and En2−/− naive mice, while very few neurons coexpressing neurofibromin and pERK were detected in MWM-trained mice of both genotypes (Fig. 5). Finally, pERK was detected in hilar GABAergic interneurons, especially in MWM-trained En2−/− mice (Fig. 5).
Figure 5.

En2−/− mice. Representative double immunostainings show the colocalization of neurofibromin (NF1; green) and pERK (green in the first and red in the second row from bottom) in GABA-, NPY-, and SOM-positive hilar interneurons (all in red) in naive and MWM-trained WT and En2−/− mice. Used antibodies, genotypes, and treatments are as indicated. White arrowheads indicate examples of double-labeled neurons (yellow staining). Scale bar, 80 μm.
Systemic administration of lovastatin, a specific inhibitor of HMG-CoA reductase (Kita et al., 1980), has been shown to reduce ERK phosphorylation and rescue learning deficits in Nf1+/− mice (Li et al., 2005). Since En2−/− mice show a 50% reduction in neurofibromin protein levels (Fig. 2), we tested whether lovastatin treatment was effective in restoring normal pERK levels and rescuing learning deficits in MWM-trained En2−/− mice. Lovastatin-treated WT but not En2−/− mice showed decreased escape latency during training (main effect of genotype, F(1,125) = 22.36, p < 0.001; WT Lova vs En2−/− Lova, n = 7 per genotype; Fig. 6A), as well as quadrant selectivity during the probe trial (Fig. 6B; data not shown; one-way ANOVA followed by Holm–Sidak post hoc test, *p < 0.05, WT Lova vs En2−/− Lova, n = 7 per genotype). Thus, lovastatin treatment did not ameliorate spatial learning performance of En2−/− mice (also compare lovastatin-treated En2−/− mice in Fig. 6A,B to untreated En2−/− mice in Fig. 1A,C).
Figure 6.

Lovastatin rescues ERK phosphorylation but not spatial learning performance in MWM-trained En2−/− mice. Lovastatin-treated WT and En2−/− mice were subjected to MWM. Escape latency during training and number of platform crossings in target and opposite quadrants during probe trial are shown in A and B, respectively. Lova, Lovastatin; lovastatin-treated WT, open circles; lovastatin-treated En2−/−, black squares; T, target quadrant; OP, quadrant opposite to target. *p < 0.05; ***p < 0.001 (one-way ANOVA followed by Holm–Sidak post hoc test; n = 7 per genotype). C, Representative pERK immunostainings in the hilus and CA3 of lovastatin-treated WT and En2−/− mice subjected to MWM. Genotypes and treatments as indicated. Scale bar, 150 μm.
However, immunohistochemistry experiments showed a comparable number of pERK-positive neurons in the hilus and CA3 of lovastatin-treated WT and En2−/− mice following MWM (Fig. 6C), indicating that lovastatin was indeed able to reduce ERK phosphorylation in MWM-trained En2−/− mice (compare withFig. 4B). Quantification of pERK immunohistochemistry experiments in naive, MWM, and MWM + Lova mice of both genotypes confirmed these findings. Lovastatin significantly decreased the number of pERK-positive neurons in the hilus (Fig. 7A) and GCL (Fig. 7B) in MWM-trained En2−/− mice, as compared with MWM-trained En2−/− mice that did not receive the drug (two-way ANOVA followed by Tukey's post hoc test; *p < 0.05, ****p <0.0001; n = 4 per genotype and treatment group). In the CA3, lovastatin significantly decreased the number of pERK-positive neurons in both genotypes, as compared with MWM-trained mice that did not receive the drug (two-way ANOVA followed by Tukey's post hoc test; *p < 0.05, ***p < 0.001; n = 4 per genotype and treatment group; Fig. 7C). Lovastatin decreased pERK staining in the mossy fibers only in WT animals (two-way ANOVA followed by Tukey's post hoc test; p < 0.001, n = 4 per genotype and treatment group; Fig. 7D).
Discussion
In this study, we showed that impaired spatial learning in the MWM is associated with reduced neurofibromin expression and increased pERK levels in the hilus of En2−/− adult mice. These data lead us to hypothesize that a marked dysregulation of neurofibromin/ERK pathways in the hippocampus might contribute to learning deficits in the En2 mouse model of ASD. To test this hypothesis, we used lovastatin, an indirect inhibitor of ERK phosphorylation, to reduce pERK levels and rescue learning deficits in of En2−/− mice. While being able to decrease ERK phosphorylation, lovastatin was unable to rescue learning deficits in MWM-trained mutant mice.
Spatial learning deficits were previously reported in En2−/− adult mice (Cheh et al., 2006; Brielmaier et al., 2012). Our results, obtained on an independent colony of En2 mice (though generated from the same original En2tm1Alj strain, and maintained on a similar genetic background; Sgadò et al., 2013a), are in good accordance with previous studies, thus confirming that spatial learning deficits are a specific behavioral trait of En2−/− adult mice. As compared with WT mice, En2 mutants showed an increased latency to platform during trials, and lack of quadrant selectivity in two of three measurements (proximity score and platform crossing but not time spent in the target quadrant) during the probe trial. Our results slightly differ from those reported by Brielmaier et al. (2012), who showed significant differences between WT and En2−/− mice also in time spent in target quadrant. This might be explained by the slightly different genetic background of the En2 colonies used in the two studies. However, the proximity score is considered more sensitive for detecting group differences than traditional measures (time spent and number of crossings in the target quadrant; Maei et al., 2009). We also extended our behavioral analysis to a molecular level, by looking at Arc mRNA expression (extensively used as a molecular readout of task-dependent hippocampal learning; Guzowski et al., 2001), demonstrating that En2−/− mice display lower Arc mRNA levels following MWM.
A first, novel finding of this study is the increase in neurofibromin-positive hilar neurons in WT adult mice following MWM. This suggests that neurofibromin-containing hilar neurons and their circuits are profoundly modified during learning, and their modification may contribute to long-term effects of behavioral training. Indeed, neurofibromin has been recently implicated in inhibitory network rearrangements during working memory (Shilyansky et al., 2010). Most importantly, we demonstrate that En2−/− adult mice have reduced levels of neurofibromin in the hippocampus. Neurofibromin is the product of the Nf1 gene, whose heterozygous null mutation results in impaired hippocampal-dependent learning (Silva et al., 1997; Costa et al., 2002; Cui et al., 2008) and working memory deficits (Shilyansky et al., 2010) in mice. We hypothesized that reduced Nf1 expression might contribute to spatial learning deficits observed in En2−/− mice. The molecular mechanisms through which En2 regulates Nf1 expression remain to be elucidated. In the hippocampus, neurofibromin is coexpressed with En2 (Fig. 3A), and preliminary evidence from our laboratory indicates that the Nf1 gene promoter bears an En2 binding site, suggesting a direct transcriptional control of En2 on Nf1 expression. In En2−/− mice, MWM increased neurofibromin mRNA but not protein levels (Fig. 2), suggesting that an altered post-transcriptional control of neurofibromin expression (Skuse and Cappione, 1997) may occur in mutant mice.
Studies performed on Nf1+/− mice indicate that learning deficits associated with partial loss of neurofibromin are mainly due to altered Nf1 function in inhibitory neurons (Cui et al., 2008). Indeed, neurofibromin is expressed in SOM and NPY hilar interneurons (Fig. 3A) and partial loss of neurofibromin in the En2−/− hippocampus mainly occurs in the hilus (Fig. 2). Following MWM, SOM-positive but not NPY-positive interneurons coexpressing neurofibromin were less present in En2−/− mice, as compared with WT controls (Fig. 5), suggesting that altered neurofibromin function mainly occurs in SOM-positive interneurons in En2−/− mice. Interestingly, these neurons and their long-range connections to the entorhinal cortex have been recently implicated in spatial learning (Melzer et al., 2012).
We previously showed a partial loss of hilar interneurons in En2−/− adult mice (Sgadò et al., 2013a). This explains why we observed a lower number of neurofibromin-positive GABAergic interneurons in the hilus of En2−/− mice, as compared with WT mice (Figs. 2, 5), suggesting that loss of GABAergic inhibitory neurons and reduced GABA signaling in the hilus may also contribute to the MWM learning deficits observed in En2−/− mice. This hypothesis is in contrast with what was previously reported in Nf1+/− mice, in which GABA receptor signaling is instead enhanced and treatment with a GABA receptor inhibitor (picrotoxin) is sufficient to rescue working memory deficits (Cui et al., 2008).
A possible explanation of our results might rely on the localization of ERK phosphorylation in the hippocampus of WT and En2−/− mice before and after MWM. Immunoblotting experiments revealed no difference in pERK levels between the two genotypes; this might be explained by the different levels of pERK induction detected in different subfields of the En2−/− hippocampus before and after MWM (Figs. 4, 7). In agreement with previous findings (Valjent et al., 2004), pERK staining in WT and En2−/− naive mice was mainly observed in the mossy fibers, whereas pERK-positive neurons were barely detectable or totally absent throughout other hippocampal regions. After MWM, a general increase of pERK-positive neurons was observed in both WT and En2−/− mice, confirming that pERK upregulation is a reliable marker of behavior-dependent anatomical plasticity. Most importantly, a higher number of pERK-positive hilar neurons was observed in En2−/− mice after MWM, confirming that neurofibromin deficits result in pERK induction. However, the number of pERK-positive hilar interneurons coexpressing neurofibromin was very low (Fig. 5), and a higher number of pERK-positive neurons was also detected in the GCL of MWM En2−/− mice, where neurofibromin downregulation was not detected (Fig. 2C,F). Moreover, the increase of pERK-positive neurons following MWM was less evident in En2−/− mice in the CA3 (where neurofibromin expression did not differ between WT and En2−/− mice; Fig. 7C). Thus, neurofibromin-dependent pathways different from the RAS/ERK cascade might underlie hippocampal-dependent learning deficits observed in En2 mutants. In this animal model, loss of GABAergic neurons might be one of the key factors underlying spatial learning impairment. Indeed, recent findings demonstrate that optogenetic inhibition of hilar GABAergic interneuron activity is able to impair spatial learning and memory retrieval (Andrews-Zwilling et al., 2012).
In the recent years, several mouse models of ASD have been characterized, with the major aim to identify novel pharmacological targets, and encouraging results have been obtained in some instances (Silverman et al., 2010; Han et al., 2012, 2014; Provenzano et al., 2012; Delorme et al., 2013). Here we described for the first time that reduced neurofibromin expression and deregulated ERK phosphorylation are associated with impaired learning in the En2 model of ASD. However, pharmacological inhibition of ERK activity by lovastatin treatment was not able to reverse learning deficits in En2−/− mice, as instead previously shown in Nf1+/− mice (Li et al., 2005).
The question of whether we can rescue learning deficits in En2−/− mice remains open. As discussed above, our results suggest that neurofibromin-dependent pathways different from the RAS/ERK cascade might be involved in hippocampal-dependent learning impairment observed in En2 mutants. Indeed, neurofibromin is known also to regulate the mTOR pathway (Dasgupta et al., 2005; Johannessen et al., 2005), which has been found to be deregulated in mouse models of neurodevelopmental disorders (Ricciardi et al., 2011; Tsai et al., 2012). Moreover, our recent transcriptome study indicates that several signaling pathways, different from those involving ERK phosphorylation, are deregulated in the hippocampus of adult En2−/− mice (Sgadò et al., 2013b). Finally, a recent study showed that treatment with a noradrenergic agonist did not completely rescue learning and memory deficits in En2−/− mice (Brielmaier et al., 2014), suggesting that cognitive learning is hardly restored after pharmacological treatment in these mutants. Thus, further investigation is needed to unravel the complex molecular mechanisms linking dysregulation of the neurofibromin pathway to spatial learning deficits in the En2 mouse model of ASD.
Footnotes
P.S. is supported by Provincia Autonoma di Trento (Italy) under the Marie Curie-People co-funding action of the European Community. This work was funded by the Italian Ministry of University and Research (PRIN 2008 Grant 200894SYW2_002 and PRIN 2010–2011 Grant 2010N8PBAA_002 to Y.B.) and the University of Trento (CIBIO start-up grant to S.C. and Y.B.). We thank Dr. Patrizia D'Adamo (Dulbecco Telethon Institute, Italy) for helpful comments.
The authors declare no competing financial interests.
References
- Allegra M, Genovesi S, Maggia M, Cenni MC, Zunino G, Sgadò P, Caleo M, Bozzi Y. Altered GABAergic markers, increased binocularity and reduced plasticity in the visual cortex of Engrailed-2 knockout mice. Front Cell Neurosci. 2014;8:163. doi: 10.3389/fncel.2014.00163. [DOI] [PMC free article] [PubMed] [Google Scholar]
- Andrews-Zwilling Y, Gillespie AK, Kravitz AV, Nelson AB, Devidze N, Lo I, Yoon SY, Bien-Ly N, Ring K, Zwilling D, Potter GB, Rubenstein JL, Kreitzer AC, Huang Y. Hilar GABAergic interneuron activity controls spatial learning and memory retrieval. PLoS One. 2012;7:e40555. doi: 10.1371/journal.pone.0040555. [DOI] [PMC free article] [PubMed] [Google Scholar]
- Benayed R, Choi J, Matteson PG, Gharani N, Kamdar S, Brzustowicz LM, Millonig JH. Autism-associated haplotype affects the regulation of the homeobox gene, ENGRAILED 2. Biol Psychiatry. 2009;66:911–917. doi: 10.1016/j.biopsych.2009.05.027. [DOI] [PMC free article] [PubMed] [Google Scholar]
- Brielmaier J, Matteson PG, Silverman JL, Senerth JM, Kelly S, Genestine M, Millonig JH, DiCicco-Bloom E, Crawley JN. Autism-relevant social abnormalities and cognitive deficits in engrailed-2 knockout mice. PLoS One. 2012;7:e40914. doi: 10.1371/journal.pone.0040914. [DOI] [PMC free article] [PubMed] [Google Scholar]
- Brielmaier J, Senerth JM, Silverman JL, Matteson PG, Millonig JH, DiCicco-Bloom E, Crawley JN. Chronic desipramine treatment rescues depression-related, social and cognitive deficits in Engrailed-2 knockout mice. Genes Brain Behav. 2014;13:286–298. doi: 10.1111/gbb.12115. [DOI] [PMC free article] [PubMed] [Google Scholar]
- Cheh MA, Millonig JH, Roselli LM, Ming X, Jacobsen E, Kamdar S, Wagner GC. En2 knockout mice display neurobehavioral and neurochemical alterations relevant to autism spectrum disorder. Brain Res. 2006;1116:166–176. doi: 10.1016/j.brainres.2006.07.086. [DOI] [PubMed] [Google Scholar]
- Costa RM, Federov NB, Kogan JH, Murphy GG, Stern J, Ohno M, Kucherlapati R, Jacks T, Silva AJ. Mechanism for the learning deficits in a mouse model of neurofibromatosis type 1. Nature. 2002;415:526–530. doi: 10.1038/nature711. [DOI] [PubMed] [Google Scholar]
- Cui Y, Costa RM, Murphy GG, Elgersma Y, Zhu Y, Gutmann DH, Parada LF, Mody I, Silva AJ. Neurofibromin regulation of ERK signaling modulates GABA release and learning. Cell. 2008;135:549–560. doi: 10.1016/j.cell.2008.09.060. [DOI] [PMC free article] [PubMed] [Google Scholar]
- Dasgupta B, Yi Y, Chen DY, Weber JD, Gutmann DH. Proteomic analysis reveals hyperactivation of the mammalian target of rapamycin pathway in neurofibromatosis 1-associated human and mouse brain tumors. Cancer Res. 2005;65:2755–2760. doi: 10.1158/0008-5472.CAN-04-4058. [DOI] [PubMed] [Google Scholar]
- Dawson G, Webb S, Schellenberg GD, Dager S, Friedman S, Aylward E, Richards T. Defining the broader phenotype of autism: genetic, brain, and behavioral perspectives. Dev Psychopathol. 2002;14:581–611. doi: 10.1017/s0954579402003103. [DOI] [PubMed] [Google Scholar]
- Delorme R, Ey E, Toro R, Leboyer M, Gillberg C, Bourgeron T. Progress toward treatments for synaptic defects in autism. Nat Med. 2013;19:685–694. doi: 10.1038/nm.3193. [DOI] [PubMed] [Google Scholar]
- Dunleavy M, Provenzano G, Henshall DC, Bozzi Y. Kainic acid-induced seizures modulate Akt (SER473) phosphorylation in the hippocampus of dopamine D2 receptor knockout mice. J Mol Neurosci. 2013;49:202–210. doi: 10.1007/s12031-012-9927-x. [DOI] [PMC free article] [PubMed] [Google Scholar]
- Fasano S, Brambilla R. Ras-ERK signaling in behavior: old questions and new perspectives. Front Behav Neurosci. 2011;5:79. doi: 10.3389/fnbeh.2011.00079. [DOI] [PMC free article] [PubMed] [Google Scholar]
- Gharani N, Benayed R, Mancuso V, Brzustowicz LM, Millonig JH. Association of the homeobox transcription factor, ENGRAILED 2, with autism spectrum disorder. Mol Psychiatry. 2004;9:474–484. doi: 10.1038/sj.mp.4001498. [DOI] [PubMed] [Google Scholar]
- Gherbassi D, Simon HH. The engrailed transcription factors and the mesencephalic dopaminergic neurons. J Neural Transm. 2006;(Suppl 70):47–55. doi: 10.1007/978-3-211-45295-0_9. [DOI] [PubMed] [Google Scholar]
- Gutmann DH, Parada LF, Silva AJ, Ratner N. Neurofibromatosis type 1: modeling CNS dysfunction. J Neurosci. 2012;32:14087–14093. doi: 10.1523/JNEUROSCI.3242-12.2012. [DOI] [PMC free article] [PubMed] [Google Scholar]
- Guzowski JF, Setlow B, Wagner EK, McGaugh JL. Experience-dependent gene expression in the rat hippocampus after spatial learning: a comparison of the immediate-early genes Arc, c-fos, and zif268. J Neurosci. 2001;21:5089–5098. doi: 10.1523/JNEUROSCI.21-14-05089.2001. [DOI] [PMC free article] [PubMed] [Google Scholar]
- Han S, Tai C, Westenbroek RE, Yu FH, Cheah CS, Potter GB, Rubenstein JL, Scheuer T, de la Iglesia HO, Catterall WA. Autistic-like behaviour in Scn1a+/- mice and rescue by enhanced GABA-mediated neurotransmission. Nature. 2012;489:385–390. doi: 10.1038/nature11356. [DOI] [PMC free article] [PubMed] [Google Scholar]
- Han S, Tai C, Jones CJ, Scheuer T, Catterall WA. Enhancement of inhibitory neurotransmission by GABAA receptors having α2,3-subunits ameliorates behavioral deficits in a mouse model of autism. Neuron. 2014;81:1282–1289. doi: 10.1016/j.neuron.2014.01.016. [DOI] [PMC free article] [PubMed] [Google Scholar]
- James SJ, Shpyleva S, Melnyk S, Pavliv O, Pogribny IP. Complex epigenetic regulation of Engrailed-2 (EN-2) homeobox gene in the autism cerebellum. Transl Psychiatry. 2013;3:e232. doi: 10.1038/tp.2013.8. [DOI] [PMC free article] [PubMed] [Google Scholar]
- Johannessen CM, Reczek EE, James MF, Brems H, Legius E, Cichowski K. The NF1 tumor suppressor critically regulates TSC2 and mTOR. Proc Natl Acad Sci U S A. 2005;102:8573–8578. doi: 10.1073/pnas.0503224102. [DOI] [PMC free article] [PubMed] [Google Scholar]
- Joyner AL. Engrailed, Wnt and Pax genes regulate midbrain–hindbrain development. Trends Genet. 1996;12:15–20. doi: 10.1016/0168-9525(96)81383-7. [DOI] [PubMed] [Google Scholar]
- Joyner AL, Herrup K, Auerbach BA, Davis CA, Rossant J. Subtle cerebellar phenotype in mice homozygous for a targeted deletion of the En-2 homeobox. Science. 1991;251:1239–1243. doi: 10.1126/science.1672471. [DOI] [PubMed] [Google Scholar]
- Kita T, Brown MS, Goldstein JL. Feedback regulation of 3-hydroxy-3-methylglutaryl coenzyme A reductase in livers of mice treated with Mevinolin, a competitive inhibitor of the reductase. J Clin Invest. 1980;66:1094–1100. doi: 10.1172/JCI109938. [DOI] [PMC free article] [PubMed] [Google Scholar]
- Kuemerle B, Zanjani H, Joyner A, Herrup K. Pattern deformities and cell loss in Engrailed-2 mutant mice suggest two separate patterning events during cerebellar development. J Neurosci. 1997;17:7881–7889. doi: 10.1523/JNEUROSCI.17-20-07881.1997. [DOI] [PMC free article] [PubMed] [Google Scholar]
- Li W, Cui Y, Kushner SA, Brown RA, Jentsch JD, Frankland PW, Cannon TD, Silva AJ. The HMG-CoA reductase inhibitor lovastatin reverses the learning and attention deficits in a mouse model of neurofibromatosis type 1. Curr Biol. 2005;15:1961–1967. doi: 10.1016/j.cub.2005.09.043. [DOI] [PubMed] [Google Scholar]
- Maei HR, Zaslavsky K, Teixeira CM, Frankland PW. What is the most sensitive measure of water maze probe test performance? Front Integr Neurosci. 2009;3:4. doi: 10.3389/neuro.07.004.2009. [DOI] [PMC free article] [PubMed] [Google Scholar]
- Melzer S, Michael M, Caputi A, Eliava M, Fuchs EC, Whittington MA, Monyer H. Long-range-projecting GABAergic neurons modulate inhibition in hippocampus and entorhinal cortex. Science. 2012;335:1506–1510. doi: 10.1126/science.1217139. [DOI] [PubMed] [Google Scholar]
- Moy SS, Nadler JJ, Magnuson TR, Crawley JN. Mouse models of autism spectrum disorders: the challenge for behavioral genetics. Am J Med Genet C Semin Med Genet. 2006;142C:40–51. doi: 10.1002/ajmg.c.30081. [DOI] [PubMed] [Google Scholar]
- Provenzano G, Zunino G, Genovesi S, Sgadó P, Bozzi Y. Mutant mouse models of autism spectrum disorders. Dis Markers. 2012;33:225–239. doi: 10.1155/2012/916082. [DOI] [PMC free article] [PubMed] [Google Scholar]
- Ricciardi S, Boggio EM, Grosso S, Lonetti G, Forlani G, Stefanelli G, Calcagno E, Morello N, Landsberger N, Biffo S, Pizzorusso T, Giustetto M, Broccoli V. Reduced AKT/mTOR signaling and protein synthesis dysregulation in a Rett syndrome animal model. Hum Mol Genet. 2012;20:1182–1196. doi: 10.1093/hmg/ddq563. [DOI] [PubMed] [Google Scholar]
- Sgadò P, Genovesi S, Kalinovsky A, Zunino G, Macchi F, Allegra M, Murenu E, Provenzano G, Tripathi PP, Casarosa S, Joyner AL, Bozzi Y. Loss of GABAergic neurons in the hippocampus and cerebral cortex of Engrailed-2 null mutant mice: implications for autism spectrum disorders. Exp Neurol. 2013a;247:496–505. doi: 10.1016/j.expneurol.2013.01.021. [DOI] [PMC free article] [PubMed] [Google Scholar]
- Sgadò P, Provenzano G, Dassi E, Adami V, Zunino G, Genovesi S, Casarosa S, Bozzi Y. Transcriptome profiling in Engrailed2 knockout mice reveals common molecular pathways associated with ASD. Mol Autism. 2013b;4:51. doi: 10.1186/2040-2392-4-51. [DOI] [PMC free article] [PubMed] [Google Scholar]
- Shilyansky C, Karlsgodt KH, Cummings DM, Sidiropoulou K, Hardt M, James AS, Ehninger D, Bearden CE, Poirazi P, Jentsch JD, Cannon TD, Levine MS, Silva AJ. Neurofibromin regulates corticostriatal inhibitory networks during working memory performance. Proc Natl Acad Sci U S A. 2010;107:13141–13146. doi: 10.1073/pnas.1004829107. [DOI] [PMC free article] [PubMed] [Google Scholar]
- Silva AJ, Frankland PW, Marowitz Z, Friedman E, Laszlo GS, Cioffi D, Jacks T, Bourtchuladze R. A mouse model for the learning and memory deficits associated with neurofibromatosis type I. Nat Genet. 1997;15:281–284. doi: 10.1038/ng0397-281. [DOI] [PubMed] [Google Scholar]
- Silverman JL, Yang M, Lord C, Crawley JN. Behavioural phenotyping assays for mouse models of autism. Nat Rev Neurosci. 2010;11:490–502. doi: 10.1038/nrn2851. [DOI] [PMC free article] [PubMed] [Google Scholar]
- Skuse GR, Cappione AJ. RNA processing and clinical variability in neurofibromatosis type I (NF1) Hum Mol Genet. 1997;6:1707–1712. doi: 10.1093/hmg/6.10.1707. [DOI] [PubMed] [Google Scholar]
- Tripathi PP, Sgadò P, Scali M, Viaggi C, Casarosa S, Simon HH, Vaglini F, Corsini GU, Bozzi Y. Increased susceptibility to kainic acid-induced seizures in Engrailed-2 knockout mice. Neuroscience. 2009;159:842–849. doi: 10.1016/j.neuroscience.2009.01.007. [DOI] [PubMed] [Google Scholar]
- Tsai PT, Hull C, Chu Y, Greene-Colozzi E, Sadowski AR, Leech JM, Steinberg J, Crawley JN, Regehr WG, Sahin M. Autistic-like behaviour and cerebellar dysfunction in Purkinje cell Tsc1 mutant mice. Nature. 2012;488:647–651. doi: 10.1038/nature11310. [DOI] [PMC free article] [PubMed] [Google Scholar]
- Valjent E, Pagès C, Hervé D, Girault JA, Caboche J. Addictive and nonaddictive drugs induce distinct and specific patterns of ERK activation in mouse brain. Eur J Neurosci. 2004;19:1826–1836. doi: 10.1111/j.1460-9568.2004.03278.x. [DOI] [PubMed] [Google Scholar]
- van Praag H, Kempermann G, Gage FH. Running increases cell proliferation and neurogenesis in the adult mouse dentate gyrus. Nat Neurosci. 1999;2:266–270. doi: 10.1038/6368. [DOI] [PubMed] [Google Scholar]