

Abstract
The mechanisms of action of many CNS drugs have been studied extensively on the level of their target proteins, but the effects of these compounds on the level of complex CNS networks that are composed of different types of excitatory and inhibitory neurons are not well understood. Many currently used anticonvulsant drugs are known to exert potent use-dependent blocking effects on voltage-gated Na+ channels, which are thought to underlie the inhibition of pathological high-frequency firing. However, some GABAergic inhibitory neurons are capable of firing at very high rates, suggesting that these anticonvulsants should cause impaired GABAergic inhibition. We have, therefore, studied the effects of anticonvulsant drugs acting via use-dependent block of voltage-gated Na+ channels on GABAergic inhibitory micronetworks in the rodent hippocampus. We find that firing of pyramidal neurons is reliably inhibited in a use-dependent manner by the prototypical Na+ channel blocker carbamazepine. In contrast, a combination of intrinsic and synaptic properties renders synaptically driven firing of interneurons essentially insensitive to this anticonvulsant. In addition, a combination of voltage imaging and electrophysiological experiments reveal that GABAergic feedforward and feedback inhibition is unaffected by carbamazepine and additional commonly used Na+ channel-acting anticonvulsants, both in control and epileptic animals. Moreover, inhibition in control and epileptic rats recruited by in vivo activity patterns was similarly unaffected. These results suggest that sparing of inhibition is an important principle underlying the powerful reduction of CNS excitability exerted by anticonvulsant drugs.
Keywords: anticonvulsants, carbamazepine, epilepsy, inhibition, interneurons
Introduction
Numerous drugs have been developed for conditions such as epilepsy, migraine, or pain that are capable of strongly modifying excitability in the brain. The mechanisms of action of many of these compounds have been meticulously studied on the level of their target receptors and ion channels (Rogawski and Löscher, 2004). These studies have provided an indispensable starting point to understand drug actions in the CNS. However, the mechanisms underlying the modification of excitability on the level of complex brain micronetworks have remained elusive for virtually all CNS drugs. This is primarily because little is known about the cell-type-specific effects of these compounds on the many different neuron types present in the CNS. In particular, the effects of CNS drugs on inhibitory interneurons that mediate most of the synaptic inhibition in the brain and are crucially important in many forms of synchronization (for review, see Freund and Buzsaki, 1996; McBain and Fisahn, 2001) have not been studied.
Use-dependent Na+ channel blockers are clinically used to treat several neurological disorders, including epilepsy, migraine, and chronic pain, and are thought to act via a preferential inhibition of pathological high-frequency neuronal firing (Mantegazza et al., 2010). The question whether use-dependent Na+ channel blockers act on interneuron firing and the synaptic inhibition they mediate is particularly pertinent because some interneuron types are capable of firing at very high rates (Freund and Buzsaki, 1996; Ascoli et al., 2008). Thus, use-dependent Na+ channel blockers would be expected to strongly inhibit these interneurons, and thereby synaptic inhibition. This idea is not easily reconciled with the observed strong reduction of excitation and anticonvulsant actions of use-dependent Na+ channel blockers. Despite these conceptual problems, and despite the fact that use-dependent Na+ channel blockers have been a mainstay of anticonvulsant drug therapy for the past 30 years, nothing is known about the effects of these anticonvulsants on GABAergic interneurons. We, therefore, examined how classic use-dependent Na+ channel blockers affect the intrinsic properties of interneurons as well as inhibitory feedforward and feedback microcircuits in the hippocampus. We find that GABAergic inhibition is essentially insensitive to anticonvulsant drugs because of a combination of intrinsic pharmacological properties of GABAergic interneurons and the dynamics of their recruitment in feedforward and feedback inhibitory microcircuits.
Materials and Methods
All animal experiments were conducted in accordance with the guidelines of the Animal Care and Use Committees of the University of Bonn, the University of Szeged, and the Instituto Cajal, CSIC, Madrid and were approved by the ethics committees of these institutions.
Pilocarpine model of epilepsy.
All slice experiments in chronically epileptic animals were performed in the pilocarpine model of epilepsy. Pilocarpine treatment of rats was performed mainly as described previously (Su et al., 2002). Briefly, male Wistar rats (150–180 g) were given intraperitoneal injections of pilocarpine hydrochloride (340 mg/kg body weight; Sigma-Aldrich) 30 min after a subcutaneous injection of 1 mg/kg scopolamine methyl nitrate (Sigma-Aldrich) to reduce peripheral cholinergic side effects. After pilocarpine injection, ∼50% of the animals developed a limbic status epilepticus (SE) that was terminated by injection of 1 ml of diazepam 40 min after onset (0.5%; Ratiopharm). In animals that did not develop SE after the first injection of pilocarpine, a second identical injection of pilocarpine was administered. After SE, rats received a single subcutaneous injection of 1 ml of Ringer's solution and 1 ml of glucose solution and were kept in separate cages. Animals were video monitored for 7 d starting 17 d after injection. Only rats displaying at least one spontaneous seizure were included in this study. Experiments were conducted 4–8 weeks after experimentally induced SE. Sham-control animals were treated in an identical manner but were given injections of saline instead of pilocarpine. In this study, sham-control and normal age-matched Wistar rats were pooled.
Kainate model of epilepsy.
For juxtacellular recording, kainate-injected rats were used because they provided a better yield compared with pilocarpine-treated rats (L. Menendez de la Prida, unpublished observations). For the kainate model, male Wistar rats (150–189 g) were given intraperitoneal injections of several low doses of kainate (5 mg/kg) at hourly intervals until they developed a status epilepticus, as described previously (Suárez et al., 2012). SE was terminated by injecting animals with 4 mg/kg diazepam 1 h after initiation. Animals were used in the chronic phase, when they already started to exhibit spontaneous seizures, typically after 6–8 weeks after injection.
Slice preparation and patch-clamp recording.
Male Wistar rats (13.1 ± 0.2 weeks old) were deeply anesthetized with 1.5 ml of xylacine hydrochloride (2%; Bayer) and 0.5 ml of ketamine hydrochloride (10%; Pfizer) and transcardially perfused with an ice-cold preparation solution containing (in mm) 60 NaCl, 100 sucrose, 2.5 KCl, 1.25 NaH2PO4, 26 NaHCO3, 1 CaCl2, 5 MgCl2, and 20 d-glucose (equilibrated with 95% O2 and 5% CO2). Transverse 300-μm-thick hippocampal slices were prepared on a vibratome (Microm HM 650 V; Thermo Fisher Scientific). After equilibration for 30 min at 35°C in a preparation solution, slices were transferred to artificial CSF (ACSF) containing (in mm) 125 NaCl, 3 KCl, 1.25 NaH2PO4, 26 NaHCO3, 2.6 CaCl2, 1.3 MgCl2, and 15 d-glucose (equilibrated with 95% O2 and 5% CO2) and stored at room temperature. Slices were transferred to a submerged chamber perfused with ACSF and mounted on the stage of an upright microscope (Axioscope 2; Zeiss), and cells were visualized with infrared oblique illumination optics and a water-immersion objective (60×, 0.9 NA). Somatic whole-cell recordings of interneurons or pyramidal neurons in the CA1 region were obtained with an Axopatch 200B amplifier (Molecular Devices), a BVC-700 amplifier (Dagan Corporation), or a Multiclamp 700B amplifier (Molecular Devices). Data were filtered at 10 kHz and sampled at 100 kHz with a Digidata 1440 interface controlled by pClamp software (Molecular Devices). Recording electrodes were made from thick-walled borosilicate glass capillaries (GB 150F 8P; Science Products) on a vertical puller (PP-830; Narishige). Recording pipettes for whole-cell recordings had a resistance of 3–6 MΩ and were filled with (in mm) 140 K-gluconate, 5 HEPES, 0.16 EGTA, 0.5 MgCl2, 5 phosphocreatine, and 0.3% biocytin (pH 7.3, 280–290 mOsm). Series resistance ranged from 10 to 25 MΩ. The calculated liquid junction potential was −15 mV, and membrane potential values were corrected accordingly. Pipettes for loose-patch recording had a resistance of 7–10 MΩ and contained ACSF. Interneurons or pyramidal cells were visually identified under infrared differential interference contrast optics and further characterized functionally as well as morphologically by biocytin labeling and reconstruction (see Morphological reconstruction). All experiments were performed at 31–32°C.
Analysis of synaptic excitation of CA1 pyramidal cells.
Stimulation was performed with bipolar steel electrodes (FHC). Biphasic charge neutral pulses with a duration of 50–100 μs were generated with a stimulus isolator (model 2100; A-M Systems). For monosynaptic activation of CA1 pyramidal cells, we stimulated Schaffer collaterals by placing a stimulation electrode into the stratum radiatum. Carbamazepine (CBZ) effects on stimulation-induced action potential (AP) firing and EPSCs of CA1 pyramidal cells were assessed with either cell-attached recordings (Fig. 1G–I) or whole-cell recordings (Fig. 1J–L), respectively. Both experiments were conducted in the presence of the GABAA antagonist gabazine (SR 95531 hydrobromide, 10 μm; Tocris). Additionally, a cut was made between CA1 and CA3 to avoid network events attributable to the disinhibition of the recurrent CA3 network. In cell-attached recordings, stimulation strength was adjusted to elicit the maximal firing probability over the duration of the stimulus train (0.2–0.4 mA). During long stimulus protocols of 25 stimuli at 50 Hz, stimulation was repeated every 30s.
Figure 1.
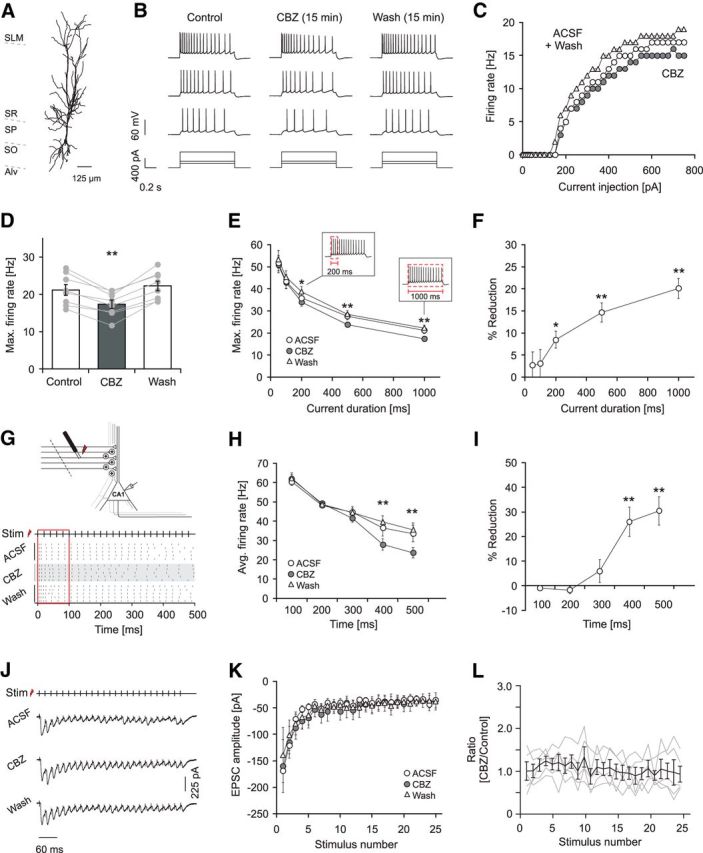
Carbamazepine effects on firing properties of principal neurons. A, Morphological reconstruction of a representative pyramidal neuron. SLM, Stratum lacunosum moleculare; SO, Stratum oriens; SP, Stratum pyramidale; SR, Stratum radiatum; Alv, alveus. B, Effects of 30 μm CBZ on intrinsic firing induced by current injection (lowermost traces; 225, 400, and 700 pA, 1000 ms). C, Corresponding input–output relationship of the average firing rate during the 1 s current injection versus the magnitude of the current injection. D, Effects of CBZ on the maximal discharge frequency measured during the 1 s current injection (**p < 0.01). E, CBZ effects on the maximal firing rate measured during the first 50, 100, 200, 500, and 1000 ms of current duration (see insets; *p < 0.05, **p < 0.01, Wilcoxon signed rank test). F, Percent reduction in firing frequency by CBZ within the different time intervals shown in E (*p < 0.05, **p < 0.01, Wilcoxon signed rank test). G, Top, Recording configuration to examine CBZ effects on synaptically induced firing. Schaffer collaterals were stimulated with a bipolar steel electrode placed in the radiatum while firing was monitored with cell-attached recordings. To prevent recurrent excitation, a cut was made between CA1 and CA3. Bottom, Raster plot of action potential firing during a 50 Hz stimulus (Stim) train of 500 ms duration. All three conditions (control, application, and washout) were conducted in the presence of the GABAA blocker gabazine (10 μm). H, I, CBZ effects on the average firing frequency during consecutive 100 ms intervals (H) and the corresponding magnitude of reduction in synaptically driven firing frequency in percent (I; **p < 0.01, Wilcoxon signed rank test for both I and H). J–L, Effects of CBZ on Schaffer collateral EPSCs (25 stimuli at 50 Hz) recorded in the presence of 10 μm gabazine. Stimulation was performed as in G, and EPSCs were recorded in the whole-cell configuration. J, Representative recordings under control conditions (top trace), in 30 μm CBZ (middle trace), and after washout (bottom trace). Traces show averages from 10 consecutive sweeps, and stimulus artifacts were truncated. K, Quantification of peak EPSC amplitude showed no effect of CBZ on excitatory Schaffer collateral input. L, Peak EPSCs after CBZ application normalized to the mean of control and washout. Gray traces correspond to individual cells; the black trace shows average ± SEM.
Analysis of feedback and feedforward inhibition.
For activation of CA1 feedback microcircuits, we stimulated CA1 axons by placing a stimulation electrode into the alveus adjacent to the subiculum. This stimulation leads to antidromic activation of CA1 axons and recruitment of feedback inhibition. To prevent a direct monosynaptic excitation or inhibition, a cut was made at the CA1/subiculum border through strata lacunosum-moleculare, radiatum, pyramidale, and oriens with only the alveus left intact (Pouille and Scanziani, 2004). A second cut was made at the CA1/CA3 border to limit spontaneous activity in CA1 neurons. Inhibitory IPSCs were recorded from pyramidal neurons that result from activation of feedback interneurons. To isolate the GABAergic IPSC unequivocally, the GABAA receptor antagonist gabazine (SR 95531 hydrobromide, 10 μm; Tocris) was applied at the end of all stimulation experiments, and the IPSC component was isolated by subtraction. For these recordings, pyramidal neurons were clamped at −65 mV. This procedure usually revealed no or only a minor excitatory component, indicating that contamination by Schaffer collateral or recurrent excitatory CA1 input is negligible in this paradigm (see Fig. 6B,C). During all stimulation experiments, the GABAB blocker CGP 52432 (500 nm; Tocris) was present in the bath solution.
Figure 6.

Carbamazepine effects on GABAergic feedback inhibition. A, Recording configuration used to elicit feedback inhibition. B, C, Representative recordings of feedback PSCs with sequential application of 30 μm CBZ, washout of CBZ, and application of 10 μm gabazine (leftmost traces). Feedback IPSCs were isolated by subtracting traces in the presence of gabazine from all other traces (rightmost traces; B, 50 Hz stimulation; C, 100 Hz stimulation). D, Quantification of the CBZ effect on peak IPSCs during 50 and 100 Hz stimulation. Top, Averaged IPSC amplitudes under control conditions, in the presence of CBZ and after washout. Bottom, Peak IPSCs after CBZ application normalized to the mean of control and washout. Gray traces correspond to individual cells; the black trace shows average ± SEM.
The firing behavior of interneurons during activation of feedback microcircuits was examined with cell-attached recordings and subsequent repatching with a whole-cell electrode. In the case of the cell-attached recordings, stimulation strength was adjusted at a stimulation frequency of 50 Hz to elicit a firing probability of ≥90% in response to at least one of the first four stimuli. Stimulation paradigms were applied at either 0.1 (5 or 10 stimuli per train) or 0.033 Hz (25 stimuli per train). In the absence of any drug application, the firing probability of all classes of interneurons was stable over at least 15 min [basket cells (BCs): n = 5, p = 0.96; proximal dendritic (PD) cells: n = 5, p = 0.28; OLM cells: n = 4, p = 0.54; paired t test]. To prevent contamination by reciprocal inhibition between interneurons, gabazine (10 μm) was present during the whole experiment.
For activation of feedforward inhibition within the CA1 subfield, a stimulation electrode was placed into the pyramidal cell layer of CA3, and pyramidal cells were recorded in CA1 in the whole-cell mode. In these recordings, we frequently noted the appearance of stimulation-evoked compound EPSCs in CA1 neurons after application of gabazine. These are probably caused by stimulation-evoked recurrent activity in the CA3 network. To exclude that CBZ effects on EPSC components might contaminate the assessment of effects on IPSCs, we examined the effect of CBZ on Schaffer collateral EPSCs in separate recordings. In these experiments, we failed to see an effect on EPSCs (Fig. 1J–L). In these recordings, the CA3 subfield was separated from CA1 with a cut to prevent propagation of spontaneous activity in the CA3 region during gabazine application to the CA1 subfield.
Pharmacology.
Anticonvulsants were obtained from Sigma-Aldrich [CBZ and phenytoin (PHT)] or Tocris [lamotrigine (LTG)] and used in concentrations in a range that is found in brain tissue from epilepsy patients (Rambeck et al., 2006). CBZ (final concentration, 30 μm) was dissolved in ethanol, whereas LTG (final concentration, 25 μm) and PHT (final concentration, 50 μm) were directly dissolved in ACSF. Control ACSF, therefore, contained either equivalent concentrations of ethanol compared with the CBZ-containing solution (0.05%) or no solvent. Drug effects were analyzed 15 min after initiating the drug application. A washout was conducted for at least 15 min. The analysis of the effects of CBZ on maximal firing rates was done by identifying the current injection at which maximal firing rates were obtained under control conditions. Effects of CBZ and washout were quantified using this current injection magnitude. The baseline membrane potential was adjusted to −75 mV by current injection for all measurements. For analysis of AP properties, traces with two action potentials in the first 50 ms of current injection were selected, and the first AP was analyzed. In addition, we also examined APs occurring later during the current injection (300–500 ms after onset). Since both the AP properties themselves and the effects of CBZ will be influenced by the number of preceding action potentials, we selected traces with ∼10 APs in the first 500 ms of current injection (average time of peak of the analyzed AP, 427.4 ± 12.1 ms; average number of preceding APs, 10.8 ± 0.6). In individual cells, the current injection steps were selected such that the number of APs within the first 500 ms of the current injection in ACSF, in CBZ, and after washout was identical.
Input resistance was calculated from small voltage deflections induced by current injections ranging from −50 to +50 pA with a linear fit (IGOR PRO; Wavemetrics). τ was estimated using negative current injections and a standard exponential fit (Clampfit 10.2; Molecular Devices).
Morphological reconstruction.
Slices containing biocytin-filled cells were incubated at 4°C in paraformaldehyde (4%) dissolved in 0.1 phosphate buffer (PB; pH 7.4). For biocytin staining, slices were washed in 0.15 m PBS and permeabilized for 30 min with Triton X-100 (0.4% in PBS). Slices were then incubated for 2 h in Strepavidin Alexa Fluor 488 (1:500 in PBS and 0.1% Triton X-100). Subsequently, sections were washed in 0.1 m PB three times for 5 min and mounted with Aqua-Poly/Mount. Filled neurons were scanned on a confocal microscope (TriM Scope Confocal, 20-fold magnification; LaVision BioTec) and reconstructed from z-stacks (step size, 2 μm) using Corel DRAW Graphics Suite 12.
Fast CCD voltage imaging.
To visualize voltage changes of excitable membranes in the CA1 field, 350 μm hippocampal slices were kept in an interface chamber and incubated with 100 μm of the naphthylstyryl-pyridinium dye di-3-ANEPPDHQ (C30H43Br2N3O2; Invitrogen) in ACSF for 15 min before the experiment. While stimulating either the recurrent interneuronal population with a stimulation electrode within the alveus or while stimulating Schaffer collateral inputs with a stimulation electrode in the CA3 subfield (see section analysis of feedback and feedforward inhibition above), we acquired epifluorescence images with a fast CCD camera at a 1 kHz frame rate (80 × 80 pixels, NeuroCCD; RedShirtImaging). The fluorescent dye was excited using an optoLED driven by a stable power supply (Cairn Research). We acquired images of the whole CA1 subfield by using a low-magnification objective (XLFLUOR 4×, 0.28 NA; Olympus). All technical instruments were switched on at least 30 min before recordings to avoid thermal drift. Voltage signals were recorded at 32.5 ± 1°C. Data were analyzed using custom-made routines in IGOR PRO (Wavemetrics). Correction for bleaching was performed by subtracting a double-exponential fit of traces (see Fig. 8A, orange lines superimposed on the fluorescence trace). Peak changes in fluorescence (% ΔF/F) of excitatory signals (fast, negative peaks) were obtained in a 36 ms time window during stimulation. Peak inhibitory signals (slower, positive peaks; see Fig. 8A for examples) were obtained in a 92 ms time window after the excitatory signal. The average fluorescence of 100 ms before each single stimulation pulse was used as the baseline.
Figure 8.
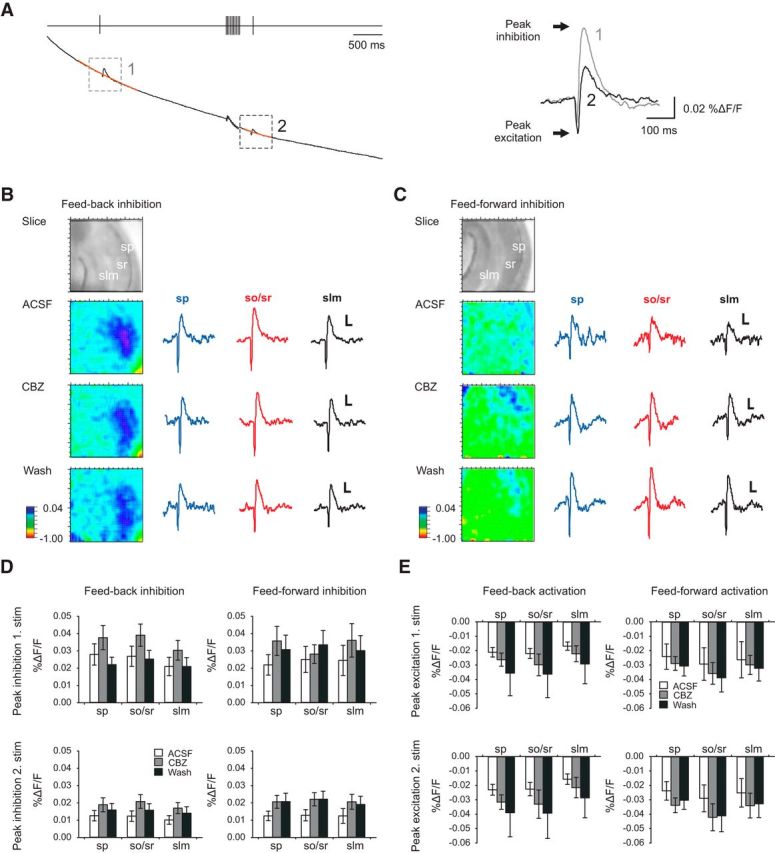
Voltage-dependent dye imaging. A, Stimulation paradigm for voltage imaging (top trace). The raw trace of the fluorescent signal (black) shows the first and second inhibitory events with the interspersed high-frequency stimulation train. Double-exponential fits were used for bleaching correction; these are superimposed in orange on the raw fluorescent traces. Right, Magnification of processed signal (% ΔF/F, with bleaching correction). Arrows indicate peak inhibition (positive peak) and peak excitation (negative peak). B, C, Effects of CBZ on feedback (B) and feedforward (C) inhibition measured using voltage imaging. Pseudo color images indicate inhibitory voltage signals across the CA1 subfield (color scale is from −1 to 0.04% ΔF/F). The traces correspond to the voltage signals (calibration: 0.01% ΔF/F, 50 ms) obtained in stratum pyramidale (sp; red trace), stratum oriens/radiatum (so/sr; blue trace), and stratum lacunosum moleculare (slm; green trace). D, Averaged peak inhibitory voltage signals for feedback inhibition (n = 10) and feedforward inhibition (n = 9) within the different laminae. Top, first inhibitory event; bottom, second inhibitory event. E, Averaged data for the first excitatory voltage signal and the second excitatory voltage signal evoked by alveus stimulation (feedback, left, n = 10) and CA3 stimulation (feedforward, right, n = 9).
In vivo single-cell recordings and analysis.
Single-cell recordings were obtained juxtacellularly in freely moving Wistar rats during awake resting periods or during sleep using a custom-made microdrive for glass pipettes adapted from Korshunov (1995). Both normal and kainate-injected epileptic rats (300–400 g) were implanted with the microdrive holder consisting of a plastic base with a cylindrical hole targeting the craniotomy (typically at 4.3 mm posterior to bregma and 2.5 mm lateral) under isoflurane anesthesia (1.5–2% mixed in oxygen 400–800 ml/min). The dura mater was left intact. A ground platinum/iridium wire (125 μm) implanted epidurally over the cerebellum served as reference. The craniotomy was cleaned with 0.05–0.07 mg/ml mitomycin C (Sigma-Aldrich) to reduce growth tissue, and the cylindrical hole was filled with agar (2.5–3.5%) and covered with a plastic cup to avoid drying. To habituate animals to microdrive mounting/remounting in awake and drug-free conditions, craniotomy cleaning was repeated over 4–5 consecutive days after surgery. Animals were habituated daily to the recording arena (40 × 40 cm) with water and food ad libitum. On the day of recording, the microdrive hosting a glass pipette (1.0 × 0.58 mm, ref. 601000; A-M Systems) filled with 1.5 or 2.5% Neurobiotin in 0.5 m NaCl (impedance, 4–8 μmΩ) was mounted in the microdrive electrode holder and gently advanced into the animal's brain (350 μm per revolution at 3–5 μm resolution). Recordings were obtained with a miniature preamplifier (ELC mini-preamplifier; NPI Electronic), carrying two LEDs, and connected to an Axoclamp-2B amplifier (Molecular Devices). A video camera was used to monitor the animal's behavior and to track its position in the recording arena. Single cells were targeted at the dorsal hippocampus following both stereotaxic and extracellular waveform criteria and electroporated with Neurobiotin as reported previously (Pinault 1996). After successful recordings, rats were perfused with 4% paraformaldehyde, and the CA1 pyramidal cell identity was confirmed using streptavidin-conjugated antibodies.
We focused on pyramidal cell activity recorded during high-frequency oscillations (HFOs) in normal and epileptic rats to evaluate the effect of representative firing patterns occurring during HFOs on the recruitment of local circuit interneurons in vitro (feedback IPSCs). To this purpose, juxtacellular recordings were (1) bandpass filtered (100–600 Hz) and smoothed for detecting HFOs in normal (ripples) and epileptic (generic fast ripples) rats by thresholding (>2.5 SD) and (2) high-pass filtered (>350 Hz) to detect positive spikes of the recorded cell. All HFO events were aligned by the peak of the power in the 100–600 Hz band (see Fig. 12A, top), and peri-event rasters and histograms (see Fig. 12A, middle and bottom) were constructed within a ±1 s time window. Data included here reflect representative firing patterns from n = 8 and n = 5 CA1 pyramidal cells from eight and four control and epileptic rats, respectively. We then used the firing patterns shown in Figure 12A (middle) to stimulate the alveus of slices prepared from both normal and epileptic rats and recorded the resulting feedback IPSCs in CA1 pyramidal cells (see Fig. 12B,C). In these experiments, only firing patterns with more than two action potentials were selected (see Fig. 12A, middle, red dots). Sweeps in which an HFO event occurred within a second after a previous HFO event were also not included into the stimulus pattern (corresponding action potentials are marked in gray). During stimulation, individual sweeps were separated by 5 s. The in vitro patch-clamp recordings shown in Figure 12B depict examples from a representative CA1 neuron from a sham and a post-SE animal. The traces are derived from averaging of individual current traces obtained by stimulation with the different firing patterns shown in Figure 12A.
Figure 12.
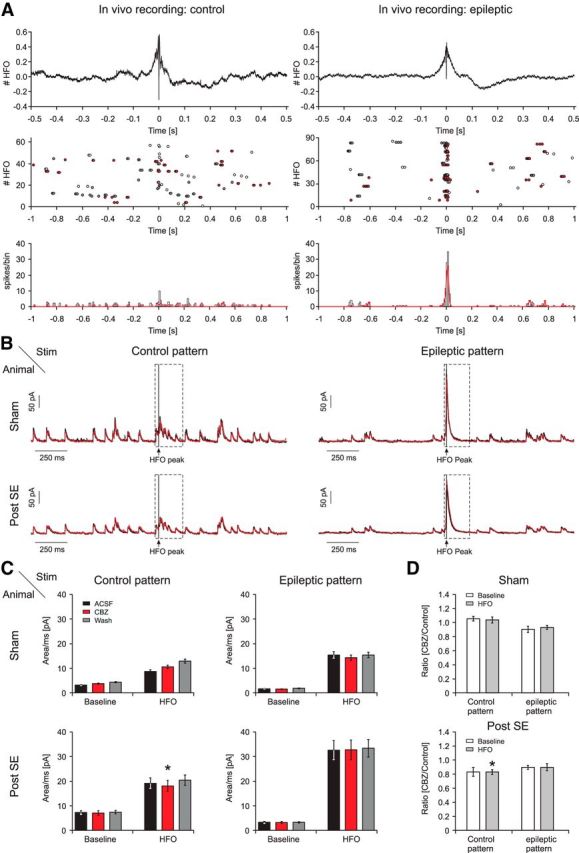
Effects of CBZ on feedback inhibition recruited by activity patterns generated from in vivo juxtacellular recordings. A, In vivo firing behavior of CA1 pyramidal cells in a representative control (left) and an epileptic (right) animal during HFOs in control (ripples) and kainate-treated (fast ripples) rats. Top, Averaged local field potential (LFP) recordings of HFOs during which single-cell spike patterns were obtained. HFOs were aligned to the HFO peaks before averaging (see Materials and Methods). Middle, Raster plot of action potential firing of a representative pyramidal cell ±1 s relative to the HFO peak. To generate stimulus patterns for in vitro experiments, only sweeps with more than two action potentials were selected (red dots). Sweeps in which an HFO event occurred within 1 s after a previous HFO event were also not included into the stimulus pattern (corresponding action potentials are marked in gray). Bottom, Histogram of all spikes relative to the HFO peak. Bin size, 10 ms. Red lines indicate distribution of action potentials selected for in vitro stimulus patterns. B, In vitro recordings of feedback IPSCs obtained with the selected stimulus patterns based on in vivo juxtacellular recordings (A, red dots). The traces shown are derived from averaging of individual current traces obtained by stimulation with the different firing patterns shown in A. Examples are shown for a cell from a sham-injected (top traces) and a cell from a chronically epileptic pilocarpine-treated (bottom traces) animal. Left, Stimulation was performed with the control stimulus patterns. Right, A recording obtained with the epileptic stimulus patterns. For all panels, averaged traces in control conditions (black trace), in the presence of CBZ (red trace), and after washout (gray trace) are shown. Stimulus artifacts were cut out. Stimulation was performed as in Figure 6. C, Quantification of the charge transfer during control (left) and epileptic (right) stimulus patterns. The inhibitory response during the HFO (B, dashed black box) and during the baseline surrounding the HFO was analyzed separately. D, Ratio of the charge transfer after application of CBZ relative to control conditions (mean of ACSF and washout). *p < 0.05, significant change relative to mean of ACSF and washout, Wilcoxon signed rank test.
Before analysis, stimulus artifacts were cut out. CBZ effects on the charge transfer were then estimated during HFOs (within a defined time interval ranging from −32.25 to 187.75 ms from the peak of HFOs; see Fig. 12B, dashed black box) as well as during baseline conditions.
Analysis and statistics.
Average values in the text and figures are expressed as mean ± SEM. To compensate for changes in intrinsic cell properties over recording duration (Xu et al., 2005) in all experiments, mean values of control recording before drug application and after a 15 min washout were compared with recordings 15 min after drug application. For statistical analysis, Wilcoxon signed rank tests or ANOVA were used as appropriate and as indicated in the text. In some cases, Tukey's post hoc tests were used to determine individual group differences. The properties of PSCs/PSPs were analyzed from an average of 10 sweeps (short stimulus trains with 5–10 stimuli) or 5 sweeps (long trains with 25 stimuli). Firing probabilities during the cell-attached recordings were calculated from 10 repetitions. In the case of the long trains with 25 stimuli, average firing frequencies were binned over 5 stimuli (100 ms).
Results
Effects of CBZ on pyramidal neuron firing
The prototypical use-dependent Na+ channel blocker CBZ (30 μm; Willow et al., 1985; Remy et al., 2003a,b) reliably inhibited firing of hippocampal pyramidal neurons induced by long (1 s) somatic current injections (Fig. 1A–C; reduction of average maximal firing rate by 20.1 ± 2.3%, n = 9, p = 0.008, Wilcoxon signed rank test, Fig. 1D). To further assess how the reduction of firing rates develops over the action potential train, we examined the maximal firing rates obtained for different time intervals from onset of the current injection (Fig. 1E) and calculated the percent reduction in firing rate obtained for these time intervals (Fig. 1F). Both analyses show that significant reductions of firing rates are obtained with current injections of a duration ≥200 ms (Fig. 1E,F, asterisks; Wilcoxon signed rank test).
We then went on to assess the sensitivity of CA1 pyramidal cell firing to CBZ when driven by synaptic inputs. We recorded from CA1 pyramidal neurons in the cell-attached configuration and stimulated the Schaffer collaterals electrically (25 stimuli at 50 Hz; Fig. 1G). As for somatic current injections, a significant block by CBZ was observed only late in the stimulus train after a period of 400 ms (Fig. 1H,I, asterisks indicate significant differences, Wilcoxon signed rank test, p = 0.004 for both the 400 and 500 ms time interval; n = 9).
We excluded that effects on firing were caused by direct effects on excitatory transmission driving action potentials. We evoked EPSCs by stimulation within the stratum radiatum in the presence of 10 μm gabazine. Recurrent activity was prevented with a cut between CA1 and CA3. Under these conditions, no CBZ effects on EPSCs were observed (Fig. 1J–L; n = 5).
Effects of CBZ on the firing behavior of different interneuron classes
Next, we investigated the effects of CBZ on the firing behavior of three classes of interneurons that innervate different compartments of CA1 pyramidal cells (Fig. 2A; representative examples are shown at the top). During long 1s current injections, firing of all three categories was significantly reduced, albeit to a different degree. The maximal average firing rate of perisomatically inhibiting BCs and oriens lacunosum-moleculare (OLM) interneurons, which innervate the distal apical trunk, was reduced by 23.6 ± 7.6% and 27.2 ± 6.7%, respectively (Fig. 2A,B; left: BCs, n = 7, p = 0.015; right: OLM cells, n = 7, p = 0.015; Wilcoxon signed rank test). In contrast, firing of cells that target the Schaffer collateral termination zone within the stratum radiatum and/or the stratum oriens (PD interneurons, consisting mainly of bistratified and trilaminar cells) was strongly affected (reduction of maximal average firing rate by 55.2 ± 7.6%; n = 7; p = 0.015, Wilcoxon signed rank test; Fig. 2A,B, middle). When comparing the effects of CBZ between pyramidal neurons and the different interneuron types, a stronger inhibition of proximal dendritic cells versus all other cell types was observed (ANOVA: F(3,25) = 6.543, p = 0.002; post hoc Tukey's test: p = 0.008, p = 0.022, and p = 0.002 vs basket cells, OLM cells, and pyramidal neurons, respectively; Fig. 3). Next, we examined how the CBZ effects on interneuron subtypes evolve with increasing current injection duration (Fig. 2C,D). Similar to pyramidal cells, all interneuron subtypes showed an increase in blocking effects with increasing current durations. In all three subtypes, significant effects of CBZ were observed for current injection durations ≥200 ms (Fig. 2C,D, *p < 0.05, Wilcoxon signed rank tests). Additionally, we examined the effects of CBZ on further passive and active cell properties in all neuron types (see summary of results in Tables 1 and 2). There were significant effects of CBZ on action potential properties of pyramidal neurons, basket cells, and OLM cells. However, in interneurons, these effects were invariably quite small (∼10%).
Figure 2.
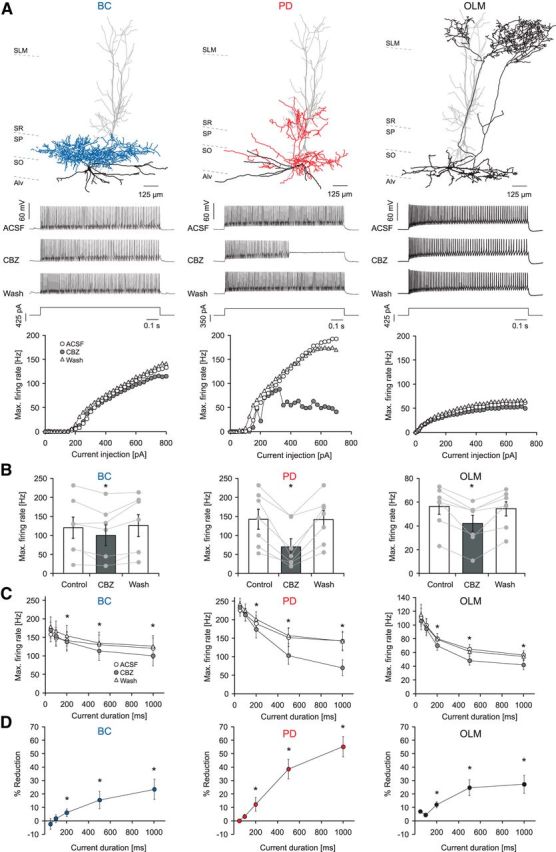
Carbamazepine effects on intrinsic firing properties of different types of GABAergic interneurons. A, Effects of CBZ on a representative BC, a bistratified cell innervating the proximal dendrites of pyramidal cells (PD), and an OLM interneuron (top, reconstructions of representative neurons; middle, current-clamp recordings during 1000 ms current injections; bottom, corresponding input–output relationship of the average firing rate during the 1 s current injection vs the magnitude of the current injection). SLM, Stratum lacunosum moleculare; SO, Stratum oriens; SP, Stratum pyramidale; SR, Stratum radiatum; Alv, alveus. B, CBZ effect on maximal firing rates of BCs (left), proximal dendritic targeting cells (PD; middle), and distal dendritic interneurons (OLM; right; *p < 0.05) during 1 s current injections. C, CBZ effects for different current injection durations measured from the onset of the current injection. D, Percent reduction in the maximal firing rate for the different time intervals from C.
Figure 3.

Comparison of the CBZ effects on intrinsic firing of different types of GABAergic interneurons. At the longest current injection durations (500 and 1000 ms), PD interneurons are affected significantly more compared with other types of neurons. *p < 0.05, ANOVA with post hoc Tukey's test.
Table 1.
Effects of CBZ on passive cell properties of different neuronal cell types
| Mean ACSF/wash Mean ± SEM | CBZ Mean ± SEM | p | |||
|---|---|---|---|---|---|
| Pyramidal neurons | |||||
| Rin (MΩ) | 70.37 | 4.93 | 64.70 | 5.65 | 0.195 |
| τ (ms) | 27.08 | 1.89 | 24.485 | 1.94 | 0.156 |
| C (nF) | 0.38 | 0.02 | 0.384 | 0.03 | 0.938 |
| Basket cells | |||||
| Rin (MΩ) | 180.46 | 51.60 | 185.87 | 49.13 | 0.688 |
| τ (ms) | 14.59 | 2.66 | 13.95 | 2.52 | 0.297 |
| C (nF) | 0.10 | 0.02 | 0.09 | 0.01 | 0.078 |
| Proximal dendritic cells | |||||
| Rin (MΩ) | 161.85 | 31.47 | 166.89 | 33.64 | 0.469 |
| τ (ms) | 14.46 | 2.43 | 14.11 | 1.55 | 0.938 |
| C (nF) | 0.10 | 0.01 | 0.10 | 0.02 | 1.063 |
| OLM cells | |||||
| Rin (MΩ) | 217.21 | 31.30 | 194.75 | 32.39 | 0.297 |
| τ (ms) | 31.84 | 4.40 | 27.45 | 4.03 | 0.031* |
| C (nF) | 0.17 | 0.01 | 0.16 | 0.01 | 0.688 |
Input resistance was calculated from small voltage deflections induced by current injections ranging from −50 to +50 pA with a linear fit. τ was estimated using negative current injections and a standard exponential fit.
*Statistically significant (Wilcoxon signed rank test).
Table 2.
Effects of CBZ on active properties of different neuronal cell types
| First AP (0–50 ms), % control |
Late AP (300–500 ms), % control |
|||||
|---|---|---|---|---|---|---|
| Mean ± SEM | p | Mean ± SEM | p | |||
| Pyramidal neurons | ||||||
| AP threshold (mV) | 97.72 | 0.71 | 0.023* | 84.22 | 3.93 | 0.008** |
| Maximum slope (mV/ms) | 96.66 | 2.94 | 0.250 | 72.94 | 4.68 | 0.008** |
| AP half-width (ms) | 99.80 | 1.20 | 0.843 | 106.47 | 2.17 | 0.039* |
| AP amplitude (mV) | 97.28 | 1.50 | 0.078 | 86.14 | 3.60 | 0.008** |
| fAHP (mV) | 92.60 | 9.50 | 0.148 | 136.42 | 12.97 | 0.008** |
| Basket cells | ||||||
| AP threshold (mV) | 98.60 | 1.06 | 0.156 | 95.80 | 2.13 | 0.109 |
| Maximum slope (mV/ms) | 87.13 | 4.59 | 0.047* | 86.06 | 5.91 | 0.071 |
| AP half-width (ms) | 106.17 | 2.08 | 0.031* | 105.83 | 2.47 | 0.047* |
| AP amplitude (mV) | 90.94 | 3.70 | 0.047* | 91.07 | 4.71 | 0.109 |
| fAHP (mV) | 98.27 | 2.81 | 0.688 | 100.03 | 2.51 | 0.938 |
| Proximal dendritic cells | ||||||
| AP threshold (mV) | 98.46 | 2.08 | 0.813 | 90.76 | 2.23 | 0.031* |
| Maximum slope (mV/ms) | 101.16 | 5.98 | 0.900 | 87.94 | 2.76 | 0.063 |
| AP half-width (ms) | 100.14 | 2.36 | 0.430 | 99.88 | 1.59 | 0.844 |
| AP amplitude (mV) | 98.11 | 4.31 | 0.570 | 88.98 | 2.44 | 0.031* |
| fAHP (mV) | 101.90 | 2.75 | 0.810 | 110.88 | 2.64 | 0.031* |
| OLM cells | ||||||
| AP threshold (mV) | 91.68 | 5.30 | 0.046* | 89.36 | 2.20 | 0.016* |
| Maximum slope (mV/ms) | 89.24 | 7.45 | 0.219 | 87.62 | 7.68 | 0.109 |
| AP half-width (ms) | 103.09 | 3.66 | 0.469 | 105.32 | 4.58 | 0.469 |
| AP amplitude (mV) | 92.89 | 5.31 | 0.219 | 91.66 | 4.67 | 0.109 |
| fAHP (mV) | 109.19 | 5.69 | 0.219 | 107.16 | 2.51 | 0.015* |
For analysis, both APs at the beginning of the current injection (0–50 ms after onset of the current injection; left column) and later in the action potential train (300–500 ms after onset of the current injection; right column) were selected (see Materials and Methods for details). Values for fast afterhyperpolarizations (fAHP) are given relative to action potential threshold.
*Statistically significant (Wilcoxon signed rank test).
We next examined how CBZ affects interneuron firing when induced by synaptic activation. We monitored the firing of different types of interneurons using cell-attached recordings and stimulated pyramidal cell axons within the alveus, which activate interneurons via recurrent axon collaterals (Pouille and Scanziani, 2004; see Fig. 4A for representative cell-attached recordings and recording configuration). After these recordings, cells were repatched in the whole-cell, patch-clamp configuration, and their morphology was reconstructed for classification. Spike latency of synaptically elicited firing in interneurons was significantly larger than that of antidromically elicited spikes recorded in CA1 pyramidal cells, as expected (Fig. 4A,B, insets; n = 6, 5, 5, and 4 for pyramidal neurons, BCs, PD cells, and OLM cells, respectively).
Figure 4.
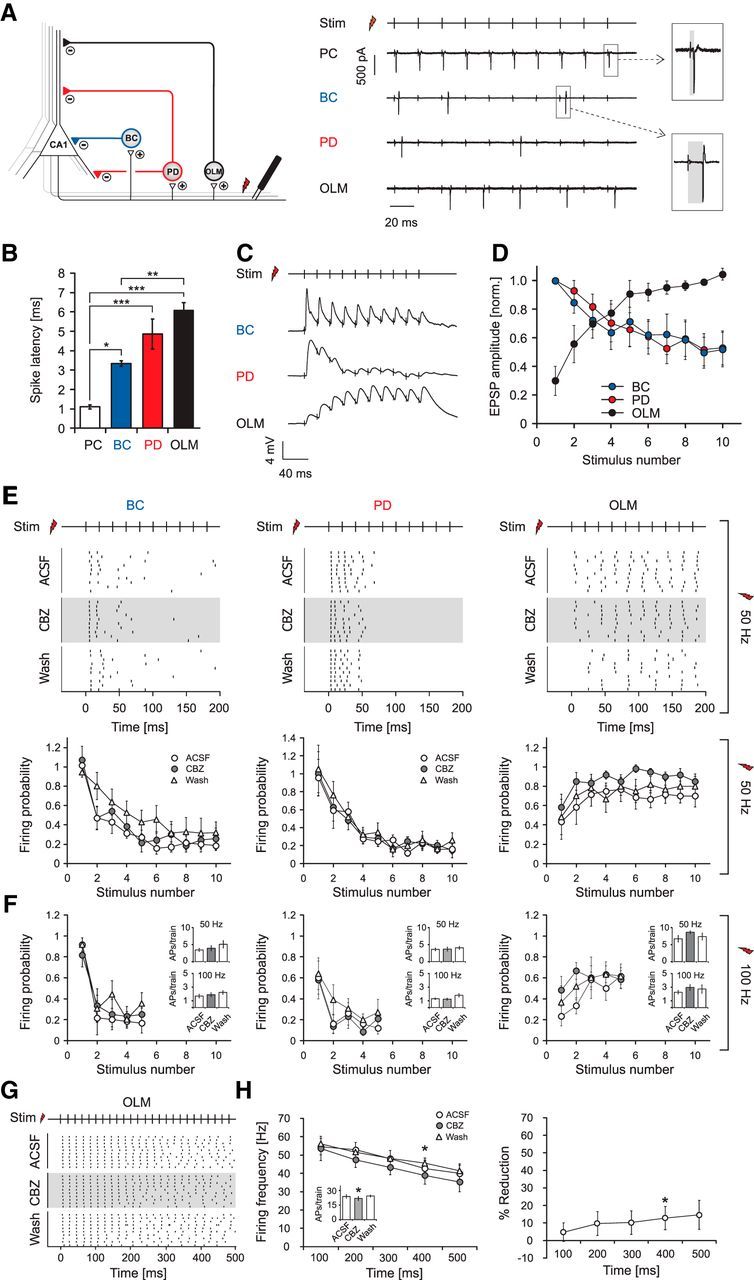
Carbamazepine effects on synaptically induced firing of interneurons. A, Left, Recording configuration to examine the impact of CBZ on synaptically induced firing of interneurons. Right, Cell-attached recordings of a pyramidal cell (PC), a basket cell (BC), a proximal dendritic targeting cell (PD), and an OLM interneuron. B, The latency of antidromic spikes in PCs is significantly shorter than those observed in interneurons as estimated with an ANOVA and a subsequent post hoc Tukey's test. *p < 0.05; **p < 0.01; ***p < 0.001. C, Example recordings of EPSPs from different interneuron types during alveus stimulation. EPSP amplitudes of a basket cell (top trace) and a proximal dendritic cell (middle trace) decrease during a 50 Hz stimulus train, whereas an OLM interneuron (bottom trace) shows facilitation. D, EPSP amplitudes from interneurons in the BC and PD groups that show depression were normalized to the first EPSP; data from OLM interneurons that show facilitation were normalized to the mean amplitude of the last three EPSPs. The results clearly show the difference in EPSP dynamics onto OLM interneurons versus other types of interneurons. E, Synaptically induced firing of interneurons is not affected by CBZ during a 200 ms stimulus train at 50 Hz (top: raster plots of action potential firing, 50 Hz stimulus train; bottom: average firing probability during trains of 10 stimuli at 50 Hz). F, Synaptically induced firing of interneurons by stimulation trains composed of five stimuli at 100 Hz. Insets depict the total number of action potentials induced during stimulus trains. G, Raster plots of synaptically induced firing of OLM cells with longer stimulation trains of 500 ms at 50 Hz under control conditions, during application of CBZ, and after washout. H, Left, Average firing frequency binned over 100 ms periods of stimulation. The inset shows effects on the number of action potentials over the whole stimulus train. Right, Percent reduction of firing for the different time intervals. These experiments reveal a minor effect on synaptically driven OLM neuron firing (*p < 0.05). Stim, Time points of alveus stimulation.
During stimulation trains of 10 stimuli at 50 Hz, OLM interneurons showed a progressive increase in discharge probability during the trains, whereas the other two groups of interneurons displayed a decremental pattern (Fig. 4E; top, representative raster plots from individual neurons; bottom, firing probability during the stimulation train). This was caused by a pronounced frequency-dependent facilitation of EPSPs during stimulus trains in OLM neurons, but a pronounced depression in the other interneuron classes (Fig. 4C, representative examples; Fig. 4D, normalized and averaged EPSP peak amplitudes during the train; n = 7, 7, and 8 for BCs, PD cells, and OLM cells, respectively). Surprisingly, CBZ failed to affect synaptically driven firing in any of the interneuron types during a 200 ms stimulus train (Fig. 4E; n = 7, 7, and 6 for BCs, PD cells, and OLM cells, respectively), even though firing elicited with prolonged current injections was affected in all three classes of interneurons (Fig. 2, compare C, D). Likewise, CBZ also failed to affect synaptically driven firing during 100 Hz stimulation trains, mimicking high-frequency activation typically present during physiological ripples and epileptogenic high-frequency oscillations (Bragin et al., 1999; Ibarz et al., 2010; Fig. 4F, n-numbers as for the 50 Hz stimulation). This was most likely caused by the strong depression of afferent synapses that caused PD interneurons as well as basket cells to fire only briefly at the onset of stimulus trains (total number of action potentials per train: BCs: 3.4 ± 0.5 for 50 Hz and 1.7 ± 0.3 for 100 Hz stimulation frequencies, PDs: 3.6 ± 0.4 for 50 Hz and 1.3 ± 0.1 for 100 Hz stimulation frequencies; Fig. 4F, insets, left and middle), preventing development of use-dependent block. Indeed, when examining firing within the first 50 or 100 ms after onset of current injection, the discharge frequency of all interneurons was not altered by CBZ (Fig. 2C,D). Thus, even in PD interneurons that are, in principle, very sensitive to CBZ, a use-dependent Na+ channel block cannot develop because of the strongly depressing nature of interneuron firing when synaptically recruited. In contrast, OLM cells are reliably recruited during synaptic stimulation trains (Fig. 4A,E, rightmost panels) and are able to follow synaptic stimulation over a longer period of time. Nevertheless, this did not translate into a reduction of synaptically driven firing with 50 or 100 Hz stimulation trains (Fig. 4E,F, rightmost panels), although during somatic current injections a duration of 200 ms was sufficient to reveal a reduction in firing. Because OLM cells faithfully follow synaptic stimulation over long trains (unlike basket or PD cells), we also tested longer trains of synaptic stimulation to exclude that effects might materialize only during prolonged recruitment (as seen for pyramidal cells; Fig. 1, compare F, I). When alveus stimulation was performed with 25 stimuli at 50 Hz (Fig. 4G,H; n = 7), the firing rate of OLM cells decreased only little over the stimulus train. The firing probability was largely unaffected during the train.
The interpretation of drug effects in the alveus stimulation experiments relies on the assumption that the CA1 pyramidal cell recruitment is not affected by the presence of CBZ. We examined CBZ effects on antidromically elicited firing of pyramidal cells during alveus stimulation using cell-attached recordings (Fig. 5; see Fig. 4A for recording configuration). Antidromically activated cells were identified based on the spike latency (Fig. 4A,B; average latency, 1.1 ± 0.1 ms; n = 5). The firing of pyramidal cells was not affected by CBZ during 500 ms stimulation trains at 50 Hz (Fig. 5; n = 5), suggesting that CBZ effects on inhibitory micronetworks are not contaminated by changes in CA1 pyramidal cell recruitment.
Figure 5.

Firing of CA1 neurons during alveus stimulation is undisturbed by CBZ. A, B, Representative cell-attached recording (A) and corresponding raster plots (B) of antidromically elicited action potentials in a CA1 pyramidal cell (25 stimuli at 50 Hz). Stimulation (Stim) was performed as in Figure 4A, in the presence of 10 μm gabazine. C, Average firing frequency during direct stimulation of pyramidal cell axons remains unaffected by CBZ.
Effects of CBZ on feedback and feedforward inhibition in the CA1 region
As a next step in this microcircuit, we studied whether feedback inhibition recorded in CA1 pyramidal cells is altered by CBZ. We stimulated the alveus with 50 or 100 Hz stimulation trains, causing synaptic activation of feedback microcircuits (see Fig. 6A for recording configuration). We then isolated pyramidal cell IPSCs by subtraction of traces obtained in the presence of gabazine (10 μm; Fig. 6B,C). There was no significant effect of CBZ (30 μm) on the peak amplitude of consecutive IPSCs over the stimulus train at either 50 Hz (n = 12; Fig. 6B) or 100 Hz (n = 7; Fig. 6C; summary in Fig. 6D) stimulation frequencies. Similarly, the charge transfer over the stimulus train was not affected (data not shown; n = 12, p = 0.97 and n = 7, p = 0.69 for 50 and 100 Hz respectively; Wilcoxon signed rank test).
The second major excitatory input to CA1 interneurons is from CA3 pyramidal cell axons in feedforward microcircuits. We, therefore, studied the impact of CBZ on feedforward inhibition by stimulating within the CA3 pyramidal cell layer (Fig. 7A). In these experiments, the cut separating CA3 from CA1 was omitted (see Materials and Methods). This stimulation gave rise to large feedforward IPSCs, with a small EPSC component (Fig. 7B,C). In these experiments, because of the maintained connection with CA3, application of gabazine often resulted in the induction of network events within the CA3 region that propagated to CA1. Subtraction of traces recorded in the presence of gabazine was, therefore, not feasible in most experiments. We measured the peak of consecutive IPSCs and found that feedforward inhibition was unaffected by CBZ at both 50 Hz (n = 5) and 100 Hz (n = 7; Fig. 7D). The charge transfer over the stimulus train was also unaffected (n = 6, p = 0.156 and n = 7 p = 0.821 for 50 and 100 Hz, respectively; Wilcoxon signed rank test; data not shown). These results were not contaminated by effects on feedforward EPSC components, as these were small and because EPSCs were unaffected by CBZ (Fig. 1J–L).
Figure 7.

Carbamazepine effects on GABAergic feedforward inhibition. A, Recording configuration to elicit feedforward inhibition. B, C, Representative recordings of feedforward IPSCs under control conditions, after application and washout of CBZ, and after the subsequent application of 10 μm gabazine during 50 Hz (B) and 100 Hz (C) stimulus trains. D, Top, Quantification of the peak IPSCs. Bottom, Peak IPSCs after CBZ application normalized to the mean of control and washout. Gray traces correspond to individual cells; the black trace shows average ± SEM.
We then visualized the dynamics of inhibition in the entire CA1 area by exploiting the ability of voltage-sensitive dyes to report on membrane hyperpolarization at a larger scale. A single stimulus applied to the alveus evoked a fast excitation in stratum pyramidale and stratum oriens/alveus (Fig. 8A,B), followed by the slower inhibitory signal, which extended spatially throughout all layers in the CA1 field (Fig. 8B). A similar sequence of excitation and inhibition was observed when stimulation was performed in CA3 to recruit feedforward inhibition (Fig. 8C). We then applied stimulus protocols consisting of a single control stimulus, followed by a high-frequency stimulus train (10 stimuli at 50 Hz), and a subsequent test stimulus (Fig. 8A). Application of a high-frequency train always resulted in a significant reduction of the inhibitory signal in the strata radiatum and oriens (see Fig. 8A for an example of feedback stimulation; compare traces 1 and 2). Inhibition measured during the test stimulus after high-frequency activation revealed that CBZ did not alter laminar inhibition in the Schaffer collateral termination zone within strata radiatum/oriens, the pyramidal cell layer, or the SLM, neither for feedforward (n = 9) nor for feedback (n = 10; Fig. 8D, bottom) stimulation. Neither the magnitude of inhibition to the initial control stimulus nor the magnitude of excitation to either stimulus was affected (Fig. 8D, top, E). These experiments, together with the feedback and feedforward IPSC recordings, establish that at clinically relevant concentrations, CBZ does not affect GABAergic inhibition, through a combination of interneuron-specific pharmacological and synaptic properties.
Additional anticonvulsants fail to affect inhibition
To examine whether this is also true for other anticonvulsants with Na+ channel blocking activity, we examined PHT (50 μm) and LTG (25 μm; Willow et al., 1985; Kuo and Lu, 1997; Remy et al., 2003b). Both drugs caused a significant inhibition of pyramidal cell firing induced by current injection (reduction of maximal discharge frequency; LTG: 25.2 ± 2.4%, n = 6, p = 0.03; PHT, 48.1 ± 4.9%, n = 6, p = 0.03; Fig. 9A,B). Despite the effects on pyramidal neuron firing, no effects on the peak amplitude of IPSCs during feedback stimulation could be observed for LTG (Fig. 9C) for neither 50 Hz (Fig. 9E, left; n = 6) nor 100 Hz (Fig. 9F, left; n = 6) stimulation. PHT exhibited minimal effects on the peak IPSCs, with only a single individual data point during the 100 Hz stimulation train reaching the level of statistical significance (Fig. 9D; summary in Fig. 9E,F, right; 50 Hz, n = 6; 100 Hz, n = 7). However, neither LTG nor PHT had any significant effect on the charge transfer at both 50 and 100 Hz stimulus trains (LTG: n = 7, p = 0.56 and n = 6, p = 1.0 for 50 and 100 Hz respectively; PHT: n = 6, p = 0.68 and n = 7, p = 0.68 for 50 and 100 Hz respectively; Wilcoxon signed rank test). These data suggest that, in addition to CBZ, other Na+ channel-acting anticonvulsants also leave inhibition intact.
Figure 9.
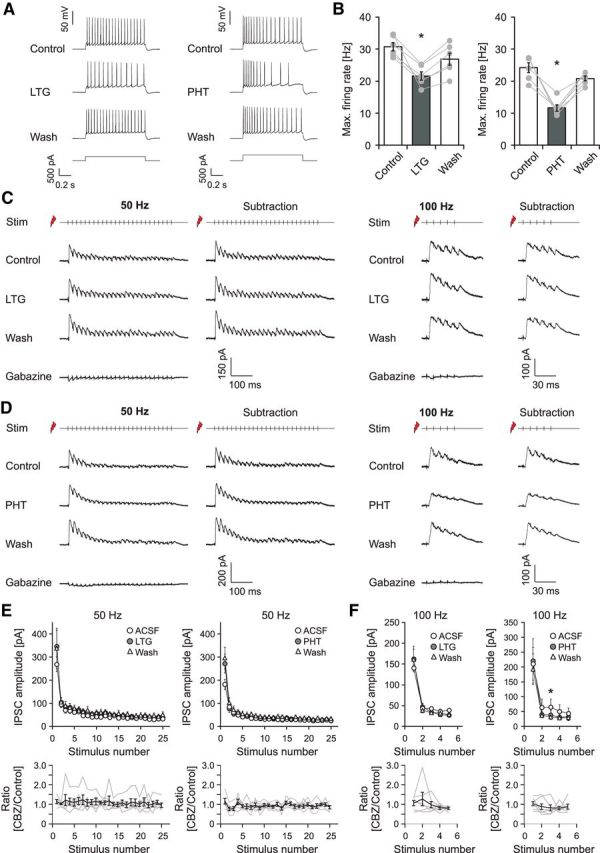
Effects of additional anticonvulsants on pyramidal cell firing and GABAergic inhibition. A, Representative recordings before, during application, and after washout of either LTG (25 μm; left) or PHT (50 μm; right). B, LTG (left; n = 7) and PHT (right; n = 6) reduce the maximal average firing rate of pyramidal cells by about 25.2 and 48.1%, respectively. *p < 0.05. C, D, Effects of LTG (C) and PHT (D) on feedback inhibition measured as in Figure 6, A–C. E, F, Quantification of the peak IPSCs for 50 Hz (E) and 100 Hz (F) stimulation under control conditions, in the presence of CBZ and after washout. Bottom, Peak IPSCs after CBZ application normalized to the mean of control and washout. Gray traces correspond to individual cells; the black trace shows average ± SEM.
Effects of CBZ on pyramidal neurons in the chronically epileptic hippocampus
So far, these experiments were performed in normal hippocampus. We, therefore, also studied the effects of CBZ in chronically epileptic animals (pilocarpine model of epilepsy; see Materials and Methods). We first assessed the effects of CBZ on repetitive firing of pyramidal neurons in epileptic rats, exactly as described previously for control animals (Fig. 1). Consistent decreases in the firing rate were observed (Fig. 10A,B; n = 9). The effects were use dependent, increasing with the duration of the current injection (Fig. 10C, black symbols; gray symbols are values from control animals shown for the sake of comparison). The differences between the CBZ effects in control and epileptic animals were not significant.
Figure 10.

Effects of CBZ on pyramidal neurons in the chronically epileptic hippocampus. A, Effects of CBZ on the maximal discharge frequency measured during 1 s current injections in pilocarpine-treated rats (**p < 0.01). B, CBZ effects on the maximal firing rate measured during the first 50, 100, 200, 500, and 1000 ms of current duration (see Fig. 1; **p < 0.01, Wilcoxon signed rank test). C, Percent reduction in firing frequency by CBZ within the different time intervals shown in B (*p < 0.05, **p < 0.01, Wilcoxon signed rank test). For comparison, data from control animals (see Fig. 1) are indicated in gray.
Effects of CBZ on feedback inhibition in chronically epileptic hippocampus
We next examined whether feedback inhibition is affected by CBZ in chronically epileptic animals. Experiments were performed as shown for control animals (Fig. 11A). Pyramidal cell IPSCs were isolated by subtraction of traces obtained in the presence of gabazine (10 μm; Fig. 11B,C). There was no significant effect of CBZ (30 μm) on the peak amplitude of consecutive IPSCs over the 50 and 100 Hz stimulus trains (Fig. 11D; 50 Hz, n = 7; 100 Hz, n = 10; n.s., Wilcoxon signed rank test). Similarly, the charge transfer over the stimulus train was not affected (data not shown; n = 7, p = 0.93 and n = 10, p = 0.92 for 50 and 100 Hz, respectively; Wilcoxon signed rank test).
Figure 11.

Effects of CBZ on feedback inhibition in the chronically epileptic hippocampus. A, Recording configuration used to elicit feedback inhibition. B, C, Representative recordings of feedback PSCs with sequential application of 30 μm CBZ, washout of CBZ, and application of 10 μm gabazine (leftmost traces). Feedback IPSCs were isolated by subtracting traces recorded in the presence of gabazine (rightmost traces; B, 50 Hz stimulation; C, 100 Hz stimulation). D, Quantification of the CBZ effect on peak IPSCs during 50 and 100 Hz stimulation. Bottom, Peak IPSCs after CBZ application normalized to the mean of control and washout. Gray traces correspond to individual cells; the black trace shows average ± SEM.
Effects of CBZ on feedback inhibition recruited by activity patterns generated from in vivo recordings
These results suggest that feedback inhibition is unaffected by CBZ in both control and epileptic animals with the stimulus protocols used so far. However, activity patterns occurring in vivo may differentially recruit feedback inhibition and may potentially be associated with emergence of CBZ effects. To investigate this possibility, we obtained representative activity patterns of CA1 pyramidal cells in freely moving conditions, from both kainate-treated chronically epileptic and control animals using juxtacellular recordings (n = 8 and n = 5 CA1 pyramidal cells from eight and four control and epileptic rats, respectively). We focused on CA1 activity patterns during HFOs recorded in periods of immobility, as these reflect the most synchronous hippocampal firing patterns and single-cell recordings during seizures were not feasible. We chose HFOs because they are hallmarks of epileptogenic areas, likely reflecting pathological synchronization processes (Bragin et al., 1999; Ibarz et al., 2010). Furthermore, a role for transient HFOs in the initiation of seizure activity has been proposed (Khosravani et al., 2005; Jirsch et al., 2006).
Representative LFP recordings during transient HFOs in control (ripples) and epileptic animals (fast ripples) are shown in Figure 12A (top). Firing patterns of pyramidal cells within a 1 s time window before and after the peak of the ripple oscillation are shown in the raster plots in Figure 12A (middle). The selected firing patterns correspond to a representative distribution of pyramidal cell firing patterns seen during either physiological or pathological HFOs (data not shown). From these, we then chose firing patterns with more than one spike per sweep (indicated as red dots/lines in the raster plots/spike histograms of Fig. 12A). It should be noted that this results in a systematic bias, as sweeps with just one spike were more common in control animals. We used these in vivo firing patterns to stimulate the alveus of slices from sham-injected and epileptic animals (Fig. 12B; see Materials and Methods for details). This allowed us to evaluate the effect of normal and pathological in vivo firing patterns on the dynamics of feedback inhibition that is recruited before, during, and after HFOs (Fig. 12B, representative recordings from sham-control and epileptic slices). Corresponding feedback IPSCs were evaluated in control ACSF (black trace) in the presence of CBZ (red trace) and after washout (gray trace).
We then quantified the average inhibitory current during HFOs (Fig. 12B, dashed black boxes) and during the baseline activity (for details see Materials and Methods). Both in control (n = 8) and epileptic (n = 7) animals, inhibition was mostly unaffected, with minor changes being observed only in one instance (Fig. 12C; n = 8 and n = 7 for sham and epileptic animals, respectively). In particular, inhibition during epileptic activity patterns in epileptic animals was completely unaffected by CBZ (Fig. 12C, lowermost right panel; for ratio of inhibition in control and CBZ conditions, see Fig. 12D).
Discussion
These experiments demonstrate for the first time how common anticonvulsant drugs act on the network level. We found that pyramidal cell firing is reliably blocked by CBZ. Interneuron subtypes in the hippocampus differ in their responsiveness to CBZ. Interneurons innervating the proximal dendrites of pyramidal cells (PD interneurons) show a much stronger decrease in their firing rate compared with OLM interneurons that target the distal apical tuft or basket cells that provide inhibition to pyramidal cell somata. Even though CBZ was capable of reducing the firing of interneurons induced by current injection, both feedback and feedforward inhibition remained completely unaffected. Our results suggest a simple explanation for sparing of inhibition by CBZ: an analysis of the synaptic recruitment of interneurons during network activity revealed that PD interneurons and basket cells are recruited by strongly depressing excitatory inputs. As a consequence, these interneurons fire only briefly during episodes of stimulated network activity. Our careful analysis of CBZ effects on interneuron firing suggests that these brief episodes of synaptically driven firing are not sufficient for a development of use-dependent Na+ channel block. We note that we recorded only from a subset of CA1 interneurons, and it is conceivable that our findings do not apply to all interneurons. However, inhibition impinging on CA1 pyramidal neurons will reflect the summed activity of interneurons during feedback and feedforward activation. Our data, therefore, suggest that during feedforward and feedback activation, perisomatic CA1 interneurons are not affected by sodium channel blocking anticonvulsants.
For OLM neurons, which reliably follow longer episodes of synaptic recruitment, small effects of CBZ were observed. These effects did not translate into an effect of CBZ onto inhibition measured in CA1 pyramidal cells, most likely because of the dominance of perisomatic inhibition in these recordings. Importantly, inhibition in chronically epileptic animals recruited by activity patterns derived from in vivo recordings were unaffected by CBZ.
These results indicate that a principal reason for the efficacy of Na+ channel blockers in epilepsy is not only the use-dependent nature of the blocking action per se, but also a limited efficacy of anticonvulsant drugs on GABAergic inhibition. This limited efficacy is rooted in both intrinsic pharmacological properties of interneurons and in the dynamics of their synaptic recruitment. A lack of efficacy of CBZ on GABAergic inhibition has been suggested in early experiments using field recording techniques. These experiments have shown that inhibition-related parameters such as paired-pulse inhibition of population spikes are CBZ insensitive (Hood et al., 1983; Olpe et al., 1985), even though these experiments have not addressed CBZ effects when inhibitory networks are repetitively recruited at high rates. Other reports suggest a direct allosteric regulatory effect of CBZ on GABAA receptors in cortical cell culture (Granger et al., 1995). However, our recordings of feedback and feedforward inhibition suggest that there are no large direct effects of CBZ on GABA receptors in the CA1 region of native hippocampal slices. It should be noted that this study has focused only on inhibitory circuits inside the hippocampal CA1 region, and we cannot exclude that anticonvulsant effects on excitation versus inhibition may be different in other brain areas.
We also show that CBZ fails to act on feedback inhibition in the chronically epileptic CA1 region in a model of temporal lobe epilepsy. It will be interesting to study whether this is also true in other models of epilepsy. In models of Dravet syndrome, a decrease in interneuron Na+ currents has been proposed as a causative mechanism for seizure generation (Yu et al., 2006; Cheah et al., 2012; but see Liu et al., 2013). In patients with this disorder, treatment with sodium channel blockers can be deleterious. This raises the possibility that in patients with epilepsies associated with sodium channel deficiency in interneurons, the lower density of sodium channels might lead to higher sensitivity of interneuron firing to sodium channel blockers. Additionally, compensatory changes in sodium channel subunit expression might increase sensitivity of interneurons to CBZ as well (Yu et al., 2006). In these cases, CBZ might depress inhibition, even if it does not in models of chronic epilepsy.
Nevertheless, in most types of epilepsy, blocking excitatory neurons while sparing inhibition appears to be an effective strategy for inhibiting seizure initiation and propagation. Genetic or pharmacological inhibition of interneuron function is proepileptic, whereas increasing the function of GABA receptors is strongly anticonvulsant (Lau et al., 2000; Yu et al., 2006; for review, see Avoli and de Curtis, 2011). In addition, GABAergic interneurons appear to contribute to the control of seizure propagation (Trevelyan et al., 2006, 2007) and to progressive synchronization of larger cellular ensembles (Liotta et al., 2011). However, the role of interneurons is far from limited to simply providing synaptic inhibition, with certain types of inhibitory interneurons playing important roles in synchronizing neuronal ensembles, either via precisely timed inhibitory actions or via excitatory actions of GABA (for review, see McBain and Fisahn, 2001; Cossart et al., 2005; Mann and Mody, 2008; Avoli and de Curtis, 2011). These results raise the possibility that limiting the excitability of specific types of interneurons may also be a viable strategy to limit excitability. Our results do not conflict with this notion.
From a biophysical perspective, the differential responses of specific interneuron types and pyramidal neurons are intriguing. These differences may be rooted in subtype-specific differential expression of Na+ channel isoforms. Available data suggest that there may be preferential expression of Nav subunits in specific interneuron types; for instance, Nav1.1 subunits appear to be particularly strongly expressed in parvalbumin-containing interneurons during development (Ogiwara et al., 2007). However, there have been no reports of systematic differences in subunit expression between different interneuron types in the adult brain. There is also no evidence available supporting a selective influence of anticonvulsants only on specific Na+ channel isoforms. One report has examined the sensitivity of alternatively spliced Scn1a isoforms to CBZ, but no differences in use-dependent block could be identified (Thompson et al., 2011). An alternative explanation to the expression of different Na+ channel isoforms would be that the channel density or gating differs between hippocampal cell types. For instance, the fast Na+ channel gating and the narrow action potentials observed in some interneurons (Martina and Jonas, 1997) may be associated with a less efficient use-dependent block by CBZ. Our data on the action potential properties in the different neuron types do not support such a simple relationship. For instance, the PD neurons, which show the largest CBZ effects, have narrow action potentials (0.37 ± 0.06 ms), whereas basket cells, which show significantly smaller CBZ effects, have broader action potentials (0.47 ± 0.12). Alternatively, a higher density of Na+ channel densities observed in some interneurons might also contribute to a relative insensitivity to Na+ channel blockers (Hu et al., 2010).
In summary, these results show that several commonly used anticonvulsants fail to affect GABAergic inhibition while inhibiting firing of principal neurons. These results have implications for drug development, suggesting that novel compounds should be evaluated for their quantitative effects on synaptic inhibition early on in the drug development process.
Footnotes
This work was supported by the Deutsche Forschungsgemeinschaft (SFB 1089); the Nationales Genomforschungsnetzwerk NGFNplus EmiNet, EPICURE coordinated by the Deutsche Luft und Raumfahrt; the Ministry for Innovation, Research, Science, Research, and Technology NRW; the BONFOR program of the University of Bonn Medical Center; the ERANET Neuron Grant “EpiNet” (to H.B., S.R., and L.M.d.l.P.); and the Spanish Ministry of Economy (BFU2012-37156-C03-01). R.G.A. was supported by an ERC Advanced Grant (INTERIMPACT) to Gábor Tamás. We also thank Olivia Steffan for excellent technical assistance, Elena Cid for generating and characterizing kainate-injected epileptic animals used in juxtacellular recordings, and Douglas Coulter for help with voltage imaging experiments.
References
- Ascoli GA, Alonso-Nanclares L, Anderson SA, Barrionuevo G, Benavides-Piccione R, Burkhalter A, Buzsáki G, Cauli B, Defelipe J, Fairén A, Feldmeyer D, Fishell G, Fregnac Y, Freund TF, Gardner D, Gardner EP, Goldberg JH, Helmstaedter M, Hestrin S, Karube F, et al. Petilla terminology: nomenclature of features of GABAergic interneurons of the cerebral cortex. Nat Rev Neurosci. 2008;9:557–568. doi: 10.1038/nrn2402. [DOI] [PMC free article] [PubMed] [Google Scholar]
- Avoli M, de Curtis M. GABAergic synchronization in the limbic system and its role in the generation of epileptiform activity. Prog Neurobiol. 2011;95:104–132. doi: 10.1016/j.pneurobio.2011.07.003. [DOI] [PMC free article] [PubMed] [Google Scholar]
- Bragin A, Engel J, Jr, Wilson CL, Fried I, Mathern GW. Hippocampal and entorhinal cortex high-frequency oscillations (100–500 Hz) in human epileptic brain and in kainic acid-treated rats with chronic seizures. Epilepsia. 1999;40:127–137. doi: 10.1111/j.1528-1157.1999.tb02065.x. [DOI] [PubMed] [Google Scholar]
- Cheah CS, Yu FH, Westenbroek RE, Kalume FK, Oakley JC, Potter GB, Rubenstein JL, Catterall WA. Specific deletion of NaV1.1 sodium channels in inhibitory interneurons causes seizures and premature death in a mouse model of Dravet syndrome. Proc Natl Acad Sci U S A. 2012;109:14646–14651. doi: 10.1073/pnas.1211591109. [DOI] [PMC free article] [PubMed] [Google Scholar]
- Cossart R, Bernard C, Ben-Ari Y. Multiple facets of GABAergic neurons and synapses: multiple fates of GABA signalling in epilepsies. Trends Neurosci. 2005;28:108–115. doi: 10.1016/j.tins.2004.11.011. [DOI] [PubMed] [Google Scholar]
- Freund TF, Buzsáki G. Interneurons of the hippocampus. Hippocampus. 1996;6:347–470. doi: 10.1002/(SICI)1098-1063(1996)6:4<347::AID-HIPO1>3.0.CO;2-I. [DOI] [PubMed] [Google Scholar]
- Granger P, Biton B, Faure C, Vige X, Depoortere H, Graham D, Langer SZ, Scatton B, Avenet P. Modulation of the gamma-aminobutyric acid type A receptor by the antiepileptic drugs carbamazepine and phenytoin. Mol Pharmacol. 1995;47:1189–1196. [PubMed] [Google Scholar]
- Hood TW, Siegfried J, Haas HL. Analysis of carbamazepine actions in hippocampal slices of the rat. Cell Mol Neurobiol. 1983;3:213–222. doi: 10.1007/BF00710948. [DOI] [PMC free article] [PubMed] [Google Scholar]
- Hu H, Martina M, Jonas P. Dendritic mechanisms underlying rapid synaptic activation of fast-spiking hippocampal interneurons. Science. 2010;327:52–58. doi: 10.1126/science.1177876. [DOI] [PubMed] [Google Scholar]
- Ibarz JM, Foffani G, Cid E, Inostroza M, Menendez de la Prida L. Emergent dynamics of fast ripples in the epileptic hippocampus. J Neurosci. 2010;30:16249–16261. doi: 10.1523/JNEUROSCI.3357-10.2010. [DOI] [PMC free article] [PubMed] [Google Scholar]
- Jirsch JD, Urrestarazu E, LeVan P, Olivier A, Dubeau F, Gotman J. High-frequency oscillations during human focal seizures. Brain. 2006;129:1593–1608. doi: 10.1093/brain/awl085. [DOI] [PubMed] [Google Scholar]
- Khosravani H, Pinnegar CR, Mitchell JR, Bardakjian BL, Federico P, Carlen PL. Increased high-frequency oscillations precede in vitro low-Mg seizures. Epilepsia. 2005;46:1188–1197. doi: 10.1111/j.1528-1167.2005.65604.x. [DOI] [PubMed] [Google Scholar]
- Korshunov VA. Miniature microdrive for extracellular recording of neuronal activity in freely moving animals. J Neurosci Methods. 1995;57:77–80. doi: 10.1016/0165-0270(94)00130-9. [DOI] [PubMed] [Google Scholar]
- Kuo CC, Lu L. Characterization of lamotrigine inhibition of Na+ channels in rat hippocampal neurones. Br J Pharmacol. 1997;121:1231–1238. doi: 10.1038/sj.bjp.0701221. [DOI] [PMC free article] [PubMed] [Google Scholar]
- Lau D, Vega-Saenz de Miera EC, Contreras D, Ozaita A, Harvey M, Chow A, Noebels JL, Paylor R, Morgan JI, Leonard CS, Rudy B. Impaired fast-spiking, suppressed cortical inhibition, and increased susceptibility to seizures in mice lacking Kv3.2 K+ channel proteins. J Neurosci. 2000;20:9071–9085. doi: 10.1523/JNEUROSCI.20-24-09071.2000. [DOI] [PMC free article] [PubMed] [Google Scholar]
- Liotta A, Caliskan G, ul Haq R, Hollnagel JO, Rösler A, Heinemann U, Behrens CJ. Partial disinhibition is required for transition of stimulus-induced sharp wave-ripple complexes into recurrent epileptiform discharges in rat hippocampal slices. J Neurophysiol. 2011;105:172–187. doi: 10.1152/jn.00186.2010. [DOI] [PubMed] [Google Scholar]
- Liu Y, Lopez-Santiago LF, Yuan Y, Jones JM, Zhang H, O'Malley HA, Patino GA, O'Brien JE, Rusconi R, Gupta A, Thompson RC, Natowicz MR, Meisler MH, Isom LL, Parent JM. Dravet syndrome patient-derived neurons suggest a novel epilepsy mechanism. Ann Neurol. 2013;74:128–139. doi: 10.1002/ana.23897. [DOI] [PMC free article] [PubMed] [Google Scholar]
- Mann EO, Mody I. The multifaceted role of inhibition in epilepsy: seizure-genesis through excessive GABAergic inhibition in autosomal dominant nocturnal frontal lobe epilepsy. Curr Opin Neurol. 2008;21:155–160. doi: 10.1097/WCO.0b013e3282f52f5f. [DOI] [PubMed] [Google Scholar]
- Mantegazza M, Curia G, Biagini G, Ragsdale DS, Avoli M. Voltage-gated sodium channels as therapeutic targets in epilepsy and other neurological disorders. Lancet Neurol. 2010;9:413–424. doi: 10.1016/S1474-4422(10)70059-4. [DOI] [PubMed] [Google Scholar]
- Martina M, Jonas P. Functional differences in Na+ channel gating between fast-spiking interneurones and principal neurones of rat hippocampus. J Physiol. 1997;505:593–603. doi: 10.1111/j.1469-7793.1997.593ba.x. [DOI] [PMC free article] [PubMed] [Google Scholar]
- McBain CJ, Fisahn A. Interneurons unbound. Nat Rev Neurosci. 2001;2:11–23. doi: 10.1038/35049047. [DOI] [PubMed] [Google Scholar]
- Ogiwara I, Miyamoto H, Morita N, Atapour N, Mazaki E, Inoue I, Takeuchi T, Itohara S, Yanagawa Y, Obata K, Furuichi T, Hensch TK, Yamakawa K. Na(v)1.1 localizes to axons of parvalbumin-positive inhibitory interneurons: a circuit basis for epileptic seizures in mice carrying an Scn1a gene mutation. J Neurosci. 2007;27:5903–5914. doi: 10.1523/JNEUROSCI.5270-06.2007. [DOI] [PMC free article] [PubMed] [Google Scholar]
- Olpe HR, Baudry M, Jones RS. Electrophysiological and neurochemical investigations on the action of carbamazepine on the rat hippocampus. Eur J Pharmacol. 1985;110:71–80. doi: 10.1016/0014-2999(85)90030-5. [DOI] [PubMed] [Google Scholar]
- Pinault D. A novel single-cell staining procedure performed in vivo under electrophysiological control: morpho-functional features of juxtacellularly labeled thalamic cells and other central neurons with biocytin or Neurobiotin. J Neurosci Methods. 1996;65:113–136. doi: 10.1016/0165-0270(95)00144-1. [DOI] [PubMed] [Google Scholar]
- Pouille F, Scanziani M. Routing of spike series by dynamic circuits in the hippocampus. Nature. 2004;429:717–723. doi: 10.1038/nature02615. [DOI] [PubMed] [Google Scholar]
- Rambeck B, Jürgens UH, May TW, Pannek HW, Behne F, Ebner A, Gorji A, Straub H, Speckmann EJ, Pohlmann-Eden B, Löscher W. Comparison of brain extracellular fluid, brain tissue, cerebrospinal fluid, and serum concentrations of antiepileptic drugs measured intraoperatively in patients with intractable epilepsy. Epilepsia. 2006;47:681–694. doi: 10.1111/j.1528-1167.2006.00504.x. [DOI] [PubMed] [Google Scholar]
- Remy S, Gabriel S, Urban BW, Dietrich D, Lehmann TN, Elger CE, Heinemann U, Beck H. A novel mechanism underlying drug-resistance in chronic epilepsy. Ann Neurol. 2003a;53:469–479. doi: 10.1002/ana.10473. [DOI] [PubMed] [Google Scholar]
- Remy S, Urban BW, Elger CE, Beck H. Anticonvulsant pharmacology of voltage-gated Na+ channels in hippocampal neurons of control and chronically epileptic rats. Eur J Neurosci. 2003b;17:2648–2658. doi: 10.1046/j.1460-9568.2003.02710.x. [DOI] [PubMed] [Google Scholar]
- Rogawski MA, Löscher W. The neurobiology of antiepileptic drugs. Nat Rev Neurosci. 2004;5:553–564. doi: 10.1038/nrn1430. [DOI] [PubMed] [Google Scholar]
- Su H, Sochivko D, Becker A, Chen J, Jiang Y, Yaari Y, Beck H. Upregulation of a T-type Ca2+ channel causes a long-lasting modification of neuronal firing mode after status epilepticus. J Neurosci. 2002;22:3645–3655. doi: 10.1523/JNEUROSCI.22-09-03645.2002. [DOI] [PMC free article] [PubMed] [Google Scholar]
- Suárez LM, Cid E, Gal B, Inostroza M, Brotons-Mas JR, Gómez-Domínguez D, de la Prida LM, Solís JM. Systemic injection of kainic acid differently affects LTP magnitude depending on its epileptogenic efficiency. PLoS One. 2012;7:e48128. doi: 10.1371/journal.pone.0048128. [DOI] [PMC free article] [PubMed] [Google Scholar]
- Thompson CH, Kahlig KM, George AL., Jr SCN1A splice variants exhibit divergent sensitivity to commonly used antiepileptic drugs. Epilepsia. 2011;52:1000–1009. doi: 10.1111/j.1528-1167.2011.03040.x. [DOI] [PMC free article] [PubMed] [Google Scholar]
- Trevelyan AJ, Sussillo D, Watson BO, Yuste R. Modular propagation of epileptiform activity: evidence for an inhibitory veto in neocortex. J Neurosci. 2006;26:12447–12455. doi: 10.1523/JNEUROSCI.2787-06.2006. [DOI] [PMC free article] [PubMed] [Google Scholar]
- Trevelyan AJ, Sussillo D, Yuste R. Feedforward inhibition contributes to the control of epileptiform propagation speed. J Neurosci. 2007;27:3383–3387. doi: 10.1523/JNEUROSCI.0145-07.2007. [DOI] [PMC free article] [PubMed] [Google Scholar]
- Willow M, Gonoi T, Catterall WA. Voltage clamp analysis of the inhibitory actions of diphenylhydantoin and carbamazepine on voltage-sensitive sodium channels in neuroblastoma cells. Mol Pharmacol. 1985;27:549–558. [PubMed] [Google Scholar]
- Xu J, Kang N, Jiang L, Nedergaard M, Kang J. Activity-dependent long-term potentiation of intrinsic excitability in hippocampal CA1 pyramidal neurons. J Neurosci. 2005;25:1750–1760. doi: 10.1523/JNEUROSCI.4217-04.2005. [DOI] [PMC free article] [PubMed] [Google Scholar]
- Yu FH, Mantegazza M, Westenbroek RE, Robbins CA, Kalume F, Burton KA, Spain WJ, McKnight GS, Scheuer T, Catterall WA. Reduced sodium current in GABAergic interneurons in a mouse model of severe myoclonic epilepsy in infancy. Nat Neurosci. 2006;9:1142–1149. doi: 10.1038/nn1754. [DOI] [PubMed] [Google Scholar]