

Abstract
Human tool use is complex, and underlying neural mechanisms seem to be widely distributed across several brain systems; however, neuroimaging studies of actual tool use are rare because of experimental challenges hindering detailed analysis within one acting subject. We developed a “Tool-Carousel” that enabled us to test actual manipulation of different objects during fMRI and investigate the planning and execution of goal-directed actions. Particularly, we focused on the effects of three factors on object manipulations: the type of object manipulated, the type of manipulation, and the hand to be used. The main focus lay on the question of how complex object use compared with unspecific actions are processed and especially how such representations interact with the knowledge about the object in the action-related dorsal stream. We found that object manipulations with both right and left hand recruit a common network strongly lateralized to the left hemisphere especially during planning but also action execution. Specifically, while activity in the ventral stream was involved in processing semantic information and object properties, a dorso-dorsal pathway (i.e., superior occipital gyrus, superior parietal lobule, and dorsal premotor area) was relevant for monitoring the online control of objects and also a ventro-dorsal pathway (i.e., middle occipital gyrus, inferior parietal lobule, and ventral premotor area) was specifically involved in processing known object manipulations, such as tool use. Data further indicate an interaction of ventral stream areas, such as middle temporal gyrus and lateral occipital complex, with both dorsal pathways. These results provide evidence for left-lateralized occipito-temporo-parieto-frontal network of everyday tool use, which may help to characterize specific deficits in patients suffering from apraxia.
Keywords: action execution, action planning, fMRI, tool use
Introduction
Using a tool is a natural action we as humans know by heart from our everyday life to interact with our environment. Studies have focused on viewing, recognizing (Beauchamp et al., 2002; Johnson-Frey et al., 2003; Vingerhoets, 2008), imagining (Grèzes et al., 2003; Boronat et al., 2005; Vingerhoets et al., 2009; Wadsworth and Kana, 2011; van Elk et al., 2012), and pantomime tool use (Moll et al., 2000; Johnson-Frey et al., 2005; Hermsdörfer et al., 2007; Króliczak and Frey, 2009; Vingerhoets et al., 2011). Because of the variety of tasks, the neural activation patterns vary, but several brain areas show consistency. The middle temporal gyrus (MTG) for coding semantic information, the supramarginal gyrus (SMG), the anterior intraparietal area (AIP), and superior parietal lobule (SPL) for processing tool use knowledge for grasping and manipulating tools plus the ventral and dorsal premotor areas (PMv, PMd) for executing motor plans, seem to be core regions for conducting actions with objects and tools (for review, see Lewis, 2006). To understand the neural principles of tool use, we think it is necessary to analyze object manipulation as realistically as possible. A few studies have analyzed actual tool use but did not include visual feedback (Hermsdörfer et al., 2007) or were restricted to only a small selection of tools not reflecting the variety of tools known from daily life with familiar size and corresponding object (Inoue et al., 2001; Imazu et al., 2007; Valyear et al., 2012; Gallivan et al., 2013a). Prior knowledge about the manipulated objects (Vingerhoets, 2008), the task (Valyear et al., 2012; Gallivan et al., 2013a), and which hand is used to perform the action (Hermsdörfer et al., 2007; Króliczak and Frey, 2009) seems to influence the mentioned neural network, but how exactly the network is affected by these three factors during planning and executing real actions with objects and especially real tools is yet not fully understood.
To address this gap, the main goal of this study was to analyze the action network under utmost realistic conditions, by investigating planning and executing actual object manipulation. Three factors influencing the network recruited for processing goal directed actions were addressed: the type of object being manipulated, the type of manipulation performed on the object, and the hand used. First, we aimed to define the neural network that is more relevant for planning and executing actions with tools compared with neutral objects. Second, the neural correlates for the online control of complex functional actions with objects compared with nonfunctional actions were of interest. A special focus laid on the neural underpinnings selective for known tool use. Third, we looked at the structure of the action network while using the dominant compared with nondominant hand and also described the networks with respect to its laterality. The application of a so-called “Tool-Carousel” made it possible to present a variety of actual objects with spatial and temporal precision in the MRI scanner and measure functional images while participants performed real actions.
Materials and Methods
Participants.
Twenty healthy participants (9 males) participated in the fMRI experiment. Three had to be excluded (1 male and 2 female) from further statistical analysis because of strong head movements (head motions exceeded 3 mm in translation and 3° in rotation). The group of participants who were included in the analyses had a mean age of 25 years (age range, 21–28 years). All had normal or corrected-to-normal vision, no history of neurological or psychiatric disorders, and were right-handed, as measured by the Edinburgh Handedness Inventory (Oldfield, 1971). The study was approved by the local ethics committee.
Experimental setup and design.
To present the experimental stimuli, a so-called “Tool-Carousel” (Fig. 1A) was installed above the hips of the participants while lying in the MRI scanner. This setup is comparable with the “Grasparatus” from Culham et al. (2003), a device for fMRI experiments, which makes it possible to present real reachable and graspable objects in the MRI scanner.
Figure 1.

A, The “Tool-Carousel” with six compartments and mountings to hold the tools. B, The experimental setup: a, “Tool-Carousel”; b, adjustable table; c, two-mirror system attached to the head coil; d, visual path to field of vision; e, shoulder belt; f, arm rest. C, Illustration of the four experimental conditions: tool use, tool transport, bar use, and bar transport. All four conditions are performed with the right hand in one and with the left hand in the other run. D, Time course of a trial. Each trial consists of a planning phase (2–6 s long), an execution phase (4 s long), and a return phase (2 s long). In no-action trials, no green light appears; and in action trials, a green light triggers the start of the action. The return phase started when the green light was turned off. No-action trials were used to analyze the planning phase and action trials for the execution phase. E, An exemplary selection of the used stimuli in the experiment; shown are the pen, screwdriver, and spoon and the matched bars.
The “Tool-Carousel” had a diameter of 65 cm and six compartments, which could hold exchangeable mountings for a variety of objects and could be turned around its central axis. It was placed on a table with adjustable height. It was ensured that all participants lay comfortably and could easily reach for the stimuli in the compartments with both right and left hand. The upper arms of the participants were placed on cushions and fixated with a belt to allow easy access to the “Tool-Carousel” while preventing movements of the upper arm and shoulder. The heads of the participants were fixated in the MRI coil with a special set of pads minimizing head motion. A two-mirror system was placed on top of the head coil, which enabled the participants to see the “Tool-Carousel” and their hands (Fig. 1B). The mirror system provided a clear image of the whole compartment with the object. Each compartment of the “Tool-Carousel” was separated by a partition, so only one compartment at a time could be seen by the participant. A mirror system was used to view the workspace because tilting the coil and providing a direct view on the “Tool-Carousel” was not possible in our experimental setup. Additionally, keeping a tilted head position for the whole experiment (i.e., ∼90 min) seemed to be very uncomfortable for the participants. We consider any bias on the resulting task comparisons due to the visual transformations negligible because all conditions included these transformations and any constant effects should be canceled out.
In general, the experiment comprised three different experimental manipulations with two possible variations each. The first two included the object type and the type of action done with the object. The resulting experimental conditions were randomized on a trial-by-trial basis within subject. The hand used to do the tasks was the third experimental manipulation and did not vary within both of the two runs the participants had to perform. The order regarding which hand was the first to be used during the experiment was randomized across participants. A more detailed description of the different experimental conditions is presented in the following paragraphs.
Two different categories of stimuli were presented during the experiment: tools and neutral objects. The tool set comprised 10 different tools regularly used in daily life (hammer, pen, tweezers, scissor, knife, spoon, screwdriver, key, lighter and bottle opener). The other set of stimuli included 10 differently colored and shaped neutral objects. The neutral objects were mainly bar-shaped; for simplicity, we hereinafter call the neutral objects “bars.” To reduce visual and tactile differences between the two stimuli sets, the bars were designed to match the different tools from the first stimulus set as much as possible. The handle of the bars had different shapes (e.g., a small diameter matching the pen or a flat shape matching the nonfunctional part of the spoon and knife). Additionally, the handles of the bars were colored to match the tools. Figure 1E shows examples of three tools and the matched neutral bar-shaped object. One side of each bar was marked in blue. All tools had matching mountings to hold the tool and a tool-specific recipient (nail for the hammer, paper for the pen, cotton ball for the tweezers, string for the scissor to cut, piece of bread for the knife, cup for the spoon, rotatable screw for the screwdriver, keyhole for the key, candle for the lighter, and a bottle with crown seal for the bottle opener). All tools were fully functional with respect to the manipulation (e.g., the screw was placed in a winding and could be turned by the screwdriver, the key fit in the keyhole and was rotatable). Goal attainment was functional in some but not in all actions (e.g., the pen left a trace on the sheet of paper, but the nail did not move into the material during hammering and the lighter did not produce a flame due to security reasons). Therefore, our study addresses the neural correlates of actual tool manipulation but does not intend to reflect representations of goal attainment. In case of the bars, a blue marked opening was placed at the bottom of the mounting, in which the blue end of the bar was to be inserted. All components of the “Tool-Carousel,” as well as all objects, were made of plastics. fMRI compatibility was verified in test scans.
The task was to either use the different objects or to transport them, the latter meaning to grab and lift the object and return it to the mounting. The participants had to perform two runs of functional MRI: one in which they had to use the dominant right hand and the other in which they had to use the nondominant left hand. The order in which the hands were tested was randomized across subjects. In case of the tools, the action typical for the tool should be performed by the participant (e.g., hit the nail with the hammer, write with the pen on paper). To be used comfortably, each of the tools required a different tool-specific functional grip and movement (e.g., grasping the hammer at the handle and move it up and down to hit the nail). The tools were placed in a way that the action could be performed promptly without additional adjustments of the grip (the handle of the tool was placed to the right while the participants used the right hand and left while they used the left hand, respectively). To use the bars, the participants had to put the blue marked end of the bar into the blue opening on the bottom of the mounting (Fig. 1C). Dependent on the placement of the marked end in the mounting (medial or lateral) and the hand used, the participants had to grasp the bar with an overhand (pronated) or underhand grip (supinated) to place the blue end into the opening comfortably (Rosenbaum and Jorgensen, 1992; Marangon et al., 2011). In half of the trials the marked end of the bar was placed to the left, the other half to the right. Therefore, as for the tools, the grip to comfortably use the bar had to be adjusted according to the demands of the task. The order of orientation was randomized across the experiment. A small sign at the top of the mounting showing either the letters “B” (for “benutzen,” the German word for “use”) or “T” (“transportieren” for “transport”) indicated which task the participants had to perform. This setup resulted in four different main conditions: (1) tool use, a functional grip and movement of a known object; (2) tool transport, a nonfunctional grip and movement of a known object; (3) bar use, a functional grip and movement of a neutral object; and (4) bar transport, a nonfunctional grip, and movement of a neutral object.
The experiment had a rapid event-related design with 200 trials per run. Each of the four conditions was comprised of 40 trials (four repetitions for each tool or each bar), resulting in 160 condition trials and 40 control trials. During the control trials, an empty compartment of the tool carousel was shown, these trials served as a control condition for the comparison in the statistical analysis. To ensure an optimal trial order, the Genetic Algorithm toolbox (Wager and Nichols, 2003) for event-related designs was used to create a randomized trial order for each run. The order of objects was randomized across subjects.
Each trial consisted of a planning phase with a duration of 2–6 s in which the object and the cue for the action was presented, followed by an execution phase in which a green light triggered the start and the duration of the cued action. When light was turned off after 4 s, the participants had to stop the action and to return the object to the mounting in maximum 2 s time (return phase) (Fig. 1D). During the intertrial interval (varying equally between 1 and 2 s), the “Tool-Carousel” was turned to present the next stimulus. In half of the trials of each condition, no green light appeared, resulting in 80 action and 80 no-action trials. The order of trials with and without the green light and also the time of the onset of the green light (2–6 s) varied randomly across the run, making it impossible for the participants to predict, if a trial is an action or no-action trial.
Procedure.
Before the fMRI measurement, all participants had to answer a questionnaire, checking their knowledge about the objects used in the experiment and how familiar they are with the usage. Here the participants had to name the object, state if they know the function of the object (scale ranging from 0 = not at all to 3 = yes, very well), how to use it (scale ranging from 0 = not at all to 3 = yes, very well), how often they have used it (scale ranging from 0 = never to 3 = often), how regularly they use it (scale ranging from 0 = never to 4 = daily), how often they have to use it during their job or studies (scale ranging from 0 = never to 4 = very often), if it is an essential object for their daily life (0 = not at all to 2 = very much) and if they own the object.
Experimental procedures and tasks were explained to the subjects via a video instruction on how the different objects are thought to be used and transported followed by a training of all tasks while already laying comfortably in the scanner. The position of the “Tool-Carousel” was adjusted according to the participants' individual size and arm length to ensure that all objects could be used comfortably and according to the instructions. No instance was observed when an object could not be properly grasped or used due to the mounting of the object acting as an obstacle. Participants were asked to do the actions at least once and perform the task carefully without rushing, to avoid short and quick movements, which could disturb data acquisition. The manipulation of all experimental conditions was trained with all objects until participants were able to perform all tasks accurately with both left and right hand in the given time of the execution phase. During the fMRI measurement, Presentation Software (Neurobehavioral Systems) was used to give acoustic instructions via headphones on timing of trials to an operator within the scanner room. The operator exchanged task cues and objects for each trial and turned the “Tool-Carousel” on the acoustic cueing. The subjects received no acoustic simulation. A camera placed at one end of the MRI scanner recorded the hand movements and workspace of the participants.
Video analysis.
The recordings of the camera were used to rate the participants' performance and to evaluate the accuracy of the onset of trials and the duration of hand movements. For the performance rating, the number of errors was counted per participant. One type of error included general task errors and was rated with the scale 0–1: a score of 1 meaning the task was performed according to the cue. For the use conditions, the grip and movement errors were counted. Grasping errors were also rated with the scale 0–1: a score of 1 was given if a functional grip was used to manipulate the object. In case of the tools, the object had to be held on the nonfunctional end with a hand position, enabling the participant to manipulate the tool as usual (e.g., grasp the handle of the hammer or hold the pen in the learned writing position). The correct grip was shown to the participants in the introduction video before the testing. If a subject held the tool in an uncommon way not according to the instructions, the trial was scored with a 0. In the condition bar use, a functional grip was achieved if the participants discriminated between an overhand or underhand grip dependent on whether the blue marked end of the bar was on the medial or lateral side (Rosenbaum and Jorgensen, 1992; Marangon et al., 2011). Another scored aspect of the task was the correct movement performed with the object (scale 0–1). If the subjects moved the object according to its function and how it was shown to them in the instruction, the trial was scored with 1. On the other hand, if the movement was not executed correctly or incomplete (e.g., only moving a tool to the target without the function specific movement or not placing the marked end of the bar in the opening), the trial was scored with 0. Additional to the use condition, also the transport condition was rated. This condition was performed correctly if the object was grasped, lifted, and returned as instructed before the experiment. It was evaluated if a functional grip (as in the use condition) or a nonfunctional transport grip was used. The latter was shown in the introduction video and included grasping the tool in the middle to lift it, but no further tool-specific grip adjustment. In the end, the observations of both runs were averaged for all subjects for each error category.
Even though the participants were asked to perform the movement during the execution phase while the green light was on and return the object when the light was turned off, it cannot be guaranteed that the durations of the hand movements are exactly the same in all trials and participants across the experiment. Therefore, next to the general task performance, also the timing of each individual participant was determined in a video analysis. A motion detection analysis was done with a MATLAB (Release 2012a, MathWorks) based script. One search area and one reference area were selected in each video. The search field included the pixels covering the workspace and hands of the participant, and the reference field included a part of the bore of the MRI scanner where no hand or any other movement occurred. The videos were converted to single picture frames (12.5 frames per second); and to detect motion, the pixels of the search and reference fields of one picture frame were subtracted from the pixels from the following picture frame. The mean across all pixels of these differences was saved as a vector representing a time course of changes in the search and reference field, respectively, for each subject. A movement was detected if the value exceeded a certain threshold. This threshold was calculated for each subject individually and represented a mean value of a time period of 4 s from the beginning of each run in which no hand movement occurred. The results from the motion detection from the reference field only show peaks when the action signal (green light) was turned on and off. This information was used to confirm that the detected hand movements in the search field were related to the task and represent the action in the execution phase. Correct performance of the automatized motion detection was verified by visual inspection. In general, subjects' movements filled the 4 s execution time in all conditions. Quantitative analysis revealed that the mean time across subjects needed for the tool condition was 4.2 s, for bar 4.0 s, for use 4.4 s and for transport 3.8 s. These results led to a significant (p < 0.05, Bonferroni corrected for two comparisons) difference in duration of 0.2 s for the comparison of objects and 0.6 s for the comparison of the task. The periods of each subject's hand movements were introduced into the first-level analysis to ensure an accurate modeling of events and to control for the variance in duration across conditions (this process is explained in more detail in fMRI analysis).
MRI measurement.
All fMRI measurements were performed on a Siemens 3 Tesla Verio MRI scanner. T1-weighted anatomical images were acquired with the MP-RAGE sequence, whereas the BOLD echo-planar images were measured using a T2*-weighted gradient echo sequence with the repetition time TR = 2000 ms, echo time TE = 30 ms, field of view = 192 mm, flip angle α = 90°, matrix = 64 × 64, slices = 35, slice thickness = 3 mm and voxel size = 3 mm × 3 mm × 3 mm.
fMRI data analysis.
The entire data analysis was performed with SPM8 (Statistical Parametric Mapping software; Wellcome Department of Imaging Neuroscience, London; http://www.fil.ion.ucl.ac.uk). Before entering the statistical analysis, the fMRI data were preprocessed by using a slice time correction, realigning the images to correct for movement artifacts, coregistering the anatomical, and normalizing all images to standard space (Montreal Neurological Institute, see SPM software). Thereafter, the functional datasets were smoothed with a Gaussian kernel of 8 mm for group analysis.
The statistical analysis was performed at two levels. At the first level for each subject, the onsets of each condition were modeled in a GLM as events, which are represented as stick functions and convolved with the hemodynamic response function. The design matrix comprised two sessions, representing the runs in which the subjects used the right or the left hand, respectively. The design matrix for one run was composed of 15 regressors representing the experimental conditions and six regressors comprising the realignment parameters. The 15 condition regressors included a separate regressor for the planning phases of each condition for the no-action trials as well as the action trials (two times: tool use, tool transport, bar use, bar transport). Four additional regressors modeled the execution phase of the action trials of all conditions as events. The 13th regressor represents the control condition. The 14th modeled the individual trials in which the subjects made errors. The last regressor included the duration of hand movement, which was detected for each subject individually by the motion detection analysis of the video recording. This regressor, therefore, covers the hand movement during the execution phase and return phase of all conditions in one. Because this study does not aim to analyze the basic sensorimotor processing of movements, the purpose of this regressor is to explain the variance in the data, which is caused by the duration of hand movements the subjects need to perform the different tasks and to return the objects. To verify that this regressor explains mainly basic sensorimotor processes as during the period of hand movement, a second-level one-sample t test of this regressor was performed.
At the second level for the main activation analysis, contrast images of each participant were entered into a 2 × 2 × 2 factorial design with the factors object (level: tool or bar), task (level: use or transport), and hand (level: right or left). Separate second-level analyses were performed for the main effects and interactions of the planning and execution phase, respectively. The contrast images which entered the factorial design included the comparisons of each condition separately to the control condition. The second-level analysis of the planning phase comprised the contrast images of the no-action trials only, which eliminates the influence of actual movement in this data analysis. The analysis for the execution phase includes the contrast images of the action trials only. A brain mask was created for action planning and execution and applied to the second-level analysis, including the added activations of all conditions compared with the control condition at a threshold of p < 0.001. The anatomical labeling of the results was done with the Anatomy Toolbox (Eickhoff et al., 2005) and the graphical display of the statistical maps with the BrainNet Toolbox (Xia et al., 2013). Bar plots showing the contrast estimates of peak activations of clusters at a threshold of p < 0.05 (and family-wise error [FWE] correction) were constructed to display activations toward the control condition for all four conditions separately.
Laterality index (LI).
To evaluate the laterality of the tool use and action network the LI was calculated with the LI toolbox (Wilke and Lidzba, 2007) for each condition and each subject on a first-level basis to test the laterality across the group. Additionally, the LIs of the activation maps of the second-level analysis were estimated. Because the LI is strongly dependent on the threshold used for the images in the analysis, the bootstrap method was used as recommended by the developers of the toolbox (Wilke and Schmithorst, 2006; Seghier, 2008). The bootstrap method creates 10,000 LIs, which are calculated at a range of different thresholds. Taking the results from the different thresholds into account, a weighted LI is calculated. These values range from −1 (right sided lateralization) to 1 (left-sided lateralization). To analyze the laterality of the network in more detail and ensure that the calculated LIs are not biased by contralateral motor-sensory processing, the calculation for the individual images was performed for the occipital, temporal, parietal, and frontal lobe, whereas the primary sensorimotor cortices were excluded and analyzed separately.
To test for significant difference of LI from zero (zero corresponds to symmetrical activation), a t test of the subjects' LIs was performed for each condition separately. Additionally, the individual LIs were entered into a three-way ANOVA with the three factors object, task, and hand to evaluate significant main effects for each factor.
Results
Behavioral data: questionnaire
The questionnaire, which was filled out by the participants before the start of the experiment aimed at measuring if the participants knew the objects used in the experiment and how familiar they are with using them. The median score of the questions testing for tool knowledge (naming the tool, knowing function, and how to use it) was 70 points (range, 66–70 points). The possible maximum score was 70 points, showing that all participants knew all tools (one scored only 66 because this participant did not clearly recognize one object on the given photo but knew it after clarification). Regarding the bars, the median score was 0 (range, 0–3 points), showing that participants, as expected, had no prior knowledge of the bar's function or use. Concerning the familiarity of objects, the participants scored a median of 75 points (range, 54–98 points) for the tools and 0 for the bars. The possible maximum score was 130 points per participant, which would mean that all included tools had to be used on a daily basis during the participants job and daily routine. The minimum score was 0, which would indicate that the object has never been used by the participant before and its usage is not familiar to him or her. All participants owned all of the tools but not the bars, except for two participants, who did not own a lighter. All in all, the results of the questionnaire show that all participants knew the tools and were familiar with using them but did not do so for the bars.
Behavioral data: video analysis
Performance of the participants was evaluated by scoring the video recordings of their hands and the workspace. This evaluation was performed to ensure correct performance according to the cues and instructions and to assess whether functional grips and movements were used. For all conditions, it was evaluated whether the correct action according to the cued experimental condition was performed. In total, the median number of errors was one error (range, 0–2 errors) per participant (during a total of 400 trials). In the following, only trials in which the correct cued task was performed will be considered. During the tool use condition, the median error score regarding the use of a functional grip was 1 (range, 0–5 errors), and for mistakes concerning the movement of the tool was 0 (range, 0–4 errors). There was no significant difference of the number of mistakes made between the two runs. In all trials of the condition tool transport, a nonfunctional grip was used to transport the tool by all participants. The condition bar use was performed correctly by all participants in all trials. The participants made an overhand grip in all possible 20 trials, which required this type of grip. In the 20 trials in which an underhand grip was appropriate, the median number of underhand grips was 19 (range, 20–13). In the remaining trials, an overhand grip was used. This shows subjects adjusted the grip dependent on the objects properties (is the marked end on the medial or lateral side). The participants made no movement errors in the bar use condition. In the bar transport condition, the same lifting grip was used as in the tool transport condition in all trials.
All in all, the behavioral results showed that the task was mostly performed correctly and that the condition tool use and bar use were performed using a functional grip and movement for each object relative to the goal of the action. On the other hand, during both the condition tool transport and bar transport, a nonfunctional transport grip and movement was used.
Movement duration
To clarify which brain regions are sensitive to possible variations of the movement duration, a second-level analysis was performed. The anatomical location of the peak voxels and the corresponding p values are given in Table 1. Results are shown with a threshold of p < 0.05 and an FWE correction. The results of this analysis revealed mainly the sensorimotor cortices of both hemispheres and an occipito-temporo-parieto-frontal network of right, but none of the left, side brain areas involved in tool use as reported below.
Table 1.
Anatomical locations and the p values of peak voxels of the one-sample t test results for the subjects' individual period of hand movementsa
| Brain area | p |
|---|---|
| Left hemisphere | |
| Precentral gyrus | 0.0381 |
| Superior parietal lobule, SPL 5A | 0.0010 |
| Inferior occipital gyrus | 0.0090 |
| Postcentral gyrus | 0.0005 |
| Right hemisphere | |
| Inferior frontal gyrus (pars opercularis) | 0.0001 |
| Inferior frontal gyrus (pars triangularis) | 0.0010 |
| Middle frontal gyrus | 0.0031 |
| Superior frontal gyrus | 0.0008 |
| Superior medial gyrus | 0.0450 |
| Insula | 0.0037 |
| Lingual gyrus | 0.0071 |
| Postcentral gyrus | 0.0000 |
| Precuneus | 0.0000 |
| Supramarginal gyrus | 0.0000 |
| Inferior temporal gyrus | 0.0042 |
| Superior temporal gyrus | 0.0000 |
aData are the p values of the peak voxel of a cluster in an anatomical area. Only clusters are reported, which survive a threshold of p < 0.05 (FWE).
fMRI activation analysis
The following section reports the neural responses for the manipulation of tools and neutral objects during action planning and execution and the main effects of the factors object, task, and hand. As a first step, activation caused by all task conditions versus the control condition during action planning was calculated to determine the brain areas necessary for processing the planning of object related manipulations independent of specific functions and object semantics. The activity maps are shown at a threshold of p < 0.05 with an FWE correction. This analysis showed a left-sided network (Fig. 2A, top), including clusters in the temporal lobe, such as the fusiform gyrus (FG) and lateral occipital complex (LOC), MTG, clusters in the parietal lobe (SPL, SMG), including anterior and posterior parts of the intraparietal area, frontal activation, including PMv, PMd, insula lobule, and a cluster in the middle frontal gyrus (MFG). The LI for this contrast is 0.64 for frontal, 0.92 for parietal, 0.69 for temporal, and 0.58 for the occipital lobe, whereas the LI for the sensorimotor cortex is 0.99. The same analysis was performed for the execution phase (Fig. 2A, bottom) showing a wider bilateral network with additional activations in primary sensory and motor cortex in both hemispheres. The calculated LI for this contrast is 0.45 for frontal, 0.34 for parietal, 0.06 for temporal, and −0.091 for the occipital lobe, whereas the LI for the sensorimotor cortex is 0.58.
Figure 2.

Whole-brain results for the action network in A and the main contrast for the factor object in B. A, The activity maps of the contrast all conditions versus control condition shown for the planning phase in the top and for the execution phase on the bottom. B, The activity map of the contrast tool versus bar is shown for the planning phase in the top and for the execution phase in the bottom. All results of Figure 2 are shown at a threshold of p < 0.05 (FWE corrected) on a rendered brain. The color scale under the brain images indicates the range of the T values from low values in dark red to high values in white. IOG, Inferior occipital gyrus; MOG, middle occipital gyrus.
The tool network during actual action planning and execution
To statistically determine the brain regions that are more active for planning actions with known objects (tools) compared with neutral objects (bars), the contrast tool versus bar was calculated and is shown in Figure 2B (top) at p < 0.05 (FWE corrected). The results showed an overall mainly left-sided activation pattern (LI frontal lobe, 0.75; LI parietal lobe, 0.83; LI temporal lobe, 0.49; LI occipital lobe, −0.38; LI sensorimotor cortex, 0.84). Additional to clusters in inferior occipital gyrus, the LOC, MTG, and FG were activated. In the parietal cortex, the SPL, SMG, and the inferior parietal lobe, including the AIP, showed a specification for the tool conditions compared with bars. A frontal cluster was located in the PMd and is listed in Table 2 with the other results. No specific region was activated for the opposite contrast bars versus tools during action planning.
Table 2.
Anatomical locations and the p values of peak voxels for all calculated contrastsa
| Brain area | Planning phase |
Execution phase |
|||||||
|---|---|---|---|---|---|---|---|---|---|
| All versus baseline | Tool versus bar | Use versus transport | All versus baseline | Tool versus bar | Use versus transport | Interaction of task × object | Left versus right | Right versus left | |
| Left hemisphere | |||||||||
| Frontal lobe | |||||||||
| Inferior frontal gyrus, PMv | 0.0000 | 0.0000 | 0.0000 | 0.0001 | |||||
| Inferior frontal gyrus (pars orbitalis) | 0.0000 | ||||||||
| Inferior frontal gyrus (pars triangularis) | 0.0035 | ||||||||
| Middle cingulate cortex | 0.0000 | 0.0000 | |||||||
| Middle frontal gyrus | 0.0000 | 0.0000 | 0.0000 | 0.0107 | |||||
| Precentral gyrus | 0.0000 | 0.0001 | 0.0065 | 0.0227 | |||||
| SMA | 0.0000 | 0.0010 | |||||||
| Superior frontal gyrus | 0.0000 | ||||||||
| Superior frontal gyrus, PMd | 0.0000 | 0.0088 | 0.0001* | 0.0007 | |||||
| Insula lobe | |||||||||
| Insula | 0.0000 | 0.0000 | 0.0000 | ||||||
| Occipital lobe | |||||||||
| Cuneus | 0.0003 | ||||||||
| Inferior occipital gyrus | 0.0000 | 0.0000 | 0.0000 | 0.0000 | |||||
| LOC | 0.0000 | 0.0000 | 0.0040 | 0.0017 | |||||
| Middle occipital gyrus | 0.0000 | 0.0242 | 0.0000 | 0.0010 | 0.0001 | ||||
| Superior occipital gyrus | 0.0000 | 0.0160 | 0.0025 | 0.0003 | |||||
| Superior occipital lobule | 0.0003 | ||||||||
| Parietal lobe | |||||||||
| Anterior intraparietal area | 0.0000 | 0.0048 | 0.0347 | ||||||
| Inferior parietal lobule | 0.0000 | 0.0130 | |||||||
| Inferior temporal gyrus | 0.0000 | ||||||||
| Postcentral gyrus | 0.0000 | 0.0000 | 0.0000 | 0.0141 | 0.0015 | 0.0034 | |||
| Precuneus | 0.0000 | ||||||||
| Superior parietal lobule | 0.0000 | ||||||||
| Superior parietal lobule, SPL 7A | 0.0000 | 0.0004* | 0.0000 | 0.0000 | 0.0370 | ||||
| Supramarginal gyrus | 0.0000 | 0.0000 | 0.0025 | ||||||
| Temporal lobe | |||||||||
| Fusiform gyrus | 0.0000 | 0.0006 | 0.0003 | 0.0020 | |||||
| Inferior temporal gyrus | 0.0000 | 0.0178 | |||||||
| Middle temporal gyrus | 0.0000 | 0.0161 | 0.0131 | ||||||
| Superior temporal gyrus | 0.0000 | 0.0003 | |||||||
| Temporal pole | 0.0383 | ||||||||
| Right hemisphere | |||||||||
| Frontal lobe | |||||||||
| Inferior frontal gyrus, PMv | 0.0000 | 0.0010 | |||||||
| Inferior frontal gyrus (pars triangularis) | 0.0000 | ||||||||
| Inferior frontal gyrus (pars orbitalis) | 0.0000 | ||||||||
| Middle cingulate cortex | 0.0000 | 0.0000 | |||||||
| Middle frontal gyrus | 0.0040 | ||||||||
| Precentral gyrus | 0.0000 | 0.0000 | |||||||
| SMA | 0.0020 | ||||||||
| Insula lobe | |||||||||
| Insula | 0.0180 | 0.0000 | 0.0010 | ||||||
| Occipital lobe | |||||||||
| Calcarine gyrus | 0.0252 | ||||||||
| Inferior occipital gyrus | 0.0000 | 0.0000 | 0.0000 | 0.0000 | |||||
| LOC | 0.0000 | ||||||||
| Parietal lobe | |||||||||
| Postcentral gyrus | 0.0000 | 0.0000 | |||||||
| Precentral gyrus | 0.0000 | ||||||||
| Precuneus | 0.0000 | 0.0000 | 0.0000 | ||||||
| Superior parietal lobule | 0.0000 | 0.0015 | |||||||
| Superior parietal lobule, SPL 7A | 0.0000 | ||||||||
| Temporal lobe | |||||||||
| Fusiform gyrus | 0.0000 | 0.0009 | 0.0000 | ||||||
| Middle temporal gyrus | 0.0000 | ||||||||
| Temporal pole | 0.0160 | ||||||||
aData are the p values of the peak voxel of a cluster in an anatomical area. Mainly clusters are reported, which survive a threshold of p < 0.05 (FWE).
*Uncorrected p values.
The execution phase was analyzed in the same way (Fig. 2B, bottom). The contrast tool versus bar revealed activation differences in the same temporal, parietal, and frontal regions as during the planning phase, but to a larger extent and with additional clusters in the PMv, PMd, insula, MFG, primary sensory, and motor cortex. The network is still lateralized to the left, although to a lesser extent due to the recruitment of the right-sided areas while executing actions with the left hand. Because the condition bar also required hand movements, contrast differences in primary motor activation were however not significant. The anatomical locations of the clusters and the statistical values of the peak voxel in all clusters of both contrasts can be found in Table 2. The reverse contrast bar versus tool for execution phase did not show significant clusters surviving at this threshold.
Neural correlates of using objects and the knowledge of how to use a tool
To study the influence of the manipulation type on the action network, we focused on the factor task in this part of the analysis. To define the brain regions engaged in functional tool use and object manipulation independent of the specific object type, the contrast use versus transport was calculated. This analysis was performed for both planning phase and execution phase. For the planning phase, two clusters were found only at a threshold of p < 0.001 (uncorrected). One was located in left SPL and the other in the left PMd. The uncorrected activation map of the planning phase is shown in blue as an overlay on the activation map of the execution phase in Figure 3A. The corresponding uncorrected p values of the peak voxels are listed in Table 2. The activation map of the execution phase is shown at p < 0.05 with an FWE correction (red color scale). The network involved in controlling a functional grip and the manipulation of an object included the left LOC, a cluster in the left lateral part of the superior occipital gyrus (SOG) close to the parietal-occipital sulcus, SPL, and left PMd, the latter two matched the areas also described for the planning phase. Additionally, primary sensory and motor cortices were more active during the use than during the transport of an object. This network for functional use, including the grip and specific movements, was mainly lateralized to the left hemisphere, except for a cluster in the right SPL resulting in the following LIs: LI frontal lobe, 0.76; LI parietal lobe, 0.76; LI temporal lobe, 0.81; LI occipital lobe, 0.85; LI sensorimotor cortex, 0.68. The contrast estimates and 90% CI of each of the four experimental conditions versus control condition were plotted for regions of interest (Fig. 3A). Compared with the control condition, all regions were activated in all separate task conditions, but the responses were higher for the condition use compared with transport independent of which object was used. However, the use of tools in all regions produced a higher response than the condition bar use.
Figure 3.

Results showing the influence of the factor task on the action network. A, Activity map of the contrast use versus transport is shown for the execution phase. Bar plots represent the contrast estimates of the peak voxel and 90% CI in the labeled cluster for all four conditions. TU, Tool use; TT, tool transport; BU, bar use; BT, bar transport. The uncorrected activations during the planning phase that did not survive the correction for multiple testing are shown as a blue overlay. B, Activity maps of the interaction between the factor object and task ((tool use vs tool transport) − (bar use vs bar transport)) is superimposed onto a rendered brain for the execution phase. All results of Figure 3 are shown at a threshold of p < 0.05 (FWE corrected). *The three lines across the bar plots indicate that the contrast estimates of the condition tool use is significantly higher than in the other conditions with a threshold of p < 0.001. The color scale under the brain images indicates the range of the T values from low values in dark red to high values in white. MOG, Middle occipital gyrus; PoG, postcentral gyrus.
To define the brain regions coding function-specific tool knowledge during execution, the interaction between the factors object and task was calculated ((tool use − tool transport) vs (bar use − bar transport)). To restrict the analysis to regions with the highest sensitivity to tool use, but not to the other three conditions, the interaction was masked with the intersection of the three contrasts: tool use versus tool transport, tool use versus bar use, and tool use versus bar transport (threshold for the masking contrasts was p < 0.001 uncorrected). These regions therefore showed the highest sensitivity for the use of tools compared with goal-directed manipulation of neutral objects and do not reveal object-specific activations for nonfunctional transport actions. The other three conditions (tool transport, bar use, and bar transport) were not significantly different from each other. The statistical map is shown in Figure 3B at p < 0.05 (FWE corrected). In addition to a cluster in the posterior MTG clusters were detected in the middle occipital gyrus close to V5, PMv, in a posterior part of the SMG, and the medial part of the SOG. Additionally, a cluster in the left postcentral gyrus showed an interaction. This network included exclusively left-sided clusters, which are listed in Table 2. The contrast estimate and 90% CI of each of the four experimental conditions versus control condition were plotted for the regions of interest (Fig. 3B). The LIs for the interaction are 0.31 for the frontal lobe, 0.65 for the occipital lobe, 0.77 for the parietal lobe, 0.035 for the sensorimotor cortex, and 0.52 for the temporal lobe. The same analysis for the planning phase or any other interaction between the factors object and task revealed no significant clusters surviving a threshold of p < 0.05 with an FWE correction.
Handling tools with the dominant and nondominant hand
The results above for the combined data of the right and left hand showed a left-lateralized tool network for action planning and execution independent of the used hand. To compare the structure of the action network for the dominant and the nondominant hand (in our case right and left hand, respectively), the contrasts right versus left and left versus right were calculated. No significant differences were found in the planning phase at a threshold of p < 0.05 (FWE corrected) for both contrasts. The direct comparison of both conditions for the execution phase revealed for the contrast right versus left, as could be expected, a cluster in the left motor cortex (Fig. 4). The calculation of the LIs revealed a value of 0.94 for frontal lobe, −0.47 for occipital lobe, 0.18 for parietal lobe, 0.96 for sensorimotor cortex, and 0 for temporal lobe. The reverse contrast (left vs right) revealed a left-sided activation pattern next to a strong cluster in the right motor cortex and SMA; the activations include temporal (superior temporal gyrus, MTG, ITG), inferior parietal (SMG, AIP), and several frontal areas (MFG, PMd, PMv). The following LIs were calculated for this contrast: 0.80 for frontal lobe, 0.89 for occipital lobe, 0.93 for parietal lobe, −0.43 for sensorimotor cortex, and 0.95 for temporal lobe.
Figure 4.
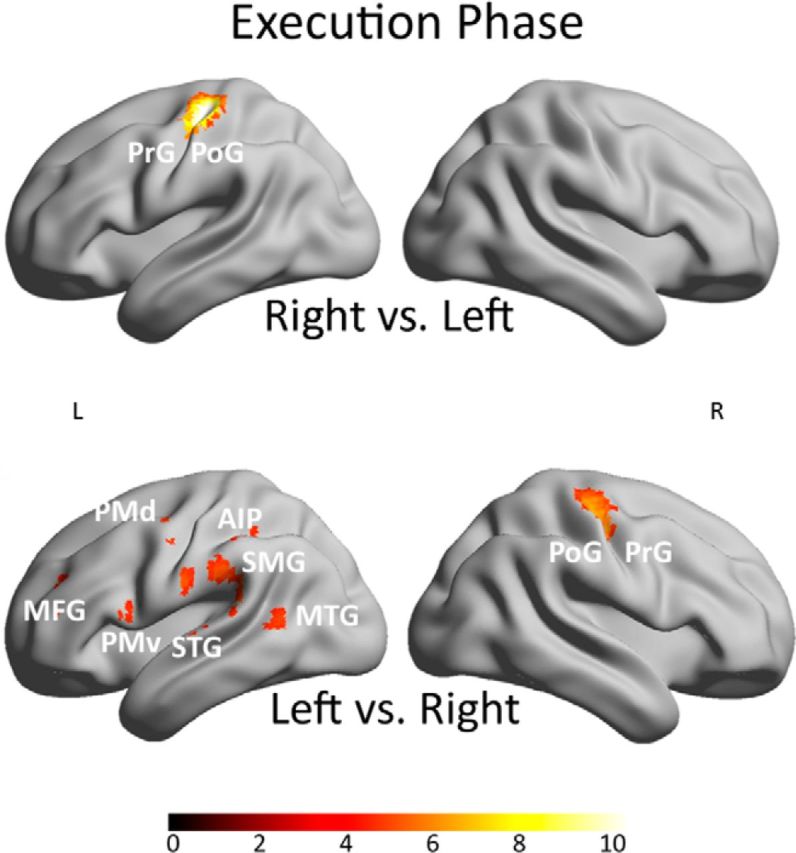
Results showing the influence of the factor hand on the action network. Activation maps of the contrast right hand versus left hand on the top and left hand versus right hand on the bottom for the execution phase. All results of Figure 4 are shown at a threshold of p < 0.05 (FWE corrected) on a rendered brain. The color scale under the brain images indicates the range of the T values from low values in dark red to high values in white. IOG, Inferior occipital gyrus; STG, superior temporal gyrus; PrG, precentral gyrus; PoG, postcentral gyrus.
The interactions between the factors hand and object or task did not reveal significant clusters surviving a threshold of p < 0.05 with an FWE correction.
LI
To verify the lateralization of the network relevant for planning and execution actions with tools and neutral objects across subjects, the LI for all lobes and conditions was calculated separately, tested for significance, and compared for the factors object, task, and hand. The mean LI and p value for all conditions and lobes are shown in Table 3 for action planning and execution. The mean LI, p value, and F value of main effects for each factor are shown in Table 4 for the planning phase and execution phase. The results indicate a significant left-sided lateralization during action planning in the parietal lobe, temporal lobe, and sensorimotor cortex in almost all conditions. During action execution, a significant left-sided lateralization is obvious for all use conditions in the frontal lobe and for tool use right and left and bar use left in the parietal lobe. A right-sided lateralization could be found for the right-hand conditions in the temporal lobe. In the sensorimotor cortex, a clear left-sided lateralization can be found in the right-hand condition, whereas the left-hand condition shows a weak right-sided lateralization, which is only significant for the condition bar transport left. The comparison of factors show for the planning phase a significant main effect for the factor object with a higher left-sided lateralization for tool than bar in the frontal, parietal, and temporal lobe as well as in the sensorimotor cortex. During action execution, a stronger left-sided lateralization is found in the parietal lobe for the condition tool compared with bar and in all areas for use compared with transport. A significant main effect for the factor hand can be found in the temporal lobe (stronger left-sided lateralization for left than right), occipital lobe (stronger left-sided lateralization for left than right), and the sensorimotor cortex (stronger left-sided lateralization for right than left). In summary, this analysis shows that especially the process of action planning, but also the execution of object use, is left-lateralized.
Table 3.
Group mean LIs for all conditions and brain lobes and p values of statistical test for significant laterality
| Condition | Frontal lobule |
Parietal lobule |
Temporal lobule |
Occipital lobule |
Sensorimotor cortex |
|||||
|---|---|---|---|---|---|---|---|---|---|---|
| LI | p | LI | p | LI | p | LI | p | LI | p | |
| Planning phase | ||||||||||
| Tool use right | 0.253 | 0.097 | 0.736 | 0.000* | 0.533 | 0.000* | 0.249 | 0.008* | 0.740 | 0.000* |
| Tool transport right | 0.589 | 0.000* | 0.743 | 0.000* | 0.454 | 0.001* | 0.187 | 0.117 | 0.801 | 0.000* |
| Bar use right | 0.396 | 0.000* | 0.526 | 0.001* | 0.282 | 0.019* | 0.364 | 0.003* | 0.623 | 0.000* |
| Bar transport right | 0.124 | 0.328 | 0.519 | 0.000* | 0.372 | 0.002* | 0.318 | 0.013* | 0.295 | 0.081 |
| Tool use left | 0.363 | 0.003* | 0.574 | 0.000* | 0.335 | 0.012* | 0.074 | 0.549 | 0.603 | 0.000* |
| Tool transport left | 0.436 | 0.001* | 0.453 | 0.005* | 0.273 | 0.065* | 0.037 | 0.772 | 0.469 | 0.006* |
| Bar use left | 0.179 | 0.123 | 0.344 | 0.001* | 0.223 | 0.103 | 0.297 | 0.005* | 0.413 | 0.005* |
| Bar transport left | 0.301 | 0.009* | 0.355 | 0.014* | 0.262 | 0.050* | 0.101 | 0.481 | 0.375 | 0.013* |
| Execution phase | ||||||||||
| Tool use right | 0.414 | 0.000* | 0.288 | 0.009* | −0.323 | 0.004* | −0.073 | 0.543 | 0.543 | 0.000* |
| Tool transport right | 0.172 | 0.181 | 0.134 | 0.276 | −0.446 | 0.000* | −0.140 | 0.219 | 0.509 | 0.000* |
| Bar use right | 0.511 | 0.000* | 0.215 | 0.139 | −0.263 | 0.024* | 0.062 | 0.631 | 0.758 | 0.000* |
| Bar transport right | 0.129 | 0.302 | 0.144 | 0.090 | −0.338 | 0.003* | −0.055 | 0.654 | 0.430 | 0.000* |
| Tool use left | 0.420 | 0.001* | 0.561 | 0.000* | 0.573 | 0.002* | 0.604 | 0.001* | −0.064 | 0.664 |
| Tool transport left | 0.078 | 0.488 | 0.289 | 0.116 | 0.254 | 0.177 | 0.214 | 0.232 | −0.144 | 0.247 |
| Bar use left | 0.263 | 0.032* | 0.447 | 0.002* | 0.462 | 0.011* | 0.490 | 0.001* | −0.164 | 0.154 |
| Bar transport left | −0.050 | 0.632 | 0.125 | 0.415 | 0.011 | 0.949 | −0.090 | 0.584 | −0.374 | 0.001* |
*The mean LI value is significantly different from zero at a threshold of p < 0.05.
Table 4.
Mean LIs for the levels of all factors and statistics for the test of main effects of factorsa
| Factor | Level | Frontal lobule |
Parietal lobule |
Temporal lobule |
Occipital lobule |
Sensorimotor cortex |
||||||
|---|---|---|---|---|---|---|---|---|---|---|---|---|
| Mean LI | Statistics | Mean LI | Statistics | Mean LI | Statistics | Mean LI | Statistics | Mean LI | Statistics | |||
| Planning phase | ||||||||||||
| Object | Tool | 0.410 | p = 0.011* | 0.626 | p = 0.001* | 0.399 | p = 0.014* | 0.137 | p = 0.018* | 0.653 | p = 0.004* | |
| Bar | 0.250 | F = 8.46 | 0.436 | F = 18.49 | 0.285 | F = 7.66 | 0.270 | F = 7.01 | 0.426 | F = 11.51 | ||
| Task | Use | 0.298 | p = 0.327 | 0.545 | p = 0.605 | 0.343 | p = 0.945 | 0.246 | p = 0.062 | 0.594 | p = 0.051* | |
| Transport | 0.363 | F = 1.02 | 0.517 | F = 0.28 | 0.340 | F = 0.00 | 0.161 | F = 4.06 | 0.485 | F = 4.50 | ||
| Hand | Right | 0.340 | p = 0.853 | 0.631 | p = 0.135 | 0.410 | p = 0.374 | 0.280 | p = 0.248 | 0.615 | p = 0.253 | |
| Left | 0.320 | F = 0.03 | 0.431 | F = 2.49 | 0.273 | F = 0.83 | 0.127 | F = 1.44 | 0.465 | F = 1.41 | ||
| Execution phase | ||||||||||||
| Object | Tool | 0.271 | p = 0.133 | 0.318 | p = 0.025* | 0.014 | p = 0.534 | 0.151 | p = 0.354 | 0.211 | p = 0.232 | |
| Bar | 0.213 | F = 2.52 | 0.233 | F = 6.17 | −0.032 | F = 0.40 | 0.102 | F = 0.91 | 0.263 | F = 1.55 | ||
| Task | Use | 0.402 | p = 0.008* | 0.378 | p = 0.001* | 0.112 | p = 0.011* | 0.271 | p = 0.002* | 0.268 | p = 0.021* | |
| Transport | 0.082 | F = 9.42 | 0.173 | F = 16.23 | −0.129 | F = 8.46 | −0.018 | F = 13.21 | 0.105 | F = 16.63 | ||
| Hand | Right | 0.306 | p = 0.257 | 0.195 | p = 0.432 | −0.342 | p = 0.001* | −0.051 | p = 0.036* | 0.560 | p = 0.001* | |
| Left | 0.178 | F = 1.38 | 0.356 | F = 0.65 | 0.325 | F = 16.50 | 0.305 | F = 5.32 | −0.186 | F = 52.85 | ||
aMean group laterality indices for levels of all factors and the p values and F values (df = 16) of the main effect of each factor.
*Significant main effect at a threshold of p < 0.05.
Discussion
The current study aimed to describe the neural bases of actual tool use by investigating planning and executing actions with known tools and neutral objects for the dominant and nondominant hand. A wide strongly left-lateralized network was identified, including parietal and frontal areas and areas of the ventral stream in addition to the obligatory primary sensorimotor areas as related studies have reported (Inoue et al., 2001; Hermsdörfer et al., 2007; Gallivan et al., 2013a). More specifically, we are able to extend the characterization of three previously reported posterior streams (Milner and Goodale, 2008; Binkofski and Buxbaum, 2013) with distinctive functions in real tool use: the ventral stream that is relevant for processing semantic tool information and object properties, a dorso-dorsal pathway that is relevant for online monitoring the grip and movements of objects during complex actions, and, additionally, a ventro-dorsal pathway that is specifically involved in processing known object manipulations, such as tool use.
Direct evidence for the separation of the dorsal stream in two processing pathways
By looking at complex goal-directed actions irrespective of object identity compared with simpler actions, we are able to define areas that are increasingly recruited for monitoring the online control of demanding object manipulations. The comparison of the condition use and transport showed higher activations in left SPL, PMd, SOG, and LOC. In previous research, Martin et al. (2011) noted that additional to other areas left- and right-handers show activity in SPL, reaching from the posterior parietal sulcus to the parietal-occipital sulcus and in PMd during grip selection and grasp planning. The cluster in the SOG of our results is close to the superior parietal occipital complex, which several studies have described as an important cerebral region in reach-to-grasp actions in humans (Cavina-Pratesi et al., 2010; Gallivan et al., 2011; Monaco et al., 2011). A stronger recruitment of these “grip regions” could be based on the fact that the selection of a functional grip is more demanding and complex than a simpler transport grip (Verhagen et al., 2013). Furthermore, it might not only be the complexity and the intended goal of the performed action, which is specific for each of the two conditions, but also the process of action selection. Because the same action was performed during the transport condition for all trials but a variety of different actions during the use condition, we can assume that the found neuronal circuit might also be involved in the action selection process. Additionally, it is important to say that all stated regions have been mentioned as being part of the dorso-dorsal pathway described by Binkofski and Buxbaum (2013). The dorso-dorsal pathway is running from the visual area V6 to the SPL ending in the PMd (Rizzolatti and Matelli, 2003). It is necessary for monitoring correct reaching and grasping movements to handle an object dependent on the object's properties (Grol et al., 2007). The increased load of online control and necessary movement adjustments during the use condition, irrespective of object type compared with the transport, could be the reason that the pathway along the SOG, SPL, and PMd is recruited stronger (Glover et al., 2005, 2012; Striemer et al., 2011). As our results show, SPL and PMd are not only relevant for the online control of monitoring actions but possibly also for planning demanding actions. Even though the comparison of planning the use and transport of actions did not survive the correction for multiple testing, it is interesting to see that a similar activation pattern can be found for planning and executing complex actions. Interestingly, next to these dorsal stream areas, also the LOC of the ventral stream is sensitive for using known but also neutral objects. Its involvement in object recognition and therefore in tool-related tasks is known (Grill-Spector and Malach, 2004; Vingerhoets, 2008; Wurm et al., 2012). Additionally, it seems to be relevant for processing the dimensions of neutral objects, which are relevant for grasping (Monaco et al., 2014) and also when viewing unfamiliar or infrequently used tools compared with familiar tools (Vingerhoets, 2008). LOC coactivation with the dorso-dorsal stream in the use condition indicates its relevance for calculating object properties necessary to manipulate objects independent of their identity or familiarity and monitor the online control of actions with these objects.
With the analysis of the interaction of object and task, we are able to isolate a network specifically relevant for tool use. This network includes the middle occipital gyrus close to V5 and clusters covering parts of the SMG, postcentral gyrus, and PMv of the left hemisphere. The areas are in line with the description of the ventro-dorsal stream (Binkofski and Buxbaum, 2013), which is suggested to run from the medial superior temporal area (MT/MST) to the inferior parietal lobule and the PMv (Rizzolatti and Matelli, 2003; Buxbaum and Kalénine, 2010; Binkofski and Buxbaum, 2013). It is thought to be important for processing the knowledge of specific learned object manipulations, such as tool use (Frey, 2008; Buxbaum and Kalénine, 2010). Especially parietal structures show strong influence in coding actions particularly related to tools (Valyear et al., 2007, 2012; Vingerhoets et al., 2009; Verhagen et al., 2012; Peeters et al., 2013). This also seems to be true for the PMv, which is suggested to monitor the hand posture relevant for actions with a tool (Vingerhoets et al., 2013). Patients suffering from apraxia, with difficulties in grasping and using tools or performing pantomime of use, usually have lesions in inferior parietal cortex and additionally inferior frontal areas (Goldenberg and Spatt, 2009; Kalénine et al., 2010; Randerath et al., 2010). Our results underline these findings and support the relevance of the ventro-dorsal pathway in tool use. Additionally, we show that it is coactivated with MTG, a ventral stream area. Its role in processing semantic information suggests a strong connection to the ventro-dorsal stream during goal-directed actions with known objects. All in all, we can show that both the dorso-dorsal but also the ventro-dorsal stream are activated with different ventral stream areas during actual object manipulations and tool use, which indicates that information from both ventral and dorsal stream has to be integrated for complex actions. A functional connection seems to be probable because structural connections between MTG and SMG have been found in a Diffusion Tensor Imaging study, which aimed to find structural connections between regions relevant for tool use pantomime (Ramayya et al., 2010). Further connectivity analysis would be needed to prove and investigate the influence of ventral stream areas on the dorsal pathway, especially during tool use.
The tool network during actual action planning and execution is largely common for dominant and nondominant hand
In our study, we are able to measure brain areas more active during planning and executing tool actions compared with performing goal-directed movements with neutral objects. The specific planning of tool manipulations recruits a mainly left-sided parietal and occipitotemporal network. Ventral stream activations in the LOC, MTG, and FG are relevant for object recognition and processing semantic knowledge of a tool (Milner and Goodale, 2008; Valyear and Culham, 2010). The left parietal cortex is known to be almost invariably involved in tool actions (Lewis, 2006). We show here that core regions of the parietal cortex (SPL, AIP, and SMG), essential for tool manipulations, are already recruited during preparation of actual execution. The relevance of the parietal cortex in action planning of grasping and using was emphasized by studies of Gallivan et al. (2011, 2013a, b) using pattern classification to decode movement intentions, as well as other literature focusing on planning of tool use pantomime (Johnson-Frey et al., 2005; Króliczak and Frey, 2009; Vingerhoets et al., 2011).
The execution of tool manipulations recruits a larger network with additional involvement of frontal areas, such as PMv, MFG, and insula. Frontal areas are known to be relevant for realizing motor plans, including grasping movements (Cavina-Pratesi et al., 2010; Gallivan et al., 2013a, 2013b) and executing tool use pantomime (Johnson-Frey et al., 2005; Króliczak and Frey, 2009; Vingerhoets et al., 2011).
A feature of the action network seems to be its left-sided asymmetry. Our results strongly support the finding that, in right-handers, planning and executing object manipulations is mainly processed by the left hemisphere, independent of the used hand. Interestingly, the lateralization is stronger while planning actions with tools than bars and for using compared with transporting during execution, which indicates a changing network structure during the time course of an action. Different from other studies (Moll et al., 2000; Choi et al., 2001; Króliczak and Frey, 2009; Jacobs et al., 2010), we found stronger activations during action execution with the nondominant hand compared with the dominant one. We assume that stronger left-sided activations are caused by an increase of recruitment of the action network in order for the untrained hand to perform as skilled and as dexterous as the right hand. Additionally, the unfamiliarity of left-hand actions might result in higher activations.
A new device to study neuronal processes of real actions
Our results provide direct evidence for the multifaceted nature of neural mechanisms underlying complex actions, such as tool use. This analysis was enabled by the use of a new device, the “Tool-Carousel,” which allows studying the influence of different factors on real actions. The use of a mirror system in this study and the therefore added visual transformations create a limitation to the application, which should be avoided if the scanner environment allows it.
In conclusion, we successfully investigated actual tool and object manipulation using the “Tool-Carousel.” We can identify activation patterns representing tool knowledge, goal-directed actions, object grasping, and manipulation of tools and objects, including frontal, parietal, and temporal centers. Preparatory activations were strongly lateralized to the left brain and remained active during actual task execution. Handling tools versus neutral bars and using an object versus transportation strengthen the lateralization of the action network toward the left brain. The results support the assumption that the dorso-dorsal pathway is relevant for monitoring the manipulated objects independent of prior knowledge about the object. On the other hand, regions of the ventro-dorsal pathway code the specific knowledge of how a known object (e.g., a tool) has to be used. Additionally, our study brings about the question of how exactly the ventral areas LOC and MTG connect with the two dorsal pathways during real actions and especially tool use.
Footnotes
This work was supported by the German Research Foundation (DFG: WO 1517/1 and HE 3592/7) and the European Union STREP Project CogWatch (FP7-ICT-288912).
The authors declare no competing financial interests.
References
- Beauchamp MS, Lee KE, Haxby JV, Martin A. Parallel visual motion processing streams for manipulable objects and human movements. Neuron. 2002;34:149–159. doi: 10.1016/S0896-6273(02)00642-6. [DOI] [PubMed] [Google Scholar]
- Binkofski F, Buxbaum LJ. Two action systems in the human brain. Brain Lang. 2013;127:222–229. doi: 10.1016/j.bandl.2012.07.007. [DOI] [PMC free article] [PubMed] [Google Scholar]
- Boronat CB, Buxbaum LJ, Coslett HB, Tang K, Saffran EM, Kimberg DY, Detre JA. Distinctions between manipulation and function knowledge of objects: evidence from functional magnetic resonance imaging. Brain Res Cogn Brain Res. 2005;23:361–373. doi: 10.1016/j.cogbrainres.2004.11.001. [DOI] [PubMed] [Google Scholar]
- Buxbaum LJ, Kalénine S. Action knowledge, visuomotor activation, and embodiment in the two action systems. Ann N Y Acad Sci. 2010;1191:201–218. doi: 10.1111/j.1749-6632.2010.05447.x. [DOI] [PMC free article] [PubMed] [Google Scholar]
- Cavina-Pratesi C, Monaco S, Fattori P, Galletti C, McAdam TD, Quinlan DJ, Goodale MA, Culham JC. Functional magnetic resonance imaging reveals the neural substrates of arm transport and grip formation in reach-to-grasp actions in humans. J Neurosci. 2010;30:10306–10323. doi: 10.1523/JNEUROSCI.2023-10.2010. [DOI] [PMC free article] [PubMed] [Google Scholar]
- Choi SH, Na DL, Kang E, Lee KM, Lee SW, Na DG. Functional magnetic resonance imaging during pantomiming tool-use gestures. Exp Brain Res. 2001;139:311–317. doi: 10.1007/s002210100777. [DOI] [PubMed] [Google Scholar]
- Culham JC, Danckert SL, DeSouza JF, Gati JS, Menon RS, Goodale MA. Visually guided grasping produces fMRI activation in dorsal but not ventral stream brain areas. Exp Brain Res. 2003;153:180–189. doi: 10.1007/s00221-003-1591-5. [DOI] [PubMed] [Google Scholar]
- Eickhoff SB, Stephan KE, Mohlberg H, Grefkes C, Fink GR, Amunts K, Zilles K. A new SPM toolbox for combining probabilistic cytoarchitectonic maps and functional imaging data. Neuroimage. 2005;25:1325–1335. doi: 10.1016/j.neuroimage.2004.12.034. [DOI] [PubMed] [Google Scholar]
- Frey SH. Tool use, communicative gesture and cerebral asymmetries in the modern human brain. Philos Trans R Soc Lond B Biol Sci. 2008;363:1951–1957. doi: 10.1098/rstb.2008.0008. [DOI] [PMC free article] [PubMed] [Google Scholar]
- Gallivan JP, McLean DA, Valyear KF, Pettypiece CE, Culham JC. Decoding action intentions from preparatory brain activity in human parieto-frontal networks. J Neurosci. 2011;31:9599–9610. doi: 10.1523/JNEUROSCI.0080-11.2011. [DOI] [PMC free article] [PubMed] [Google Scholar]
- Gallivan JP, McLean DA, Valyear KF, Culham JC. Decoding the neural mechanisms of human tool use. Elife. 2013a;2:e00425. doi: 10.7554/eLife.00425. [DOI] [PMC free article] [PubMed] [Google Scholar]
- Gallivan JP, McLean DA, Flanagan JR, Culham JC. Where one hand meets the other: limb-specific and action-dependent movement plans decoded from preparatory signals in single human frontoparietal brain areas. J Neurosci. 2013b;33:1991–2008. doi: 10.1523/JNEUROSCI.0541-12.2013. [DOI] [PMC free article] [PubMed] [Google Scholar]
- Glover S, Miall RC, Rushworth MF. Parietal rTMS disrupts the initiation but not the execution of on-line adjustments to a perturbation of object size. J Cogn Neurosci. 2005;17:124–136. doi: 10.1162/0898929052880066. [DOI] [PubMed] [Google Scholar]
- Glover S, Wall MB, Smith AT. Distinct cortical networks support the planning and online control of reaching-to-grasp in humans. Eur J Neurosci. 2012;35:909–915. doi: 10.1111/j.1460-9568.2012.08018.x. [DOI] [PubMed] [Google Scholar]
- Goldenberg G, Spatt J. The neural basis of tool use. Brain. 2009;132:1645–1655. doi: 10.1093/brain/awp080. [DOI] [PubMed] [Google Scholar]
- Grèzes J, Tucker M, Armony J, Ellis R, Passingham RE. Objects automatically potentiate action: an fMRI study of implicit processing. Eur J Neurosci. 2003;17:2735–2740. doi: 10.1046/j.1460-9568.2003.02695.x. [DOI] [PubMed] [Google Scholar]
- Grill-Spector K, Malach R. The human visual cortex. Annu Rev Neurosci. 2004;27:649–677. doi: 10.1146/annurev.neuro.27.070203.144220. [DOI] [PubMed] [Google Scholar]
- Grol MJ, Majdandziæ J, Stephan KE, Verhagen L, Dijkerman HC, Bekkering H, Verstraten FA, Toni I. Parieto-frontal connectivity during visually guided grasping. J Neurosci. 2007;27:11877–11887. doi: 10.1523/JNEUROSCI.3923-07.2007. [DOI] [PMC free article] [PubMed] [Google Scholar]
- Hermsdörfer J, Terlinden G, Mühlau M, Goldenberg G, Wohlschläger M. Neural representations of pantomimed and actual tool use: evidence from an event-related fMRI study. Neuroimage. 2007;36(Suppl 2):T109–T118. doi: 10.1016/j.neuroimage.2007.03.037. [DOI] [PubMed] [Google Scholar]
- Imazu S, Sugio T, Tanaka S, Inui T. Differences between actual and imagined usage of chopsticks: an fMRI study. Cortex. 2007;43:301–307. doi: 10.1016/S0010-9452(08)70456-8. [DOI] [PubMed] [Google Scholar]
- Inoue K, Kawashima R, Sugiura M, Ogawa A, Schormann T, Zilles K, Fukuda H. Activation in the ipsilateral posterior parietal cortex during tool use: a PET study. Neuroimage. 2001;14:1469–1475. doi: 10.1006/nimg.2001.0942. [DOI] [PubMed] [Google Scholar]
- Jacobs S, Danielmeier C, Frey SH. Human anterior intraparietal and ventral premotor cortices support representations of grasping with the hand or a novel tool. J Cogn Neurosci. 2010;22:2594–2608. doi: 10.1162/jocn.2009.21372. [DOI] [PubMed] [Google Scholar]
- Johnson-Frey SH, Maloof FR, Newman-Norlund R, Farrer C, Inati S, Grafton ST. Actions or hand-object interactions? Human inferior frontal cortex and action observation. Neuron. 2003;39:1053–1058. doi: 10.1016/S0896-6273(03)00524-5. [DOI] [PubMed] [Google Scholar]
- Johnson-Frey SH, Newman-Norlund R, Grafton ST. A distributed left hemisphere network active during planning of everyday tool use skills. Cereb Cortex. 2005;15:681–695. doi: 10.1093/cercor/bhh169. [DOI] [PMC free article] [PubMed] [Google Scholar]
- Kalénine S, Buxbaum LJ, Coslett HB. Critical brain regions for action recognition: lesion symptom mapping in left hemisphere stroke. Brain. 2010;133:3269–3280. doi: 10.1093/brain/awq210. [DOI] [PMC free article] [PubMed] [Google Scholar]
- Króliczak G, Frey SH. A common network in the left cerebral hemisphere represents planning of tool use pantomimes and familiar intransitive gestures at the hand-independent level. Cereb Cortex. 2009;19:2396–2410. doi: 10.1093/cercor/bhn261. [DOI] [PMC free article] [PubMed] [Google Scholar]
- Lewis JW. Cortical networks related to human use of tools. Neuroscientist. 2006;12:211–231. doi: 10.1177/1073858406288327. [DOI] [PubMed] [Google Scholar]
- Marangon M, Jacobs S, Frey SH. Evidence for context sensitivity of grasp representations in human parietal and premotor cortices. J Neurophysiol. 2011;105:2536–2546. doi: 10.1152/jn.00796.2010. [DOI] [PMC free article] [PubMed] [Google Scholar]
- Martin K, Jacobs S, Frey SH. Handedness-dependent and -independent cerebral asymmetries in the anterior intraparietal sulcus and ventral premotor cortex during grasp planning. Neuroimage. 2011;57:502–512. doi: 10.1016/j.neuropsychologia.2007.10.005. [DOI] [PMC free article] [PubMed] [Google Scholar]
- Milner AD, Goodale MA. Two visual systems re-viewed. Neuropsychologia. 2008;46:774–785. doi: 10.1016/j.neuropsychologia.2007.10.005. [DOI] [PubMed] [Google Scholar]
- Moll J, de Oliveira-Souza R, Passman LJ, Cunha FC, Souza-Lima F, Andreiuolo PA. Functional MRI correlates of real and imagined tool-use pantomimes. Neurology. 2000;54:1331–1336. doi: 10.1212/WNL.54.6.1331. [DOI] [PubMed] [Google Scholar]
- Monaco S, Cavina-Pratesi C, Sedda A, Fattori P, Galletti C, Culham JC. Functional magnetic resonance adaptation reveals the involvement of the dorsomedial stream in hand orientation for grasping. J Neurophysiol. 2011;106:2248–2263. doi: 10.1152/jn.01069.2010. [DOI] [PubMed] [Google Scholar]
- Monaco S, Chen Y, Medendorp WP, Crawford JD, Fiehler K, Henriques DY. Functional magnetic resonance imaging adaptation reveals the cortical networks for processing grasp-relevant object properties. Cereb Cortex. 2014;24:1540–1554. doi: 10.1093/cercor/bht006. [DOI] [PubMed] [Google Scholar]
- Oldfield RC. The assessment and analysis of handedness: the Edinburgh inventory. Neuropsychologia. 1971;9:97–113. doi: 10.1016/0028-3932(71)90067-4. [DOI] [PubMed] [Google Scholar]
- Peeters RR, Rizzolatti G, Orban GA. Functional properties of the left parietal tool use region. Neuroimage. 2013;78:83–93. doi: 10.1016/j.neuroimage.2013.04.023. [DOI] [PubMed] [Google Scholar]
- Ramayya AG, Glasser MF, Rilling JK. A DTI investigation of neural substrates supporting tool use. Cereb Cortex. 2010;20:507–516. doi: 10.1093/cercor/bhp141. [DOI] [PubMed] [Google Scholar]
- Randerath J, Goldenberg G, Spijkers W, Li Y, Hermsdörfer J. Different left brain regions are essential for grasping a tool compared with its subsequent use. Neuroimage. 2010;53:171–180. doi: 10.1016/j.neuroimage.2010.06.038. [DOI] [PubMed] [Google Scholar]
- Rizzolatti G, Matelli M. Two different streams form the dorsal visual system: anatomy and functions. Exp Brain Res. 2003;153:146–157. doi: 10.1007/s00221-003-1588-0. [DOI] [PubMed] [Google Scholar]
- Rosenbaum DA, Jorgensen MJ. Planning macroscopic aspects of manual control. Hum Mov Sci. 1992;11:61–69. doi: 10.1016/0167-9457(92)90050-L. [DOI] [Google Scholar]
- Seghier ML. Laterality index in functional MRI: methodological issues. Magn Reson Imaging. 2008;26:594–601. doi: 10.1016/j.mri.2007.10.010. [DOI] [PMC free article] [PubMed] [Google Scholar]
- Striemer CL, Chouinard PA, Goodale MA. Programs for action in superior parietal cortex: a triple-pulse TMS investigation. Neuropsychologia. 2011;49:2391–2399. doi: 10.1016/j.neuropsychologia.2011.04.015. [DOI] [PubMed] [Google Scholar]
- Valyear KF, Culham JC. Observing learned object-specific functional grasps preferentially activates the ventral stream. J Cogn Neurosci. 2010;22:970–984. doi: 10.1162/jocn.2009.21256. [DOI] [PubMed] [Google Scholar]
- Valyear KF, Cavina-Pratesi C, Stiglick AJ, Culham JC. Does tool-related fMRI activity within the intraparietal sulcus reflect the plan to grasp? Neuroimage. 2007;36(Suppl 2):T94–T108. doi: 10.1016/j.neuroimage.2007.03.031. [DOI] [PubMed] [Google Scholar]
- Valyear KF, Gallivan JP, McLean DA, Culham JC. fMRI repetition suppression for familiar but not arbitrary actions with tools. J Neurosci. 2012;32:4247–4259. doi: 10.1523/JNEUROSCI.5270-11.2012. [DOI] [PMC free article] [PubMed] [Google Scholar]
- van Elk M, Viswanathan S, van Schie HT, Bekkering H, Grafton ST. Pouring or chilling a bottle of wine: an fMRI study on the prospective planning of object-directed actions. Exp Brain Res. 2012;218:189–200. doi: 10.1007/s00221-012-3016-9. [DOI] [PubMed] [Google Scholar]
- Verhagen L, Dijkerman HC, Medendorp WP, Toni I. Cortical dynamics of sensorimotor integration during grasp planning. J Neurosci. 2012;32:4508–4519. doi: 10.1523/JNEUROSCI.5451-11.2012. [DOI] [PMC free article] [PubMed] [Google Scholar]
- Verhagen L, Dijkerman HC, Medendorp WP, Toni I. Hierarchical organization of parietofrontal circuits during goal-directed action. J Neurosci. 2013;33:6492–6503. doi: 10.1523/JNEUROSCI.3928-12.2013. [DOI] [PMC free article] [PubMed] [Google Scholar]
- Vingerhoets G. Knowing about tools: neural correlates of tool familiarity and experience. Neuroimage. 2008;40:1380–1391. doi: 10.1016/j.neuroimage.2007.12.058. [DOI] [PubMed] [Google Scholar]
- Vingerhoets G, Acke F, Vandemaele P, Achten E. Tool responsive regions in the posterior parietal cortex: effect of differences in motor goal and target object during imagined transitive movements. Neuroimage. 2009;47:1832–1843. doi: 10.1016/j.neuroimage.2009.05.100. [DOI] [PubMed] [Google Scholar]
- Vingerhoets G, Vandekerckhove E, Honoré P, Vandemaele P, Achten E. Neural correlates of pantomiming familiar and unfamiliar tools: action semantics versus mechanical problem solving? Hum Brain Mapp. 2011;32:905–918. doi: 10.1002/hbm.21078. [DOI] [PMC free article] [PubMed] [Google Scholar]
- Vingerhoets G, Nys J, Honoré P, Vandekerckhove E, Vandemaele P. Human left ventral premotor cortex mediates matching of hand posture to object use. PLoS One. 2013;8:e70480. doi: 10.1371/journal.pone.0070480. [DOI] [PMC free article] [PubMed] [Google Scholar]
- Wadsworth HM, Kana RK. Brain mechanisms of perceiving tools and imagining tool use acts: a functional MRI study. Neuropsychologia. 2011;49:1863–1869. doi: 10.1016/j.neuropsychologia.2011.03.010. [DOI] [PubMed] [Google Scholar]
- Wager TD, Nichols TE. Optimization of experimental design in fMRI: a general framework using a genetic algorithm. Neuroimage. 2003;18:293–309. doi: 10.1016/S1053-8119(02)00046-0. [DOI] [PubMed] [Google Scholar]
- Wilke M, Lidzba K. LI-tool: a new toolbox to assess lateralization in functional MR-data. J Neurosci Methods. 2007;163:128–136. doi: 10.1016/j.jneumeth.2007.01.026. [DOI] [PubMed] [Google Scholar]
- Wilke M, Schmithorst VJ. A combined bootstrap/histogram analysis approach for computing a lateralization index from neuroimaging data. Neuroimage. 2006;33:522–530. doi: 10.1016/j.neuroimage.2006.07.010. [DOI] [PubMed] [Google Scholar]
- Wurm MF, Cramon DY, Schubotz RI. The context-object-manipulation triad: cross talk during action perception revealed by fMRI. J Cogn Neurosci. 2012;24:1548–1559. doi: 10.1162/jocn_a_00232. [DOI] [PubMed] [Google Scholar]
- Xia M, Wang J, He Y. BrainNet Viewer: a network visualization tool for human brain connectomics. PLoS One. 2013;8:e68910. doi: 10.1371/journal.pone.0068910. [DOI] [PMC free article] [PubMed] [Google Scholar]