

Abstract
Protein kinase C (PKC) has been implicated in the control of neurotransmitter release. The AS/AGU rat, which has a nonsense mutation in PKCγ, shows symptoms of parkinsonian syndrome, including dopamine release impairments in the striatum. Here, we found that the AS/AGU rat is PKCγ-knock-out (KO) and that PKCγ-KO mice showed parkinsonian syndrome. However, the PKCγ substrates responsible for the regulated exocytosis of dopamine in vivo have not yet been elucidated. To identify the PKCγ substrates involved in dopamine release, we used PKCγ-KO mice and a phosphoproteome analysis. We found 10 candidate phosphoproteins that had decreased phosphorylation levels in the striatum of PKCγ-KO mice. We focused on Pak-interacting exchange factor-β (βPIX), a Cdc42/Rac1 guanine nucleotide exchange factor, and found that PKCγ directly phosphorylates βPIX at Ser583 and indirectly at Ser340 in cells. Furthermore, we found that PKC phosphorylated βPIX in vivo. Classical PKC inhibitors and βPIX knock-down (KD) significantly suppressed Ca2+-evoked dopamine release in PC12 cells. Wild-type βPIX, and not the βPIX mutants Ser340 Ala or Ser583 Ala, fully rescued the decreased dopamine release by βPIX KD. Double KD of Cdc42 and Rac1 decreased dopamine release from PC12 cells. These findings indicate that the phosphorylation of βPIX at Ser340 and Ser583 has pivotal roles in Ca2+-evoked dopamine release in the striatum. Therefore, we propose that PKCγ positively modulates dopamine release through β2PIX phosphorylation. The PKCγ-βPIX-Cdc42/Rac1 phosphorylation axis may provide a new therapeutic target for the treatment of parkinsonian syndrome.
Keywords: βPIX, Cdc42, dopamine, Parkinson's disease, phosphoproteome, PKC
Introduction
Protein kinase C (PKC) is an important kinase in the enhancement of Ca2+-triggered exocytosis (Iwasaki et al., 2000; Barclay et al., 2003). The PKC family consists of at least 10 subtypes and is divided into the following three subfamilies: conventional PKC (cPKC), novel PKC, and atypical PKC (Nishizuka, 1988, 1992). Among PKCs, only cPKCs (including PKCγ, which is a neuron-specific PKC isoform; Saito and Shirai, 2002) are activated by Ca2+ because they contain a C2 domain that specifically binds to Ca2+ and phosphatidylserine (PS; Murray and Honig, 2002).
The AS/AGU rat, a spontaneously occurring mutated animal that exhibits locomotor abnormalities, progressive dopaminergic (DAergic) neuronal degeneration in the substantia nigra (SN), and lower extracellular levels of dopamine (DA) in the striatum, has been used as a valuable model for parkinsonian syndrome (Payne et al., 2000). It is noteworthy that a mutation in PKCγ that leads to the early termination at the C2 domain without possessing the catalytic domain causes parkinsonian syndrome in AS/AGU rats (Craig et al., 2001). The mutation in AS/AGU rats should result in the kinase-dead form of PKCγ, but it is still unclear how the mutation causes parkinsonian symptoms.
PKC has been shown to modify exocytosis in at least three steps: (1) increased vesicle recruitment into readily releasable pools (Gillis et al., 1996; Stevens and Sullivan, 1998), (2) acceleration of fusion pore expansion (Scepek et al., 1998), and (3) changes in the kinetics of exocytosis (Graham et al., 2002). However, only the functional consequences of the phosphorylation of SNAP25 (Iwasaki et al., 2000), synaptotagmin I (Hilfiker et al., 1999), and Munc18 (Barclay et al., 2003) by PKC have been established on exocytosis in vivo. Furthermore, no attempts have been made to achieve a comprehensive understanding of DA exocytosis through an identification of PKCγ substrates. Therefore, we attempted to identify the PKC substrates involved in exocytosis to reveal the mechanisms of regulated exocytosis.
Pak-interacting exchange factor-β (βPIX) is a Rho guanine nucleotide exchange factor (GEF) that specifically activates Rac1 and Cdc42 (Shin et al., 2002; Shin et al., 2004; Chahdi et al., 2005; Feng et al., 2006; Shin et al., 2006; ten Klooster et al., 2006; Chahdi and Sorokin, 2008). βPIX has been reported to be an essential element of the exocytotic machinery in neuroendocrine cells (Audebert et al., 2004; Momboisse et al., 2009). To date, there have been several studies on βPIX phosphorylation (Shin et al., 2002; Chahdi et al., 2005; Shin et al., 2006; Mayhew et al., 2007), but there have been no reports of the involvement of βPIX phosphorylation in DA release.
In the present study, we found that the AS/AGU rat is indeed a PKCγ-knock-out (KO) animal, and our phosphoproteome analysis using PKCγ KO mice found 10 candidates in the striatum that are phosphorylated by PKCγ. Among the 10 candidates, we demonstrated that PKCγ activated DA release through the phosphorylation of βPIX.
Materials and Methods
Antibodies.
The anti-GFP antibody (Ab) and the anti-vesicular monoamine transporter 2 (VMAT2) Ab recognizing the C-terminal of mouse VMAT2 were prepared in house. The anti-PKCγ (C2-domain) monoclonal Abs specifically recognizing C2-domain of PKCγ have been described previously (Kose et al., 1990). The following Abs were purchased: anti-FLAG from Sigma-Aldrich (catalog #P2983 RRID:AB_439685); anti-βPIX (SH3 domain) from Millipore; anti-β-actin (catalog #ab66338 RRID:AB_2289239) and anti-PKCγ (N-terminal) specifically recognizing N-terminal of PKCγ from Abcam; anti-glutathione S-transferase (GST) (catalog #sc-33613 RRID:AB_647588), anti-PKCα (catalog #sc-208 RRID:AB_2168668), anti-PKCβ1 (catalog #sc-209 RRID:AB_2168968), anti-PKCβ2 (catalog #sc-210 RRID:AB_2252825), and anti-PKCγ (catalog #sc-211 RRID:AB_632234) from Santa Cruz Biotechnology; and anti-serPKC motif (catalog #2261S RRID:AB_330310), anti-βPIX (catalog #4515S RRID:AB_2274365) for immunoprecipitation (IP), and anti-postsynaptic density-95 (PSD95; catalog #2507S RRID:AB_10695259) from Cell Signaling Technology.
Production of anti-phosphoThr76, anti-phosphoSer340, anti-phosphoSer583, and anti-β2PIX Abs.
The production of anti-phospho Abs was performed as described previously (Matsubara et al., 2012). For the preparation of anti-phospho-Thr76 (pT76), anti-phospho-Ser340 (pS340), and anti-phospho-Ser583 (pS583) βPIX Abs, oligopeptides corresponding to the amino acids of human βPIX containing pT76 [VSPKSG(pT)LKSPP], pS340 [SASPRM(pS)GFIYQ], and pS583 [SLGRRS(pS)LSRLE] were used as antigens, respectively. After the fifth boost, serum was collected and purified with an affinity column and the non-phospho-antigen peptide. The anti-β2PIX Ab was obtained by eluting the IgG from those that were bound to the nonphospho-Ser583 peptide column.
Animals.
The AS/AGU rats were provided by R.W. Davies (Payne et al., 2000). The PKCγ-Cre knockin (KI) mouse was provided by Z.F. Chen (Ding et al., 2005). After the sixth backcross, homozygous littermates obtained by crossing the heterozygous PKCγ-Cre KI mouse were used as the PKCγ KO and wild-type (WT) mice in the studies. All animal studies were approved by the Institutional Animal Care and Use Committee and conducted according to the Kobe University Animal Experimentation Regulations.
Sample preparation and Western blot analysis.
The brains from AS/AGU rats and mice were homogenized and the concentrations of the proteins were measured with a bicinchoninic acid (BCA) protein assay kit (Thermo Fisher Scientific). SDS-PAGE and immunoblot analyses were performed as described previously (Adachi et al., 2005).
Preparation of P2 synaptosomal fraction.
Adult male mouse brains were collected and homogenized in ice-cold 0.32 m sucrose solution containing 1 mm phenylmethylsulfonyl fluoride, 20 μg/ml leupeptin, and a phosphatase-inhibitor cocktail (Nacalai Tesque). The total homogenate was subjected to centrifugation at 800 × g for 12 min at 4°C to remove the nuclei and the supernatant, which we defined as the total fraction, was further centrifuged at high speed at 22,000 × g for 20 min at 4°C. The pellet was used as the P2 synaptosomal fraction. To determine the efficiency of the P2 synaptosomal extraction process, we compared the amount of VMAT2 and PSD95 proteins between the total fraction and P2 synaptosomal fraction in the same amount of protein (50 μg), which was calculated using the BCA protein assay kit.
In vivo microdialysis.
In vivo microdialysis was performed with male mice essentially as described previously (Koda et al., 2010; Ago et al., 2013). In brief, mice were anesthetized by injection of sodium pentobarbital (40 mg/kg, i.p.), and a guide cannula (one site per animal) for a dialysis probe (Eicom) was implanted stereotaxically in the dorsal striatum (anterior 0.1 mm, lateral 1.8 mm, ventral 2.2 mm relative to the bregma and skull; Franklin and Paxinos, 1997). The cannula was cemented in place with dental acrylic and the animals were maintained warm and allowed to recover from anesthesia. The active probe membrane was 1 mm in length. Two days after the surgery, the probe was perfused with Ringer's solution (147.2 mm NaCl, 4.0 mm KCl, and 2.2 mm CaCl2, pH 6.0; Fuso Pharmaceutical Industries) at a constant flow rate of 1 μl/min. To prepare the Ringer's solution containing 100 mm K+, an identical amount of sodium was replaced for maintaining iso-osmolarity. Experiments were initiated after a stabilization period of 3 h. Microdialysis samples (20 μl) were collected every 20 min and were assayed for DA by high-performance liquid chromatography (HPLC) with electrochemical detection. No-net-flux microdialysis experiments were conducted in a PKCγ KO and WT mice as described previously (Justice, 1993; Chefer et al., 2005; Hewett et al., 2010). Three different concentrations of DA in Ringer's solution (Cin of 0, 5 and 20 nm DA) were perfused through the probe and DA in the perfusates (Cout) was measured in the fifth fraction following 4 fractions (equilibration period) at each applied DA concentration. A slope was calculated for the linear regression for DA applied (Cin) and the difference between dopamine applied and DA measured (Cin − Cout). The slope (extraction fraction) is an indirect measure of dopamine transporter (DAT) dynamics in vivo to remove extracellular DA.
Measurement of DA and DA metabolite levels in striatum.
The concentrations of DA were quantified by HPLC with an electrochemical detector (ECD-100; Eicom; Kawasaki et al., 2006; Kawasaki et al., 2007). Tissue samples were homogenized in 0.2 m perchloric acid containing 100 μm EDTA and isoproterenol as an internal standard. The homogenate was centrifuged at 15,000 × g for 15 min at 0°C. The supernatant was filtered through a 0.22 μm membrane filter (Millipore), and then a 10 μl aliquot of the sample was injected onto the HPLC column every 30 min for the DA assay. An Eicompak SC-5ODS column (3.0 mm i.d. × 150 mm; Eicom) was used, and the potential of the graphite electrode (Eicom) was set to +750 mV against an Ag/AgCl reference electrode. The mobile phase contained 0.1 m sodium acetate/0.1 m citrate buffer, pH 3.5, 190 mg/L octanesulfonic acid, 5 mg/L EDTA, and 17% (v/v) methanol. Data were calculated by analyzing the peak area of the external standard of dopamine hydrochloride (Sigma-Aldrich).
Cell culture.
COS7 and HEK293 cells were cultured in DMEM and Eagle's minimum essential medium (Nacalai Tesque), respectively, which were supplemented with 10% fetal bovine serum, penicillin (100 units/ml), and streptomycin (100 μg/ml). Nonessential amino acids (100 μm) were added for HEK293 cells. PC12 cells were cultured in DMEM containing 10% fetal bovine serum and 5% horse serum. All cells were cultured at 37°C in a humidified atmosphere containing 5% CO2.
Construction of plasmids.
WT PKCγ was cloned into pcDNA3.1 (Life Technologies) and the subdomains of PKCγ were cloned into pcDNA3.1 with GFP, as described previously (Seki et al., 2005). Human βPIX was provided by the RIKEN BioResource Center through the National BioResource Project of MEXT in Ibaraki, Japan (Ota et al., 2004). For the construction of plasmids encoding full-length β2PIX that was fused with 3xFLAG at the N terminal, β2PIX with a NotI/BamHI site that was produced by PCR was cloned into a 3xpFLAG-CMV10 vector (Sigma-Aldrich). Because the target sequence for rat βPIX knock-down (KD; sh369) was located in the coding region of βPIX, sh369-resistant β2PIX in the 3xpFLAG-CMV10 vector was made by placing 6-base silent changes within the targeting sequence (5′-CAaACgAGtGAaAAaTTa-3′) with a QuikChange Multisite-Directed Mutagenesis Kit (Agilent Technologies). For construction of plasmids encoding full-length β2PIX or fragments that were fused to GST, full-length β2PIX and the SH3 (1–92 aa), DH (93–274 aa), and PH (275–400 aa) C-terminal (401–625 aa) regions were amplified by PCR with a Not1/BamH1 site and cloned into the pGEX-6P1 vector. Substitutions of Ser or Thr to Ala or Glu at the identified phosphorylation sites (Thr76Ala, Ser215Ala, Ser340Ala or Glu, and Ser583Ala or Glu) were introduced with a QuikChange kit.
Protein expression.
Protein expression was performed as described previously (Kawasaki et al., 2010). In brief, BL21 pLys Escherichia coli and Sf9 cells were transformed with expression plasmids. E. coli and Sf9 cells were harvested and lysed. For the purification of recombinant proteins, GST-fusion proteins were purified with glutathione-Sepharose 4B resin (GE Healthcare Biosciences).
RNAi: short hairpin RNA and small interfering RNA.
Double-stranded oligonucleotides were cloned into the short hairpin RNA (shRNA) expression vector, pSuper (puro; Oligoengine). The target sequence for the shRNA rat βPIX KD was 5′-GCAGACCAGCGAGAAGTTGAG-3′ (sh369; cording nucleotides 369–389). Because the βPIX shRNA sequence that we used was common to both the β1 and β2 isoforms, KDs of both β1 and β2 in PC12 cells were examined with βPIX SH3- and β2-specific antibodies. The synthesized small interfering RNA (siRNA) for rat βPIX was composed of a mixture of 4 oligonucleotides (si878: 5′-GGGAUGACAUAAAGACGUU-3′, si806: 5′-AGUGUCAAGAAGUACGAAA-3′, si1115: 5′-GGAGCAUGAUCGAGCGCAU-3′, and si1153: 5′-CAACAGGACUUGCACGAAU-3′) was purchased from Thermo Fisher Scientific (SmartPool). Verified shRNA plasmids for KD of Cdc42 (sh197; 5′-GATTACGACCGCTGAGTTA-3′; Ueyama et al., 2014) and Rac1 (sh618; 5′-CCTTTGTACGCTTTGCTCA-3′; Ueyama et al., 2006) were described previously.
In vitro PKC phosphorylation assay.
An in vitro PKC phosphorylation assay was performed as described previously (Kawasaki et al., 2010). In brief, precipitated FLAG-tagged β2PIX proteins or purified GST-tagged β2PIX were incubated with 200 ng of GST-tagged PKCγ or GST and the following buffers: 20 mm Tris, pH 7.4, 0.5 mm CaCl2, 10 μm ATP, 0.5 mCi [γ-32P] ATP, 8 μg/ml PS, and 0.8 μg/ml (±)-1,2-didecanoylglycerol (DO) in a 50 μl final volume. The samples were incubated with or without PKC inhibitors, including GF109203X (GFX), which was used as a pan PKC inhibitor, and Gö6976, which was used as a cPKC inhibitor, at 30°C for 15 min. For the calculation of the relative phosphorylation levels, the densitometries of the autoradiography were normalized with the total protein levels. The average relative phosphorylation levels of PKCγ stimulation were defined as 1.00.
PKC phosphorylation assay in cells.
A PKC phosphorylation assay in cells was performed as described previously (Kawasaki et al., 2010) but with slight modifications. In brief, HEK293 cells were transfected with WT β2PIX in 3xpFLAG-CMV10 with a NEPA21 electroporator (Nepa Gene). After 12-O-tetradecanoylphorbol 13-acetate (TPA) stimulation with or without PKC inhibitors for 30 min in HEPES buffer at 37°C, the cells were collected and resuspended in homogenization buffer containing 150 mm NaCl, 10 mm ethylene glycol tetraacetic acid, 2 mm ethylenediamine tetracetic acid, 10 mm HEPES, pH 7.4, 1 mm phenylmethylsulfonyl fluoride, 20 μg/ml leupeptin, and a phosphatase-inhibitor cocktail. The precipitated proteins were separated by SDS-PAGE. The phosphorylated proteins were visualized with phospho-Abs. For the calculation of the relative phosphorylation levels, the densitometries of the immunoblots of the phospho-Abs were normalized to the total protein levels in each experiment and the averages of the relative levels of phosphorylation in more than three independent experiments are presented. The phosphorylation levels of the prestimulations were defined as 1.00.
PKC phosphorylation assay in vivo.
The mice P2 synaptosomal fraction was resuspended in HEPES buffer containing 1 mm phenylmethylsulfonyl fluoride, 20 μg/ml leupeptin, and a phosphatase-inhibitor mixture and used for the in vivo PKC phosphorylation assay (Wu et al., 1982). After 2 μm TPA stimulation with or without 2 μm GFX for 30 min in HEPES buffer at 37°C, the P2 fraction was collected and resuspended in homogenization buffer containing 150 mm NaCl, 10 mm ethylene glycol tetraacetic acid, 2 mm ethylenediamine tetracetic acid, 10 mm HEPES, pH 7.4, 1 mm phenylmethylsulfonyl fluoride, 20 μg/ml leupeptin, and the phosphatase-inhibitor mixture. The precipitated proteins were separated by SDS-PAGE. The phosphorylated proteins were visualized with serPKC motif Abs.
DA release assay.
DA release assays in βPIX KD cells were performed 96 h after transfection by NEPA21. PC12 cells were washed thrice with 500 μl of incubation solution (140 mm NaCl, 5 mm KCl, 2 mm CaCl2, 1 mm MgCl2, 2 mm glucose, 20 μm pargyline, and 10 mm HEPES, pH 7.5) and then incubated for 60 min in 500 μl of incubation solution with 3H-DA (PerkinElmer), followed by three washes with 500 μl of incubation solution. The cells were allowed to rest or were stimulated with 500 μl of a high-K+ solution containing 100 mm KCl and 35 mm NaCl for 10 min. The supernatant was collected and the cells were harvested in 500 μl of incubation solution with 2% Triton X-100. The amount of DA that was secreted into the medium and retained in the cells was measured in 500 μl of samples with a scintillation counter LS-6500 (Beckman Coulter). DA secretion was expressed by the following formula: %DA = (3H in supernatant)/(3H in supernatant + 3H in cell lysate). A collagen-IV-coated six-well plate (BD Biosciences) was used for the DA release assay.
Mass spectrometry for β2PIX-phosphorylation site identification.
Mass spectrometry for β2PIX-phosphorylation site identification was performed as described previously (Sakuma et al., 2012). After the in vitro PKC phosphorylation assay and electrophoresis, silver-stained bands that corresponded to GST-tagged β2PIX proteins were excised and destained. After reduction-alkylation reactions, the proteins in the gels were digested with porcine trypsin (sequencing grade; Promega) in 50 mm ammonium bicarbonate for 15 h at 37°C. The peptide fragments extracted from the gels were subjected to liquid chromatography/tandem mass spectrometry (LC/MS/MS) with a high-performance liquid chromatography system (Paradigm MS4; Michrom Bioresources) coupled to a linear ion trap mass spectrometer (Finnigan LTQ Orbitrap XL; Thermo Fisher Scientific). The LC/MS/MS data were interpreted with a MASCOT MS/MS ions search (Matrix Science).
Phosphoproteome analysis.
Phosphoproteome analysis was performed as described previously with some modifications (Saito et al., 2006). Mice striata were dissolved in 50 mm Tris HCl, pH 9.0, 8 m urea, 10 mm ethylenediamine tetracetic acid, 1 mm phenylmethylsulfonyl fluoride, 20 μg/ml leupeptin, and a phosphatase inhibitor mixture. After homogenization with a Dounce homogenizer (10 strokes), the resultant solution was centrifuged at 2000 × g for 5 min and the supernatant was collected. The protein amounts were measured with a BCA protein assay kit. The proteins from the striatum were dried and resuspended in 50 mm Tris HCl buffer, pH 9.0, containing 8 m urea at a concentration of 10 μg/μl. These mixtures were subsequently reduced with dithiothreitol, alkylated with acrylamide, and digested with Lys-C endopeptidase at 37°C overnight, followed by trypsin digestion at 37°C overnight. The digested solutions were desalted and concentrated with Empore high-performance extraction disk cartridges (3M). Phosphopeptide enrichment was performed with hydroxy acid-modified metal oxide chromatography (HAMMOC; Titansphere Phos-TiO Kit; GL Sciences; Kyono et al., 2008). For elution of the phosphopeptides, 50 μl of 5% NH3 and 5% pyrrolidine were used. The fractions were immediately acidified and desalted with SPE-C tips (GL Sciences). A Tomy CC-105 vacuum evaporator was used to concentrate the sample and the phosphopeptides were analyzed by LC/MS/MS.
Statistical analysis.
The data are presented as mean ± SEM and were analyzed with unpaired t tests, one-way ANOVA with a post hoc Dunnett's test, or a repeated two-way ANOVA. The statistical analyses were performed with the Statview 5.0J software package (SAS Institute). p-values of 5% or less were considered statistically significant.
Results
PKCγ KO animals exhibited parkinsonian symptoms, including DA release impairment in the striatum
AS/AGU rats show altered behaviors (Craig et al., 2001), DA release impairment, and the pathology of the nigrostriatal system resembles the pathology observed in human patients with parkinsonian syndrome (Campbell et al., 1996; Payne et al., 2000). AS/AGU rats have a spontaneously occurring mutation that changes the CAG (Glu281) codon to a TAG (stop codon) in PKCγ, and the putatively truncated PKCγ, if produced, will terminate at the fifth residue from the C terminus of the last strand of the β-sheet structure of the C2 domain (Fig. 1A). The truncated protein may result in a severe or complete loss of the kinase function of PKCγ, although it has not yet been clarified whether the truncated protein is expressed in AS/AGU rats. Although both anti-PKCγ (N terminal) Ab and anti-PKCγ (C2-domain) Ab detected an 80 kDa single band in AS rats, no band was detected in the AS/AGU rats (Fig. 1B). These findings indicated that PKCγ was not expressed in AS/AGU rats, suggesting the hypothesis that PKCγ KO mice show similar symptoms as those observed in AS/AGU rats. We first confirmed that our PKCγ KO mice did not express PKCγ, whereas the expression levels of other members of cPKCs were unaltered (Fig. 1C). To determine the effects of the PKCγ KO on DA release in the striatum, we performed in vivo microdialysis in the striatum. The basal line extracellular levels of DA in the striatum did not differ significantly between the PKCγ WT and KO mice. After treatment with high levels of K+ (Fig. 1D) and methamphetamine (METH; Fig. 1E), the increase in DA release in the WT was significantly larger than that in the KO 3–4 months after birth. Although high K+ levels induced DA release is mediated by exocytosis and not by DAT, PKC induces DAT endocytosis (Daniels and Amara, 1999), which may decrease the extracellular DA levels by increasing DAT activity in PKCγ KO mice striatum. To evaluate the DAT activity in PKCγ KO mice, we performed the no-net-flux microdialysis experiment. The slope (extraction fraction) is the measure of the activity of DAT in vivo. Fig. 1G shows decreased DAT activity in the striatum of PKCγ KO mice, suggesting that PKCγ KO mice tend to have increased rather than decreased extracellular DA levels compared with WT mice (Fig. 1F). Consistent with our results, the increase in the serotonin release stimulated by high K+ levels in WT was also significantly larger than that of the KO (Fig. 1G), as described previously in AS/AGU rats (Al-Fayez et al., 2005). Because we had preliminary data that suggested slight loss of DAergic neurons in 12-month-old, but not 3- or 6-month-old, PKCγ KO mice, there was a possibility that the decrease in DA release in PKCγ KO mice was due to the decrease in DA in the striatum. We measured DA and its metabolites using HPLC in the striatum. No difference in DA or DA metabolite levels in the striatum was observed between PKCγ KO mice and WT mice at 3, 6, and 12 months (Table 1), suggesting that DA release disorder was from the exocytotic machinery disorder instead of the lack of the DAergic neurons in the nigrostriatum system. These results suggested that the PKCγ KO mice would show similar parkinsonian symptoms as those observed in the AS/AGU rats. From the analysis of the PKCγ KO mice and AS/AGU rats, we concluded that PKCγ KO animals could be used as a practical model of parkinsonian syndrome.
Figure 1.
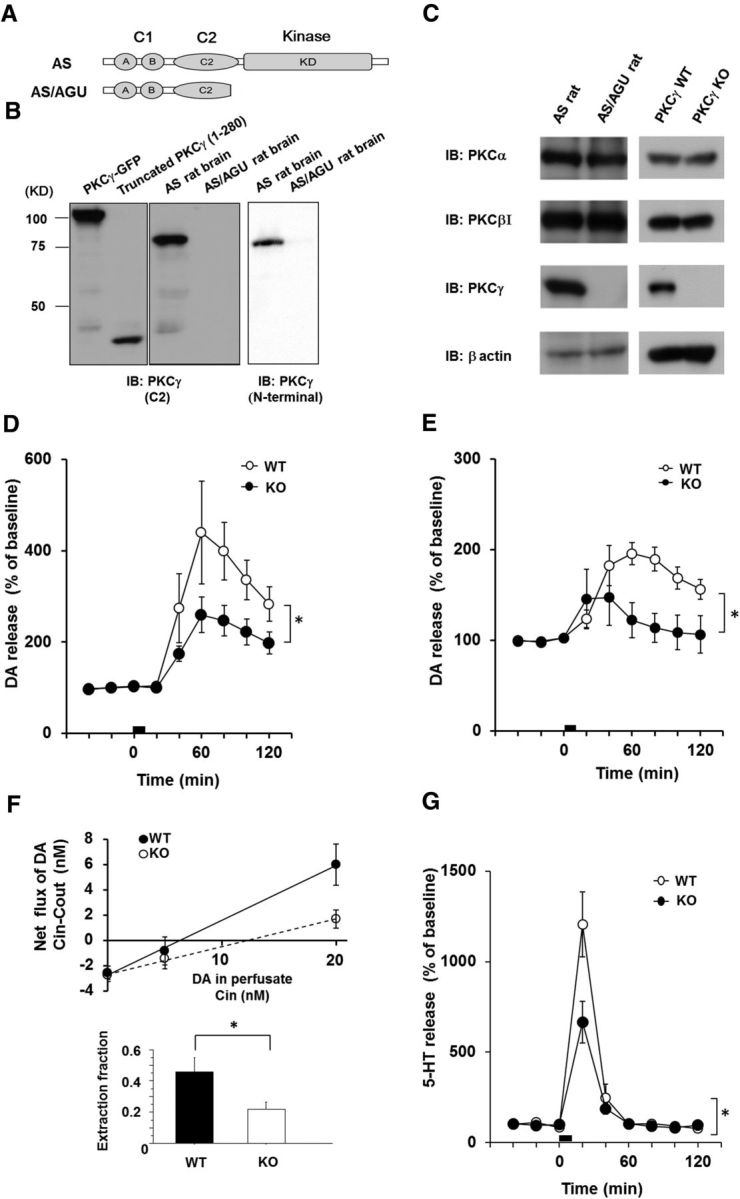
The PKCγ KO model exhibits symptoms of parkinsonian syndrome. A, Schematic illustrations of the PKCγ protein and AS/AGU mutations. The truncated PKCγ polypeptide terminates within the C2 domain. B, Recombinant truncated PKCγ (1–280 aa), which was transfected in COS-7 cells, the AS rat brain lysate, and the AS/AGU rat brain lysate, was detected by immunoblot analysis with an anti-PKCγ (C2-domain) monoclonal antibody and anti-PKCγ (N terminal) antibody, respectively. C, The PKCγ KO was confirmed by immunoblot analysis of the whole brain of the AS/AGU rats and PKCγ KO mice. Arrowheads are recombinant PKCγ-GFP and PKCγ (1–280aa)-GFP, which were used as positive controls. D, In vivo microdialysis in the striatum of the PKCγ KO mice. A high level of K+ was perfused into the striatum through a dialysis probe for the time indicated by the square at 3–4 months. The results are expressed as mean ± SEM (n = 4–5, interaction of the genotype and time for DA release that was stimulated by high K+ levels; *p < 0.05, F(8,48) = 2.31, repeated two-way ANOVA). E, In vivo microdialysis for DA in the striatum of the PKCγ-KO (KO) mice that were stimulated with METH. METH (1 mg/kg) was perfused into the striatum through a dialysis probe for the time indicated by the square at 3 months (n = 4, interaction of the genotype and time for DA release stimulated by METH, F(8,48) = 3.37; *p < 0.01, repeated two-way ANOVA). F, No-net flux microdialysis to quantitate basal DAT activity in PKCγ KO mice. Three different concentrations of DA in CSF (0, 5, and 20 nm DA) were perfused through the probes to determine the extracellular DA concentration and extraction fraction. Linear regression for the DA perfused and DA measured provided extraction fraction (slope) as an indirect measure of DAT activity in vivo to remove extracellular DA. Extraction fraction for WT and KO mice are shown. Data represent mean ± SEM (n = 4 and 5 for WT and KO mice, respectively, *p < 0.05). G, In vivo microdialysis of serotonin in the striatum of the PKCγ-KO mice that were stimulated by high K+ levels. K+ (100 mm) was perfused into the striatum through a dialysis probe for the time indicated by the square at 3–4 months. The results are expressed as mean ± SEM (n = 4, interaction of the genotype and time for serotonin release that was stimulated by high K+ levels, F(8,48) = 5.399; *p < 0.001, repeated two-way ANOVA).
Table 1.
DA and DA metabolite levels in the striatum of PKCγ WT and KO mice
| Age (mo) | Genotype | DA (ng/g weight) | DOPAC (ng/g weight) | HVA (ng/g weight) |
|---|---|---|---|---|
| 3 | KO | 19629.5 ± 625.4 | 1838.6 ± 68.9 | 1490.6 ± 89.0 |
| WT | 19516.4 ± 361.1 | 1999.1 ± 103.4 | 1652.1 ± 18.4 | |
| 6 | KO | 20667.2 ± 803.5 | 1671.2 ± 113.0 | 1620.0 ± 93.9 |
| WT | 17416.8 ± 781.3 | 1559.2 ± 77.2 | 1334.6 ± 63.7 | |
| 12 | KO | 28911.0 ± 1801.4 | 2576.0 ± 277.9 | 2378.1 ± 161.3 |
| WT | 29564.9 ± 2581.4 | 2253.1 ± 202.2 | 2392.2 ± 128.4 |
Results are expressed as mean ± SEM of 4–5 mice.
HVA, Homovanillic acid.
Phosphoproteome analysis identified 10 phosphoproteins, including βPIX, with a PKC-phosphorylation motif
We hypothesized that a loss or decrease of PKCγ-mediated phosphorylation in the nigrostriatal system results in DA release impairment. To identify the substrates for PKCγ, we performed a phosphoproteome analysis using HAMMOC methods (Kyono et al., 2008; Fig. 2A). Among the phosphopeptides in the WT group, we chose the proteins that may have a relationship to exocytosis and then calculated the WT/KO ratio of the average ion intensity. The average ion intensity ratio of the phosphopeptides that included the PKC phosphorylation motif are shown in Table 2. Among these 10 candidates, we focused on βPIX (Fig. 2B), even when the degree of the phosphorylation decrease was small, because it is expressed in DAergic neurons in the SNpc (http://www.informatics.jax.org/assay/MGI:4944920) and has been reported to play important roles in the machinery of exocytosis (Audebert et al., 2004; Momboisse et al., 2009). In the present phosphoproteome analysis, phosphorylation of Ser340 in β2PIX was detected. The βPIX family consists of two splicing forms, β1 and β2; the difference between β1 and β2 PIX exists in the C terminus (Fig. 2C). Although both β1 and β2 contain Ser340, β2PIX is the predominant form in the CNS (Koh et al., 2001). Therefore, β2PIX was used in the present study.
Figure 2.

Phosphoproteome analysis revealed 10 phosphopeptides with decreased average ion intensity in PKCγ KO mice striatum. A, Overview of the phosphoproteome (WT, n = 5; KO, n = 4). B, Average ion intensity of the Ser340 βPIX phosphopeptide is calculated in both PKCγ KO and WT mice (n = 4–5; *p < 0.05, unpaired t test). The relative average ion intensity of WT mice was defined as 100%. The results are expressed as mean ± SEM. C, Schematic illustrations of the β1 and β2 PIX protein. The phosphorylation sites that were determined by the in vitro PKC phosphorylation assay and the phosphoproteome analysis are circled. The open circles are the phosphorylation sites that were determined only in vitro. The closed circles are the phosphorylation sites that were determined in vitro and in vivo.
Table 2.
List of phosphopeptides with a PKC phosphorylation motif
| Protein name | Accession no. | Sequence | Site | No. of phosphopeptides |
Lowest peptide score |
Highest peptide score |
Average ion intensity |
|||||
|---|---|---|---|---|---|---|---|---|---|---|---|---|
| WT | KO | WT | KO | WT | KO | WT | KO | WT/KO | ||||
| Gap junction alpha-1 protein | NP 034418 | KVAAGHELQPLAIVDQRPSSRA | S365 | 7 | 0 | 11 | − | 28 | − | 3 | 0.4 | 7.3 |
| Disks large-associated protein 1 | NP 808307 | RSLDSLDPAGLLTSPKF | S437 | 5 | 0 | 48 | − | 77 | − | 3.4 | 0.8 | 4.4 |
| MAP kinase-activating death domain protein | NP 001171190 | RATLSDSEIETNSATSAIFGKA | T1235 | 8 | 4 | 40 | 26 | 90 | 58 | 3.7 | 1 | 3.9 |
| DnaJ homolog subfamily C member 5 | NP 001258513 | RSLSTSGESLYHVLGLDKN | S10 | 54 | 55 | 3 | 4 | 88 | 85 | 969 | 299.5 | 3.2 |
| Calnexin | NP 001103969 | KAEEDEILNRSPRN | S582 | 6 | 2 | 25 | 22 | 31 | 34 | 3.1 | 1.8 | 1.8 |
| Stathmin | NP 062615 | KRASGQAFELILSPRS | S16 | 26 | 23 | 8 | 6 | 93 | 84 | 12.1 | 7.5 | 1.6 |
| Stathmin | NP 062615 | RASGQAFELILSPRS | S25 | 25 | 17 | 5 | 19 | 81 | 83 | 7.4 | 5.9 | 1.3 |
| Rho guanine nucleotide exchange factor 7 | NP 001106989 | RMSGFIYQGKL | S340 | 3 | 0 | 24 | − | 59 | − | 1.8 | 1.4 | 1.4 |
| Reticulon-4 | NP 077188 | RRGSGSVDETLFALPAASEPVIPSSAEKI | S165 | 15 | 8 | 34 | 41 | 70 | 59 | 2.3 | 1.7 | 1.3 |
| α-adducin | NP 001019629 | KFRTPSFLKK | S724 | 3 | 2 | 7 | 9 | 29 | 25 | 6.1 | 4.8 | 1.3 |
| β-adducin | NP 001258786 | KDIATEKPGSPVKS | S594 | 10 | 8 | 10 | 17 | 50 | 56 | 0.4 | 0.3 | 1.2 |
Phosphopeptides with a WT/KO ratio >1.0 are listed. The numbers of phosphorylation sites are based on the results of mice in PhosphoSitePlus (www.phosphosite.org). S and T are the identified phosphorylation sites. Number of phosphopeptides means the total numbers of the phosphopeptides in each group (n = 4). Highest or lowest peptide score means the highest or lowest peptide score in each group (n = 4). Peptides that were not detected are shown as −.
βPIX is phosphorylated by PKCγ in vitro, in cells, and in vivo
To determine whether β2PIX was phosphorylated by PKCγ, we performed in vitro, in cells, and in vivo phosphorylation experiments. β2PIX was phosphorylated by PKCγ in vitro, whereas the inhibition of PKC activity with GFX abolished the phosphorylation (Fig. 3A). Next, we investigated whether β2PIX was phosphorylated by PKC in cells. Enhanced phosphorylation of FLAG-tagged β2PIX extracted from HEK293 cells transfected with FLAG-tagged β2PIX and GFP-tagged PKCγ after treatment with 1 μm TPA was observed with an anti-Ser PKC motif Ab (Fig. 3B). Furthermore, the TPA-induced phosphorylation of β2PIX in cells was reduced by the PKC inhibitors Gö6976 and GFX (Fig. 3B). These results were further confirmed in PC12 cells (Fig. 3C) and in the P2 synaptosomal fraction of the mouse brain (Fig. 3D). Collectively, these results showed that β2PIX was phosphorylated by Ca2+-dependent PKC in vitro, in cells, and in vivo.
Figure 3.

βPIX is phosphorylated by PKCγ in vitro, in cells, and in vivo. A, In vitro phosphorylation of β2PIX. FLAG-tagged β2PIX proteins were purified and incubated with or without recombinant PKCγ in the presence of PKC activator (PS/DO/Ca2+) and [γ-32P] ATP for 20 min. The in vitro phosphorylation of β2PIX was also performed in the presence of GFX. The phosphorylated proteins were detected by autoradiography and the levels of protein expression were determined by Western blotting with an anti-FLAG antibody. The numbers show the relative phosphorylation levels that were normalized to PKCγ stimulation as 1.00 (n = 3). B, In-cell phosphorylation of β2PIX. HEK293 cells expressing FLAG-tagged β2PIX and GFP-tagged PKCγ were stimulated with 1 μm 12-O-TPA for 20 min in the presence or absence of 1 μm GFX or 1 μm Gö6976. FLAG-tagged β2PIX proteins were purified with anti-FLAG agarose resin. Phosphorylated proteins were detected by an immunoblot analysis with an anti-pSer PKC motif antibody. Protein expression was determined by Western blotting with an anti-FLAG antibody. The average relative phosphorylation levels for each experimental condition were normalized to the prestimulation signal set as 1.00 (n = 5). C, PC12 cells expressing FLAG-tagged β2PIX were incubated with 32P monosodium phosphate and stimulated with 1 μm 12-O-TPA in the absence or presence of 1 μm GFX. FLAG-tagged β2PIX proteins were purified with anti-FLAG agarose resin. Phosphorylated proteins were detected by autoradiography, and protein expression was determined by immunoblots with an anti-FLAG antibody. D, The same amount of samples of total fraction and the P2 synaptosomal fraction were immunoblotted by anti-PSD95 antibody as a postsynaptic marker, anti-VMAT2 antibody as a presynaptic marker, and anti-PKCγ antibody. E, the P2 synaptosomal fraction was stimulated with 2 μm 12-O-TPA in the absence or presence of 2 μm GFX. βPIX proteins were purified with anti-βPIX antibody. Phosphorylated proteins were detected by phospho-Abs. The numbers show the relative phosphorylation levels that were normalized to pretreatment as 1.00 (n = 3).
PKCγ phosphorylates Thr76 in SH3, Ser340 in PH, and Ser583 in the C terminus of β2PIX in vitro
β2PIX consists of the following four regions: SH3 (1–92 aa), DH (93–274 aa), PH (275–400 aa), and the C terminus (401–625 aa). Because each region of β2PIX contains one or more predicted PKC phosphorylation sites, we performed an MS analysis combined with an in vitro phosphorylation assay using full-length GST-tagged β2PIX for screening the phosphorylation sites by PKCγ. The in vitro PKC assay, followed by the MS analysis, revealed the phosphorylation of Thr76, Ser215, and Ser583 in addition to that of Ser340, which was revealed by the phosphoproteome analysis of PKCγ KO mice (Fig. 2C). Thr76, Ser215, and Ser340 are common sites in both β1 and β2PIX. However, Ser583 is found only in β2PIX. To examine the PKCγ-mediated phosphorylation of these sites, recombinant proteins were used in in vitro phosphorylation assays. Importantly, all domains of β2PIX were phosphorylated by PKCγ in vitro, but the SH3 and C-terminal domains were phosphorylated much more strongly than the DH and PH domains (Fig. 4A). For the next step, we generated recombinant mutant proteins in which each Ser or Thr residue was replaced with Ala (Thr76Ala in SH3, Ser215Ala in DH, Ser340Ala in PH, and Ser583Ala in the C terminus) and examined which Ser/Thr residues of Thr76, Ser215, Ser340, or Ser583 could be phosphorylated by PKCγ in vitro. We observed that the Thr76Ala and Ser583Ala mutant proteins exhibited impaired phosphorylation of the SH3 and C-terminal domains (Fig. 4B). The Ser340Ala in the PH domain showed a moderately reduced phosphorylation. The Ser215Ala showed no significant reduction of phosphorylation in the DH domain. These findings suggested that Thr76, Ser340, and Ser583, but not Ser215, are PKCγ phosphorylation sites in vitro.
Figure 4.

Analysis of the in vitro PKCγ phosphorylation sites in β2PIX. A, In vitro phosphorylation of the GST-tagged β2PIX SH3, DH, PH, and C terminus regions. Each protein region was expressed in E. coli, purified, and incubated with [γ32P] ATP and recombinant PKCγ in the presence of Ca2+, PS, and DO. The phosphorylated proteins were separated by SDS-PAGE and detected by autoradiography (top). The protein levels of the recombinant β2PIX protein regions were detected by Western blotting (bottom). The arrowheads on the top indicate the autoradiography and those on the bottom indicate the total protein for each domain. B, In vitro phosphorylation of the β2PIX SH3, DH, PH, and β2 C terminus regions containing the indicated mutations determined by an in vitro phosphorylation assay that was followed by mass spectrometry and phosphoproteome analysis. Phosphorylation levels were normalized to the WT phosphorylation signal for each domain, which were set to 100%: SH3 (n = 5), DH (n = 4), PH (n = 5), β2 C terminus (n = 3); The results are expressed as mean ± SEM (*p < 0.05, unpaired t test). C, Specificity of anti-phospho-Thr76, Ser340, and Ser583 antibodies. The indicated amount of the phospho-peptide (pT76 [VSPKSG(pT)LKSPP], pS340 [SASPRM(pS)GFIYQ], and pS583 [SLGRRS(pS)LSRLE]) or non-phosphopeptide was dotted on the PVDF membrane. Immunostaining was performed using purified anti-pT76, pS340, and pS583 antibodies. D, In vitro phosphorylation assay of full-length β2PIX. GST-tagged full-length β2PIX was expressed in E. coli, purified, and incubated with ATP and recombinant PKCγ in the presence of Ca2+, PS, and DO. Phosphorylated proteins were separated by SDS-PAGE and detected by an anti-pSer PKC motif antibody, an anti-pT76 antibody, an anti-pS340 antibody, or an anti-pS583 antibody, respectively.
cPKC phosphorylates β2PIX Ser340 and Ser583 in cells
To further confirm that β2PIX is phosphorylated by cPKC in cells, we produced Abs that specifically recognized phosphorylated Thr76, Ser340, and Ser583 (Fig. 4C). The purified full-length β2PIX was phosphorylated by recombinant PKCγ in vitro and then applied to SDS-PAGE, which was followed by Western blotting with the anti-pT76, anti-pS340, and anti-pS583 Abs. The β2PIX that was phosphorylated by PKCγ was detected by anti-pT76 and anti-pS583, but not the anti-pS340 Ab (Fig. 4D), suggesting that Ser340 was not a direct PKC phosphorylation site. Next, we investigated whether β2PIX was phosphorylated at Thr76, Ser340, and Ser583 in cells. Figure 5 shows that Ser340 and Ser583, but not Thr76, were phosphorylated in TPA-treated HEK293 cells. Moreover, the PKC-dependent phosphorylation of Ser340 and Ser583 was confirmed with the PKC inhibitors Gö6976 and GFX (Fig. 5). These findings suggested that Ser340 and Ser583 were phosphorylated by cPKC in cells. It is noteworthy that Ser583 was phosphorylated directly, whereas Ser340 was phosphorylated indirectly by PKCγ.
Figure 5.

PKC mediates the phosphorylation of full-length β2PIX at Ser340 and Ser583 in cells. HEK293 cells transfected with FLAG-tagged WT β2PIX and GFP-tagged PKCγ were stimulated with 1 μm TPA in the presence or absence of 1 μm GFX, which is a pan-PKC inhibitor, or Gö6976, which is a cPKC inhibitor. FLAG-tagged β2PIX was precipitated and separated by SDS-PAGE. The total amounts of protein were determined by immunoblot analyses with an anti-FLAG antibody. GFP-tagged PKCγ or β actin was detected by anti-GFP or anti-β-actin antibodies. The phosphorylation levels of the FLAG-tagged β2PIX proteins that were determined with an anti-pT76 antibody (A; n = 2), an anti-pS340 (B; n = 4), or an anti-pS583 (C; n = 4) antibody were normalized to the phosphorylation levels of the WT. The numbers show the average relative phosphorylation levels that were normalized to prestimulation levels set as 1.00.
Involvement of cPKC in the regulation of DA release
A 3H-DA release assay in PC12 cells, a cell line in a DAergic neuronal model, was used to study the functional role of PKC and βPIX in the regulation of DA release. PC12 cells expressed endogenous βPIXs and cPKCs, including PKCγ (Fig. 6A). To determine the degree of DA release stimulated by K+, PC12 cells were stimulated with various K+ concentrations and the DA release was increased in a K+ concentration-dependent manner (Fig. 6B). The functional role of cPKC in the regulation of K+-induced DA release was monitored with Gö6976 and GFX. These PKC inhibitors significantly decreased the high K+-stimulated DA release (Fig. 6C). It is noted that there were no differences of 3H-DA uptake into the PC12 cells between the control and PKC inhibitor groups (Fig. 6D,E). Gö6976 and GFX also significantly suppressed the TPA-stimulated DA release (Fig. 6F). The activation of PKCγ after K+-induced depolarization was confirmed by monitoring the translocation of GFP-tagged PKCγ from the cytosol to the plasma membrane in PC12 cells (Fig. 7A). These results suggested that cPKC plays a crucial role in K+-induced DA release machinery in PC12 cells.
Figure 6.

cPKC positively regulates K+-stimulated DA release. A, cPKCs and βPIX are expressed in PC12 cells. PC12 cell lysates were analyzed with immunoblotting with anti-PKCα, β1, β2, γ, and βPIX antibodies. B, DA release in PC12 cells was measured with various K+ concentrations. The results are expressed as mean ± SEM (n = 3). C, Amounts of DA release that were stimulated in response to 100 mm K+ with 1 μm GFX or 1 μm Gö6976 were measured in PC12 cells (n = 3; *p < 0.05, unpaired t test). DA release levels were normalized to the levels released in response to 100 mm K+, which were set to 100%. The results are expressed as mean ± SEM (n = 3–5). D, E, Uptake of 3H-DA into PC12 cells with or without GFX and Gö6976 were measured. The results are expressed as mean ± SEM (n = 3). F, TPA stimulated DA release in PC12 cells. DA release in PC12 cells was measured with 1 μm TPA in the absence or presence of 1 μm GFX. DA release levels were normalized to that of 1 μm TPA stimulation, which was set to 100%. The results are expressed as mean ± SEM (n = 3, *p < 0.01, unpaired t test).
Figure 7.

βPIX positively regulates K+-stimulated DA release. A, PKCγ was activated by high K+ level stimulation in PC12 cells. Activation of PKCγ by K+ stimulation was examined by monitoring the translocation of GFP-tagged PKCγ in PC12 cells. B, DA release was measured in PC12 cells that were transfected with shRNA for βPIX and sh Control, which was used as a negative control. The results are expressed as mean ± SEM (n = 6, *p < 0.01, unpaired t test). C, DA release was measured in PC12 cells transfected with siRNA for βPIX. The expression of siRNAs for βPIX in PC12 cells and lysate was analyzed by immunoblot analyses with anti-βPIX antibodies. The results are expressed as mean ± SEM (n = 5, *p < 0.01, unpaired t test).
βPIX KD suppressed DA release
Because βPIX is able to stimulate growth hormone secretion from PC12 cells (Momboisse et al., 2009; Momboisse et al., 2010), we investigated the possible relationship between βPIX and DA release. KD of βPIX in PC12 cells by shRNA (sh369) resulted in a significant inhibition of K+-evoked DA secretion from PC12 cells (Fig. 7B). A similar significant reduction in DA release was reproduced with synthetic βPIX siRNA (Fig. 7C). These results were consistent with the idea that βPIX is an important element of the DA exocytotic machinery.
PKC-mediated phosphorylation of β2PIX at Ser340 and Ser583 promoted DA release
To determine the role of the PKC-mediated phosphorylation of βPIX in DA release, we exogenously and simultaneously introduced the shRNA-resistant forms of β2PIX mutant, including β2PIX Thr76Ala, Ser340Ala, or Ser583Ala mutants and βPIX sh369, into PC12 cells. DA release from PC12 cells transfected with sh369 was completely rescued by the reintroduction of WT FLAG-tagged β2PIX (Fig. 8A). These results suggested that β2PIX, which is a dominant isoform in the CNS, has important roles in DA release. Moreover, we examined the effects of the β2PIX phosphorylation on DA release. β2PIX Ser340Ala and Ser583Ala mutants failed to rescue the reduced DA release by βPIX sh369, whereas the β2PIX Thr76Ala mutant acted similarly to WT β2PIX (Fig. 8A). Together, our results suggested that the PKC-mediated phosphorylation of Ser340 and Ser583 on β2PIX positively regulates DA release. Finally, we examined the effects of Cdc42 and Rac1 KD on DA release. When Cdc42 was knocked down, Rac1 was upregulated and vice versa. Therefore, we knocked down both Cdc42 and Rac1. The KD of both Cdc42 and Rac1 in PC12 cells by shRNAs resulted in a significant inhibition of K+-evoked DA release from PC12 cells (Fig. 8B).
Figure 8.

Phosphorylation of β2 PIX at Ser340 and Ser583 promotes DA release. A, DA release was measured in PC12 cells that were transfected with shβPIX and β2PIX (WT and Ser-Ala mutants) with shRNA-resistant sequences. The levels of endogenous β1, β2PIX, and exogenous β2PIX were confirmed. Comparable levels of all ectopically expressed β2PIX proteins were confirmed by Western blot analyses. The results are expressed as mean ± SEM (n = 3–6, *p < 0.05, one-way ANOVA with post hoc Dunnett's test). B, DA release was measured in PC12 cells that were transfected with shRNA for both Cdc42 and Rac1 and sh Control, which was used as a negative control. The results are expressed as mean ± SEM (n = 3, *p < 0.01, unpaired t test).
Discussion
In this study, we revealed that AS/AGU rats did not express full-length PKCγ or the truncated form of PKCγ, indicating that a loss, and not a gain, of function is the cause of the parkinsonian symptoms exhibited by AS/AGU rats. In agreement with these findings, we demonstrated decreased DA release stimulated by high levels of K+ and METH in the striatum. It is noteworthy that altered DA release is the predominant characteristic of parkinsonian symptoms in PKCγ KO mice rather than loss of DAergic neurons in the SNpc. We propose that PKCγ KO animals are useful models for the study of parkinsonian syndrome because PKCγ KO mice and AS/AGU rats have damage not only in the DAergic system, but also in the serotonergic system (Al-Fayez et al., 2005), as has been observed in patients with sporadic Parkinson's disease. Furthermore, the use of the PKCγ KO mouse model has an advantage because it is possible to perform gene manipulations in them, such as PKCγ rescue, compared with the AS/AGU rats.
Although it is generally accepted that DA release in the striatum induced by high K+ levels is mediated by exocytosis and not by DAT, PKC was reported to induce DAT endocytosis (Daniels and Amara, 1999), which, by altering DA reuptake, can change the amplitude of K+-induced DA release as measured by microdialysis. We have ruled out this possibility because DAT activity was instead decreased in PKCγ KO mice (Fig. 1F). Moreover, 3H-DA uptake does not differ between the control and PKC inhibitors in PC12 cells (Fig. 6D,E). These results suggested that the reduced K+-induced DA release was not through the change of the DAT endocytosis by the PKCγ KO. There are also reports that activation of PKC induces DAT-mediated DA reverse transport (Kantor and Gnegy, 1998; Cowell et al., 2000). Although these studies focused more on PKCβ than on PKCγ, our study showed that PKCγ also play important roles for DAT-mediated DA reverse transport (Fig. 1F), suggesting that PKCγ play roles for both K+-mediated DA release and DAT-mediated DA reverse transport. Therefore, PKCγ KO resulted in decreased DAT activity, including uptaking DA and DA reverse transport through DAT. The decreased level of K+-induced DA release in PKCγ KO mice is probably underestimated: DA release may be more significantly decreased when the disordered DAT activity is normalized.
We identified 10 phosphoproteins that were decreased in PKCγ KO mice under the hypothesis that decreased levels of phosphorylated substrates of PKCγ in the nigrostriatal system lead to impairments in DA release. Our results indicated that βPIX was one of the pivotal targets of PKCγ or cPKC in enhancing Ca2+-evoked DA release based on the following several lines of evidence: (1) PKCγ phosphorylated βPIX in vitro, in cells, and in vivo; (2) Ser583 of βPIX was phosphorylated by PKCγ both in vitro and in cells, whereas Ser340 was phosphorylated by cPKC only in cells, suggesting that cPKC indirectly phosphorylated Ser340; (3) cPKC inhibitors and the KD of endogenous βPIX also suppressed the DA release from PC12 cells, suggesting that both PKCγ or cPKC and βPIX play pivotal roles in Ca2+-evoked DA release from DAergic neurons; and (4) WT β2PIX, but not Ser340Ala or Ser583Ala, rescued the decreased DA release from PC12 cells by sh369 for βPIX, suggesting that both phosphorylation sites are necessary for regulating DA release. Why does PKCγ KO cause the parkinsonian syndrome phenotype, even when other cPKCs are expressed in PKCγ KO animals? Although the substrate specificity of each PKC subtype appears to be low in vitro, there have been several confirmatory reports of subtype-specific functions of cPKC under physiological conditions (Uchino et al., 2004; Ueyama et al., 2004; Al-Fayez et al., 2005; Kawasaki et al., 2010; Sakuma et al., 2012). Our data suggest that PKCγ has important roles in DA release in mice.
In neurons, Ca2+ entry triggers exocytosis, suggesting that certain Ca2+ sensors may be necessary for Ca2+-dependent exocytosis. Candidates for Ca2+ sensors include molecules that possess EF hand motifs or C2 domains, which were first defined in cPKC, and annexin family proteins, as has been reported previously (Burgoyne and Morgan, 1998). PKC has been reported to modify exocytosis in the steps both before and after docking to the plasma membrane through the following mechanisms: (1) increased vesicle recruitment into the readily releasable pool (Gillis et al., 1996; Stevens and Sullivan, 1998), (2) acceleration of fusion pore expansion (Scepek et al., 1998), and (3) changes in the kinetics of exocytosis (Graham et al., 2002). However, βPIX is related to the exocytosis step after docking (Momboisse et al., 2009; Momboisse et al., 2010). The cPKC-βPIX- Cdc42/Rac1 axis possibly has important roles in DA release in the step after docking through the βPIX phosphorylation by cPKC.
How can βPIX regulate DA release through the phosphorylation at Ser340 or Ser583? Previous reports have revealed that βPIX phosphorylation results in βPIX translocation to the membrane and the subsequent activation of Rac1 and/or Cdc42. In PC12 cells, basic fibroblast growth factor induces the phosphorylation of βPIX at Ser525 and Thr526, resulting in neurite outgrowth by the activation of Rac1 through the translocation of the βPIX complex at neuronal growth cones (Shin et al., 2002; Shin et al., 2006). In human mesangial cells, endothelin-1 and cAMP inducers cause the PKA-dependent phosphorylation of βPIX at Ser516 and Thr526, resulting in cytoskeletal rearrangement by the activation of Cdc42 through βPIX translocation (Chahdi et al., 2005). Therefore, βPIX may be differently phosphorylated in response to various stimuli and this may result in its stimulus-dependent specific targeting and Cdc42/Rac1 activation at the targeted sites. We have demonstrated for the first time that Ser583 is a PKCγ or cPKC phosphorylation site. Ser583 and the previously reported sites Ser516, Ser525, and Thr526 are all located in the C-terminal domain of βPIX and may have similar functions for the translocation and subsequent activation of Cdc42/Rac1. Phosphorylation at Ser340 is located in the PH domain, which interacts with phosphatidylinositol lipids within biological membranes (Wang and Shaw, 1995) and may also play important roles in the membrane targeting of βPIX. In fact, the PH domain has been reported to interact with PKC (Yao et al., 1994) and Cdc42 (Rossman et al., 2002) and it has been implicated in the regulation of the GEF activity of SOS (Ras-GEF; Karlovich et al., 1995) and p140Ras-GRF (Ras and Rac GEF; Buchsbaum et al., 1996). Therefore, through PH-domain-mediated membrane targeting and interaction, the cPKC-βPIX-Cdc42/Rac1 axis may act at specific membranes (Chen et al., 1997; Falasca et al., 1998; Maffucci and Falasca, 2001). Downstream of the βPIX phosphorylation, we speculate that Cdc42/Rac1 are the targets of phosphorylated βPIX, as suggested in previous studies (Shin et al., 2002; Shin et al., 2004; Chahdi et al., 2005; Shin et al., 2006). Although we have not proved a direct relationship between phosphorylated βPIX and Cdc42/Rac1, we speculate that βPIX phosphorylated by PKCγ regulates Cdc42/Rac1 functions based on our data that the double KD of Cdc42 and Rac1 resulted in decreased DA release (Fig. 8B).
Although Ser340 is common to both β1PIX and β2PIX, Ser583 only exists in the unique C terminus of β2PIX, which is the neuron-dominant isoform (Koh et al., 2001) that emerged from and was conserved after Xenopus laevis (Fig. 9). Therefore, Ser583 phosphorylation by neuron-specific PKCγ may have important roles in the modulation of βPIX function in the highly developed CNS and highly elaborated function, including DA release. It is also of note that the reported phosphorylation sites at Ser340, Ser516, Ser525, and Thr526 are conserved through evolution. Although we detected the TPA-induced phosphorylation of β2PIX in vivo using the synaptosomal P2 fraction of PKCγ WT mice by pSer PKC motif Ab (Fig. 3D), we could not show clear TPA-induced phosphorylation at Ser340 and Ser583 in PKCγ WT using our site-specific phospho-Abs for pS340 and pS583, likely due to the sensitivity of anti-pS340 and pS583 Abs.
Figure 9.
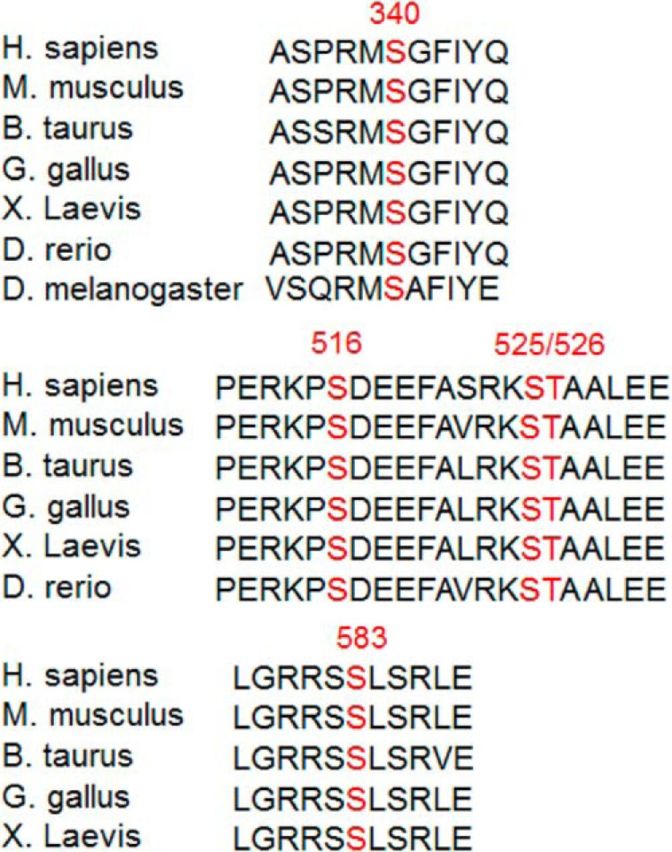
Schematic comparisons of Ser340 and Ser583 through evolution. Ser340 and Ser583 are evolutionally conserved in many species. It is noted that β2PIX emerged from X. laevis, although β1PIX is expressed in Drosophila melanogaster. Ser516, Ser525, and Thr526, as reported previously, are also conserved in many species.
In the present study, we have demonstrated that PKCγ KO mice can be a useful model of parkinsonian syndrome. In addition, we found for the first time that DA release was positively regulated by the PKC-mediated direct phosphorylation of βPIX at Ser583 and indirect phosphorylation at Ser340. The phosphorylational modulation of βPIX by PKCγ may be a potential therapeutic target for the treatment of parkinsonian syndrome.
Footnotes
We thank Sumio Sugano (University of Tokyo) and Yoshihide Hayashizaki (RIKEN Omics Science Center and Research Association for Biotechnology) for kindly providing the βPIX cDNA and Hiroshi Kiyonari and Kazuki Nakao (RIKEN CDB) for mice preservation.
The authors declare no competing financial interests.
References
- Adachi N, Oyasu M, Taniguchi T, Yamaguchi Y, Takenaka R, Shirai Y, Saito N. Immunocytochemical localization of a neuron-specific diacylglycerol kinase beta and gamma in the developing rat brain. Brain Res Mol Brain Res. 2005;139:288–299. doi: 10.1016/j.molbrainres.2005.06.007. [DOI] [PubMed] [Google Scholar]
- Ago Y, Araki R, Tanaka T, Sasaga A, Nishiyama S, Takuma K, Matsuda T. Role of social encounter-induced activation of prefrontal serotonergic systems in the abnormal behaviors of isolation-reared mice. Neuropsychopharmacology. 2013;38:1535–1547. doi: 10.1038/npp.2013.52. [DOI] [PMC free article] [PubMed] [Google Scholar]
- Al-Fayez M, Russell D, Wayne Davies R, Shiels PG, Baker PJ, Payne AP. Deficits in the mid-brain raphe nuclei and striatum of the AS/AGU rat, a protein kinase C-gamma mutant. Eur J Neurosci. 2005;22:2792–2798. doi: 10.1111/j.1460-9568.2005.04502.x. [DOI] [PubMed] [Google Scholar]
- Audebert S, Navarro C, Nourry C, Chasserot-Golaz S, Lécine P, Bellaiche Y, Dupont JL, Premont RT, Sempéré C, Strub JM, Van Dorsselaer A, Vitale N, Borg JP. Mammalian Scribble forms a tight complex with the betaPIX exchange factor. Curr Biol. 2004;14:987–995. doi: 10.1016/j.cub.2004.05.051. [DOI] [PubMed] [Google Scholar]
- Barclay JW, Craig TJ, Fisher RJ, Ciufo LF, Evans GJ, Morgan A, Burgoyne RD. Phosphorylation of Munc18 by protein kinase C regulates the kinetics of exocytosis. J Biol Chem. 2003;278:10538–10545. doi: 10.1074/jbc.M211114200. [DOI] [PubMed] [Google Scholar]
- Buchsbaum R, Telliez JB, Goonesekera S, Feig LA. The N-terminal pleckstrin, coiled-coil, and IQ domains of the exchange factor Ras-GRF act cooperatively to facilitate activation by calcium. Mol Cell Biol. 1996;16:4888–4896. doi: 10.1128/mcb.16.9.4888. [DOI] [PMC free article] [PubMed] [Google Scholar]
- Burgoyne RD, Morgan A. Calcium sensors in regulated exocytosis. Cell Calcium. 1998;24:367–376. doi: 10.1016/S0143-4160(98)90060-4. [DOI] [PubMed] [Google Scholar]
- Campbell JM, Payne AP, Gilmore DP, Byrne JE, Russell D, McGadey J, Clarke DJ, Davies RW, Sutcliffe RG. Neostriatal dopamine depletion and locomotor abnormalities due to the Albino Swiss rat agu mutation. Neurosci Lett. 1996;213:173–176. doi: 10.1016/0304-3940(96)12852-4. [DOI] [PubMed] [Google Scholar]
- Chahdi A, Sorokin A. Protein kinase A-dependent phosphorylation modulates beta1Pix guanine nucleotide exchange factor activity through 14–3-3beta binding. Mol Cell Biol. 2008;28:1679–1687. doi: 10.1128/MCB.00898-07. [DOI] [PMC free article] [PubMed] [Google Scholar]
- Chahdi A, Miller B, Sorokin A. Endothelin 1 induces beta 1Pix translocation and Cdc42 activation via protein kinase A-dependent pathway. J Biol Chem. 2005;280:578–584. doi: 10.1074/jbc.M411130200. [DOI] [PubMed] [Google Scholar]
- Chefer VI, Czyzyk T, Bolan EA, Moron J, Pintar JE, Shippenberg TS. Endogenous kappa-opioid receptor systems regulate mesoaccumbal dopamine dynamics and vulnerability to cocaine. J Neurosci. 2005;25:5029–5037. doi: 10.1523/JNEUROSCI.0854-05.2005. [DOI] [PMC free article] [PubMed] [Google Scholar]
- Chen RH, Corbalan-Garcia S, Bar-Sagi D. The role of the PH domain in the signal-dependent membrane targeting of Sos. EMBO J. 1997;16:1351–1359. doi: 10.1093/emboj/16.6.1351. [DOI] [PMC free article] [PubMed] [Google Scholar]
- Cowell RM, Kantor L, Hewlett GH, Frey KA, Gnegy ME. Dopamine transporter antagonists block phorbol ester-induced dopamine release and dopamine transporter phosphorylation in striatal synaptosomes. Eur J Pharmacol. 2000;389:59–65. doi: 10.1016/S0014-2999(99)00828-6. [DOI] [PubMed] [Google Scholar]
- Craig NJ, Durán Alonso MB, Hawker KL, Shiels P, Glencorse TA, Campbell JM, Bennett NK, Canham M, Donald D, Gardiner M, Gilmore DP, MacDonald RJ, Maitland K, McCallion AS, Russell D, Payne AP, Sutcliffe RG, Davies RW. A candidate gene for human neurodegenerative disorders: a rat PKC gamma mutation causes a parkinsonian syndrome. Nat Neurosci. 2001;4:1061–1062. doi: 10.1038/nn740. [DOI] [PubMed] [Google Scholar]
- Daniels GM, Amara SG. Regulated trafficking of the human dopamine transporter: clathrin-mediated internalization and lysosomal degradation in response to phorbol esters. J Biol Chem. 1999;274:35794–35801. doi: 10.1074/jbc.274.50.35794. [DOI] [PubMed] [Google Scholar]
- Ding YQ, Xiang CX, Chen ZF. Generation and characterization of the PKC gamma-Cre mouse line. Genesis. 2005;43:28–33. doi: 10.1002/gene.20151. [DOI] [PubMed] [Google Scholar]
- Falasca M, Logan SK, Lehto VP, Baccante G, Lemmon MA, Schlessinger J. Activation of phospholipase C gamma by PI 3-kinase-induced PH domain-mediated membrane targeting. EMBO J. 1998;17:414–422. doi: 10.1093/emboj/17.2.414. [DOI] [PMC free article] [PubMed] [Google Scholar]
- Feng Q, Baird D, Peng X, Wang J, Ly T, Guan JL, Cerione RA. Cool-1 functions as an essential regulatory node for EGF receptor- and Src-mediated cell growth. Nat Cell Biol. 2006;8:945–956. doi: 10.1038/ncb1453. [DOI] [PubMed] [Google Scholar]
- Franklin KBJ, Paxinos G. The mouse brain in stereotaxic coordinates. San Diego: Academic; 1997. [Google Scholar]
- Gillis KD, Mossner R, Neher E. Protein kinase C enhances exocytosis from chromaffin cells by increasing the size of the readily releasable pool of secretory granules. Neuron. 1996;16:1209–1220. doi: 10.1016/S0896-6273(00)80147-6. [DOI] [PubMed] [Google Scholar]
- Graham ME, O'Callaghan DW, McMahon HT, Burgoyne RD. Dynamin-dependent and dynamin-independent processes contribute to the regulation of single vesicle release kinetics and quantal size. Proc Natl Acad Sci U S A. 2002;99:7124–7129. doi: 10.1073/pnas.102645099. [DOI] [PMC free article] [PubMed] [Google Scholar]
- Hewett J, Johanson P, Sharma N, Standaert D, Balcioglu A. Function of dopamine transporter is compromised in DYT1 transgenic animal model in vivo. J Neurochem. 2010;113:228–235. doi: 10.1111/j.1471-4159.2010.06590.x. [DOI] [PMC free article] [PubMed] [Google Scholar]
- Hilfiker S, Pieribone VA, Nordstedt C, Greengard P, Czernik AJ. Regulation of synaptotagmin I phosphorylation by multiple protein kinases. J Neurochem. 1999;73:921–932. doi: 10.1046/j.1471-4159.1999.0730921.x. [DOI] [PubMed] [Google Scholar]
- Iwasaki S, Kataoka M, Sekiguchi M, Shimazaki Y, Sato K, Takahashi M. Two distinct mechanisms underlie the stimulation of neurotransmitter release by phorbol esters in clonal rat pheochromocytoma PC12 cells. J Biochem. 2000;128:407–414. doi: 10.1093/oxfordjournals.jbchem.a022768. [DOI] [PubMed] [Google Scholar]
- Justice JB., Jr Quantitative microdialysis of neurotransmitters. J Neurosci Methods. 1993;48:263–276. doi: 10.1016/0165-0270(93)90097-B. [DOI] [PubMed] [Google Scholar]
- Kantor L, Gnegy ME. Protein kinase C inhibitors block amphetamine-mediated dopamine release in rat striatal slices. J Pharmacol Exp Ther. 1998;284:592–598. [PubMed] [Google Scholar]
- Karlovich CA, Bonfini L, McCollam L, Rogge RD, Daga A, Czech MP, Banerjee U. In vivo functional analysis of the Ras exchange factor son of sevenless. Science. 1995;268:576–579. doi: 10.1126/science.7725106. [DOI] [PubMed] [Google Scholar]
- Kawasaki T, Ishihara K, Ago Y, Nakamura S, Itoh S, Baba A, Matsuda T. Protective effect of the radical scavenger edaravone against methamphetamine-induced dopaminergic neurotoxicity in mouse striatum. Eur J Pharmacol. 2006;542:92–99. doi: 10.1016/j.ejphar.2006.05.012. [DOI] [PubMed] [Google Scholar]
- Kawasaki T, Ishihara K, Ago Y, Baba A, Matsuda T. Edaravone (3-methyl-1-phenyl-2-pyrazolin-5-one), a radical scavenger, prevents 1-methyl-4-phenyl-1,2,3,6-tetrahydropyridine-induced neurotoxicity in the substantia nigra but not the striatum. J Pharmacol Exp Ther. 2007;322:274–281. doi: 10.1124/jpet.106.119206. [DOI] [PubMed] [Google Scholar]
- Kawasaki T, Ueyama T, Lange I, Feske S, Saito N. Protein kinase C-induced phosphorylation of Orai1 regulates the intracellular Ca2+ level via the store-operated Ca2+ channel. J Biol Chem. 2010;285:25720–25730. doi: 10.1074/jbc.M109.022996. [DOI] [PMC free article] [PubMed] [Google Scholar]
- Koda K, Ago Y, Cong Y, Kita Y, Takuma K, Matsuda T. Effects of acute and chronic administration of atomoxetine and methylphenidate on extracellular levels of noradrenaline, dopamine and serotonin in the prefrontal cortex and striatum of mice. J Neurochem. 2010;114:259–270. doi: 10.1111/j.1471-4159.2010.06750.x. [DOI] [PubMed] [Google Scholar]
- Koh CG, Manser E, Zhao ZS, Ng CP, Lim L. Beta1PIX, the PAK-interacting exchange factor, requires localization via a coiled-coil region to promote microvillus-like structures and membrane ruffles. J Cell Sci. 2001;114:4239–4251. doi: 10.1242/jcs.114.23.4239. [DOI] [PubMed] [Google Scholar]
- Kose A, Ito A, Saito N, Tanaka C. Electron microscopic localization of gamma- and beta II-subspecies of protein kinase C in rat hippocampus. Brain Res. 1990;518:209–217. doi: 10.1016/0006-8993(90)90974-G. [DOI] [PubMed] [Google Scholar]
- Kyono Y, Sugiyama N, Imami K, Tomita M, Ishihama Y. Successive and selective release of phosphorylated peptides captured by hydroxy acid-modified metal oxide chromatography. J Proteome Res. 2008;7:4585–4593. doi: 10.1021/pr800305y. [DOI] [PubMed] [Google Scholar]
- Maffucci T, Falasca M. Specificity in pleckstrin homology (PH) domain membrane targeting: a role for a phosphoinositide-protein co-operative mechanism. FEBS Lett. 2001;506:173–179. doi: 10.1016/S0014-5793(01)02909-X. [DOI] [PubMed] [Google Scholar]
- Matsubara T, Ikeda M, Kiso Y, Sakuma M, Yoshino K, Sakane F, Merida I, Saito N, Shirai Y. c-Abl tyrosine kinase regulates serum-induced nuclear export of diacylglycerol kinase α by phosphorylation at Tyr-218. J Biol Chem. 2012;287:5507–5517. doi: 10.1074/jbc.M111.296897. [DOI] [PMC free article] [PubMed] [Google Scholar]
- Mayhew MW, Jeffery ED, Sherman NE, Nelson K, Polefrone JM, Pratt SJ, Shabanowitz J, Parsons JT, Fox JW, Hunt DF, Horwitz AF. Identification of phosphorylation sites in betaPIX and PAK1. J Cell Sci. 2007;120:3911–3918. doi: 10.1242/jcs.008177. [DOI] [PMC free article] [PubMed] [Google Scholar]
- Momboisse F, Lonchamp E, Calco V, Ceridono M, Vitale N, Bader MF, Gasman S. betaPIX-activated Rac1 stimulates the activation of phospholipase D, which is associated with exocytosis in neuroendocrine cells. J Cell Sci. 2009;122:798–806. doi: 10.1242/jcs.038109. [DOI] [PubMed] [Google Scholar]
- Momboisse F, Ory S, Ceridono M, Calco V, Vitale N, Bader MF, Gasman S. The Rho guanine nucleotide exchange factors Intersectin 1L and β-Pix control calcium-regulated exocytosis in neuroendocrine PC12 cells. Cell Mol Neurobiol. 2010;30:1327–1333. doi: 10.1007/s10571-010-9580-2. [DOI] [PubMed] [Google Scholar]
- Murray D, Honig B. Electrostatic control of the membrane targeting of C2 domains. Mol Cell. 2002;9:145–154. doi: 10.1016/S1097-2765(01)00426-9. [DOI] [PubMed] [Google Scholar]
- Nishizuka Y. The molecular heterogeneity of protein kinase C and its implications for cellular regulation. Nature. 1988;334:661–665. doi: 10.1038/334661a0. [DOI] [PubMed] [Google Scholar]
- Nishizuka Y. Intracellular signaling by hydrolysis of phospholipids and activation of protein kinase C. Science. 1992;258:607–614. doi: 10.1126/science.1411571. [DOI] [PubMed] [Google Scholar]
- Ota T, Suzuki Y, Nishikawa T, Otsuki T, Sugiyama T, Irie R, Wakamatsu A, Hayashi K, Sato H, Nagai K, Kimura K, Makita H, Sekine M, Obayashi M, Nishi T, Shibahara T, Tanaka T, Ishii S, Yamamoto J, Saito K, et al. Complete sequencing and characterization of 21,243 full-length human cDNAs. Nat Genet. 2004;36:40–45. doi: 10.1038/ng1285. [DOI] [PubMed] [Google Scholar]
- Payne AP, Campbell JM, Russell D, Favor G, Sutcliffe RG, Bennett NK, Davies RW, Stone TW. The AS/AGU rat: a spontaneous model of disruption and degeneration in the nigrostriatal dopaminergic system. J Anat. 2000;196:629–633. doi: 10.1046/j.1469-7580.2000.19640629.x. [DOI] [PMC free article] [PubMed] [Google Scholar]
- Rossman KL, Worthylake DK, Snyder JT, Siderovski DP, Campbell SL, Sondek J. A crystallographic view of interactions between Dbs and Cdc42: PH domain-assisted guanine nucleotide exchange. EMBO J. 2002;21:1315–1326. doi: 10.1093/emboj/21.6.1315. [DOI] [PMC free article] [PubMed] [Google Scholar]
- Saito H, Oda Y, Sato T, Kuromitsu J, Ishihama Y. Multiplexed two-dimensional liquid chromatography for MALDI and nanoelectrospray ionization mass spectrometry in proteomics. J Proteome Res. 2006;5:1803–1807. doi: 10.1021/pr0601178. [DOI] [PubMed] [Google Scholar]
- Saito N, Shirai Y. Protein kinase C gamma (PKC gamma): function of neuron specific isotype. J Biochem. 2002;132:683–687. doi: 10.1093/oxfordjournals.jbchem.a003274. [DOI] [PubMed] [Google Scholar]
- Sakuma M, Shirai Y, Yoshino K, Kuramasu M, Nakamura T, Yanagita T, Mizuno K, Hide I, Nakata Y, Saito N. Novel PKCα-mediated phosphorylation site(s) on cofilin and their potential role in terminating histamine release. Mol Biol Cell. 2012;23:3707–3721. doi: 10.1091/mbc.E12-01-0053. [DOI] [PMC free article] [PubMed] [Google Scholar]
- Scepek S, Coorssen JR, Lindau M. Fusion pore expansion in horse eosinophils is modulated by Ca2+ and protein kinase C via distinct mechanisms. EMBO J. 1998;17:4340–4345. doi: 10.1093/emboj/17.15.4340. [DOI] [PMC free article] [PubMed] [Google Scholar]
- Seki T, Adachi N, Ono Y, Mochizuki H, Hiramoto K, Amano T, Matsubayashi H, Matsumoto M, Kawakami H, Saito N, Sakai N. Mutant protein kinase Cgamma found in spinocerebellar ataxia type 14 is susceptible to aggregation and causes cell death. J Biol Chem. 2005;280:29096–29106. doi: 10.1074/jbc.M501716200. [DOI] [PubMed] [Google Scholar]
- Shin EY, Shin KS, Lee CS, Woo KN, Quan SH, Soung NK, Kim YG, Cha CI, Kim SR, Park D, Bokoch GM, Kim EG. Phosphorylation of p85 beta PIX, a Rac/Cdc42-specific guanine nucleotide exchange factor, via the Ras/ERK/PAK2 pathway is required for basic fibroblast growth factor-induced neurite outgrowth. J Biol Chem. 2002;277:44417–44430. doi: 10.1074/jbc.M203754200. [DOI] [PubMed] [Google Scholar]
- Shin EY, Woo KN, Lee CS, Koo SH, Kim YG, Kim WJ, Bae CD, Chang SI, Kim EG. Basic fibroblast growth factor stimulates activation of Rac1 through a p85 betaPIX phosphorylation-dependent pathway. J Biol Chem. 2004;279:1994–2004. doi: 10.1074/jbc.M307330200. [DOI] [PubMed] [Google Scholar]
- Shin EY, Lee CS, Cho TG, Kim YG, Song S, Juhnn YS, Park SC, Manser E, Kim EG. betaPak-interacting exchange factor-mediated Rac1 activation requires smgGDS guanine nucleotide exchange factor in basic fibroblast growth factor-induced neurite outgrowth. J Biol Chem. 2006;281:35954–35964. doi: 10.1074/jbc.M602399200. [DOI] [PubMed] [Google Scholar]
- Stevens CF, Sullivan JM. Regulation of the readily releasable vesicle pool by protein kinase C. Neuron. 1998;21:885–893. doi: 10.1016/S0896-6273(00)80603-0. [DOI] [PubMed] [Google Scholar]
- ten Klooster JP, Jaffer ZM, Chernoff J, Hordijk PL. Targeting and activation of Rac1 are mediated by the exchange factor beta-Pix. J Cell Biol. 2006;172:759–769. doi: 10.1083/jcb.200509096. [DOI] [PMC free article] [PubMed] [Google Scholar]
- Uchino M, Sakai N, Kashiwagi K, Shirai Y, Shinohara Y, Hirose K, Iino M, Yamamura T, Saito N. Isoform-specific phosphorylation of metabotropic glutamate receptor 5 by protein kinase C (PKC) blocks Ca2+ oscillation and oscillatory translocation of Ca2+-dependent PKC. J Biol Chem. 2004;279:2254–2261. doi: 10.1074/jbc.M309894200. [DOI] [PubMed] [Google Scholar]
- Ueyama T, Lennartz MR, Noda Y, Kobayashi T, Shirai Y, Rikitake K, Yamasaki T, Hayashi S, Sakai N, Seguchi H, Sawada M, Sumimoto H, Saito N. Superoxide production at phagosomal cup/phagosome through βI protein kinase C during FcγR-mediated phagocytosis in microglia. J Immunol. 2004;173:4582–4589. doi: 10.4049/jimmunol.173.7.4582. [DOI] [PubMed] [Google Scholar]
- Ueyama T, Geiszt M, Leto TL. Involvement of Rac1 in activation of multicomponent Nox1- and Nox3-based NADPH oxidases. Mol Cell Biol. 2006;26:2160–2174. doi: 10.1128/MCB.26.6.2160-2174.2006. [DOI] [PMC free article] [PubMed] [Google Scholar]
- Ueyama T, Sakaguchi H, Nakamura T, Goto A, Morioka S, Shimizu A, Nakao K, Hishikawa Y, Ninoyu Y, Kassai H, Suetsugu S, Koji T, Fritzsch B, Yonemura S, Hisa Y, Matsuda M, Aiba A, Saito N. Maintenance of stereocilia and apical junctional complexes by Cdc42 in cochlear hair cells. J Cell Sci. 2014;127:2040–2052. doi: 10.1242/jcs.143602. [DOI] [PubMed] [Google Scholar]
- Wang DS, Shaw G. The association of the C-terminal region of beta I sigma II spectrin to brain membranes is mediated by a PH domain, does not require membrane proteins, and coincides with a inositol-1,4,5 triphosphate binding site. Biochem Biophys Res Commun. 1995;217:608–615. doi: 10.1006/bbrc.1995.2818. [DOI] [PubMed] [Google Scholar]
- Wu WC, Walaas SI, Nairn AC, Greengard P. Calcium/phospholipid regulates phosphorylation of a Mr “87k” substrate protein in brain synaptosomes. Proc Natl Acad Sci U S A. 1982;79:5249–5253. doi: 10.1073/pnas.79.17.5249. [DOI] [PMC free article] [PubMed] [Google Scholar]
- Yao L, Kawakami Y, Kawakami T. The pleckstrin homology domain of Bruton tyrosine kinase interacts with protein kinase C. Proc Natl Acad Sci U S A. 1994;91:9175–9179. doi: 10.1073/pnas.91.19.9175. [DOI] [PMC free article] [PubMed] [Google Scholar]