

Abstract
Despite myriads of studies on a parallel organization of cortico-striatal-thalamo-cortical loops, direct evidence of this has been lacking for the healthy human brain. Here, we scrutinize the functional specificity of the cortico-subcortical loops depending on varying levels of cognitive hierarchy as well as their structural connectivity with high-resolution fMRI and diffusion-weighted MRI (dMRI) at 7 tesla. Three levels of cognitive hierarchy were implemented in two domains: second language and nonlanguage. In fMRI, for the higher level, activations were found in the ventroanterior portion of the prefrontal cortex (PFC), the head of the caudate nucleus (CN), and the ventral anterior nucleus (VA) in the thalamus. Conversely, for the lower level, activations were located in the posterior region of the PFC, the body of the CN, and the medial dorsal nucleus (MD) in the thalamus. This gradient pattern of activations was furthermore shown to be tenable by the parallel connectivity in dMRI tractography connecting the anterior regions of the PFC with the head of the CN and the VA in the thalamus, whereas the posterior activations of the PFC were linked to the body of the CN and the MD in the thalamus. This is the first human in vivo study combining fMRI and dMRI showing that the functional specificity is mirrored within the cortico-subcortical loop substantiated by parallel networks.
Keywords: cognitive hierarchy, functional specificity of the cortico-subcortical loop, high-resolution fMRI and dMRI
Introduction
The prefrontal cortex (PFC) has been known to be systematically organized along its anterior-to-posterior axis depending on varying levels of cognitive hierarchies, with the anterior region being involved in the higher level and the posterior region in the lower level (Badre and D'Esposito, 2007; Koechlin and Summerfield, 2007; Jeon and Friederici, 2013). This pattern of activations has also been observed in subcortical structures such as the caudate nucleus (CN) (Badre and Frank, 2012; Mestres-Missé et al., 2012). Similarly, the head and the body of the CN have been known to be interconnected with the corresponding regions of the PFC such that fibers originating from the anterior or posterior portion of the PFC terminated in the head or the body of the CN, respectively (Yeterian and Pandya, 1991; Verstynen et al., 2012). Various thalamic nuclei are also known to receive inputs from several separate but functionally related cortical areas forming multiple parallel and segregated loops (Zhang et al., 2010). Together, both the cortical and the subcortical structures revealed a rostro-caudal functional dissociation and preferential connections to the cortical areas.
Animal and clinical studies have shown that cortico-striatal-thalamo-cortical loops are topographically organized and functionally segregated in each loop (Grahn et al., 2008; Krause et al., 2012). Alexander and colleagues (Alexander et al., 1986, Alexander and Crutcher, 1990) proposed five parallel segregated loops with selected cortical areas in the frontal lobe. Two of them are involved in motor function with skeletomotor and oculomotor areas, and the remaining three loops are related to nonmotor functions with the dorsolateral PFC, the lateral orbitofrontal cortex, and the anterior cingulate/medial orbitofrontal cortices. Of these five loops, we are particularly interested in the dorsolateral prefrontal loop, which passes information from the PFC, via the CN, the pallidum/substantia nigra, and the thalamus, back to the PFC. This loop is known to be recruited in cognitive aspects, including working memory, planning, rule-based learning, and sequence learning (Koziol and Budding, 2009; Goldman-Rakic, 2011).
Based on these findings, we aimed to scrutinize large-scale functional specificity and structural connectivity pertinent to different levels of cognitive hierarchies in the PFC, the CN, and the thalamus. Despite a considerable number of animal and clinical studies, functional organization and structural connections of these brain areas have not yet been fully understood in healthy participants because previous studies were confined to invasive axonal tract-tracing, cell-recording, or postmortem studies, which are not applicable to humans (Zhang et al., 2010). In addition, the functional description of the subcortical structures was not precise enough to discern subareas, given their established functional heterogeneity (Llano, 2013). Here, we addressed these issues by using high-spatial-resolution MR imaging, at 7 tesla (7T), for detailed and noninvasive investigation. We hypothesized that the anterior–posterior functional dissociation of the PFC would also be reflected in the CN and the thalamus, mirroring functional specificity across cortical and subcortical areas. In addition, functionally compartmental areas in the PFC, the CN, and the thalamus would be interconnected by parallel fascicles showing a high correspondence between functional mapping and structural connectivity.
Materials and Methods
Participants.
Nineteen participants (9 males, 10 females; age 20–28 years, mean 22.5 ± 3.7 years) took part in the experiments. They were all native speakers of German with no history of neurological disease, and all were right-handed [mean LQ (language quotient) = 92.7 ± 6.6; Oldfield, 1971]. They had normal or corrected-to-normal vision and gave written, informed consent to participate in the study. None of the participants had previously studied Korean or any other Asian languages. The study was approved by the Research Ethics Committee of the University of Leipzig.
Learning procedure.
We designed a cross-domain study (language and nonlanguage) based on the view that a common neural system participates in aspects of processing linguistic sequences and abstract nonlinguistic sequences within the cortico-striatal-thalamo-cortical loop (Dominey et al., 2003; Dominey, 2005). Moreover, this allowed us to confirm the domain generality of the finding. For the language domain, second language (L2) was used instead of first language because the task difficulty between the processing of L2 and nonlanguage (NL) is similar, being engaged in a controlled process (Abutalebi, 2008; Jeon and Friederici, 2013).
In the L2 study, participants learned a miniature version of Korean containing simplified grammar, invented vocabulary, and easy pronunciation, which was known to guarantee a successful learning performance in a short period of time (Jeon and Friederici, 2013). The experimental setups met all the requirements for successful L2 learning following the linguistic theories by enabling the participants to learn in an interactive and formal situation (Carroll, 1973; Krashen et al., 1978). Learning comprised three stages: syllable, vocabulary, and grammar. For syllable learning, participants studied seven consonants ( ) and five vowels (
 ) that were presented with their pronunciation, thus allowing participants to additionally learn phonological knowledge in Korean. For vocabulary learning, participants studied different types of words: (a) noun:
  (mother),
  (father),
  (sister),
  (flower),
  (book); (b) verb:
  (sell),
  (buy),
  (see),
  (like); (c) temporal adverb:
  (yesterday),
  (today),
  (tomorrow); and (d) numeral noun:
  (one),
  (two),
  (three), along with their pronunciation and pictures. For grammar learning, function words were introduced: (a) particles (subject
 , object
 ), (b) a verb final ending (
 ), (c) a prefinal ending for subject honorification (
 ), (d) prefinal endings for tense (past
 , future
 ), (e) a complementizer (
 ), and (f) numeral classifiers for flower (
 ) and for book (
 ). Along with the function words, participants learned simplified rules of Korean grammar: (a) subject–verb agreement, (b) applying particles attached to a word to specify the role of the word as a subject or an object, (c) constructing a verb phrase with a prefinal ending for honorification or tense before the verb final ending, (d) using numeral classifiers to count a noun, and (e) constructing an embedded sentence by attaching a complementizer to the end of a verb phrase.
In the NL study, we used Korean vowels and consonants which were not used in the L2 study, renamed them as Nero symbols and Fero symbols, respectively, and devised a color sequence rule. In other words, here, participants processed Korean vowels and consonants not as linguistic stimuli but as nonlinguistic ones. The learning process comprised three stages corresponding to those of L2 learning: Nero/Fero symbol identification, Nero color rule acquisition, and Fero sequence rule application. For symbol identification, participants learned Nero and Fero symbols and classified them into three groups: N1 ( ), N2 (
 ), N3 (
 ) for the Nero group, and F1 (
 ), F2 (
 ), F3 (
 ) for the Fero group. For Nero color rule acquisition, we introduced a “chunk” as a corresponding structure for a phrase in L2 and participants learned rules of color sequence in a chunk depending on the first Nero symbol within the chunk. For example, if the first Nero symbol was from N1 (i.e., “
 ” in “
 ”), then the color sequence of the chunk was green (G)–red (R)–yellow (Y)–blue (B) (i.e.,
  ). Similarly, if a chunk started with the Nero symbol from N2 or N3, then the color sequences of the chunks were B–Y–R–G or R–B–G–Y, respectively. When the number of symbols in a chunk was more than four, the color sequence was repeated (i.e.,
  ). For the final learning stage of the Fero sequence rule application, participants studied how to apply the Nero color rule to series of other chunks according to the Fero sequence rule, as follows. Rule 1: If the first Fero symbol in a chunk belongs to F1, the Nero color sequence of the chunk is applied to the current and the next chunk; Rule 2: If the first Fero symbol of a chunk belongs to F2, the Nero color rule of the chunk applies to the current chunk and an upcoming chunk only when it starts with a symbol from F2; Rule 3: The Nero color rule applies to only the current chunk if the chunk starts with a symbol from F3.
The learning session for each domain took 2 days. The L2 and NL learning sessions were conducted 1 month apart, and the order of learning was counterbalanced across all the participants who each participated in both L2 and NL studies. Participants learned the stimulus material using a Microsoft PowerPoint slide show through which they could progress at their own speed by navigating freely through the slides. They were instructed to study the stimulus material until they became confident about their learned knowledge. They progressed to the next level if they scored >90% accuracy; otherwise, they repeated the learning and testing procedures until they met the criterion to move on to the next level. Participants could terminate the learning session and progress to the fMRI session after they achieved >90% accuracy in the final learning tests (i.e., grammar learning in L2 and Fero sequence rule learning in NL). All the tests across the three levels consisted of 80 questions with four multiple-choice answers, programmed with MATLAB 7 (Mathworks Inc.). Responses were made by pressing number keys on a keyboard.
fMRI procedure.
Event-related fMRI scanning was administered the day after termination of the learning session. On the day of the fMRI experiment, participants had 30 min of training before the actual scanning to revise what they had learned previously. The three levels of hierarchies were constructed following the cascade model proposed by Koechlin (Koechlin and Summerfield, 2007). This model described the processing of a given stimulus in relation to cross-temporal contingencies (Fig. 1). The lowest level is represented by a contextual condition which corresponds to the situation, where participants can respond to a stimulus without referring to previous or upcoming stimuli. The medium level is represented by the episodic condition, where participants should consult a discrete preceding stimulus, presented shortly before, to respond to the current stimulus. The highest level is represented by the branching condition, which is similar to the episodic condition in that participants refer to the discrete preceding stimulus to select the response that is appropriate to the current stimulus. The distinctive feature of the branching condition compared with the episodic condition is that the ongoing stimulus is maintained in a pending state while another stimulus is being processed, and is reactivated upon completion of the ongoing one. For example, the structure of branching control can be depicted as A–B–A′, where an ongoing task A is suspended by an intervened task B and then reactivated subsequently as task A′ after completion of task B (E. Koechlin, personal communication). The three conditions were randomly positioned in the sentences/sequences. For a baseline condition (BASE), participants simply pushed the response button when several Xs were presented on the screen before sentences/sequences started. Six phrases/chunks in a sentence/sequence were visually presented one by one. Each stimulus was presented for 3 s, jittered by 0, 0.5, 1, 1.5, or 2 s. Participants were asked to judge the grammaticality of each phrase in L2 and the Fero sequence rule of each chunk in NL via button press (index finger—correct, middle finger—incorrect) within the 3 s that the stimulus was displayed on screen. Across the domains, experiments consisted of two sessions each comprising 52 sentences in L2 or 52 sequences in NL. Sentences/sequences consisted of six phrases in L2 and six chunks in NL having two contextual conditions, one episodic condition and one branching condition, which yielded 104 trials in the baseline, episodic, and branching conditions and 208 trials in the contextual condition. Mean sentence/sequence asynchrony was 28 s, and one session lasted for 1456 s, resulting in ∼50 min for two sessions. Stimuli were projected onto the back of a screen via an LCD projector. Participants viewed the images on the screen above their heads through a mirror attached to the head coil.
Figure 1.

Schematics of the three levels of cognitive hierarchies in L2 and NL domains. A, A sentence example from the miniature version of Korean is provided. We colored letters in the sentence in the same way as in a sequence in NL to control the variability of visual input across the domains and, thus, colors have no meanings here. Participants judged the grammaticality of each of the six phrases and responded via button press. In the contextual condition, participants judged the grammar within a phrase itself without referring to other phrases. For example, the first contextual condition ( in ➁) is a correct trial where each stimulus is ordered correctly with a noun (
 : sister) before subject particle (
 ). The second contextual condition (
 in ➂) is incorrect; the order should be noun (
 : flower)–number (
 : one)–numeral classifier for flower (
 )–object particle (
 ), whereas in this phrase, number, and numeral classifier are switched. In the episodic condition, participants responded to stimulus with respect to the discrete preceding stimulus. For example, the verb tense of a phrase (
 in ➄) is indicated as being in the past by a prefinal ending for past tense (
 ) because of the prior temporal adverb (
 : yesterday in ➃). Additionally, each grammatical feature is ordered correctly in ➄: verb (
 : buy)–prefinal ending for past tense (
 )–final ending (
 )–complementizer (
 )–object particle (
 ). For the branching condition, processing one stimulus is maintained in a pending state while another stimulus is being performed, and reactivated upon completion of the ongoing one. In this example, the processing of the subject in the main clause (
 : father in ➀) along with a subject particle (
 ) is suspended by a center embedded sentence denoted by brackets and then reactivated, influencing the verb phrase (➅) at the end of the sentence. Since the subject is father, prefinal ending for subject honorification (
 ) should be included in the verb phrase which is omitted in ➅ as verb (
 : like)–prefinal ending for past tense (
 )–final ending (
 ). Therefore, this is an incorrect trial. The brackets in A are displayed only in this example to denote an embedded sentence but not in the learning session or in the fMRI session. Direct translation: Father liked that sister bought one flower yesterday. B, A sequence example in NL is provided. Participants were asked to judge the Fero sequence rule of each of the six chunks and to respond via button press. In the contextual condition, the chunks begin with symbols of F3 (
 in
in  in ➃,
in ➃,  in
in  in ➄) so that the Nero color rule of the chunks is applied to only the current ones without referring to preceding or upcoming chunks. Therefore, with the first Nero symbol
  in
in  (➃), the color sequence displays blue (B)–yellow (Y)–red (R)–green (G), which is a correct trial. Since there are only three symbols in ➃, the last color (G) is omitted. Similarly, the first Nero symbol in
  (➄) is
  such that the symbols in the chunk should be colored with G–R–Y–B. However, this chunk is incorrectly colored with B–Y–R–G. In the episodic condition, the chunk starts with a symbol of F1 (
 in
in  in ➁). Therefore, the Nero color rule of the chunk is applicable to the current and the next chunk, which also leads to the color sequence G–R–Y–B in the third chunk (
 in ➂). The last symbol (
 in ➂) is colored with G because of a repetitive rule of color sequence when a chunk consists of more than four symbols across all the conditions. These two chunks (➁, ➂) are correct trials. In the branching condition, the first Fero symbol of the first chunk (
 in
in  in ➀) belongs to F2 so that the Nero color rule of the chunk (B–Y–R–G) also applies to a subsequent chunk starting with F2 (i.e., ➅ in this example). Therefore,
  in ➅ is correctly colored with B–Y–R following the color rule of the preceding chunk (➀).
fMRI data acquisition.
Functional images were acquired on a human whole-body 7T MRI scanner (Magnetom 7T, Siemens Healthcare Sector) with a 24-channel NOVA head coil (NOVA Medical). 7T fMRI offers the advantage of high signal-to-noise ratio subsequently leading to a better contrast-to-noise ratio. This in turn produces the beneficial effect of higher sensitivity of fMRI for depicting the detailed structure of subcortical areas (Olman and Yacoub, 2011; Heidemann et al., 2012b). High-resolution 3D anatomical T1-weighted scans for the whole brain were acquired with MP2RAGE (Marques et al., 2010) using the following parameter set: TR = 5 s, TE = 2.45 ms, TI1 = 900 ms, TI2 = 2750 ms, flip angle1 = 5°, flip angle2 = 3°, isotropic voxel size = 0.7 mm, GRAPPA acceleration (iPAT = 2). For the functional scans, the T1-weighted images were used to position the slice package, and, accordingly, 49 axial T2*-weighted gradient-echo echo-planar images (GE-EPIs) were acquired with the following parameters: TR = 2 s, TE = 18 ms, flip angle = 80°, isotropic voxel size = 1.5 mm, GRAPPA acceleration (iPAT = 3), no gap. A field map was acquired to correct the images for distortions caused by the static field inhomogeneity. Additionally, 3D T1-weighted structural scans were collected from a 3T MRI scanner (Siemens Trio) on a different day (MP-RAGE sequence, nonselective inversion pulse, TI = 650 ms, TR = 1.3 s, TE = 3.93 ms, flip angle = 10°, bandwidth = 67 kHz/pixel, matrix = 256 × 240, 128 sagittal slices, spatial resolution = 1 × 1 × 1.5 mm3, 2 acquisitions, reconstructed to an isotropic voxel size of 1 mm).
Diffusion MRI data acquisition.
We acquired diffusion-weighted MRI (dMRI) data from 9 healthy young participants (22.5 ± 3 years) randomly selected from the group of participants of the fMRI experiment. Approximately 1 month elapsed between fMRI and dMRI sessions. Imaging was performed using the same 7T MR hardware as for the fMRI acquisition. With particular advantage for diffusion imaging, the scanner was equipped with a high-performance gradient system achieving a maximum gradient amplitude of 70 mT/m and a maximum slew rate of 200 T/m/s (SC72; Siemens Healthcare). High-angular-resolution diffusion-weighted images were acquired with a single-refocused spin-echo EPI sequence (Heidemann et al., 2012a), which allowed high-resolution, high-quality acquisition with an isotropic voxel size of 1 mm, and full brain coverage (imaging parameters: TE = 67 s, acquisition matrix = 204 × 204, 100 axial slices, 1 mm isotropic resolution, no gap, TR = 11.3 s, GRAPPA acceleration iPAT = 3, bandwidth 1066 Hz/pixel, 6/8 partial Fourier). Phase-encoding was chosen in the anterior–posterior direction. The dMRIs with a b-value of 1000 s/mm2 were acquired along 60 diffusion-encoding gradient directions distributed isotropically on one hemisphere. Additionally, seven reference images with minimal diffusion weighting (b-value = 50 s/mm2) were acquired at the beginning of the sequence and after each block of 10 dMRIs. They were used as reference images with high signal intensity for offline motion correction. Images with a b-value of 50 (instead of b = 0) were chosen to partially suppress the signal from the cortico-spinal fluid and reduce partial volume effects. The seven diffusion directions were isotropically distributed and averaged in the preprocessing step to exclude a directional bias. The sequence lasted 13.5 min and was repeated 4 times to optimize the image quality. Additionally, field maps with an isotropic resolution of 2 mm and a high-resolution anatomical T1-weighted image were acquired.
Behavioral data analysis.
In the learning session, mean percentage accuracy in the final learning test (Korean grammar test in L2 and Fero sequence rule test in NL) was calculated across the domains. In the fMRI session, mean percentage accuracy and response time (RT) were calculated across the domains with a two-way within-subject ANOVA with factors Condition (contextual, episodic, and branching) and Domain (L2, NL).
fMRI data analysis.
Analysis and visualization were performed using SPM8 software (http://www.fil.ion.ucl.ac.uk/spm/). The first five functional volumes were excluded to allow for magnetic saturation effects, leading to a total of 732 volumes per scanning session. The fMRI images were slice-time corrected, realigned to the first image, and corrected for geometric distortions using the individual field map. For coregistration, high-resolution T1-weighted images from 7T MRI and from 3T MRI were skull-stripped using CBS Tools (http://www.cbs.mpg.de/institute/software/cbs-hrt; Lucas et al., 2010; Bazin et al., 2012; Landman et al., 2013), and the stripped 7T structural image was coregistered onto the stripped 3T structural image and then once more onto the SPM8 T1 template image (Montreal Neurological Institute). These coregistered 7T structural images were obtained to confirm correct registration between the two experiment sessions and the absence of spatial distortion, which is known to increase with higher magnetic field strength (Dammann et al., 2011). The fMRI images were normalized to the standard SPM8 T1 template image and smoothed with an isotropic 3 mm full-width half-maximum (FWHM) Gaussian kernel.
Whole-brain analysis.
Participants' hemodynamic responses were estimated based on the general linear model of SPM8 (http://www.fil.ion.ucl.ac.uk/spm/) for the stimulus duration from the onset of each condition. Six regressors were created: BASE, contextual condition, preceding/subsequent episodic conditions (e.g., ➃/➄ in Fig. 1A and ➁/➂ in Fig. 1B), and preceding/subsequent branching conditions (e.g., ➀/➅ in Fig. 1A,B). The preceding/subsequent stimuli were modeled separately because dissociation between the episodic and branching conditions became obvious when the subsequent stimulus was processed, whereby only the subsequent regressors were considered for the episodic- and branching-specific contrasts. Additionally, motion parameters and incorrect responses were incorporated into the model as nuisance regressors. Overall patterns of activations were first obtained by a fixed-effect analysis on data pooled over all participants. Condition-specific effects involved creating contrast images of each condition (contextual, episodic, and branching) with a comparison to the baseline condition (BASE) for each participant. These contrast images were then entered into a second-level random effect analysis. Based on the hypothesis, we looked for activations that showed gradual increase as the level of hierarchy became higher in L2 and NL separately, leading to the contrasts of each condition: [contextual > BASE] for the contextual condition, [episodic > contextual] for the episodic condition, [branching > (episodic ∪ contextual)] for the branching condition. Contrasts were initially thresholded at p < 0.001 uncorrected, and only activations that survived p < 0.05 FDR (false discovery rate) at cluster level were reported. For percentage BOLD (blood oxygenation level-dependent) signal change, we extracted β values of each condition within a sphere-shaped region (radius 2 mm) centered upon the peak voxel from each participant using the MarsBaR software (http://marsbar.sourceforge.net/) and averaged them over participants.
Volume of interest analysis.
Given the hypothesis about the mirrored pattern of activations in the cortical area (PFC) as well as the subcortical area along with the dorsolateral PFC loop, a volume of interest (VOI) analysis over the CN and the thalamus was performed separately. Originally, the dorsolateral PFC loop consisted of the PFC, the CN, the pallidum/substantia nigra, and the thalamus (Alexander et al., 1986). However, we excluded the pallidum/substantia nigra and focused on the CN and the thalamus as VOI. The reason for selecting the CN and the thalamus as VOI was that the detectability of BOLD signal is known to be maximized in the CN and the thalamus. BOLD fMRI using GE-EPIs measures T2*-weighted signals whose detectability is affected by iron deposition in the tissues; the more the iron is accumulated, the less the T2*-weighted signal is detected. In particular, a previous study about quantitative MR imaging of iron concentration in the brain demonstrated that the amount of iron deposition within the basal ganglia was highest in the globus pallidus (GP), moderate in the putamen, and lowest in the CN and the thalamus (Langkammer et al., 2010), which limits the detectability of functional activations in the GP and the putamen. For the VOI analysis, we set up the same contrasts as in the whole-brain analysis. The statistical inferences for activation were drawn with the search volume confined to the bilateral CN and thalamus defined by automated masks from the Wake Forest University Pickatlas (http://fmri.wfubmc.edu/software/PickAtlas) at p < 0.001 uncorrected at voxel level and p < 0.05 FDR corrected for VOI at cluster level (Maldjian et al., 2003).
Singular value decomposition analysis.
To quantify the distribution of activation foci, individual xyz-coordinates from the MNI space were extracted from the peak activations in the episodic and branching conditions in L2/NL domains and were transformed into an optimal coordinate system using singular value decomposition (SVD; Watkins, 2004). SVD allows the transformation of a high-dimensional dataset into a lower-dimensional one while preserving most of the variance. In our study, we transformed the three-dimensional fMRI coordinates of the peak voxels in the two experimental conditions (episodic and branching) into a one-dimensional coordinate (along the dominant direction) so that we could estimate orientation of the plane in which the fMRI coordinates were stretched with the highest variance.
dMRI data analysis.
The dMRI data were corrected for participant motion using rigid-body transformation (Jenkinson et al., 2002) computed from the 7 reference images. The transformations were interpolated to the 67 volumes of each acquisition and applied as initial motion correction step to the data. After motion correction, small linear eddy-current distortions remained in the phase-encoding direction (anterior–posterior direction). They were corrected by linear registration of all dMRIs to the mean dMRI (b = 1000) with restriction of the optimization to the anterior–posterior direction. Additionally, geometrical distortions in the dMRIs caused by magnetic susceptibility artifacts were corrected using the field map. This map was converted into a voxel displacement map and scaled to the resolution of the dMRI. A final transformation was used to align the dMRIs with the anatomical images. Therefore, the brain was segmented from T1-weighted structural scans, and then rotated to the standard coordinate system defined by the midsagittal plane and the anterior and posterior commissure. The distortion-corrected mean reference dMRI was registered on this structural image using a mutual information cost function, and the registration parameters were combined with the motion and eddy-current correction parameters as well as the voxel displacement map. All steps were combined to one transformation image for each acquisition and applied to the dMRIs after an initial two-stage hybrid image restoration (Lohmann et al., 2010). The gradient directions for each volume were corrected using the rotation parameters. In this way, the registered images were interpolated only once to the anatomical space and the 1 mm isotropic resolution was preserved with minimized image interpolation. Finally, the four corresponding acquisitions and the gradient directions were averaged to increase the signal-to-noise ratio (SNR). Averaging several acquisitions was of particular importance in areas of lower signal intensity, as was done in the inferior frontal lobe, to compensate the inhomogeneous sensitivity of the MR acquisition coil. For comparison, we estimated the SNR within a white-matter region in the parietal lobe (high signal) and within the inferior frontal lobe. The SNR was computed as the mean signal of two consecutive acquisitions divided by the SD of the difference image. In the parietal lobe it was 24 ± 1 (SD) for a single image with a low b-value and 25 ± 2 for the averaged b = 1000 image of one gradient direction in a typical participant (corrected for the 4 repetitions). In the inferior frontal lobe, the SNR was 15 ± 1 and 16 ± 2, respectively.
To estimate the 3D fiber pathway between the cortical and subcortical fMRI activation maxima, as well as the strength of the different connections in the pathway, we performed probabilistic tractography using a crossing fiber model (up to 3 directions per voxel) using FSL (www.fmrib.ox.ac.uk/fsl; Behrens et al., 2007). This method allows a robust estimation of the white-matter fiber pathway between two masked brain areas and a precise localization of the connecting tract. The robust group activation maxima in the PFC, CN, and thalamus were morphed to the brain of each participant. For highest-precision tractography, the cortical locations were projected to the closest white-matter voxel, and we examined the locations of the subcortical seed points individually and corrected their locations in the CN and the thalamus. Probabilistic tractography was seeded with 5000 streamlines per voxel in a local neighborhood with a radius of 4 mm around the activation maximum (257 voxels). Differentiation of a probabilistic connection from the chance level is still an open issue (Morris et al., 2008). Based on the high SNR value in the data used in this study, we are confident that the structural pathways were robustly reconstructed. To detect only anatomically correct connections, we chose a conservative threshold of 100 computed pathways connecting both regions. This threshold was determined empirically, based on the data properties and the correspondence of the reconstructed pathway across participants and conditions. All connections were individually checked for consistency with the underlying high-resolution anatomy. Additionally, the median connection strengths and their variability were reported for all connections. Random connections (binarization threshold at 10% of the maximum visitation value) were removed from the final tractography image (also called visitation map), and the image was normalized to the template brain in MNI standard. The group overlap of the connection pathways was slightly smoothed (Gaussian filter with 1 mm FWHM) for visualization purposes.
Results
Behavioral results
For the learning sessions, the mean percentage accuracy and the SEM for the final grammar tests were 89.89% (5.49) for L2 and 90.68% (3.28) for NL. An independent sample t test showed no significant differences between the groups (t (−1.38) = 36, p = 0.176). For the fMRI sessions, the mean percentage accuracy and the mean RTs are provided in Figure 2. Within-subjects ANOVAs on accuracy and RTs were conducted with the factors Domain (L2 and NL) and Hierarchy (contextual, episodic, branching). In accuracy data, no main effect was observed in DOMAIN (F(1,18) = 41.97, p = 0.32) and in Hierarchy (F(2,36) = 0.97, p = 0.38). The RTs showed a main effect in HIERARCHY (F(2,36) = 341.474, p < 0.001) but not in Domain (F(1,18) = 0.001, p = 0.975). Interaction was revealed only in RT (F(2,36) = 6.86, p = 0.003) but not in accuracy (F(2,36) = 0.967, p = 0.39).
Figure 2.

Behavioral results from fMRI studies of L2 and NL. Mean percentage accuracy (A) and RTs (B) are described in the contextual, episodic, and branching conditions in L2 and NL. Error bars denote SEM. *p < 0.05.
Functional MRI data results
Whole-brain analysis
The activations pertinent to the varying levels of cognitive hierarchies across the L2 and NL domains were superimposed in the lateral PFC with mean percentage BOLD signal changes (Fig. 3; see Table 1 for their coordinates). In L2, the lowest level of hierarchy (the contextual condition) showed the most posterior activation in the left precentral gyrus (BA 4; not displayed in the figure; see Table 1 for its xyz-coordinate). For the highest level of hierarchy (the branching condition), the activation was found in the most anterior region (the left middle orbital gyrus, BA 47). The activation in the episodic condition, relevant to the medium level of hierarchy, was observed in the posterior pars triangularis (BA 45 boarding BA 44) being located between the other two areas.
Figure 3.

Posterior-to-anterior pattern of activations depending on the levels of cognitive hierarchies across L2 and NL in the PFC. Brain activations elicited by the episodic and branching conditions across L2 and NL were rendered on a canonical brain provided with MRIcron software (http://www.mccauslandcenter.sc.edu/mricro/mricron/). Activations from the contextual condition in the left hemisphere and the branching condition in the right hemisphere are not displayed here (see Table 1 for their coordinates). Bar graphs represent the mean percentage signal change within the sphere-shaped regions (radius 2 mm) centered upon the peak voxels for each condition. Error bars denote SEM. n = 19, *p < 0.05. BRAN, Branching condition; EPIS, episodic condition.
Table 1.
Brain regions showing significant activations in the PFC, CN, and thalamus

MNI-coordinates for peak voxels for each significant cluster in the relevant comparisons (p < 0.05 FDR-corrected cluster level, threshold p < 0.001 uncorrected voxel-wise). CONT, Contextual condition; EPIS, episodic condition; BRAN, branching condition; L, left hemisphere; R, right hemisphere; BA, Brodmann area; k = cluster size.
By also applying the gradient-wise comparison to the NL domain, results similar to those observed for L2 were revealed. The anterior portion of the ventrolateral PFC (BA 45 boarding BA 47) was activated for the highest level of cognitive hierarchy (branching condition). The medium level (episodic condition) activated a more posterior area, namely, the left ventral precentral gyrus (BA 4). Additional right hemisphere activation was observed in the precentral gyrus in the branching condition (not displayed in the figure, see Table 1 for its xyz-coordinates). No significant activation was observed in the contextual condition in NL. The mean percentage BOLD signal changes represented significant differences between the episodic and branching conditions.
Volume of interest analysis
To test whether the gradient pattern of activations in the lateral PFC was replicated in the subcortical structure, we analyzed the VOI in the CN and the thalamus. As expected, the same gradient was depicted with the CN being activated in the central region (body of the CN) in the episodic condition, whereas the ventroanterior region (head of the CN) was activated in the branching condition across the two domains (Fig. 4; see Table 1 for their coordinates). No significant activation was found for the lowest level of hierarchy; that is, the contextual condition in the CN in both conditions. The mean percentage BOLD signal changes also suggested that each of the activation foci represented the dissociation well in terms of neural activities generated from the different levels of hierarchies.
Figure 4.

Posterior-to-anterior pattern of activations depending on the levels of cognitive hierarchies across L2 and NL in the CN. Brain activations elicited by the branching and episodic conditions across L2 and NL were rendered on a sagittal view of the CN. Bar graphs represent the mean percentage signal change within the sphere-shaped regions (radius 2 mm) centered upon the peak voxels for each condition. Left, The activations related to the branching condition were observed in the anterior region of the CN (head of the CN) across the domains. Right, The activations involved in the episodic condition were observed in the posterior region of the CN (body of the CN). n = 19, *p < 0.05. Error bars denote SEM. BRAN, Branching condition; EPIS, episodic condition; LH, left hemisphere.
As in the PFC and the CN, various thalamic nuclei also showed a gradient pattern of activations not only in L2, but also in NL (Fig. 5). In the branching condition, the most anterior activation was found in the left ventral anterior nucleus (VA) and, interestingly enough, an additional posterior region (the left MD) was observed in this condition. In the episodic condition, the activation was yielded in the more posterior region (MD). The activation related to the contextual condition and some activations in the right hemisphere were observed as well (not displayed in Fig. 5; see Table 1 for their coordinates). The mean percentage BOLD signal changes showed significant differences between the two conditions (episodic vs branching) only in the VA, but not in the MD. In the PFC, the CN, and the thalamus, the lowest level of hierarchy (contextual condition) did not display systematic activations across domains and was therefore excluded from further analyses.
Figure 5.

Posterior-to-anterior pattern of activations depending on the levels of cognitive hierarchies across L2 and NL in the thalamus. Brain activations in the thalamus elicited by the branching condition and the episodic condition across L2 and NL were rendered on an axial view of the brain. Activations related to the contextual condition in the bilateral hemisphere and the episodic-related activation in the right hemisphere are not displayed here (see Table 1 for their coordinates). Bar graphs represent the mean percentage signal change within the sphere-shaped regions (radius 2 mm) centered upon the peak voxels for each condition. Left, The activations related to the branching condition were depicted in the anterior region (VA). Additionally, branching-related activations were also observed in the posterior region (MD). The overlapping regions between the domains were colored with red and blue obliquely. Right, The activations involved in the episodic condition were depicted in the more posterior region (MD). The overlapping areas between the two domains were colored with orange and green obliquely. n = 19, *p < 0.05. Error bars denote SEM. BRAN, Branching condition; EPIS, episodic condition; LH, left hemisphere.
Singular value decomposition analysis
A 2 × 2 ANOVA between Hierarchy (episodic vs branching) and Domain (L2 vs NL) was performed over the transformed xyz-coordinates in the left hemisphere. Only the coordinates from the episodic and branching conditions were taken for SVD analysis, and those from the contextual condition were excluded because they were missing in NL in the PFC and in L2/NL in the CN. As expected, within the PFC, there was a main effect of Hierarchy (F(1,18) = 89.913, p < 0.001), but not a main effect of Domain (F(1,18) = 0.389, p = 0.541). An interaction was found between the two factors (F(1,18) = 24.21, p < 0.001). The post hoc test was conducted on variables of hierarchical levels. With the Bonferroni tests, the comparison between the two conditions (episodic vs branching) showed significant differences in terms of their peak activation areas (p < 0.001). Crucially, the coordinates in the CN from the VOI analysis revealed the same results as in the PFC. We found a main effect of Hierarchy (F(1,18) = 135.38, p < 0.001) and interaction (F(1,18) = 86.26, p < 0.001). No significant main effect was found for the factor Domain (F(1,18) = 6.65, p = 0.091). The post hoc tests with Bonferroni correction also showed that the episodic and branching conditions were significantly differentiated regarding their peak activation areas (p < 0.001). Finally, in the thalamus, where we considered only the VA from the branching condition and the MD from the episodic condition for analysis, we found a main effect for Hierarchy (F(1,18) = 25.55, p < 0.001) but no main effect for Domain (F(1,18) = 2.74, P= 0.115) or interaction (F(1,18) = 2.62, P= 0.123). The post hoc tests were also administered between the episodic and branching conditions using Bonferroni correction, leading to a significant difference between the peak activation areas (p < 0.001).
dMRI data results
High-resolution dMRI tractography at 7T MRI was able to determine the white-matter pathway between the activation maxima in the PFC and the respective areas in the CN and the thalamus, which were derived from the group analysis. The connection strength computed as relative number of connecting pathways was above threshold for all the connections in all the participants. The connection between each pair of cortical and subcortical activations (i.e., PFC–CN, and PFC–thalamus) showed parallel, mainly nonoverlapping pathways in the white matter.
Pathway between the PFC and the CN
In the branching condition of L2 and NL, the pathway starting from the activation maxima in the PFC followed the fibers which are parallel to the anterior thalamic radiation (ATR) and sharply curved to reach the ventral head of the CN. The pathways for L2 and NL run parallel, with NL being positioned dorsal to L2. In the episodic condition, the PFC and the body of the CN were interconnected through a lateral–medial pathway which crossed the superior longitudinal fascicle (SLF) and the internal capsule in both domains. The connections of the L2 and NL showed parallel pathways until they reached the CN and followed a pathway within the CN to reach their activation peaks (Fig. 6A).
Figure 6.
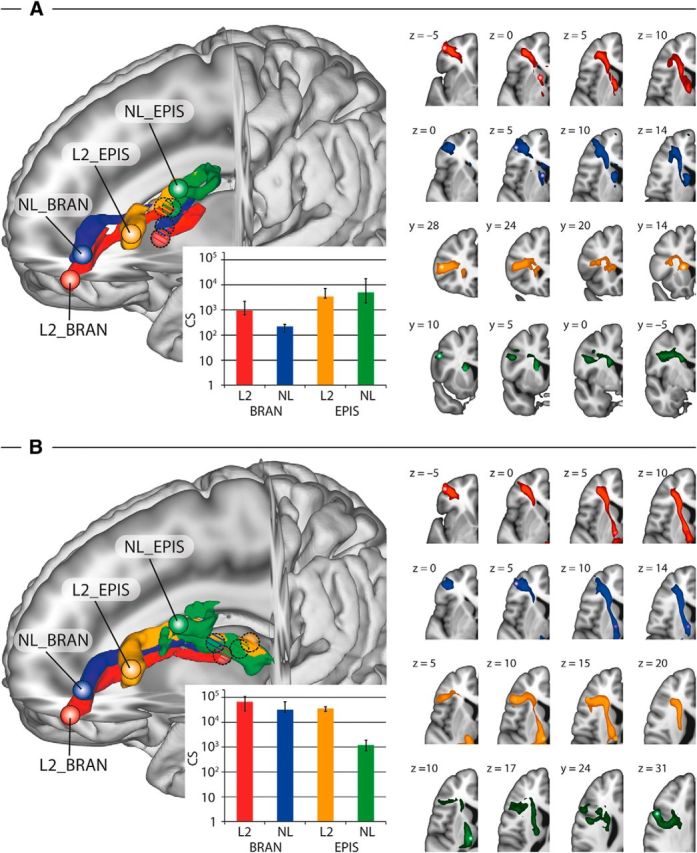
Parallel cortico-striatal pathways. A, Parallel cortico-striatal pathways between the PFC and the CN for different levels of cognitive hierarchies. Left, 3D rendering of the group average of probabilistic tractography between the seeds in the PFC and the CN for the branching and episodic conditions across L2 and NL. Brain activations used as seed regions are depicted with small spheres for the PFC and circles filled with oblique lines for the CN. The surface of the connecting tract is shown in the corresponding colors. The tractography follows parallel and segregated pathways for the different conditions. Inset, Quantitative analysis of the connection strength (CS) for all participants. The bars indicate the median CS for all conditions computed as the relative number of pathways connecting each pair of seed regions. Error bars show quartiles. Right, Group overlap of the tractography visitation map of all participants for the branching conditions (two rows at the top displayed in axial slices) and the episodic conditions (two rows at the bottom displayed in coronal slices) with slice coordinates in MNI space. B, Parallel cortico-striatal pathways between the PFC and the thalamus for different levels of cognitive hierarchies. Left, 3D rendering of the group average of probabilistic tractography between the seeds in the PFC and the thalamus for the branching and episodic conditions across L2 and NL. Brain activations used as seed regions are depicted with small spheres for the PFC and circles filled with oblique lines for the thalamus. The surface of the connecting tract is shown in the corresponding colors. The tractography follows parallel and segregated pathways for the different conditions. Inset, Quantitative analysis of the CS for all participants. The bars indicate the median CS for all conditions computed as the relative number of pathways connecting each pair of seed regions. Error bars show quartiles. Right, Group overlap of the tractography visitation map of all participants and conditions in axial slices with slice coordinates in MNI space (n = 9). BRAN, Branching condition; EPIS, episodic condition.
Pathway between the PFC and the thalamus
In the branching condition, the PFC was interconnected to the anterior thalamic nucleus (i.e., VA) through the ATR in L2 and NL. The pathways for L2 and NL run parallel, with NL being positioned dorsal to L2. The pathway for the episodic condition in L2 also followed the ATR between the PFC and the thalamus and aligned with the internal lamina to connect with the posterior thalamic nucleus (i.e., MD). In the episodic condition in NL, the pathway between the PFC and the MD ran in medial–lateral orientation, crossed the SLF, and connected with the thalamus at a location similar to the L2 episodic pathway (Fig. 6B).
Discussion
In the present study, the preferentially activated areas depending on varying levels of cognitive hierarchy were observed as the anterior–posterior gradient across the PFC, the CN, and the thalamus not only in L2, but also in NL. These functional specificities were further supported by parallel networks within the human cortico-striatal-thalamo-cortical system.
The PFC
The present high-resolution functional data confirmed that the anterior–posterior gradient within the PFC selectively contributed to different levels of hierarchical processing (Koechlin and Summerfield, 2007; Jeon and Friederici, 2013). To demonstrate this, we compared the peaks of activations in L2 from the present study and those from Koechlin et al. (1999, 2003) and Badre and D'Esposito (2007) by mapping activations related to the hierarchical levels (Fig. 7). Obviously, the cascade of activations in the present experiment mostly overlapped with those in other experiments even though the cognitive hierarchies were ranked based on different frameworks across the studies. It should be noted that several theories have been suggested to explain the possible framework for generating different levels of cognitive hierarchies, including the temporal organization of behavior, abstract representational hierarchy, domain generality in working memory, and relational complexity, and one should be very cautious about drawing a final dissociation between these theories (for review, see Badre, 2008). Among the available theories, we suggest that the concept of cross-temporal contingencies (Koechlin and Summerfield, 2008) was most suitable for generating the levels of cognitive hierarchies in both L2 and NL in the present study.
Figure 7.

Comparison of peak activations within the prefrontal cortex from the present study and those from Badre and D'Esposito (2007) and Koechlin et al. (1999, 2003). A schematic display of the approximate distribution of the activation foci within the prefrontal cortex is provided with spheres (8 mm radius) centered on the coordinates of peak activations in L2 from the present study (red), Badre and D'Esposito (2007; green), and Koechlin et al. (1999, 2003; blue). The MNI-coordinates of our study were converted into the Talairach ones conforming to the other studies. The experimental conditions and the coordinates of the peak voxels in each study are described as follows: 1, “branching control” (−36, 57, 9); 2, “context level” (−36, 50, 6); 3, branching condition (−43, 49, −4); 4, “episodic control” (−40, 32, 20); 5, episodic condition (−45, 27, 24); 6, “dimension level” (−50, 26, 21); 7, “feature level” (−37, 11, 31); 8, “contextual control” (−44, 8, 20); 9, contextual condition (−32, −2, 43); 10, “response level” (−30, −7, 63). Note that context level from Badre et al. (2007) is different from contextual level in Koechlin et al. (1999, 2003) and the contextual condition in the present study. Adapted from Badre et al. (2007).
The CN
Previous fMRI studies have provided evidence of the involvement of the CN in complicated processes such as ambiguity resolution (Ketteler et al., 2008), processing of complex sentences (Mestres-Missé et al., 2012), or word-stem completion tasks with many possible candidates (Desmond et al., 1998). In neuropsychological studies, patients with CN lesions were impaired in a controlled processing where an additional top-down process had to be intervened (Copland et al., 2000). In line with these findings, the CN in the present study was activated only for the higher level of cognitive hierarchy (branching and episodic) but not for the lower level (contextual) because the stimulus–response association for the episodic and branching conditions, unlike the contextual condition, requires a demanding process such as grasping the temporal structure of events involved in the tasks (Kouneiher et al., 2009).
More specifically, an attempt has been made to dissociate the role of subregions within the CN. The segmentation of the structure into head and body components has revealed a consistent observation that the head area is involved in more complex cognitive processing than the body area (Grahn et al., 2008). Patients with Huntington's disease having lesions near the head of the CN showed abnormalities in more demanding language tasks (Chenery et al., 2002). A recent fMRI study also showed more activations in the head of the CN in a language task with a high level of complexity and in the body of the CN in a relatively less complex task (Mestres-Missé et al., 2012). This functional specificity within the CN is also supported by a recent meta-analytic approach revealing parallel functional and structural connections between the PFC and the CN along the anterior-to-posterior region (Desrochers and Badre, 2012; Robinson et al., 2012). All these previous findings and the result of the CN in the present study provide converging evidence that subregions of the CN as part of a cortico-striatal-thalamo-cortical network subserve the process at different levels of cognitive hierarchies.
The thalamus
A similar anterior–posterior gradient was observed with VA being activated only in the branching condition, whereas MD was activated in the branching and episodic conditions across the domains. These distinct thalamic nuclei activations support the early proposal of a “cognitive” prefrontal-subcortical loop as formulated by Alexander et al. (1986) by demonstrating the function of the cortical areas with which the nuclei are connected. A characteristic feature of anterior thalamic neurons is that they fire rhythmically with the so-called “theta rhythm” (Buzsáki, 2002), which increases in power during mnemonic functions (Kirk and Mackay, 2003). In line with this, the activation in VA in the current study can be explained by the fact that participants were involved in the memory processing mostly in the branching condition, for which the information must be temporarily stored and reactivated later when confronting its corresponding stimulus. The VA is also recruited for higher-level cognitive tasks in association with other thalamic nuclei such as the MD, ventral lateral nucleus, or intralaminar nucleus (Zikopoulos and Barbas, 2007), which fits well with our data showing the coactivation between VA and MD.
The thalamus contains several nuclei that are highly specific in their connections with distinct subregions of the cerebral cortex. In particular, the MD, known to have interconnections predominantly with the PFC, is recognized as an intermediary relay station mediating cognitive functions in association with other structures such as the VA, internal medullary lamina, and mamillo-thalamic tract (Masterman and Cummings, 1997; Van der Werf et al., 2003; Negyessy and Goldman-Rakic, 2005; Izquierdo and Murray, 2010; Klein et al., 2010). Therefore, the involvement of the MD across all the conditions in the present study can be interpreted by its role as a primary relay nucleus of the thalamus, linking basal ganglia and the PFC (McFarland and Haber, 2002).
The similar pattern of activations not only in L2, but also in NL, across the PFC, the CN, and the thalamus deserve some discussion in terms of the domain-generality of the present study. Dominey and colleagues (Dominey et al., 2003, 2009) suggested the domain-general involvement of the cortico-striatal-thalamo-cortical loop for the processing of linguistic sequences and abstract nonlinguistic sequences. In their line of research, they have searched for a common link between nonlinguistic sequence processing and language processing with the interaction between cortical (BA 44/6, 45, 47, superior/middle temporal gyrus) and cortico-striatal networks (CN, substantia nigra pars reticulate, and thalamus; Dominey et al., 2009). The detailed discussion of their model is beyond the scope of the present study; however, our study may add empirical evidence that the PFC, CN, and thalamus actively accommodate all the levels of cognitive processes in both linguistic and nonlinguistic domains.
The network
Previous MR tractography and invasive tract-tracing studies showed parallels between topographic specificity in the cortico-thalamic connections such that the lateral PFC had a high probability of interconnection with more lateral MD and a dorsal PFC with a dorsal MD (Yeterian and Pandya, 1991; Klein et al., 2010; Kotz et al., 2013). Another connectivity study (Draganski et al., 2008) also observed a “rostro-caudal gradient” in the PFC, CN, and thalamus. In accord with these findings, the present study, with the help of high-resolution dMRI tractography, allowed us to separate specific and parallel pathways between the functionally differentiated and mirrored cortico-subcortical areas. More importantly, we revealed for the first time precise insight into the 3D course of the parallel cortico-caudal and cortico-thalamic pathways, in particular, following these pathways even in areas of crossing fibers. In addition to the tracking within the white matter, the pathways could also be reconstructed within the subcortical gray matter areas to exactly reach the activation maxima.
Conclusion
In conclusion, this is the first in vivo human study combining fMRI and dMRI to demonstrate the mirroring of functional specificity depending on the cognitive hierarchies within the cortico-subcortical loop substantiated by parallel networks. Future work should investigate functional connectivity among the spatially distributed activations to scrutinize a correlation in resting state time-series of the PFC, the CN, and the thalamus.
Footnotes
We thank Robert Trampel, Pierre-Louis Bazin, and Andreas Schaefer for help with the analysis; Elisabeth Wladimirow and Domenica Wilfling for data acquisition; Etienne Koechlin for helpful comments and suggestions; Jan Leppin, Julia Becker, Marianne Schell, and Merle von der Nahmer for assistance in the behavioral training; Kerstin Flake for graphics; and Elizabeth Kelly for proofreading.
The authors declare no competing financial interests.
References
- Abutalebi J. Neural aspects of second language representation and language control. Acta Psychol (Amst) 2008;128:466–478. doi: 10.1016/j.actpsy.2008.03.014. [DOI] [PubMed] [Google Scholar]
- Alexander GE, Crutcher MD. Neural representations of the target (goal) of visually guided arm movements in three motor areas of the monkey. J Neurophysiol. 1990;64:164–178. doi: 10.1152/jn.1990.64.1.164. [DOI] [PubMed] [Google Scholar]
- Alexander GE, DeLong MR, Strick PL. Parallel organization of functionally segregated circuits linking basal ganglia and cortex. Annu Rev Neurosci. 1986;9:357–381. doi: 10.1146/annurev.ne.09.030186.002041. [DOI] [PubMed] [Google Scholar]
- Badre D. Cognitive control, hierarchy, and the rostro-caudal organization of the frontal lobes. Trends Cogn Sci. 2008;12:193–200. doi: 10.1016/j.tics.2008.02.004. [DOI] [PubMed] [Google Scholar]
- Badre D, D'Esposito M. Functional magnetic resonance imaging evidence for a hierarchical organization of the prefrontal cortex. J Cogn Neurosci. 2007;19:2082–2099. doi: 10.1162/jocn.2007.19.12.2082. [DOI] [PubMed] [Google Scholar]
- Badre D, Frank MJ. Mechanisms of hierarchical reinforcement learning in cortico-striatal circuits 2: evidence from fMRI. Cereb Cortex. 2012;22:527–536. doi: 10.1093/cercor/bhr117. [DOI] [PMC free article] [PubMed] [Google Scholar]
- Bazin PL, Weiss M, Dinse J, Schäfer A, Trampel R, Turner R. A computational pipeline for subject-specific, ultra-high resolution cortical analysis at 7 Tesla. Poster presented at the 18th Annual Meeting of the Organization for Human Brain Mapping; June; Beijing, China. 2012. [Google Scholar]
- Behrens TE, Berg HJ, Jbabdi S, Rushworth MF, Woolrich MW. Probabilistic diffusion tractography with multiple fibre orientations: what can we gain? Neuroimage. 2007;34:144–155. doi: 10.1016/j.neuroimage.2006.09.018. [DOI] [PMC free article] [PubMed] [Google Scholar]
- Buzsáki G. Theta oscillations in the hippocampus. Neuron. 2002;33:325–340. doi: 10.1016/S0896-6273(02)00586-X. [DOI] [PubMed] [Google Scholar]
- Carroll JB. Implications of aptitude test research and psycholinguistic theory for foreign-language teaching. Linguistics. 1973;11:5–14. doi: 10.1515/ling.1973.11.112.5. [DOI] [Google Scholar]
- Chenery HJ, Copland DA, Murdoch BE. Complex language functions and subcortical mechanisms: evidence from Huntington's disease and patients with non-thalamic subcortical lesions. Int J Lang Commun Disord. 2002;37:459–474. doi: 10.1080/1368282021000007730. [DOI] [PubMed] [Google Scholar]
- Copland DA, Chenery HJ, Murdoch BE. Processing lexical ambiguities in word triplets: evidence of lexical-semantic deficits following dominant nonthalamic subcortical lesions. Neuropsychology. 2000;14:379–390. doi: 10.1037/0894-4105.14.3.379. [DOI] [PubMed] [Google Scholar]
- Dammann P, Kraff O, Wrede KH, Özkan N, Orzada S, Mueller OM, Sandalcioglu IE, Sure U, Gizewski ER, Ladd ME, Gasser T. Evaluation of hardware-related geometrical distortion in structural MRI at 7 Tesla for image-guided applications in neurosurgery. Acad Radiol. 2011;18:910–916. doi: 10.1016/j.acra.2011.02.011. [DOI] [PubMed] [Google Scholar]
- Desmond JE, Gabrieli JDE, Glover GH. Dissociation of frontal and cerebellar activity in a cognitive task: evidence for a distinction between selection and search. Neuroimage. 1998;7:368–376. doi: 10.1006/nimg.1998.0340. [DOI] [PubMed] [Google Scholar]
- Desrochers TM, Badre D. Finding parallels in fronto-striatal organization. Trends Cogn Sci. 2012;16:407–408. doi: 10.1016/j.tics.2012.06.009. [DOI] [PMC free article] [PubMed] [Google Scholar]
- Dominey PF. From sensorimotor sequence to grammatical construction: evidence from simulation and neurophysiology. Adapt Behav. 2005;13:347–361. doi: 10.1177/105971230501300401. [DOI] [Google Scholar]
- Dominey PF, Hoen M, Blanc JM, Lelekov-Boissard T. Neurological basis of language and sequential cognition: evidence from simulation, aphasia, and ERP studies. Brain Lang. 2003;86:207–225. doi: 10.1016/S0093-934X(02)00529-1. [DOI] [PubMed] [Google Scholar]
- Dominey PF, Inui T, Hoen M. Neural network processing of natural language: II. Towards a unified model of corticostriatal function in learning sentence comprehension and non-linguistic sequencing. Brain Lang. 2009;109:80–92. doi: 10.1016/j.bandl.2008.08.002. [DOI] [PubMed] [Google Scholar]
- Draganski B, Kherif F, Klöppel S, Cook PA, Alexander DC, Parker GJ, Deichmann R, Ashburner J, Frackowiak RS. Evidence for segregated and integrative connectivity patterns in the human Basal Ganglia. J Neurosci. 2008;28:7143–7152. doi: 10.1523/JNEUROSCI.1486-08.2008. [DOI] [PMC free article] [PubMed] [Google Scholar]
- Goldman-Rakic PS. Circuitry of primate prefrontal cortex and regulation of behavior by representational memory. In: Pollack DM, editor. Comprehensive Physiology. New York: Wiley; 2011. [Google Scholar]
- Grahn JA, Parkinson JA, Owen AM. The cognitive functions of the caudate nucleus. Prog Neurobiol. 2008;86:141–155. doi: 10.1016/j.pneurobio.2008.09.004. [DOI] [PubMed] [Google Scholar]
- Heidemann RM, Anwander A, Feiweier T, Knösche TR, Turner R. k-space and q-space: combining ultra-high spatial and angular resolution in diffusion imaging using ZOOPPA at 7 T. Neuroimage. 2012a;60:967–978. doi: 10.1016/j.neuroimage.2011.12.081. [DOI] [PubMed] [Google Scholar]
- Heidemann RM, Ivanov D, Trampel R, Fasano F, Meyer H, Pfeuffer J, Turner R. Isotropic submillimeter fMRI in the human brain at 7 T: combining reduced field-of-view imaging and partially parallel acquisitions. Magn Reson Med. 2012b;68:1506–1516. doi: 10.1002/mrm.24156. [DOI] [PubMed] [Google Scholar]
- Izquierdo A, Murray EA. Functional interaction of medial mediodorsal thalamic nucleus but not nucleus accumbens with amygdala and orbital prefrontal cortex is essential for adaptive response selection after reinforcer devaluation. J Neurosci. 2010;30:661–669. doi: 10.1523/JNEUROSCI.3795-09.2010. [DOI] [PMC free article] [PubMed] [Google Scholar]
- Jenkinson M, Bannister P, Brady M, Smith S. Improved optimization for the robust and accurate linear registration and motion correction of brain images. Neuroimage. 2002;17:825–841. doi: 10.1006/nimg.2002.1132. [DOI] [PubMed] [Google Scholar]
- Jeon HA, Friederici AD. Two principles of organization in the prefrontal cortex are cognitive hierarchy and degree of automaticity. Nat Commun. 2013;4:2041. doi: 10.1038/ncomms3041. [DOI] [PubMed] [Google Scholar]
- Ketteler D, Kastrau F, Vohn R, Huber W. The subcortical role of language processing. High level linguistic features such as ambiguity-resolution and the human brain; an fMRI study. Neuroimage. 2008;39:2002–2009. doi: 10.1016/j.neuroimage.2007.10.023. [DOI] [PubMed] [Google Scholar]
- Kirk IJ, Mackay JC. The role of theta-range oscillations in synchronising and integrating activity in distributed mnemonic networks. Cortex. 2003;39:993–1008. doi: 10.1016/S0010-9452(08)70874-8. [DOI] [PubMed] [Google Scholar]
- Klein JC, Rushworth MF, Behrens TE, Mackay CE, de Crespigny AJ, D'Arceuil H, Johansen-Berg H. Topography of connections between human prefrontal cortex and mediodorsal thalamus studied with diffusion tractography. Neuroimage. 2010;51:555–564. doi: 10.1016/j.neuroimage.2010.02.062. [DOI] [PMC free article] [PubMed] [Google Scholar]
- Koechlin E, Summerfield C. An information theoretical approach to prefrontal executive function. Trends Cogn Sci. 2007;11:229–235. doi: 10.1016/j.tics.2007.04.005. [DOI] [PubMed] [Google Scholar]
- Koechlin E, Summerfield C. The cognitive architecture of the human lateral prefrontal cortex. In: Haggard P, Rossetti Y, Kawato M, editors. Sensorimotor foundations of higher cognition: attention and performance. Attention and performance XXII. Oxford: Oxford UP; 2008. pp. 487–509. [Google Scholar]
- Koechlin E, Basso G, Pietrini P, Panzer S, Grafman J. The role of the anterior prefrontal cortex in human cognition. Nature. 1999;399:148–151. doi: 10.1038/20178. [DOI] [PubMed] [Google Scholar]
- Koechlin E, Ody C, Kouneiher F. The architecture of cognitive control in the human prefrontal cortex. Science. 2003;302:1181–1185. doi: 10.1126/science.1088545. [DOI] [PubMed] [Google Scholar]
- Kotz SA, Anwander A, Axer H, Knösche TR. Beyond cytoarchitectonics: the internal and external connectivity structure of the caudate nucleus. PLoS One. 2013;8:e70141. doi: 10.1371/journal.pone.0070141. [DOI] [PMC free article] [PubMed] [Google Scholar]
- Kouneiher F, Charron S, Koechlin E. Motivation and cognitive control in the human prefrontal cortex. Nat Neurosci. 2009;12:939–945. doi: 10.1038/nn.2321. [DOI] [PubMed] [Google Scholar]
- Koziol L, Budding D. Subcortical structures and cognition. New York: Springer; 2009. The Basal ganglia: beyond the motor system—from movement to thought; pp. 27–68. [Google Scholar]
- Krashen SD, Jones CM, Zelinski SJ, Usprich C. How important is instruction? ELT J. 1978;XXXII:257–261. doi: 10.1093/elt/XXXII.4.257. [DOI] [Google Scholar]
- Krause M, Mahant N, Kotschet K, Fung VS, Vagg D, Wong CH, Morris JG. Dysexecutive behaviour following deep brain lesions—a different type of disconnection syndrome? Cortex. 2012;48:97–119. doi: 10.1016/j.cortex.2011.03.014. [DOI] [PubMed] [Google Scholar]
- Landman BA, Bogovic JA, Carass A, Chen M, Roy S, Shiee N, Yang Z, Kishore B, Pham D, Bazin PL, Resnick SM, Prince JL. System for integrated neuroimaging analysis and processing of structure. Neuroinformatics. 2013;11:91–103. doi: 10.1007/s12021-012-9159-9. [DOI] [PMC free article] [PubMed] [Google Scholar]
- Langkammer C, Krebs N, Goessler W, Scheurer E, Ebner F, Yen K, Fazekas F, Ropele S. Quantitative MR imaging of brain iron: a postmortem validation study. Radiology. 2010;257:455–462. doi: 10.1148/radiol.10100495. [DOI] [PubMed] [Google Scholar]
- Llano DA. Functional imaging of the thalamus in language. Brain Lang. 2013;126:62–72. doi: 10.1016/j.bandl.2012.06.004. [DOI] [PMC free article] [PubMed] [Google Scholar]
- Lohmann G, Bohn S, Müller K, Trampel R, Turner R. Image restoration and spatial resolution in 7-tesla magnetic resonance imaging. Magn Reson Med. 2010;64:15–22. doi: 10.1002/mrm.22488. [DOI] [PubMed] [Google Scholar]
- Lucas BC, Bogovic JA, Carass A, Bazin PL, Prince JL, Pham DL, Landman BA. The Java Image Science Toolkit (JIST) for rapid prototyping and publishing of neuroimaging software. Neuroinformatics. 2010;8:5–17. doi: 10.1007/s12021-009-9061-2. [DOI] [PMC free article] [PubMed] [Google Scholar]
- Maldjian JA, Laurienti PJ, Kraft RA, Burdette JH. An automated method for neuroanatomic and cytoarchitectonic atlas-based interrogation of fMRI data sets. Neuroimage. 2003;19:1233–1239. doi: 10.1016/S1053-8119(03)00169-1. [DOI] [PubMed] [Google Scholar]
- Marques JP, Kober T, Krueger G, van der Zwaag W, Van de Moortele PF, Gruetter R. MP2RAGE, a self bias-field corrected sequence for improved segmentation and T1-mapping at high field. Neuroimage. 2010;49:1271–1281. doi: 10.1016/j.neuroimage.2009.10.002. [DOI] [PubMed] [Google Scholar]
- Masterman DL, Cummings JL. Frontal-subcortical circuits: the anatomic basis of executive, social and motivated behaviors. J Psychopharmacol. 1997;11:107–114. doi: 10.1177/026988119701100203. [DOI] [PubMed] [Google Scholar]
- McFarland NR, Haber SN. Thalamic relay nuclei of the basal ganglia form both reciprocal and nonreciprocal cortical connections, linking multiple frontal cortical areas. J Neurosci. 2002;22:8117–8132. doi: 10.1523/JNEUROSCI.22-18-08117.2002. [DOI] [PMC free article] [PubMed] [Google Scholar]
- Mestres-Missé A, Turner R, Friederici AD. An anterior-posterior gradient of cognitive control within the dorsomedial striatum. Neuroimage. 2012;62:41–47. doi: 10.1016/j.neuroimage.2012.05.021. [DOI] [PubMed] [Google Scholar]
- Morris DM, Embleton KV, Parker GJ. Probabilistic fibre tracking: differentiation of connections from chance events. Neuroimage. 2008;42:1329–1339. doi: 10.1016/j.neuroimage.2008.06.012. [DOI] [PubMed] [Google Scholar]
- Negyessy L, Goldman-Rakic PS. Morphometric characterization of synapses in the primate prefrontal cortex formed by afferents from the mediodorsal thalamic nucleus. Exp Brain Res. 2005;164:148–154. doi: 10.1007/s00221-005-2237-6. [DOI] [PubMed] [Google Scholar]
- Oldfield RC. The assessment and analysis of handedness: the Edinburgh inventory. Neuropsychologia. 1971;9:97–113. doi: 10.1016/0028-3932(71)90067-4. [DOI] [PubMed] [Google Scholar]
- Olman CA, Yacoub E. High-field FMRI for human applications: an overview of spatial resolution and signal specificity. Open Neuroimag J. 2011;5:74–89. doi: 10.2174/1874440001105010074. [DOI] [PMC free article] [PubMed] [Google Scholar]
- Robinson JL, Laird AR, Glahn DC, Blangero J, Sanghera MK, Pessoa L, Fox PM, Uecker A, Friehs G, Young KA, Griffin JL, Lovallo WR, Fox PT. The functional connectivity of the human caudate: an application of meta-analytic connectivity modeling with behavioral filtering. Neuroimage. 2012;60:117–129. doi: 10.1016/j.neuroimage.2011.12.010. [DOI] [PMC free article] [PubMed] [Google Scholar]
- Van der Werf YD, Scheltens P, Lindeboom J, Witter MP, Uylings HB, Jolles J. Deficits of memory, executive functioning and attention following infarction in the thalamus; a study of 22 cases with localised lesions. Neuropsychologia. 2003;41:1330–1344. doi: 10.1016/S0028-3932(03)00059-9. [DOI] [PubMed] [Google Scholar]
- Verstynen TD, Badre D, Jarbo K, Schneider W. Microstructural organizational patterns in the human corticostriatal system. J Neurophysiol. 2012;107:2984–2995. doi: 10.1152/jn.00995.2011. [DOI] [PMC free article] [PubMed] [Google Scholar]
- Watkins DS. Fundamentals of matrix computations. New York: Wiley; 2004. [Google Scholar]
- Yeterian EH, Pandya DN. Prefrontostriatal connections in relation to cortical architectonic organization in rhesus monkeys. J Comp Neurol. 1991;312:43–67. doi: 10.1002/cne.903120105. [DOI] [PubMed] [Google Scholar]
- Zhang D, Snyder AZ, Shimony JS, Fox MD, Raichle ME. Noninvasive functional and structural connectivity mapping of the human thalamocortical system. Cereb Cortex. 2010;20:1187–1194. doi: 10.1093/cercor/bhp182. [DOI] [PMC free article] [PubMed] [Google Scholar]
- Zikopoulos B, Barbas H. Circuits formultisensory integration and attentional modulation through the prefrontal cortex and the thalamic reticular nucleus in primates. Rev Neurosci. 2007;18:417–438. doi: 10.1515/revneuro.2007.18.6.417. [DOI] [PMC free article] [PubMed] [Google Scholar]