

Abstract
Brainstem catecholaminergic neurons play key roles in the autonomic, neuroendocrine, and behavioral responses to glucoprivation, yet the functions of the individual groups are not fully understood. Adrenergic C3 neurons project widely throughout the brain, including densely to sympathetic preganglionic neurons in the spinal cord, yet their function is completely unknown. Here we demonstrate in rats that optogenetic stimulation of C3 neurons induces sympathoexcitatory, cardiovasomotor functions. These neurons are activated by glucoprivation, but unlike the C1 cell group, not by hypotension. The cardiovascular activation induced by C3 neurons is less than that induced by optogenetic stimulation of C1 neurons; however, combined stimulation produces additive sympathoexcitatory and cardiovascular effects. The varicose axons of C3 neurons largely overlap with those of C1 neurons in the region of sympathetic preganglionic neurons in the spinal cord; however, regional differences point to effects on different sympathetic outflows. These studies definitively demonstrate the first known function of C3 neurons as unique cardiovasomotor stimulatory cells, embedded in the brainstem networks regulating cardiorespiratory activity and the response to glucoprivation.
Keywords: channelrhodopsin, glucoprivation, rostral ventrolateral medulla, sympathetic nervous system
Introduction
Multiple regulatory systems enable tight control of glucose homeostasis to ensure adequate provision for essential physiological functions (Verberne et al., 2014). In response to reduced glucose, autonomic, neuroendocrine, and behavioral systems are activated to mobilize energy stores and increase energy intake. These include activation of adrenal catecholamine secretion, via increased adrenal sympathetic nerve activity, to mobilize energy stores. Although the central pathways involved in this response are being elucidated and our understanding remains incomplete, an important role for hindbrain catecholaminergic neurons is clear. Studies over many years by Ritter and colleagues demonstrate the importance of catecholaminergic cell groups in the medulla oblongata in many responses to glucoprivation (Ritter et al., 2001, 2011; Bugarith et al., 2005; Li et al., 2009, 2011). Lesions of rostrally projecting, catecholamine-synthesizing neurons decrease the food intake response to glucoprivation, whereas lesions of the spinally projecting cells decrease adrenal medullary catecholamine secretion (Ritter et al., 2001; Bugarith et al., 2005; Li et al., 2011). Much of the focus resulting from these observations has centered on the role of adrenaline-synthesizing C1 neurons of the rostral ventrolateral medulla (RVLM), which are activated by glucoprivation (Ritter et al., 1998; Verberne and Sartor, 2010; Parker et al., 2013) and contribute to the excitation of adrenal sympathetic nerve activity.
Although the role of the C1 neurons is not disputed, the other medullary adrenaline-synthesizing cell groups, C2 and C3 neurons, are also activated by glucoprivation (Ritter et al., 1998). We recently mapped the distribution of projections from the dorsomedullary C3 cell group and showed that, like C1 neurons, C3 neurons project widely throughout the CNS, including to sympathetic preganglionic neurons (SPNs) of the spinal cord and hypothalamic and thalamic sites involved in homeostatic regulation of feeding (Sevigny et al., 2012). Similarly to C1 neurons, C3 neurons express the vesicular glutamate transporter 2 (VGluT2) (Stornetta et al., 2002), suggesting they are glutamatergic. VGlut2 and vesicular monoamine transporter 2 (VMAT2) immunoreactivity have been identified in C3 axon terminals in close apposition to SPNs within the thoracic intermediolateral cell column (IML), reinforcing their potential, yet undetermined, sympathoexcitatory function. Indeed, to date there is no described function for C3 neurons.
In this study, we characterize the projections of C3 subgroups and show that all groups are activated by glucoprivation, but not by hypotension. Using optogenetic stimulation, we demonstrate the first physiological function for C3 neurons as a sympathoexcitatory cell group. This function is compared with that of the more characterized C1 neuron group. Together, the data point to a role for C3 neurons as a new major component of the network responding to glucoprivation.
Materials and Methods
Animals.
All experiments were conducted in accordance with the Australian National Health and Medical Research Council “Code of Practice for the Care and Use of Animals for Scientific Purposes” and were approved by the University of Melbourne Animal Experimentation Ethics and Biosafety Committee or by the Animal Welfare Committee of Flinders University. All experiments were performed on male Sprague Dawley (SD) rats (n = 44, 250–400 g for anatomy, 100–150 g for electrophysiology). Animals were housed with a 12 h light:dark cycle at a constant temperature (22 ± 1°C) with ad libitum access to standard rat chow and water.
Induction of Fos immunoreactivity.
2-Deoxyglucose (2-DG) was used to induce neuroglucoprivation (Ritter et al., 1998). Pairs of rats were handled daily for 4–10 d before 2-DG or saline treatment. On the night before the experiment, the rats were deprived of food but had access to water ad libitum. The following morning, one rat received a subcutaneous injection of 2-DG (400 mg/kg in distilled water) and the other received distilled water. The rats were perfused with phosphate-buffered 4% formaldehyde 2 h after injection. 2-DG treatment does not affect blood pressure (Llewellyn-Smith et al., 2012).
Hydralazine (HDZ) treatment was used to lower blood pressure as described previously (Stornetta et al., 2001; Fenwick et al., 2006). Pairs of rats received either HDZ or saline. Baseline blood pressure was measured at 5 min intervals for 30 min, and then HDZ (10 mg/ml diluted in 2 mg/ml saline, H-1753, Sigma Chemical) or saline was infused over a 1–2 min period. Arterial pressure and heart rate (HR) were continuously recorded for 5 min from the commencement of the infusion and then at 10 min intervals until 120 min. Rats were deeply anesthetized and perfused immediately after the last blood pressure and HR measurements.
Surgical procedure for brainstem microinjections.
Thirty to 60 min before all surgeries, rats were injected with a nonsteroidal, anti-inflammatory agent (meloxicam, 1 mg/kg, s.c., Metacam, Boehringer Ingelheim). For all surgical procedures, rats were lightly anesthetized by inhalation of isoflurane (Rhodia Australia) before intramuscular injection of a mixture of ketamine (60 mg/kg, i.m.; Lyppard, Dingley) and medetomidine (250 μg/kg, i.m.; Pfizer Animal Health). Once a deep surgical level of anesthesia was obtained, as evidenced by loss of the pedal withdrawal and corneal reflexes, the rats were placed in a stereotaxic frame with the skull either angled downward (40°, lentiviral injections) or horizontal between lambda and bregma (fluorescent microsphere injections).
Injections of fluorescent microspheres.
Three animals received bilateral injections of fluorescent microspheres into both the pontine tegmental tract (green microspheres) and the IML of the third thoracic spinal segment (orange microspheres). Three animals received bilateral injections of green fluorescent microspheres into only the pontine tegmental tract, and three others received bilateral injections of orange microspheres into only the IML of T3. Three additional animals received unilateral injections into only the pontine tegmental tract (orange microspheres), and three others received unilateral injections into only the IML of T3.
For bilateral injections into the IML of T3, animals were placed in a stereotaxic frame as described above, and a midline incision was made along the upper thoracic spinal region. The brown adipose tissue was retracted, and the spinal process at T4 clamped and gently stretched to open the gap between vertebrae. Fluorescent orange-labeled microspheres (540 nm/560 nm excitation/emission wavelengths; Invitrogen; 10% in 0.9% sterile saline) were microinjected through a glass micropipette, which was placed 550 μm lateral to midline. Successive injections (∼50–80 nl each) were made from 0.3 to 1.2 mm below the surface of the cord at 0.3 mm intervals. Injections were also performed in the same pattern, 700 μm lateral to midline to label axons of passage in the lateral white matter. These injections were repeated on the opposite side; all tissue layers were sutured and the animals allowed to recover.
Rats for dual retrograde-labeling experiments also received injections of fluorescent green-labeled microspheres (505 nm/515 nm excitation/emission wavelengths; Invitrogen; 10% in 0.9% sterile saline) into the pontine tegmental tract at the same time as the spinal injections. A midline incision was made over the skull, and part of the skull was removed via trepination to allow access to the brain 2 mm anterior to the lambdoid suture and ∼3 mm on either side of the midline. After careful removal of the dura, microspheres were injected with a glass micropipette at coordinates encompassing the central, lateral, and ventral portions of the pontine tegmental tract, bilaterally. Injections of 50–80 nl were placed at 2 mm anterior to the lambdoid suture, and at the following coordinates bilaterally: 0.8 mm lateral (7 mm ventral to the cortical surface), 1.6 mm lateral (at 0.3 mm intervals between 7 and 5 mm ventral to the cortical surface), and 2.4 mm lateral (at 0.3 mm intervals between 6.5 and 5.5 mm ventral to the cortical surface). After all brain injections were completed, all wounds were closed with sterile sutures and rats revived via an intramuscular injection of atipamazole (1 mg/kg; Pfizer Animal Health).
Unilateral injections of orange-fluorescent microspheres into T3 (three animals) or the pontine tegmental tract (three animals) were performed using the methods described above. After all injections, animals were allowed to recover in their home cages for 7–10 d and then perfused under deep anesthesia in preparation for histology.
Microinjection of lentiviruses.
We used replication-deficient lentiviruses that are HIV-1-derived and pseudo-typed with the VSV-G envelope. A detailed description of the methods used to generate and characterize these viruses has been published previously (Chen et al., 2010). Transgene expression was under the control of a synthetic phox2-selective promoter (PRSx8) (Card et al., 2006, 2011; Abbott et al., 2009b, 2012, 2013; Kanbar et al., 2010; Bruinstroop et al., 2012; Sevigny et al., 2012; Tang et al., 2014). Three different viruses were used: (1) Lv-PRSx8-ChR2(E123T-H134R)-eYFP-WPRE to express mutant light-gated cation-selective channelrhodopsin-2 (ChR2) fused to the enhanced yellow fluorescent protein (YFP) in C3 and/or C1 neurons (6.1 × 10⁸ infectious units/ml); (2) Lv-PRSx8-eGFP to express the enhanced GFP in C1 neurons (8.3 × 10⁸ infectious units/ml); and (3) Lv-PRSx8-tdTomato to express the red fluorophore tdTomato in C3 neurons (4.6 × 10⁸ infectious units/ml).
For all lentiviral injections, 21-d-old rats were anesthetized and placed in a stereotaxic frame as described above. A midline incision was made over the occipital bone, portions of the bone overlying the cerebellum were removed with a dental drill, and the atlanto-occipital membrane was opened to expose the calamus scriptorius, which was used as a reference point for stereotaxic coordinates. Glass micropipettes (20–30 μm tip diameter) enabled the recording of antidromic field potentials that were elicited by stimulating the mandibular branch of the facial nerve and were used to map the caudal and ventral edges of the facial nucleus, allowing precise targeting of C1 neurons (Abbott et al., 2009a, 2009b). These pipettes, connected to a picospritzer (World Precision Instruments), were used to microinject lentiviruses (80 nl per injection site for ChR2 expression, 40 nl per injection site for GFP/tdTomato expression, over 5 min). Injections targeting C1 neurons were made unilaterally (right side), 1.5 mm lateral to the midline at the ventral edge of the facial field and 300 μm dorsal to this. These injections were made at three rostrocaudal levels separated by 300 μm, the most rostral being just rostral to the caudal end of the facial field potential. Injections to target C3 neurons were made in the midline, at five rostrocaudal levels separated by 250 μm. The most caudal C3 injection was made 100 μm rostral to the most rostral C1 injection. At each rostrocaudal site, three injections were made in the dorsoventral plane, each separated by 300 μm, and based upon the position of the facial field potential. The wound was closed with sterile sutures, and the animals revived via intramuscular injection of atipamazole (1 mg/kg, Pfizer Animal Health). Animals used for optogenetic experiments were allowed to recover for 10 d before electrophysiological recordings, whereas animals used for neuronal tracing studies were killed 6 weeks after injection to optimize fluorophore labeling of axonal projections.
Working heart–brainstem preparation (WHBP).
SD rats injected with Lv-PRSx8-ChR2-eYFP in C3 and C1 areas (n = 7), C3 only (n = 3), and C1 only (n = 3) were examined using the WHBP, which allows recordings of cardiorespiratory activity (Paton, 1996; Paton et al., 2006; Simms et al., 2009; Marina et al., 2011; McBryde et al., 2013). Ten days after the injection of viral vectors, SD rats were anesthetized deeply with isoflurane until loss of paw withdrawal reflex. Animals were bisected below the diaphragm, exsanguinated, cooled in Ringer's solution on ice (composition in mm as follows: 125 NaCl, 24 NaHCO3, 5 KCl, 2.5 CaCl2, 1.25 MgSO4, 1.25 KH2PO4, and 10 dextrose, pH 7.3, after saturation with carbogen gas, 5% CO2, 95% O2), and decerebrated precollicularly. All chemicals were purchased from Sigma-Aldrich. Lungs were removed, and the descending aorta was isolated and cleaned. Retrograde perfusion of the thorax and head was achieved via a double-lumen catheter (ø 1.25 mm, DLR-4, Braintree Scientific) inserted into the descending aorta. The perfusate was Ringer's solution containing Ficoll (1.25%) warmed to 31°C and gassed with carbogen. The second lumen of the cannula was connected to a transducer to monitor perfusion pressure (PP) in the aorta. Neuromuscular blockade was established using vecuronium bromide added to the perfusate (2–4 μg/ml, Organon Teknika). Simultaneous recordings of phrenic nerve activity (PNA), thoracic sympathetic nerve activity (tSNA), between T3 and T5, and vagus nerve activity were obtained using glass suction electrodes, amplified (10 kHz, Neurolog), filtered (50–1500 kHz, Neurolog), digitized (CED), and recorded to hard disk using Spike2 (CED). HR was derived by using a window discriminator to trigger from the R-wave of the electrocardiogram recorded simultaneously through the phrenic nerve suction electrode.
Optogenetic stimulation.
For the WHBP, ear and mouth bars were used to position the dorsal surface of the brainstem in a horizontal plane. Optical fibers (200 μm diameter; Doric Lenses) connected to a 473 nm DPSS Laser (Shanghai Laser & Optics Century) were inserted vertically (dorsal approach) to photostimulate C1 neurons (1.7 mm rostral, 1.6 mm lateral, −2.0 mm ventral to calamus scriptorius), and on a 40° angle to vertical (dorsal approach) to photostimulate C3 neurons (2.0 mm rostral to calamus scriptorius, midline, tip touching the dorsal surface of the brainstem). A light meter (PM20A fiber power meter, Thorlabs) was used to measure light intensity, which was set at 10 mW as this was found to induce maximal effects in our experimental setup without any adverse effect on the tissue. Photostimulation trials consisted of the following: (1) frequency-response photostimulations to determine maximal effect (5, 10, 20, and 50 Hz, 15 ms pulses, 600 pulses) (see Fig. 5); (2) maximal photostimulations (20 Hz, 15 ms pulses, 600 pulses); (3) low-frequency 1 Hz photostimulations (1 Hz, 15 ms pulses, 500 pulses); and (4) paired-pulse photostimulations (0.2 Hz, 15 ms pulses, 100 paired pulses, 300 ms or 1000 ms interval between paired pulses).
Figure 5.

Optogenetic stimulation of C3 and/or C1 neurons. A, Ten days after Lv-PRSx8-ChR2-YFP injection into the C3 area in rats, the effects of optogenetic stimulation of C3 neurons on HR, tSNA, PP, PNA, and vagus nerve activity (VNA; data not shown) were recorded in the WHBP. The tip of a 200-μm-diameter optical fiber was placed on the dorsal surface of the brainstem (40° angle to the vertical, facing ventrocaudally), on the midline just above C3 neurons (2 mm rostral to calamus scriptorius). Maximal photostimulation (20 Hz, 15 ms pulses, 600 pulses, 10 mW light intensity) of C3 neurons (laser ON, shaded block) caused an increase in HR, tSNA, PP, and PNA (inspiratory burst frequency) but did not affect VNA. Individual responses to C3 photostimulation, compared with baseline, are shown for tSNA (B), PP (C), HR (D), and PNA (E). F, Rate meter record showing a continuous 30 min recording of HR, tSNA, PP, and PNA with C3, C1, and simultaneous C1 + C3 maximal photostimulation. All C3 (black bars), C1 (white bars), and C1 + C3 (dashed bars) photostimulations significantly increased tSNA (G) and PP (H). C1 + C3 photostimulation produced a larger increase of both parameters than C3 photostimulation alone. I, Only C3 photostimulation significantly increased HR, although there was a tendency for an increase with C1 and C1 + C3 photostimulations. J, C3, C1, and C1 + C3 photostimulations all increased PNA. Histograms showing the tSNA (K) and PP (L) responses to 5, 10, 20, and 50 Hz C1 (white bars) and C3 (black bars) photostimulations (15 ms pulses, 600 pulses, 10 mW light intensity). The 20 and 50 Hz photostimulations produced larger increases in both tSNA and PP compared with 5 Hz photostimulation. Maximal photostimulation effect was reached at 20 Hz for both C1 and C3 photostimulations as 50 Hz photostimulation did not cause any further increase. Data are mean ± SEM. *p < 0.05, within-subject comparison. **p < 0.01, within-subject comparison. ***p < 0.001, within-subject comparison. #p < 0.05, between-group comparison. $p < 0.05, compared with 5 Hz photostimulation. n.s., Not significant.
Histology.
Standard perfusion and postfixation protocols were performed as previously published (Llewellyn-Smith et al., 2012; Sevigny et al., 2012). Following cryoprotection (20% sucrose in half-strength TBPS + 0.05% Thimerosal, pH 7.4), brains and spinal cord segments were cut coronally (30 μm sections for Fos studies, 40 μm sections otherwise) or horizontally (spinal cord segments for the dual-viral tracing study, 40 μm sections) using a cryostat. Immunohistochemistry protocols were performed as previously published for fluorescence immunohistochemistry (Chen et al., 2010; Sevigny et al., 2012) and for peroxidase immunohistochemistry (Llewellyn-Smith et al., 2005, 2013). The only exception was for immunohistochemistry done on tissue from animals injected with fluorescent microspheres, where Triton exposure was reduced to avoid disruption of the latex microspheres. In this case, only the initial blocking steps included 0.1% Triton and Triton was omitted from the primary antibody incubation. The primary antibodies used here were as follows: rabbit anti-TH (1:5000, Millipore Bioscience Research Reagents, AB152), sheep anti-TH (1:1000, Millipore Bioscience Research Reagents, AB1542), mouse anti-DβH (1:2500, Millipore Bioscience Research Reagents, MAB308), rabbit anti-VMAT2 (1:5000, Phoenix Laboratories, H-V004), sheep anti-neuropeptide Y (NPY) (1:2500, Millipore Bioscience Research Reagents, AB1583), chicken anti-GFP (1:5000, Abcam, AB13970), rabbit anti-DsRed (1:5000, Clontech Laboratories, catalog #632496), goat anti-ChAT (1:1000 for fluorescent immunohistochemistry, 1:5000 for peroxidase immunohistochemistry, Millipore Bioscience Research Reagents, AB144P), rabbit anti-phenylethanolamine N-methyltransferase (PNMT) (1:30,000, kind gift of Dr Luc Denoroy), and rabbit anti-Fos (1:5000, Santa Cruz Biotechnology, SC-253, lot F-131). The secondary antibodies for fluorescence immunohistochemistry, which were all obtained from Jackson ImmunoResearch Laboratories, except where noted, were Cy3-conjugated donkey anti-rabbit (1:500), Cy3-conjugated donkey anti-mouse (1:500), AlexaFluor-488 goat anti-rabbit (1:500, Invitrogen), AlexaFluor-488 goat anti-mouse (1:500, Invitrogen), AlexaFluor-488 goat anti-chicken (1:500, Invitrogen), AlexaFluor-488 donkey anti-chicken (1:500), Cy5-conjugated donkey anti-goat (1:500), and Cy5-conjugated donkey anti-rabbit (1:500). For immunohistochemical detection of TH fibers in the spinal cord, a rabbit anti-sheep biotinylated antibody was used (1:500, Vector Laboratories), followed by incubation with streptavidin-Cy5 antibody (1:1000). For peroxidase immunohistochemistry, biotinylated donkey anti-rabbit immunoglobulin or donkey anti-goat immunoglobulin (1:500) followed by ExtrAvidin-horseradish peroxidase conjugate (1:1500, Sigma) was used. For PNMT and ChAT double staining, a cobalt- and nickel-intensified DAB reaction stained PNMT-immunoreactive neurons black, and a Vector SG kit stained ChAT-immunoreactive neurons blue-gray. For Fos and PNMT double staining, a cobalt- and nickel-intensified DAB reaction stained Fos-immunoreactive neurons black, and an imidazole-intensified DAB reaction stained PNMT-immunoreactive neurons brown.
Bright-field, epifluorescence, and confocal microscopy.
An Olympus BH-2 bright-field microscope connected to a Spot RT color camera (Diagnostic Instruments) was used to capture images of neurons labeled with peroxidase immunohistochemistry. Neurons for the Fos study were counted in 1:4 series of 30 μm coronal sections. Neurons for anatomical characterization of C3 subgroups were counted in 1:6 series of 40 μm coronal sections.
An Axio Imager D.1 microscope connected to an AxioCam MRc5 digital camera (Zeiss) was used to capture images of neurons labeled for ChR2-eYFP immunoreactivity and TH immunoreactivity. Neurons were counted on one in six series of 40 μm coronal sections.
For the fluorescent microspheres study, sections containing TH immunoreactivity were initially viewed with a Zeiss LSM 510 META confocal microscope. Images were acquired with either a 40× IR-Achroplan (NA 0.80) water-immersion objective or a 100× IR-Achroplan (NA 1.25) oil-immersion objective. After confirmation with confocal microscopy that no TH-immunoreactive C3 neurons contained both fluorescent orange and fluorescent green microspheres, fluorescence microscopy was performed using an Axio Imager D.1 microscope connected to an AxioCam MRc5 digital camera (Zeiss) for observation of TH-immunoreactive C3 neurons containing either orange or green-fluorescent microspheres. For observation of orange fluorescent microspheres, a secondary antibody with green fluorophore (Alexa-488) was used to reveal TH immunoreactivity; and for observation of green fluorescent microspheres, a secondary antibody with red fluorophore (Cy3) was used to reveal TH immunoreactivity.
For comparison of axonal projections from C3 and C1 neurons to the IML, sections were viewed with a Zeiss LSM510 PASCAL confocal microscope. Sections labeled with AlexaFluor-488-, Cy3-, and Cy5-conjugated probes were excited at 488 nm (argon laser), 543 nm and 633 nm (helium neon laser), respectively. Images of SPN clusters were acquired with a 63× IR-Achroplan (NA 1.0) oil-immersion objective, in a Z-stack array, acquiring up to 8 consecutive overlapping slices. All channels were acquired at a consistent pinhole setting of 1.0 μm. Each optical section was assessed for close apposition between axons labeled with Cy3 (C3) or AlexaFluor-488 (C1) and ChAT-immunoreactive SPNs. Maximum intensity projections of 4–6 image stacks were produced using the software Zeiss Zen Imager to better represent the distribution of C3 and C1 labeling in the IML.
Adobe Photoshop was used to optimize brightness and contrast of the digital images.
Data analysis and statistics.
The physiological responses to stimulation of C1 and C3 neurons were obtained during maximal photostimulation, which was determined to be 20 Hz. The data were measured during the entire photostimulation period and are presented as variations in δ values compared with the prestimulus control period (90 s). The signals were rectified and integrated with a 50 ms time constant. For low-frequency photostimulation (1 Hz and paired-pulse protocols), the signals were rectified and integrated with a 5 ms time constant. Group data are presented as mean ± SEM. Paired Student's t tests were used to assess the specific effect of single cell group photostimulation; repeated-measures one-way ANOVA, followed by the Holm–Sidak post hoc multiple-comparison test, was used to compare the effects of photostimulation of the different cell groups (SigmaPlot 12). p < 0.05 represents statistically significant differences.
Results
Anatomical characterization of C3 neurons
Immunoreactivity for PNMT characterizes the adrenergic cell groups and reveals that C3 neurons are located in the dorsomedial medulla oblongata (Fig. 1A,B), extending rostrocaudally in adult SD rats (n = 3) for ∼1.7 mm. Counts taken from every sixth 40 μm section throughout the C3 nucleus reveal 257 ± 7 (n = 3) PNMT-immunoreactive neurons in the C3 nucleus. C3 neurons stretch from the caudal end of the fourth ventricle (bregma −13.44 mm) to the caudal-most portion of the dorsal cochlear nucleus and the rostral tip of raphe obscurus (bregma −11.76 mm).
Figure 1.

Organization of C3 neurons in the dorsal medulla. A, Photomicrograph showing the distribution of neurons immunoreactive for PNMT (black) or ChAT (blue-gray) in a coronal section through the rostral medulla oblongata rostral to the caudal end of the facial motor nucleus (FN). PNMT-immunoreactive C3 neurons are diffusely distributed in the rostral dorsomedial medulla oblongata. At this level, the rostral end of the C1 cell group is visible ventromedial to FN. B, Higher-magnification view of the dotted rectangle in A, which contains the C3 cell group. The lateral C3 neurons lie medial to ChAT-immunoreactive neurons in the dorsal motor nucleus of vagus (arrows in the enlarged area). C, The same section as in A with highlighting to delineate the different subgroups of C3, which are differentiated on the basis of the spatial organization of their somata. The same color coding is used in the bar histogram (D), which provides quantitative information about the rostrocaudal distribution of neurons that comprise the different C3 subgroups. Rostrocaudal levels are relative to bregma. Data are mean ± SEM (n = 3). 4V, Fourth ventricle. Scale bars, 500 μm.
Within this medullary region, C3 neurons can be grouped into four distinct subregions: the dorsal group (35.6 ± 1.2% of all C3 neurons), the median column (19.7 ± 1.2%), the medial columns (24.9 ± 0.9%, counted bilaterally), and the lateral groups (19.8 ± 1.3%, counted bilaterally) (Fig. 1C,D). The dorsal group consists of neurons located along the ventral surface of the fourth ventricle and extends throughout the entire rostrocaudal limits of the C3 nucleus, with the highest number of cells found at bregma −12.24 mm (Fig. 1C,D). The median column extends down the midline for ∼1.0–1.2 mm, with the ventral portions overlapping with raphe obscurus. This column also spans the full rostrocaudal extent of the C3 nucleus, with the highest number of neurons occurring at bregma −12.96 mm, ∼0.7 mm caudal to the highest concentration of the dorsal group neurons. The medial columns directly flank the median column. Although these two subgroups could potentially be combined into one “midline cluster,” the medial columns only occur in the most rostral portion of the C3 nucleus (bregma −12.72 to bregma −11.76 mm), with the caudal extent appearing just rostral to the peak of the median column neurons. The highest number of neurons appears at bregma −12.24 mm, coinciding with the highest concentration of dorsal group neurons. The final subgroup of C3 neurons, the lateral group, is anatomically isolated from the other C3 neurons, lying ∼1.5 mm lateral to the midline, just ventral to the nucleus of the solitary tract (Fig. 1B–D). Although these neurons are located closer to the C2 nucleus than the central portions of C3, their existence outside of the boundaries of the nucleus of the solitary tract, defined as being dorsal and lateral to the rostral-most dorsal vagal motor nucleus (Fig. 1B, inset), groups them into the C3 population. The lateral group is only apparent from bregma −12.48 to bregma −12.00 mm, with the peak density occurring rostrally (bregma −12.00 mm; Fig. 1D).
While defined by the expression of PNMT, C3 neurons are also dopamine β-hydroxylase (DβH)- and tyrosine hydroxylase (TH)-immunoreactive. A majority (89.4 ± 7.3%) of all DβH-immunoreactive C3 cell bodies were also VMAT2-immunoreactive (data not shown). There was no significant difference in the proportion of neurons immunoreactive for VMAT2 between individual C3 subgroups. We also tested immunoreactivity for NPY, a marker of catecholaminergic neurons involved in the glucoregulatory response (Bugarith et al., 2005; Li et al., 2009). Most C3 neurons were immunoreactive for NPY (92.6 ± 2.3%), with no significant variation between subgroups (data not shown).
Selective projection pattern of C3 subgroups
To characterize the projection patterns of the four subgroups of C3 neurons, injections of microspheres labeled with two different fluorophores were made either bilaterally (n = 3) or unilaterally (n = 3) into the pontine tegmental tract, or the IML at the third thoracic spinal segment. Injections into the pontine tegmental tract, designed to retrogradely label rostrally projecting C3 neurons, encompassed the lateral, central, and ventral portions of the tract 2 mm rostral to the lambdoid suture. Injections into the thoracic spinal cord encompassed the IML, as well as the dorsolateral portions of the white matter, to retrogradely label bulbospinal C3 neurons. Injection sites were confirmed via fluorescent microscopy (data not shown) and showed little variation between animals. No TH-immunoreactive neurons were observed to contain both retrograde tracers (Fig. 2A–D), suggesting that individual C3 neurons are unlikely to project to both rostral and spinal regions.
Figure 2.
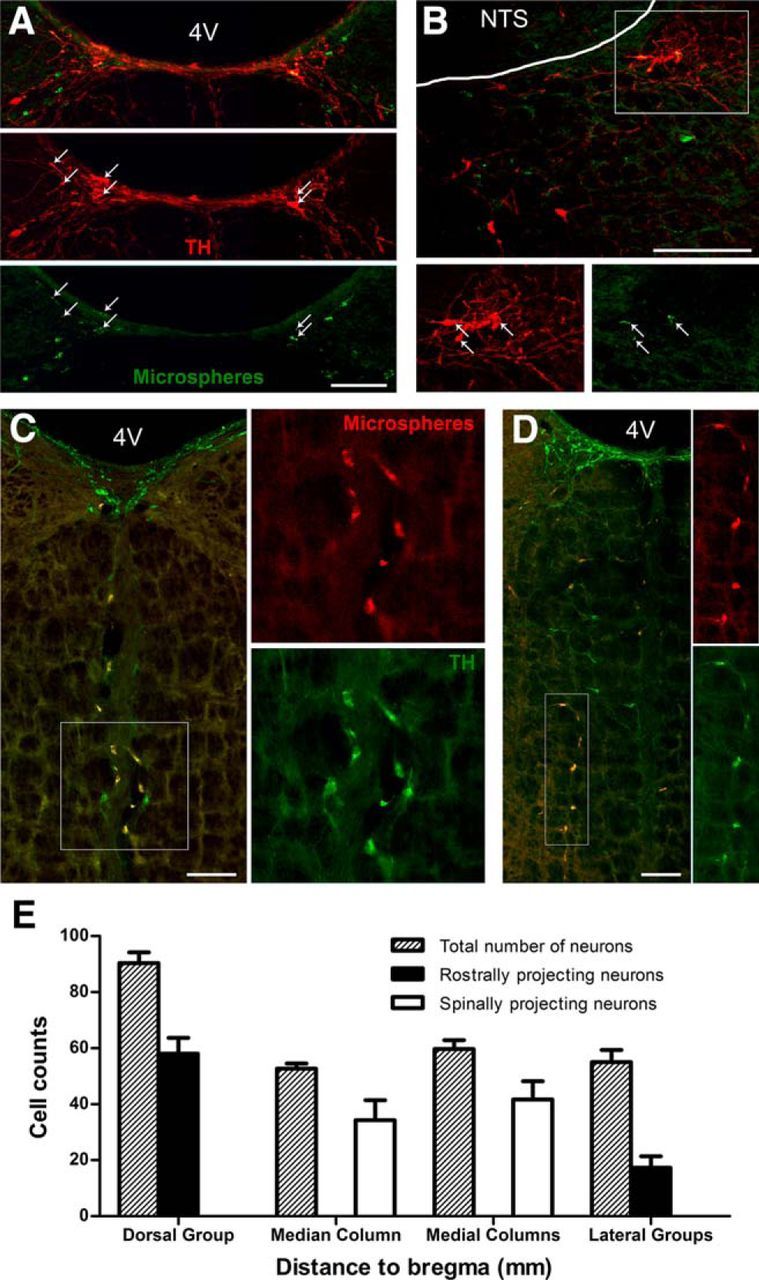
The dorsal and lateral C3 subgroups project rostrally; the median and medial C3 subgroups project caudally. Retrograde transport of green fluorescent microspheres injected into the pontine tegmental tract labels red TH-immunoreactive C3 neurons in the dorsal (A) and lateral (B) subgroups only. Merged images (top) and arrows indicate neurons containing both fluorescent microspheres and TH immunoreactivity. B, Bottom panels, Enlargement of the boxed area in the top panel. Orange fluorescent microspheres (red) injected into the IML at the third thoracic spinal segment label green TH-immunoreactive C3 neurons in the median (C) and medial (D) subgroups only. In the merged images (left panels), double-labeled neurons appear yellow. C, D, Right panels, Enlargement of the boxed area in the left panel. D, In this example, the TH-immunoreactive C3 neurons in the left medial column were retrogradely labeled from unilateral injections of orange fluorescent microspheres (red) in the right IML. E, Bar histogram showing average raw cell counts of total C3 neurons (dashed bars), rostrally projecting C3 neurons (black bars), and spinally projecting C3 neurons (white bars) in each of the four subgroups. Each bar represents mean cell counts throughout each subgroup ± SEM (n = 3). 4V, Fourth ventricle; NTS, nucleus of the tractus solitarius. Scale bars, 200 μm.
Rostrally projecting C3 neurons were located in the dorsal and lateral cell groups (64.4 ± 3.8% and 36.5 ± 7.6% of all dorsal and lateral group C3 neurons, respectively; Fig. 2A,B,E). There were no rostrally projecting TH-immunoreactive neurons within the median or medial columns. Conversely, all bulbospinal C3 neurons occurred in the median and medial columns. Of all TH-immunoreactive neurons in the median column and medial columns, 73.2 ± 6.2% and 69.7 ± 5.2%, respectively, were bulbospinal (Fig. 2C–E). Many neurons not immunoreactive for TH within the boundaries of all four C3 subregions were also observed to have spinally or rostrally projecting axons and did not obey the same exclusive projection patterns.
Unilateral injections of retrograde tracers were performed to determine the extent of lateralization for spinally or rostrally projecting C3 neurons in the medial columns and lateral groups. In the lateral groups, 54.3 ± 6.2% of rostrally projecting neurons projected contralaterally. In addition, 81.2 ± 5.4% of bulbospinal C3 neurons in the medial columns projected contralaterally (Fig. 2D). Because injections were unilateral, retrogradely labeled neurons located contralateral to the injection sites in either group could potentially project bilaterally.
Glucoprivation, but not hypotension, strongly activates C3 neurons
To determine whether C3 neurons are activated by sympathoexcitatory challenges, we treated rats with either the antimetabolic glucose analog 2-DG (400 mg/kg) to induce glucoprivation or the vasodilator HDZ (10 mg/kg) to induce hypotension, and counted Fos-immunoreactive nuclei in PNMT-immunoreactive C3 neurons.
Treatment with 2-DG induced Fos expression in ∼60% of C3 neurons (76.0 ± 6.1 PNMT + Fos vs 127.5 ± 4.5 PNMT-only immunoreactive neurons, n = 4), and these were located in all subgroups (Fig. 3A–D). Fos immunoreactivity was not observed in 2-DG-sham animals (0.8 ± 0.8 PNMT + Fos vs 219.5 ± 15.5 PNMT-only immunoreactive neurons, n = 4). Treatment with HDZ induced very little Fos expression in C3 neurons (Fig. 3G), with an average of 7% of C3 neurons showing Fos immunoreactivity (17.5 ± 3.3 PNMT + Fos vs 230.3 ± 12.3 PNMT-only immunoreactive neurons, n = 4). No Fos-immunoreactive neurons were observed in the HDZ-sham animals (1.5 ± 1.3 PNMT + Fos vs 208.3 ± 34.3 PNMT-only immunoreactive neurons, n = 4). By contrast, RVLM C1 neurons, present in the same brainstem sections as C3 neurons (Fig. 3E), showed strong Fos immunoreactivity in response to HDZ treatment (Fig. 3F,H).
Figure 3.
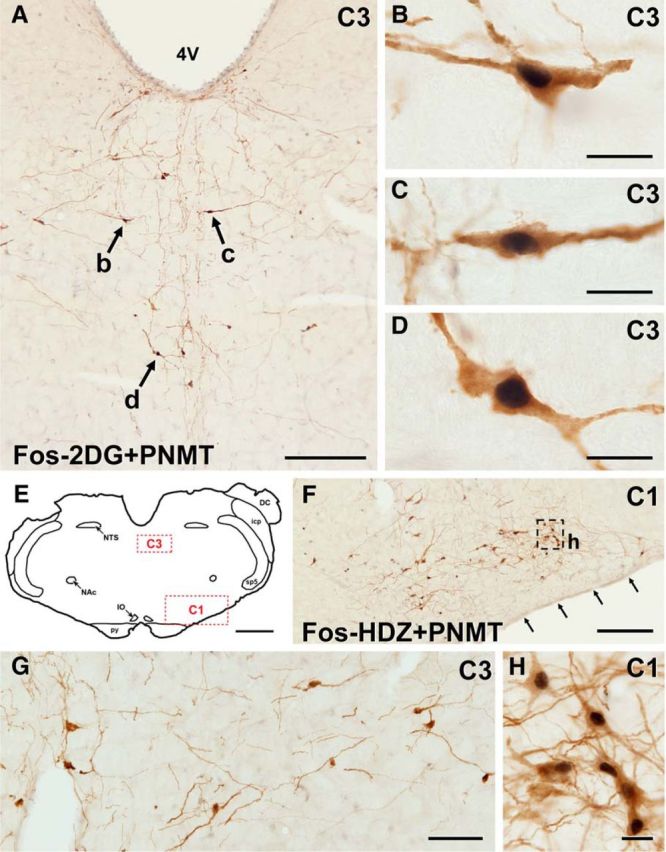
Many C3 neurons express Fos after 2-DG, but not after HDZ. Photomicrographs of coronal sections double-stained for PNMT (brown) and Fos (black). A, After 2-DG treatment, which induces glucoprivation, many C3 neurons in all subgroups show immunoreactivity for Fos. B–D, Higher-magnification images of the neurons indicated by arrows b–d in A. E, Diagram of the medulla oblongata with doted rectangles (red) showing the position of the enlargements in F (C1) and in G (C3). F, After HDZ treatment, which induces hypotension, many brown C1 neurons show black Fos immunoreactivity in their nuclei. Arrows indicate the ventral surface of the medulla oblongata. G, In contrast, in the same section, very few C3 neurons contain black, Fos-immunoreactive nuclei. H, Higher-magnification view of the dotted square in F, showing Fos-immunoreactive nuclei in PNMT-immunoreactive C1 neurons. 4V, Fourth ventricle; DC, dorsal cochlear nucleus; icp, inferior cerebellar peduncle; IO, inferior olive; NAc, compact formation of the nucleus ambiguous; py, pyramidal tract; Sp5, spinal trigeminal tract. Scale bars: A, F, 250 μm; B–D, H, 20 μm; E, 1 mm; G, 100 μm.
Optogenetic stimulation of C3 neurons reveals their sympathoexcitatory function
Because C3 neurons from the median and medial subgroups project to the IML and are activated by glucoprivation, we used optogenetic stimulation of C3 neurons to determine whether they modulate sympathetic activity. Twenty-one-day-old SD rats received microinjections of a lentiviral vector (Lv) expressing a point mutated (E123T-H134R) form of ChR2 fused to enhanced YFP, abbreviated to Lv-PRSx8-ChR2-YFP, into either the C3 region (n = 3), the C1 region (unilaterally, n = 3), or both the C3 and C1 regions (n = 7). After microinjection in the C3 region, expression was limited to the dorsal, median, and medial subgroups of C3 (Fig. 4A) and occurred in ∼50% of C3 neurons. A few non–TH-immunoreactive ChR2-positive neurons were also observed in some sections, in the midline ventral to the C3 subgroups, >1.5 mm ventral to the floor of the fourth ventricle at the level of the raphe obscurus.
Figure 4.

ChR2 expression in C3 and C1 neurons. Epifluorescence images of 40 μm coronal sections showing ChR2-YFP immunoreactivity (green) in TH-immunoreactive (red) neurons in C3 (A) and C1 (C, unilateral injection) cell groups, 10 d after Lv-PRSx8-ChR2-YFP injections. Note the high, but not absolute, specificity of the PRSx8 promoter in the merged images. B, D, Cell counts of total TH-immunoreactive cells (red), TH-immunoreactive and ChR2-YFP-immunoreactive cells (TH+ ChR2, green), and non–TH-immunoreactive ChR2-YFP-immunoreactive cells (TH− ChR2, blue) in both C3 and C1 areas of lentivirus injections. “0” in the x-axis indicates the caudal end of the facial nucleus. Data are mean ± SEM (n = 7). 4V, Fourth ventricle. Scale bars, 100 μm.
Ten days after lentivirus injections, we used the WHBP to investigate C3 function. Maximal (20 Hz, 15 ms pulses, 600 pulses, 10 mW light intensity; Fig. 5K,L) photostimulation of C3 neurons significantly increased tSNA (+0.29 ± 0.07 μV, p = 0.010; Fig. 5A,B), PP (+1.6 ± 0.3 mmHg, p = 0.002; Fig. 5A,C), HR (+4.7 ± 1.9 bpm, p = 0.048; Fig. 5A,D), and inspiratory phrenic nerve bursting frequency (PNA, +1.3 ± 0.2 bursts/min, p = 0.002; Fig. 5A,E). Photostimulation of C3 neurons produced the same effects in animals injected with Lv-PRSx8-ChR2-YFP only in the C3 region compared with animals injected in both the C3 and C1 regions. Photostimulation of the C3 region in animals injected only in the C1 region did not alter any measured parameters.
Comparison of the response to maximal photostimulation of C3 and C1 neurons
To determine the importance of C3 sympathoexcitatory function, we compared it with the effects produced by optogenetic stimulation of the C1 neurons. To transfect C1 neurons, we targeted the rostral part of the RVLM, caudal to the facial nucleus (Fig. 4C,D), which contains the bulk of spinally projecting C1 neurons (Jeske and McKenna, 1992). Expression of ChR2 in the C1 region extended from 0.5 mm rostral to 1 mm caudal to the caudal pole of the facial nucleus. Over this rostrocaudal region, ∼40% of C1 neurons expressed ChR2 (Fig. 4D). Similarly to C3, a proportion of non–TH-immunoreactive ChR2-positive neurons was also counted in the RVLM, mostly at the caudal and ventral edges of the facial nucleus, corresponding to retrotrapezoid nucleus Phox2b-positive cells (Abbott et al., 2012).
We compared the effects of maximal photostimulation of C1 neurons alone, C3 neurons alone, or C1 and C3 neurons together (C1 + C3) (Fig. 5F–L). The effect of different frequencies (5–50 Hz) of C1 and C3 photostimulation on tSNA and PP was compared, and maximal activation occurred at 20 Hz stimulation (Fig. 5K,L). Similarly to C3 photostimulation, C1 and C1 + C3 photostimulation significantly increased tSNA (+0.47 ± 0.10 and +0.66 ± 0.16 μV, p = 0.009 and p = 0.008, respectively; Fig. 5G), PP (+2.0 ± 0.4 and +2.3 ± 0.5 mmHg, p = 0.003 and p = 0.010, respectively; Fig. 5H), and PNA frequency (+2.2 ± 0.3 and +1.8 ± 0.7 bursts/min, p < 0.001 and p = 0.023, respectively; Fig. 5I). Contrary to C3 photostimulation, C1 and C1 + C3 photostimulation only caused a tendency to increase HR that did not reach significance (+4.2 ± 1.6 and +5.5 ± 3.5 bpm, p = 0.122 and p = 0.201, respectively; Fig. 5J). There was no significant difference between the effects produced by C1 and C3 photostimulation, although C1 tended to induce greater increases in tSNA, PP, and PNA frequency (p = 0.074, p = 0.081, and p = 0.304, respectively; Fig. 5G,H,J). C1 + C3 photostimulation induced greater increases in tSNA and PP compared with C3 photostimulation alone (p = 0.006 and p = 0.030, respectively; Fig. 5G,H), demonstrating a combinatorial sympathoexcitatory effect between C1 and C3 neurons. Vagus nerve activity was also recorded as a parasympathetic output, but neither C1, nor C3, nor C1 + C3 photostimulation had any effect on its discharge amplitude during either respiratory phase, whereas respiratory-related (inspiratory and postinspiratory) activities increased in frequency in pace with PNA (data not shown).
Different patterns of SNA activation by C3 and C1 neurons
To determine whether C3 neurons shared the same sympathoexcitatory properties as C1 neurons, 1 Hz photostimulation (15 ms pulses, 500 pulses, 10 mW light intensity) of C3 and C1 was performed. Pulse-triggered averages of tSNA revealed differences in the pattern of tSNA activation by C3 and C1 neurons (Fig. 6A–C). The latency to peak tSNA activation induced by C3 photostimulation was almost double that of C1 photostimulation (115 ± 4 vs 68 ± 4 ms, respectively, p < 0.001; Fig. 6A,B). These differences in latencies were not altered by dual C1 + C3 photostimulation, and the burst timing and shape differences enabled the segregation of burst peaks caused by photostimulation of either cell group (for examples of C1 + C3 low-frequency photostimulation traces, see Fig. 6D,F). C1 photostimulation produced larger bursts of tSNA compared with C3 photostimulation (6.73 ± 1.74 vs 4.48 ± 0.79 μV, respectively, p = 0.031; Fig. 6A,C), a difference also present in the respective tSNA peaks during C1 + C3 photostimulation (7.97 ± 2.73 vs 4.88 ± 1.23 μV, respectively; C1 and C3 peaks of tSNA activation, p = 0.043; Fig. 6A,C). Both C1 and C3 photostimulation-induced tSNA peaks were followed by long-lasting reductions in tSNA, with significantly greater reduction after C1 and C1 + C3 photostimulation compared with C3 photostimulation alone (15.4 ± 3.1%, 16.5 ± 3.2%, and 9.5 ± 1.5% compared with baseline, respectively; C1 vs C3, p = 0.020; C1 + C3 vs C3, p = 0.010; C1 vs C1 + C3, p = 0.572). The reduction in tSNA following C3 photostimulation was maximal 266 ± 4 ms after light onset, which was delayed compared with that following C1 photostimulation (240 ± 4 ms, p = 0.002) or C1 + C3 photostimulation (251 ± 6 ms, p = 0.049). Times to return to prestimulus SNA levels after C3, C1, or C1 + C3 photostimulation were not significantly different (448 ± 6, 440 ± 17, and 474 ± 19 ms, respectively).
Figure 6.

Low-frequency photostimulations reveal distinct patterns of SNA activation by C3 and C1 neurons. A, Laser pulse triggered averaging of tSNA after 1 Hz photostimulations (15 ms pulses, 500 pulses, 10 mW light intensity) of C1 (red trace) or C3 (blue trace) neurons in the same animals. On a few occasions, C1 photostimulation induced two tSNA peaks (inset from a different animal to the representative case shown in the main C1/C3 traces). B, The 1 Hz photostimulations revealed different latencies to the peak of tSNA activation by C1 (red bar) and C3 (blue bar) neurons. C, The peak of tSNA activation produced by C1 photostimulation was larger than that produced by C3 photostimulation, both with single C1 or C3 and dual C1 + C3 photostimulations (data normalized to C1-only photostimulation-induced tSNA peak as 100%). D, Paired-pulse photostimulations (0.2 Hz, 15 ms pulses, 100 paired-pulse stimulations, 10 mW light intensity) with a 300 ms interval of C3 (blue trace), C1 (red trace), and C1 + C3 (black trace) neurons. The second peak of tSNA activation occurs during the period of poststimulus SNA depression for all photostimulations. E, This led to a decrease in the amplitude of the second peak of tSNA activation caused by C1 photostimulation, but not C3 photostimulation, in both single and dual photostimulations. F, Paired-pulse photostimulations with a 1000 ms interval of C3, C1, and C1 + C3 neurons. With this interval, the second peak of tSNA activation occurs after the period of poststimulus SNA depression for all photostimulations. G, There was no difference between the amplitudes of the first and second peaks of tSNA activation in the 1000 ms paired-pulse protocol for all photostimulations. Data are mean ± SEM (n = 7). *p < 0.05, within-subject comparison. #p < 0.05, between-group comparison. ###p < 0.001, between-group comparison. S1, Photostimulation 1; S2, photostimulation 2.
This period of poststimulus SNA depression has been shown with C1 optogenetic stimulation to decrease the amplitude of a second evoked SNA activation (Abbott et al., 2009b). We used a paired-pulse protocol to determine whether this was also the case with C3 neurons. Interestingly, paired-pulse photostimulation (0.2 Hz, 15 ms pulses, 100 paired-pulse stimulations, 10 mW light intensity) with a 300 ms interval caused a tendency for an increase in the amplitude of the C3 photostimulation-induced second peak compared with the first peak (104% for C3 photostimulation, 108% for the C3 tSNA peak of C1 + C3 photostimulation, not significant; Fig. 6D,E). As described previously, there was a significant decrease in the amplitude of the C1 photostimulation-induced second peak compared with the first peak (91% for C1 photostimulation, 92% for the C1 tSNA peak of C1 + C3 photostimulation, p = 0.013 and 0.047, respectively). Paired-pulse photostimulation with a 1000 ms interval had no effect on peak tSNA activation amplitudes, although there was a tendency for larger second peaks for both C1 and C3 photostimulation-induced tSNA peaks during the C1 + C3 photostimulation protocol (Fig. 6F,G). Latencies between onset of stimulation and peak of tSNA activation were unaltered in the paired-pulse protocols.
Comparison of the distribution of varicose axons in the IML derived from C3 and C1 neurons
We sought to determine whether the different sympathoexcitatory characteristics of C3 and C1 neurons might be explained by a different projection pattern of these cells toward SPNs in the IML. In 21-d-old SD rats (n = 3), the lentiviral vector Lv-PRSx8-tdTomato was injected in the C3 region, and the lentiviral vector Lv-PRSx8-GFP was injected unilaterally in the C1 region. Six weeks after injections, tdTomato and GFP soma expression profiles were similar to that of ChR2 for the respective nuclei, with 60 ± 8% of C3 neurons expressing tdTomato, 53 ± 10% of C1 neurons expressing GFP, and a small proportion of non–TH-immunoreactive neurons expressing fluorophores in both nuclei. Overall, an equal number of C3 and C1 neurons were labeled with fluorophores (61 ± 5 vs 65 ± 2 neurons, for C3 and C1, respectively, counted at 240 μm coronal intervals).
Horizontal and coronal sections of the T1-T5 spinal segments were used to compare the distribution of varicose axons within the IML derived from C3 and C1 neurons. Sections colabeled for TH, tdTomato, and GFP immunoreactivity showed that all C3 axons to the spinal cord were TH-immunoreactive, and the majority (>80%) of C1 axons were TH-immunoreactive (data not shown). This latter variation in TH immunoreactivity in C1 terminals correlates with the proportion of C1 somata in the RVLM that are immunoreactive for TH. Another set of sections was colabeled for tdTomato, GFP, and ChAT immunoreactivity, to colabel C3 and C1 projections with the SPNs of the IML. C3 and C1 projections were found throughout the IML at all T1-T5 levels, with similar overall patterns of SPN innervation. Both C3 and C1 fibers crossed the spinal cord midline dorsal of the central canal and innervated the IML bilaterally, with denser C1 innervation on the ipsilateral side to C1 virus injection. All further analysis examined the IML ipsilateral to C1 viral injections.
C1 projections to ChAT-immunoreactive IML neurons were more dense than C3 projections (Fig. 7A–C). The C1 varicose axons tended to have dense clusters of terminals (Fig. 7D), whereas those from C3 neurons were less clustered with apparently greater distance between boutons (Fig. 7E). There was no obvious difference in the distribution of C3 and C1 varicose axons apposed to ChAT-immunoreactive IML neurons (Fig. 7A), although there were differences in their proportions (Figs. 7B–E and 8A–F). In horizontal sections, whereas all ChAT-immunoreactive IML clusters received both C3 and C1 axons, substantial variations in proportions of C3/C1 axons were also present as shown in adjacent clusters of ChAT-immunoreactive IML in Figure 7B. C1 neurons tended to innervate the more lateral ChAT-immunoreactive IML neurons (Fig. 7A,C,D), whereas C3 neurons made frequent presumptive contacts with the more medial ChAT-immunoreactive IML neurons (Fig. 7C,E). These more medial ChAT-immunoreactive IML neurons very rarely received C1 innervation. We also found that the more ventral horizontal sections receive predominantly C1 inputs with few, if any, C3 varicose axon, and inversely in the more dorsal horizontal sections. This was further represented in coronal sections, where C3 neurons predominated in the dorsal part of the IML, whereas C1 neurons predominated in the ventral part of the IML (Fig. 8A–F).
Figure 7.
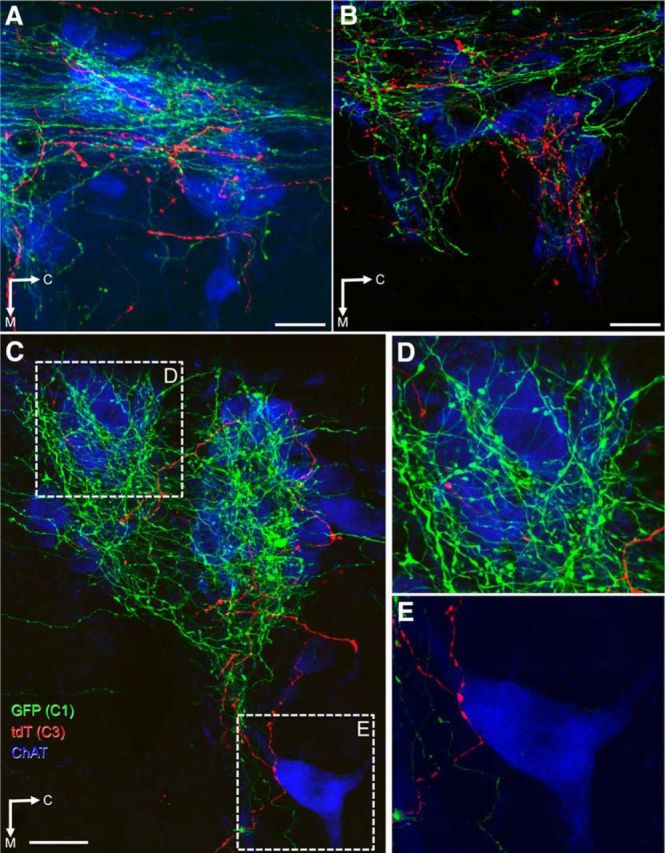
Axonal varicosities in the IML derived from C3 and C1 neurons. Confocal images of 40 μm horizontal sections between T1–3 triple labeled for GFP (C1 projections, green), tdTomato (C3 projections, red), and ChAT (SPNs of the IML, blue) immunoreactivity. A, Varicose axons from C3 and C1 neurons occur widely throughout the IML closely apposed to SPN. B, Differences in the proportions of C3 and C1 varicose axons occur within different regions of the IML, as shown here in adjacent clusters of ChAT-immunoreactive IML neurons (mostly GFP-immunoreactive C1 fibers in the rostral cluster, mostly tdTomato-immunoreactive C3 fibers in the caudal cluster). C, Lower-magnification photomicrograph showing the IML with extensive C1 projections and less C3 projections, which were typical. D, Enlargement of the corresponding dotted square in C showing cells in the lateral edge of the IML receiving extensive C1 projections but very sparse C3 projections. E, Enlargement of the corresponding dotted square in C showing a medial ChAT-immunoreactive neuron receiving C3 projection but no C1 projection. C, Caudal; M, medial; tdT, tdTomato. Scale bars, 25 μm.
Figure 8.

Dorsoventral proportion differences in C3 and C1 projections toward the IML. Confocal images of 40 μm coronal sections between T3–5 triple labeled for GFP (C1 projections, green), tdTomato (C3 projections, red), and ChAT (SPNs of the IML, blue) immunoreactivity. A, D, Pseudocolored photomicrographs showing immunoreactivity for tdTomato (C3) and GFP (C1) projection fibers in the IML. Inverted grayscale photomicrographs of individual C3 fibers (B, E) or C1 fibers (C, F) on ChAT-immunoreactive IML neurons show that the core of the IML receives a similar distribution of C3 and C1 projections; however, there is a dorsal–ventral difference with a predominance of C3 axons dorsally (arrows) and C1 axons ventrally (arrowheads). D, Dorsal; M, medial; tdT, tdTomato. Scale bars, 25 μm.
Discussion
This study provides the first defined function for catecholaminergic C3 neurons and shows that they form part of the circuitry activated in response to glucoprivation. These adrenergic neurons, one of only three groups in the CNS possessing this neurochemical phenotype, project widely throughout the CNS (Sevigny et al., 2012). Our detailed anatomical characterization divides the C3 neurons into four subgroups based on the spatial organization of cell bodies. These subgroups have exclusive projection patterns, the dorsal and lateral subgroups only projecting rostrally, the medial and median subgroups only projecting caudally. All C3 subgroups were strongly activated by glucoprivation, but not by hypotension. This selectivity of physiological responsiveness provides a contrast to the C1 neurons that are activated by both stimuli.
Using optogenetic stimulation in the WHBP of the rat, we demonstrate that C3 neurons elicit sympathoexcitation with an increase in PP, HR, and respiratory frequency. The sympathoexcitatory effects during sustained photostimulation are similar to those obtained with C1 photostimulation, whereas dual photostimulation (C1 + C3) showed an additive effect. However, low-frequency photostimulations show that, compared with C1 neurons, C3 neurons induce delayed, less pronounced sympathoexcitation that is less sensitive to poststimulus depression. Using dual-viral labeling, we show that C3 and C1 projections toward SPNs of the thoracic IML share similarities, but with variations in the respective proportions of these projections to specific areas of the IML that might contribute to the different functional responses to stimulation of C3 versus C1 neurons.
Like the C1 and C2 adrenergic groups, C3 neurons express NPY, VGluT2, and VMAT2 (Stornetta, 2009). But whereas C1 and C2 neuronal groups are anatomically confined, C3 neurons are sparsely distributed over a long rostrocaudal and mediolateral area. An exception to this is the dorsal subgroup whose neurons occur in a compact distribution. The small number and sparse distribution of C3 neurons make it difficult to activate them with traditional chemical or electrical stimulation, and this probably accounts for the complete lack of knowledge about the function of these neurons (Stornetta, 2009). Using the unprecedented spatial and temporal resolution provided by viral-mediated expression of ChR2 (Boyden et al., 2005; Zhang et al., 2010; Yizhar et al., 2011), we revealed the sympathoexcitatory function of C3 neurons. Thus, our observations define another group of glutamatergic, sympathoexcitatory neurons that, like C1 neurons, express catecholamine-synthesizing enzymes.
C1 neurons are activated by multiple stimuli, including glucoprivation and hypotension. By contrast, the C3 neurons are robustly activated by glucoprivation and not by hypotension. This highlights a selective functional involvement of C3 neurons as opposed to the involvement of C1 neurons in a broad range of activities (Abbott et al., 2009b, 2012, 2013; Chen et al., 2010, 2012; Serrats et al., 2010; Marina et al., 2011; Ritter et al., 2011; Guyenet et al., 2013). Also, it is unlikely that C3 neurons participate in the generation of basal sympathetic tone as their destruction, concomitantly with that of C1 neurons, does not affect resting SNA (Schreihofer et al., 2000).
The dense projections of C3 neurons throughout the neuraxis, including to the mediodorsal and paraventricular nuclei of the thalamus as well as many hypothalamic regions (Sevigny et al., 2012), suggest a widespread influence. We can now conclude that these thalamic and hypothalamic projections arise from C3 neurons in the dorsal and lateral subgroups. By contrast, the dense projections to the spinal cord arise from the median and medial subgroups. These conclusions are supported by the findings of Ritter et al. (2001) who showed that microinjection of the catecholaminergic-cell specific toxin anti-dopamine β-hydroxylase-saporin (anti-DβH-sap) in the hypothalamus killed, among other catecholaminergic cell groups, the dorsal C3 neurons, whereas its injection in the spinal cord (T2-T4) killed the medial and median C3 neurons.
We used the PRSx8 promoter to drive transgene expression (Hwang et al., 2001). This promoter, a multimer of the phox2 binding domain, is widely used to target catecholaminergic cells (Card et al., 2006, 2011; Sevigny et al., 2008, 2012; Abbott et al., 2009b, 2012, 2013; Kanbar et al., 2010; Bruinstroop et al., 2012). However, there are also phox2-expressing cells that are not catecholaminergic (Kang et al., 2007; Card et al., 2010). Based upon the following information, we are confident the sympathetic responses to photostimulation of the C3 and C1 regions are from C3 and C1 neurons, respectively. The non–TH-immunoreactive neurons labeled from C3 injections were outside the boundaries of the C3 group, in the midline ventral to the C3 cells. Consequently, they are situated >1.5 mm away from the tip of the optical probe, and we calculated that they would receive <10% of the light power (Yizhar et al., 2011) (i.e., 3 mW in our experimental conditions), which we found was not sufficient to produce any alterations of the parameters recorded. Furthermore, all axon varicosities in the IML that were labeled from viral injections in the C3 region expressed TH, indicating that the non–TH-immunoreactive neurons are not spinally projecting and unlikely to influence sympathetic activity within the millisecond timeframe observed in our recordings. Within the C1 region, we obtained similar levels of ChR2 expression in C1 neurons as in previously published C1 optogenetic studies (Abbott et al., 2009a, 2012). Similarly to C3 neurons, ChR2 expression in the RVLM was predominantly in TH-immunoreactive C1 cells, although some non–TH-immunoreactive neurons also expressed ChR2. These cells belong to the retrotrapezoid nucleus (Abbott et al., 2012) and do not alter SNA or blood pressure when optogenetically stimulated (Abbott et al., 2009a). After Lv-PRSx8-GFP expression in the RVLM, the majority of GFP-labeled terminals in the IML also contained TH immunoreactivity, although there was not complete overlap. TH immunoreactivity in catecholaminergic neurons can vary greatly in intensity (Benno et al., 1982; Mezey, 1989), as commonly observed in C1 soma and axons (Phillips et al., 2001), and we conclude that immunoreactivity in terminals varies similarly so that, in some neurons, it is below the level of detectability.
We compared the C3-mediated sympathoexcitation with C1-mediated responses in the same animals. C1 optogenetic or pharmacogenetic stimulations induce large increases in SNA and blood pressure in vivo both in conscious and anesthetized animals (Abbott et al., 2009b; Chen et al., 2010; Kanbar et al., 2010). Here, we confirm the sympathoexcitatory function of C1 neurons in the in situ WHBP. The amplitude of the increase in sympathetic activity and PP induced by 40 s of 20 Hz maximal photostimulation of C1 neurons tended to be larger than that of C3 neurons stimulation. However, although C1 stimulation activates parasympathetic preganglionic neurons in the dorsal motor nucleus of the vagus (DePuy et al., 2013), we found no vagal activation after stimulation of either C3 or C1 neurons.
When performing low-frequency 1 Hz photostimulation, C1 neurons induced significantly larger tSNA activation than C3 neurons. As reported previously (Abbott et al., 2009b), paired-pulse stimulation of C1 neurons shows reduced second pulse-induced SNA amplitude due to a period of poststimulus SNA depression induced by the first pulse. Therefore, the effect of C1 activation on tSNA is reduced during high-frequency stimulation (e.g., 20 Hz). Stimulation of C3 neurons induced less pronounced poststimulus depression in tSNA with no alteration in the size of the second tSNA response during paired pulse stimulation. This difference in poststimulus depression can account for the relatively larger tSNA activation induced by high-frequency maximal stimulation of C3 neurons compared with C1 neurons.
Dual C1 + C3 photostimulation, at maximal frequencies, produced additive increases in tSNA and PP compared with C3 photostimulation alone. This might be partially explained by the temporal difference in sympathoexcitation by these two groups as shown by the 1 Hz photostimulation. We also considered that this additive response might reflect a difference in class of postganglionic neurons activated by C3 and C1 neurons. SPNs are electrophysiologically heterogeneous; in particular, only some SPNs display prolonged after-hyperpolarizing currents (Yoshimura et al., 1986; Sah and McLachlan, 1995), which are thought to cause the poststimulus depression after C1 stimulation. Using dual-viral tracing experiments, we observed that the broad distribution of C3 and C1 neurons inputs to the IML is similar. However, there were relative differences in innervation within IML, with a relative predominance of varicose C3 axons in the dorsal and medial IML, and varicose C1 axons in the ventral and lateral IML. The thoracic IML contains ∼90% of all SPNs (Yip et al., 2000), and although the experimental data remain sparse, there is evidence for target-specific organization of subnuclei (Baron et al., 1985; Appel and Elde, 1988; Pyner and Coote, 1994; Gonsalvez et al., 2010). The most comprehensive of these studies indicates that adrenal medullary SPNs are situated in a ventral–lateral column, whereas those projecting to the superior cervical ganglion are in a dorsal–medial column; those projecting to the stellate ganglion are in between (Pyner and Coote, 1994). More medial SPNs, including those in the central canal, tend to project to visceral targets (Baron et al., 1985). CART-positive neurons, which are putative vasomotor SPNs, are located medially in the IML and not in the central canal (Gonsalvez et al., 2010). Based upon this overall distribution, we conclude that these relative differences in projection patterns of C3 and C1 neurons, potentially to different classes of SPN, might contribute to the different tSNA responses after activation.
These anatomical and functional characteristics of C3 neurons, which are similar to but distinct from C1 neurons, suggest that this cell group has a unique role in cardiovasomotor regulation. Most C3 neurons are activated by glucoprivation, which, combined with their widespread projections, suggests a global role in regulation of autonomic, neuroendocrine, and behavioral functions associated with glucose homeostasis. Understanding the functional role of C3 neurons clearly requires further investigation, but we have definitively demonstrated their first known function, sympathoexcitation.
Footnotes
This work was supported by Australian National Health and Medical Research Council Project Grants 1029396 and 1025031 and Australian Research Council Discovery Project Grant DP1094301. C.M. is supported by a McKenzie Fellowship from the University of Melbourne. We thank Lee Travis for expert technical assistance.
The authors declare no competing financial interests.
References
- Abbott SB, Stornetta RL, Fortuna MG, Depuy SD, West GH, Harris TE, Guyenet PG. Photostimulation of retrotrapezoid nucleus phox2b-expressing neurons in vivo produces long-lasting activation of breathing in rats. J Neurosci. 2009a;29:5806–5819. doi: 10.1523/JNEUROSCI.1106-09.2009. [DOI] [PMC free article] [PubMed] [Google Scholar]
- Abbott SB, Stornetta RL, Socolovsky CS, West GH, Guyenet PG. Photostimulation of channelrhodopsin-2 expressing ventrolateral medullary neurons increases sympathetic nerve activity and blood pressure in rats. J Physiol. 2009b;587:5613–5631. doi: 10.1113/jphysiol.2009.177535. [DOI] [PMC free article] [PubMed] [Google Scholar]
- Abbott SB, Coates MB, Stornetta RL, Guyenet PG. Optogenetic stimulation of c1 and retrotrapezoid nucleus neurons causes sleep state-dependent cardiorespiratory stimulation and arousal in rats. Hypertension. 2013;61:835–841. doi: 10.1161/HYPERTENSIONAHA.111.00860. [DOI] [PMC free article] [PubMed] [Google Scholar]
- Abbott SB, Kanbar R, Bochorishvili G, Coates MB, Stornetta RL, Guyenet PG. C1 neurons excite locus coeruleus and A5 noradrenergic neurons along with sympathetic outflow in rats. J Physiol. 2012;590:2897–2915. doi: 10.1113/jphysiol.2012.232157. [DOI] [PMC free article] [PubMed] [Google Scholar]
- Appel NM, Elde RP. The intermediolateral cell column of the thoracic spinal cord is comprised of target-specific subnuclei: evidence from retrograde transport studies and immunohistochemistry. J Neurosci. 1988;8:1767–1775. doi: 10.1523/JNEUROSCI.08-05-01767.1988. [DOI] [PMC free article] [PubMed] [Google Scholar]
- Baron R, Janig W, McLachlan EM. The afferent and sympathetic components of the lumbar spinal outflow to the colon and pelvic organs in the cat: III. The colonic nerves, incorporating an analysis of all components of the lumbar prevertebral outflow. J Comp Neurol. 1985;238:158–168. doi: 10.1002/cne.902380204. [DOI] [PubMed] [Google Scholar]
- Benno RH, Tucker LW, Joh TH, Reis DJ. Quantitative immunocytochemistry of tyrosine hydroxylase in rat brain: II. Variations in the amount of tyrosine hydroxylase among individual neurons of the locus coeruleus in relationship to neuronal morphology and topography. Brain Res. 1982;246:237–247. doi: 10.1016/0006-8993(82)91171-4. [DOI] [PubMed] [Google Scholar]
- Boyden ES, Zhang F, Bamberg E, Nagel G, Deisseroth K. Millisecond-timescale, genetically targeted optical control of neural activity. Nat Neurosci. 2005;8:1263–1268. doi: 10.1038/nn1525. [DOI] [PubMed] [Google Scholar]
- Bruinstroop E, Cano G, Vanderhorst VG, Cavalcante JC, Wirth J, Sena-Esteves M, Saper CB. Spinal projections of the A5, A6 (locus coeruleus), and A7 noradrenergic cell groups in rats. J Comp Neurol. 2012;520:1985–2001. doi: 10.1002/cne.23024. [DOI] [PMC free article] [PubMed] [Google Scholar]
- Bugarith K, Dinh TT, Li AJ, Speth RC, Ritter S. Basomedial hypothalamic injections of neuropeptide Y conjugated to saporin selectively disrupt hypothalamic controls of food intake. Endocrinology. 2005;146:1179–1191. doi: 10.1210/en.2004-1166. [DOI] [PubMed] [Google Scholar]
- Card JP, Sved JC, Craig B, Raizada M, Vazquez J, Sved AF. Efferent projections of rat rostroventrolateral medulla C1 catecholamine neurons: implications for the central control of cardiovascular regulation. J Comp Neurol. 2006;499:840–859. doi: 10.1002/cne.21140. [DOI] [PubMed] [Google Scholar]
- Card JP, Lois J, Sved AF. Distribution and phenotype of Phox2a-containing neurons in the adult Sprague-Dawley rat. J Comp Neurol. 2010;518:2202–2220. doi: 10.1002/cne.22327. [DOI] [PubMed] [Google Scholar]
- Card JP, Kobiler O, McCambridge J, Ebdlahad S, Shan Z, Raizada MK, Sved AF, Enquist LW. Microdissection of neural networks by conditional reporter expression from a Brainbow herpesvirus. Proc Natl Acad Sci U S A. 2011;108:3377–3382. doi: 10.1073/pnas.1015033108. [DOI] [PMC free article] [PubMed] [Google Scholar]
- Chen D, Bassi JK, Walther T, Thomas WG, Allen AM. Expression of angiotensin type 1A receptors in C1 neurons restores the sympathoexcitation to angiotensin in the rostral ventrolateral medulla of angiotensin type 1A knockout mice. Hypertension. 2010;56:143–150. doi: 10.1161/HYPERTENSIONAHA.110.151704. [DOI] [PubMed] [Google Scholar]
- Chen D, Jancovski N, Bassi JK, Nguyen-Huu TP, Choong YT, Palma-Rigo K, Davern PJ, Gurley SB, Thomas WG, Head GA, Allen AM. Angiotensin type 1A receptors in C1 neurons of the rostral ventrolateral medulla modulate the pressor response to aversive stress. J Neurosci. 2012;32:2051–2061. doi: 10.1523/JNEUROSCI.5360-11.2012. [DOI] [PMC free article] [PubMed] [Google Scholar]
- DePuy SD, Stornetta RL, Bochorishvili G, Deisseroth K, Witten I, Coates M, Guyenet PG. Glutamatergic neurotransmission between the C1 neurons and the parasympathetic preganglionic neurons of the dorsal motor nucleus of the vagus. J Neurosci. 2013;33:1486–1497. doi: 10.1523/JNEUROSCI.4269-12.2013. [DOI] [PMC free article] [PubMed] [Google Scholar]
- Fenwick NM, Martin CL, Llewellyn-Smith IJ. Immunoreactivity for cocaine- and amphetamine-regulated transcript in rat sympathetic preganglionic neurons projecting to sympathetic ganglia and the adrenal medulla. J Comp Neurol. 2006;495:422–433. doi: 10.1002/cne.20870. [DOI] [PubMed] [Google Scholar]
- Gonsalvez DG, Kerman IA, McAllen RM, Anderson CR. Chemical coding for cardiovascular sympathetic preganglionic neurons in rats. J Neurosci. 2010;30:11781–11791. doi: 10.1523/JNEUROSCI.0796-10.2010. [DOI] [PMC free article] [PubMed] [Google Scholar]
- Guyenet PG, Stornetta RL, Bochorishvili G, Depuy SD, Burke PG, Abbott SB. C1 neurons: the body's EMTs. Am J Physiol Regul Integr Comp Physiol. 2013;305:R187–R204. doi: 10.1152/ajpregu.00054.2013. [DOI] [PMC free article] [PubMed] [Google Scholar]
- Hwang DY, Carlezon WA, Jr, Isacson O, Kim KS. A high-efficiency synthetic promoter that drives transgene expression selectively in noradrenergic neurons. Hum Gene Ther. 2001;12:1731–1740. doi: 10.1089/104303401750476230. [DOI] [PubMed] [Google Scholar]
- Jeske I, McKenna KE. Quantitative analysis of bulbospinal projections from the rostral ventrolateral medulla: contribution of C1-adrenergic and nonadrenergic neurons. J Comp Neurol. 1992;324:1–13. doi: 10.1002/cne.903240102. [DOI] [PubMed] [Google Scholar]
- Kanbar R, Stornetta RL, Cash DR, Lewis SJ, Guyenet PG. Photostimulation of Phox2b medullary neurons activates cardiorespiratory function in conscious rats. Am J Respir Crit Care Med. 2010;182:1184–1194. doi: 10.1164/rccm.201001-0047OC. [DOI] [PMC free article] [PubMed] [Google Scholar]
- Kang BJ, Chang DA, Mackay DD, West GH, Moreira TS, Takakura AC, Gwilt JM, Guyenet PG, Stornetta RL. Central nervous system distribution of the transcription factor Phox2b in the adult rat. J Comp Neurol. 2007;503:627–641. doi: 10.1002/cne.21409. [DOI] [PubMed] [Google Scholar]
- Li AJ, Wang Q, Dinh TT, Ritter S. Simultaneous silencing of Npy and Dbh expression in hindbrain A1/C1 catecholamine cells suppresses glucoprivic feeding. J Neurosci. 2009;29:280–287. doi: 10.1523/JNEUROSCI.4267-08.2009. [DOI] [PMC free article] [PubMed] [Google Scholar]
- Li AJ, Wang Q, Ritter S. Participation of hindbrain AMP-activated protein kinase in glucoprivic feeding. Diabetes. 2011;60:436–442. doi: 10.2337/db10-0352. [DOI] [PMC free article] [PubMed] [Google Scholar]
- Llewellyn-Smith IJ, Dicarlo SE, Collins HL, Keast JR. Enkephalin-immunoreactive interneurons extensively innervate sympathetic preganglionic neurons regulating the pelvic viscera. J Comp Neurol. 2005;488:278–289. doi: 10.1002/cne.20552. [DOI] [PubMed] [Google Scholar]
- Llewellyn-Smith IJ, Kellett DO, Jordan D, Browning KN, Travagli RA. Oxytocin-immunoreactive innervation of identified neurons in the rat dorsal vagal complex. Neurogastroenterol Motil. 2012;24:e136–e146. doi: 10.1111/j.1365-2982.2011.01851.x. [DOI] [PMC free article] [PubMed] [Google Scholar]
- Llewellyn-Smith IJ, Gnanamanickam GJ, Reimann F, Gribble FM, Trapp S. Preproglucagon (PPG) neurons innervate neurochemically identified autonomic neurons in the mouse brainstem. Neuroscience. 2013;229:130–143. doi: 10.1016/j.neuroscience.2012.09.071. [DOI] [PMC free article] [PubMed] [Google Scholar]
- Marina N, Abdala AP, Korsak A, Simms AE, Allen AM, Paton JF, Gourine AV. Control of sympathetic vasomotor tone by catecholaminergic C1 neurones of the rostral ventrolateral medulla oblongata. Cardiovasc Res. 2011;91:703–710. doi: 10.1093/cvr/cvr128. [DOI] [PMC free article] [PubMed] [Google Scholar]
- McBryde FD, Abdala AP, Hendy EB, Pijacka W, Marvar P, Moraes DJ, Sobotka PA, Paton JF. The carotid body as a putative therapeutic target for the treatment of neurogenic hypertension. Nat Commun. 2013;4:2395. doi: 10.1038/ncomms3395. [DOI] [PubMed] [Google Scholar]
- Mezey E. Phenylethanolamine N-methyltransferase-containing neurons in the limbic system of the young rat. Proc Natl Acad Sci U S A. 1989;86:347–351. doi: 10.1073/pnas.86.1.347. [DOI] [PMC free article] [PubMed] [Google Scholar]
- Parker LM, Kumar NN, Lonergan T, McMullan S, Goodchild AK. Distribution and neurochemical characterization of neurons in the rat ventrolateral medulla activated by glucoprivation. Brain Struct Funct. 2013 doi: 10.1007/s00429-013-0642-3. doi: 10.1007/s00429-013-0642-3. Advance online publication. Retrieved Oct. 8, 2013. [DOI] [PubMed] [Google Scholar]
- Paton JF. The ventral medullary respiratory network of the mature mouse studied in a working heart-brainstem preparation. J Physiol. 1996;493:819–831. doi: 10.1113/jphysiol.1996.sp021425. [DOI] [PMC free article] [PubMed] [Google Scholar]
- Paton JF, Abdala AP, Koizumi H, Smith JC, St-John WM. Respiratory rhythm generation during gasping depends on persistent sodium current. Nat Neurosci. 2006;9:311–313. doi: 10.1038/nn1650. [DOI] [PubMed] [Google Scholar]
- Phillips JK, Goodchild AK, Dubey R, Sesiashvili E, Takeda M, Chalmers J, Pilowsky PM, Lipski J. Differential expression of catecholamine biosynthetic enzymes in the rat ventrolateral medulla. J Comp Neurol. 2001;432:20–34. doi: 10.1002/cne.1086. [DOI] [PubMed] [Google Scholar]
- Pyner S, Coote JH. Evidence that sympathetic preganglionic neurones are arranged in target-specific columns in the thoracic spinal cord of the rat. J Comp Neurol. 1994;342:15–22. doi: 10.1002/cne.903420103. [DOI] [PubMed] [Google Scholar]
- Ritter S, Llewellyn-Smith I, Dinh TT. Subgroups of hindbrain catecholamine neurons are selectively activated by 2-deoxy-d-glucose induced metabolic challenge. Brain Res. 1998;805:41–54. doi: 10.1016/S0006-8993(98)00655-6. [DOI] [PubMed] [Google Scholar]
- Ritter S, Bugarith K, Dinh TT. Immunotoxic destruction of distinct catecholamine subgroups produces selective impairment of glucoregulatory responses and neuronal activation. J Comp Neurol. 2001;432:197–216. doi: 10.1002/cne.1097. [DOI] [PubMed] [Google Scholar]
- Ritter S, Li AJ, Wang Q, Dinh TT. Minireview. The value of looking backward: the essential role of the hindbrain in counterregulatory responses to glucose deficit. Endocrinology. 2011;152:4019–4032. doi: 10.1210/en.2010-1458. [DOI] [PMC free article] [PubMed] [Google Scholar]
- Sah P, McLachlan EM. Membrane properties and synaptic potentials in rat sympathetic preganglionic neurons studied in horizontal spinal cord slices in vitro. J Auton Nerv Syst. 1995;53:1–15. doi: 10.1016/0165-1838(94)00161-C. [DOI] [PubMed] [Google Scholar]
- Schreihofer AM, Stornetta RL, Guyenet PG. Regulation of sympathetic tone and arterial pressure by rostral ventrolateral medulla after depletion of C1 cells in rat. J Physiol. 2000;529:221–236. doi: 10.1111/j.1469-7793.2000.00221.x. [DOI] [PMC free article] [PubMed] [Google Scholar]
- Serrats J, Schiltz JC, García-Bueno B, van Rooijen N, Reyes TM, Sawchenko PE. Dual roles for perivascular macrophages in immune-to-brain signaling. Neuron. 2010;65:94–106. doi: 10.1016/j.neuron.2009.11.032. [DOI] [PMC free article] [PubMed] [Google Scholar]
- Sevigny CP, Bassi J, Teschemacher AG, Kim KS, Williams DA, Anderson CR, Allen AM. C1 neurons in the rat rostral ventrolateral medulla differentially express vesicular monoamine transporter 2 in soma and axonal compartments. Eur J Neurosci. 2008;28:1536–1544. doi: 10.1111/j.1460-9568.2008.06445.x. [DOI] [PubMed] [Google Scholar]
- Sevigny CP, Bassi J, Williams DA, Anderson CR, Thomas WG, Allen AM. Efferent projections of C3 adrenergic neurons in the rat central nervous system. J Comp Neurol. 2012;520:2352–2368. doi: 10.1002/cne.23041. [DOI] [PubMed] [Google Scholar]
- Simms AE, Paton JF, Pickering AE, Allen AM. Amplified respiratory-sympathetic coupling in the spontaneously hypertensive rat: does it contribute to hypertension? J Physiol. 2009;587:597–610. doi: 10.1113/jphysiol.2008.165902. [DOI] [PMC free article] [PubMed] [Google Scholar]
- Stornetta RL. Neurochemistry of bulbospinal presympathetic neurons of the medulla oblongata. J Chem Neuroanat. 2009;38:222–230. doi: 10.1016/j.jchemneu.2009.07.005. [DOI] [PMC free article] [PubMed] [Google Scholar]
- Stornetta RL, Schreihofer AM, Pelaez NM, Sevigny CP, Guyenet PG. Preproenkephalin mRNA is expressed by C1 and non-C1 barosensitive bulbospinal neurons in the rostral ventrolateral medulla of the rat. J Comp Neurol. 2001;435:111–126. doi: 10.1002/cne.1196. [DOI] [PubMed] [Google Scholar]
- Stornetta RL, Sevigny CP, Guyenet PG. Vesicular glutamate transporter DNPI/VGLUT2 mRNA is present in C1 and several other groups of brainstem catecholaminergic neurons. J Comp Neurol. 2002;444:191–206. doi: 10.1002/cne.10141. [DOI] [PubMed] [Google Scholar]
- Tang F, Lane S, Korsak A, Paton JF, Gourine AV, Kasparov S, Teschemacher AG. Lactate-mediated glia-neuronal signalling in the mammalian brain. Nat Commun. 2014;5:3284. doi: 10.1038/ncomms4284. [DOI] [PMC free article] [PubMed] [Google Scholar]
- Verberne AJ, Sartor DM. Rostroventrolateral medullary neurons modulate glucose homeostasis in the rat. Am J Physiol Endocrinol Metab. 2010;299:E802–E807. doi: 10.1152/ajpendo.00466.2010. [DOI] [PubMed] [Google Scholar]
- Verberne AJ, Sabetghadam A, Korim WS. Neural pathways that control the glucose counterregulatory response. Front Neurosci. 2014;8:38. doi: 10.3389/fnins.2014.00038. [DOI] [PMC free article] [PubMed] [Google Scholar]
- Yip JW, Yip YP, Nakajima K, Capriotti C. Reelin controls position of autonomic neurons in the spinal cord. Proc Natl Acad Sci U S A. 2000;97:8612–8616. doi: 10.1073/pnas.150040497. [DOI] [PMC free article] [PubMed] [Google Scholar]
- Yizhar O, Fenno LE, Davidson TJ, Mogri M, Deisseroth K. Optogenetics in neural systems. Neuron. 2011;71:9–34. doi: 10.1016/j.neuron.2011.06.004. [DOI] [PubMed] [Google Scholar]
- Yoshimura M, Polosa C, Nishi S. Afterhyperpolarization mechanisms in cat sympathetic preganglionic neuron in vitro. J Neurophysiol. 1986;55:1234–1246. doi: 10.1152/jn.1986.55.6.1234. [DOI] [PubMed] [Google Scholar]
- Zhang F, Gradinaru V, Adamantidis AR, Durand R, Airan RD, de Lecea L, Deisseroth K. Optogenetic interrogation of neural circuits: technology for probing mammalian brain structures. Nat Protoc. 2010;5:439–456. doi: 10.1038/nprot.2009.226. [DOI] [PMC free article] [PubMed] [Google Scholar]