

Abstract
The role of synaptopodin (SP), an actin-binding protein residing in dendritic spines, in synaptic plasticity was studied in dissociated cultures of hippocampus taken from control and SP knock-out (SPKO) mice. Unlike controls, SPKO cultures were unable to express changes in network activity or morphological plasticity after intense activation of their NMDA receptors. SPKO neurons were transfected with SP-GFP, such that the only SP resident in these neurons is the fluorescent species. The localization and intensity of the transfected SP were similar to that of the native one. Because less than half of the spines in the transfected neurons contained SP, comparisons were made between SP-containing (SP(+)) and SP lacking (SP(−)) spines in the same dendritic segments. Synaptic plasticity was induced either in the entire network by facilitation of the activation of the NMDA receptor, or specifically by local flash photolysis of caged glutamate. After activation, spines that were endowed with SP puncta were much more likely to expand than SP(−) spines. The spine expansion was suppressed by thapsigargin, which disables calcium stores. The mechanism through which SP may promote plasticity is indicated by the observations that STIM-1, the sensor of calcium concentration in stores, and Orai-1, the calcium-induced calcium entry channel, are colocalized with SP, in the same dendritic spines. The structural basis of SP is likely to be the spine apparatus, found in control but not in SPKO cells. These results indicate that SP has an essential, calcium store-related role in regulating synaptic plasticity in cultured hippocampal neurons.
Keywords: calcium stores, dendritic spine, morphological plasticity, Orai1, STIM1, synaptopodin
Introduction
Synaptopodin (SP) is localized at a strategic position in necks of dendritic spines of mature cortical and hippocampal neurons, in physical association with the enigmatic spine apparatus (Mundel et al., 1997, Deller et al., 2000, Segal et al., 2010). Recent studies have assigned a role for SP in synaptic plasticity (Okubo-Suzuki et al., 2008, Vlachos et al., 2009) and assumed that it links morphological changes in actin cytoskeleton with functional synaptic changes generated in response to plasticity-producing stimulation. Earlier studies conducted with SP-knock-out mice (SPKO) (Deller et al., 2003) found that the spine apparatus is missing in the spines of cortical and hippocampal neurons and that slices taken from these SP−/− mice are deficient in ability to generate LTP and in some cognitive tasks, making these studies the first to associate the spine apparatus with functional neuronal plasticity. Later studies revealed that only some types of LTP-generating protocols are sensitive to the absence of SP (Jedlicka et al., 2009) and that LTP is deficient in young but not adult SP−/− mice, a somewhat puzzling observation, in view of the fact that the spine apparatus is present in adult neurons (Zhang et al., 2013). Concerning the role of SP in individual spine plasticity, it has been shown that overexpression of (transfected) SP maintains the activity-dependent spine enlargement (Okubo-Suzuki et al., 2008) and that SP-positive spines are more amenable to plastic changes, which are associated with activation of calcium stores (Vlachos et al., 2009, Harris, 1999). Two recent studies examined the morphological changes that spines undergo in SPKO mice neurons. In one, done in acute slices, the exposure to NMDA produced a slow, 25–30 min increase in spine volume, which was not seen in SPKO slices (Zhang et al., 2013). In the other, using SPKO mice expressing GFP-tagged SP, an SP-associated change in mEPSCs after denervation of the dentate granular cells was found (Vlachos et al., 2013). In neither of these studies was there a specific search for SP-dependent individual spine changes. In the present study, we took advantage of dissociated cultures generated from the hippocampus of SPKO mice. We transfected neurons in these cultures with SP-GFP, such that the only SP puncta present in these neurons are the ones linked to GFP. Because not all spines were endowed with SP puncta, we could compare adjacent, SP(+) and SP(−) spines in the same neuron. We report that the presence of SP facilitates the expansion of spines after two types of plasticity-producing stimulation and that this effect is mediated by release of calcium from stores.
Materials and Methods
Cultures.
Animal handling was done in accordance with the guidelines published by the Institutional Animal Care and Use Committee of the Weizmann Institute and with the Israeli National Guidelines on Animal Care. Mice were obtained from a colony at the University of Freiburg (Deller et al., 2003), bred and raised at a local animal facility. Heterozygous animals were intercrossed to generate homozygous mice. Genotyping was performed by PCR, and the line was maintained in a 129/C57BL6 mixed genetic background. Cultures were prepared as detailed previously (Ivenshitz and Segal, 2006): Individual mouse pups were decapitated on day of birth (P0), their brains removed, the hippocampi were dissected free and placed in a chilled (4°C), oxygenated Leibovitz L15 medium (Invitrogen) enriched with 0.6% glucose and gentamicin (Sigma, 20 μg/ml). One pair of hippocampi taken from one mouse was sufficient to prepare 4–6 wells in a 24 well plate. Approximately 105 cells in 1 ml medium were plated in each well, onto a hippocampal glial feeder layer, which was grown on 12 mm round glass coverslips for 2 weeks before plating of the neurons. The remainders of the pups were used for genotyping of the dissected mice. Only cultures taken from mice that had been positively identified as SP−/− by PCR were used for the transfection experiments. However, comparisons were also made in parallel studies between cultures taken from SPKO mice and control wild-type (WT) littermate pups.
Transfection.
SP-short subcloned into pEGFP-C1 (BD Biosciences, Clontech) (Asanuma et al., 2005, 2006) was used. For morphological analysis, a DsRed plasmid was cotransfected with the SP construct using Lipofectamine 2000, at the age of 6–7 d in vitro (DIV). Cotransfected cells displayed no apparent differences in morphology, spine density, and survival compared with GFP-only transfected cells. Cells were left to grow in the incubator at 37°C, 5% CO2 and were used for imaging at 14–21 DIV.
Imaging.
Cultures were placed in the imaging chamber, controlled by an automated X-Y stage (Luigs and Neumann). Neurons were imaged thereafter on the stage of an upright Zeiss PASCAL confocal microscope using an Olympus 63× water-immersion objective (0.9 NA) and 2–4× scan zoom. Standard recording medium contained (in mm) the following: 129 NaCl, 4 KCl, 1 MgCl2, 2 CaCl2, 10 glucose, 10 HEPES, pH adjusted to 7.4 with NaOH, and osmolarity to 310 mOsm with sucrose. Chemical LTP (cLTP) was induced using the standard medium, which contained 3 mm CaCl2, 0 m MgCl2, 100 μm glycine, and 13 mm KCl. Cultures were exposed to this conditioning medium for 3–5 min, followed by wash with the standard recording medium.
Flash photolysis of caged molecules was described previously (Korkotian et al., 2004). Briefly, a UV laser (New Wave, air-cooled ND:YAG), emitting 355 nm, 4 ns light pulses, was focused through the objective lens (63×, 0.9 NA Olympus, water-immersion) into a spot of <1 μm2. The UV spot was localized using a parallel red laser light. UV pulses at 1 Hz could be applied repeatedly without noticeable tissue damage. Caged glutamate (MNI-caged glutamate, Tocris Bioscience, 0.2–0.5 mm; thapsigargin, 1 μm, Alomone Labs) was aliquoted and kept frozen at −80°C until use. Fluo-4AM (2 μm, Invitrogen) was incubated for 1 h at room temperature to image [Ca2+]i variations resulting from network activity. Alternatively, K+Fluo-4 solution was injected into neurons with sharp micropipettes and allowed to diffuse for 1–2 h before imaging. In the experiments with flash photolysis of caged glutamate, TTX (0.5 μm) was added to the recording medium, and MgCl2 concentration was reduced to 0 mm.
Electrophysiology.
Cultures were placed in the recording chamber, controlled by an automated X-Y stage (Luigs and Neumann) in standard recording medium (above). Neurons were recorded with a patch pipette containing K-gluconate (140 mm), NaCl (2 mm), HEPES (10 mm), Na-GTP (0.3 mm), Mg-ATP (2 mm), phosphocreatine (10 mm), pH 7.4, having a resistance of 4–8 mΩ. Signals were amplified with Multiclamp 700B (Molecular Devices), accumulated and analyzed with PClamp9 and Minianalysis software. mEPSCs were recorded in presence of TTX (0.5 μm) and bicuculline (10 μm). Data were analyzed off-line using pCLAMP software (Molecular Devices) (Vlachos et al., 2009).
Immunostaining.
Cover glasses bearing transfected primary hippocampal cells were washed briefly with standard extracellular solution. Cultures were then fixed with 4% PFA and 4% sucrose in 0.1 m PBS, pH 7.4, for 20 min, and washed with PBS thoroughly. Cultures were incubated for 1 h with 10% normal goat serum in 0.1% Triton X-100 containing PBS and subsequently incubated for 24 h at 4°C in rabbit anti-SP antibody (SE-19, Sigma; 1:1000, 10% BSA, 0.1% Triton X-100 in PBS), rabbit anti-STIM1, or goat Orai1 (Santa Cruz Biotechnology, 1:200), or mouse anti-synaptophysin antibody (1:1000 Millipore Bioscience Research Reagents). Cultures were incubated for 1 h with Alexa-568-labeled or Alexa-633-labeled goat anti-rabbit or anti-mouse secondary antibody (Invitrogen; 1:200, 10% BSA, 0.1% Triton X-100). Coverslips were washed again, transferred onto glass slides, and mounted for visualization with antifading mounting medium. In all cases, secondary and tertiary dendritic segments were visualized.
For electron microscopy, the cultures were fixed in 1% glutaraldehyde and 4% PFA in 0.12 m phosphate buffer, pH 7.2–7.4. After washing in phosphate buffer, the cultures were osmicated for 1 h in 1% osmium tetroxide, washed again, and dehydrated in an ascending series of ethanol. They were then poststained in 1% uranyl acetate in 70% ethanol overnight. This was followed by 80% ethanol, 90% ethanol, 2 × 100% ethanol, and finally propylene oxide. The tissue was embedded in Durcupan (Fluka) and polymerized at 60°C for 3 d. Thin sections were cut using a Leica EM UC6 (Leica) and viewed in a LEO EM 906E electron microscope.
Confocal image stacks were exported as 2D projections from the Zeiss LSM image browser, and 3D surface rendered images were generated with Imaris software (Bitplane). The size of the dendritic spine head was calculated from these 2D images. Measurements were made in a blind procedure by one or two independent observers to assure unbiased observations. Spines were categorized into “large mushroom” if their heads were >1 μm in diameter and larger than the spine neck. Small mushrooms had smaller heads and shorter necks, whereas stubby spines lacked distinct neck. In some experiments, the “small” and “large” mushroom spine groups were merged (see below, e.g., see Figs. 7 and 8). Figures were prepared using Photoshop CS2 graphics software (Adobe). Fluorescent intensity was calculated using the MATLAB-based linescan acquisition program. Dendritic spines that were used for flash photolysis of caged calcium were identified in the immunostained neurons and analyzed independently of the measurements of calcium transients in these same spines. Statistical comparisons were made with t tests or ANOVA, as the case may be, using MATLAB, KaleidaGraph, and Origin software.
Figure 7.
Thapsigargin eliminates the spine/dendrite disparity in SP(+) spines. A, Sample illustration of a dendritic segment endowed with several spines containing SP in their necks. Line scans running from right to left illustrate the responses of the spine/dendrite compartment to flash photolysis of caged glutamate, before (top) and after exposure to thapsigargin, in the same spine. B, Averaged calcium transients in spine (red) and parent dendrite (gray) compartments (from left to right) in control SP(+) spines, after exposure to thapsigargin, in control SP(−), and after exposure to the drug. Only the SP(+) spines demonstrated spine/neck disparity that was eliminated by the drug. C, Comparisons among all of SP(+) spines, before and after thapsigargin, in the spine compartment (left) and the dendritic compartment (right) (n = 41). There was a significant effect of thapsigargin in the dendritic compartment and even a larger reduction in calcium responses in the spine compartment. D, Individual changes in spine/dendrite disparity before and after exposure to thapsigargin. Averages of the changes in the entire group are presented by thick green and blue lines, in the SP(+) and SP(−) groups of spines, respectively.
Figure 8.

Distribution of STIM1 in wt and SPKO cells. Cells were transfected with DsRed for imaging their morphology (image represented by the red silhouette) and immunostained for SP (green) and STIM1 (blue). A, wt culture. B, SPKO culture. No staining for SP was detected in the SPKO culture. In dendritic spines of the wt culture (19 cells imaged, 29 fields of view), there was a clear colocalization of SP with STIM1 (C) such that spines having SP also expressed STIM1, and vice versa. This was even more conspicuous when the mushroom spines were evaluated alone (D) in the same cohort of dendritic segments. In the SPKO culture (B, D (right)), the majority of spines had no STIM1 puncta, whereas the dendritic compartment had similar STIM1 distribution as the wt cultures.
Results
Comparing WT and SPKO cells
Recording and imaging were made from 2- to 3-week-old neurons taken from 4–6 different dissections. In all, comparisons were made between cells in sister cultures taken from SPKO and WT pups of the same litter. There were no apparent differences between neurons from SPKO mice and WT controls, in cell density and neuron size (data not shown), passive and active properties (Fig. 1A,B), action potential discharges (Fig. 1C), and spontaneous excitatory synaptic currents (Fig. 1D–F). There were SP-immunostained puncta in dendrites and spines of the WT neurons, and they were conspicuously absent in the SP-KO cultures (Fig. 2A).
Figure 1.

Comparisons of electrophysiological properties between WT and SPKO cells in culture. Two types of experiments were conducted, including current-clamped (A–C) and voltage-clamped (D–F) SPKO and WT neurons. In the first series of experiments, cells were current-clamped at their resting potential, and their properties, including resting membrane potential, input resistance, as well as spike responses to depolarizing current pulses (C), were recorded. In the voltage-clamp experiments, TTX (0.5 μm) and bicuculline (10 μm) were added to the recording medium, and the frequency (E) and amplitude (F) of mEPSCs were measured. In none of these experiments were there any significant differences between the recorded groups (21–25 cells in each study, including 4–6 different cultures) of neurons.
Figure 2.
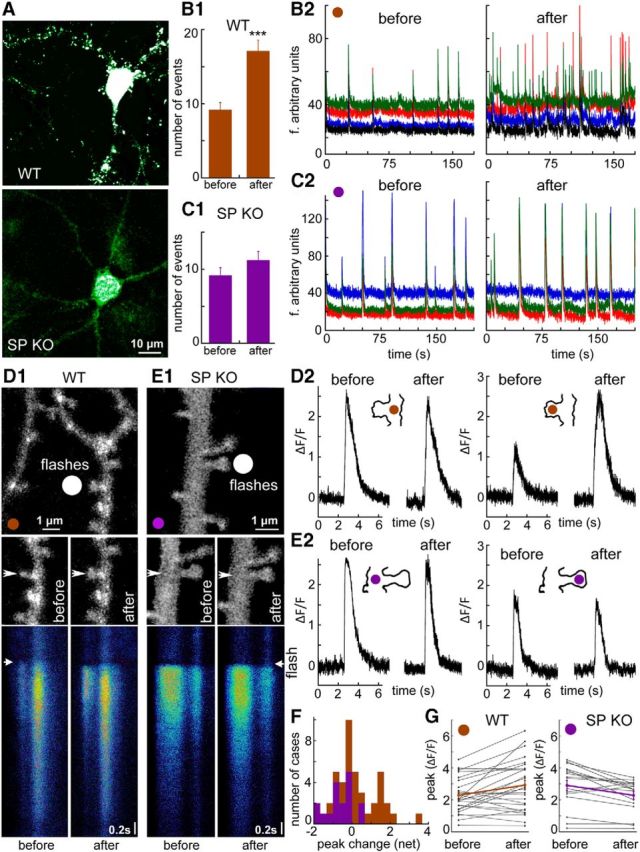
Reduced plasticity in SPKO cells in culture compared with control WT cells. A, Immunohistochemistry of SP in control (top) and SPKO cells (bottom). Punctate appearance of SP-positive spines is seen along dendrites in the WT cells. No such puncta were visible in the SPKO cells in culture. Scale bar: both images, 10 μm. B, C, Spontaneous network activity in WT and SPKO cultures in control condition (left) and within 60 min after a 3 min exposure to cLTP-inducing medium (right). B1, C1, Bar graph representation of the rate of network bursts per 200 s before (left) and after (right) exposure to the cLTP-inducing medium. A significant change in the WT control is obvious (B1), but no such change is seen in the SPKO cultures. ***p < 0.001. B2, C2, Different colors represent different cells in the field of view. Ordinate, arbitrary fluorescence units; abscissa, time(s). D–G, Changes in [Ca2+]i reactivity to flash photolysis of caged glutamate in control (D) and SPKO (E) cells. D1, E1, Top, Position of the flash light beam near the dendritic spine in WT and SPKO dendrites. Scale bar, 1 μm. Middle, High-resolution images of the dendritic segments shown above, before (left) and 20 min after the exposure to three successive flashes of caged glutamate. In the WT, but not in the SPKO dendrites, the spine near the flash expanded in size, whereas other ones in the field did not. No clear change in size of the SPKO spines was evident. Bottom, Line scans of the changes of [Ca2+]i in spines and dendrites in response to photolysis of caged glutamate. Lines are scanned from top to bottom, and a flash was applied at the arrowhead. A transient rise in Ca2+ is evident in both the spine and the parent dendrite, in control condition (left) and after repeated flashes of glutamate (right). D2, E2, Analysis of transient changes in [Ca2+]i after flash photolysis of caged glutamate, in dendrite (left) and spines (right) before and after the flashes. A marked increase in reactivity of the WT spine, but none of the other analyzed compartments is obvious. F, Distribution of changes in [Ca2+]i between the control and 20 min past the train of flashes. Green bars represent WT; purple bars represent SPKO spines. A right shift in the distribution of only the WT cells is obvious. G, Paired comparisons before and after the train of flashes, showing that a large majority of the WT spines enhanced their responses, which was not the case for the SPKO spines.
Spontaneous network activity imaged with Fluo-4AM was not different between the WT and SPKO cultures (Fig. 2B,C) in terms of both number of bursts per minute and synchronicity among the imaged neurons in the fields of view (7 fields of view, 51 neurons in WT controls, and 9 fields, 57 neurons in the SPKO cultures; Fig. 2B,C). After a 3 min exposure to NMDA-enhancing medium (cLTP, see above), the burst rate and synchrony of network activity were markedly enhanced in the WT cultures (Fig. 2 B1,B2) but were not changed significantly in the SPKO cultures (Fig. 2C1,C2).
In a subsequent series of experiments, the changes in reactivity to flash photolysis of caged glutamate were measured in both WT and SPKO cultures. The light flash was focused near a dendritic spine (Fig. 2D1,E1, white circle), and the [Ca2+]i transient response to the flash was recorded using line scan through the spine head and the parent dendrite (Fig. 2 D2,E2), before and 20 min after 3 successive flashes of caged glutamate applied at the same spot at a rate of 1 Hz. Although there were no changes in the response of the parent dendrites (n = 17 dendritic segments in 4 cells) or in responses of the SPKO spines, there was a significant enhancement of the [Ca2+]i responses of the spines of the WT neurons (n = 27 dendritic segments in 7 cells) to the flash photolysis of the caged glutamate. However, even in this group of spines, there was a large variability, such that 60% of the spines showed an enhanced response, whereas the rest did not change (Fig. 2F,G). The cause for this heterogeneity was explored in the following experiments conducted only with SPKO cells transfected with SP plasmid.
Comparing SP(+) and SP(−) spines in transfected SPKO cells
Transfection with SP-GFP did not produce apparent morphological or electrophysiological differences from cells transfected with GFP alone (data not shown). Indeed, an immunocytochemical analysis of the distribution and intensity of SP puncta in the control and the SP-transfected SPKO cells indicated an overlap between the transfected SP and SP detected by immunostaining, as well as the intensity of the SP puncta in the two conditions (Fig. 3), although in some spines the immunostaining was more conspicuous than the GFP-labeled SP because of the possible fading of the GFP after fixation, resulting in a subpopulation of immunostained but not GFP-labeled spines (Fig. 3D, middle bar). In the transfected neurons, as in the wt cells, only a subset of dendritic spines were endowed with fluorescent SP puncta (Figs. 3A–D and 4A–C). The proportion of SP-punctated spines ranged between 26% and 30% in different neurons, at the age of 14–21 d in culture (Fig. 4; 21 cells, 719 spines counted). The SP puncta were more frequently associated with large, mushroom-type spines than with small or stubby spines, being exceptionally rare in long headless/filopodia-like protrusions. The following numbers describe the proportion of spines of different types, including the SP(+) ones in parentheses (all related to the total), calculated for 21-d-old cultures: large mushroom, 13.4% (7.1%); mushroom, 29.8% (10.1%); stubby, 25.2% (5.5%); and short, 31.5% (3.4%) (long headless and filopodia-like protrusions were excluded from this analysis).
Figure 3.
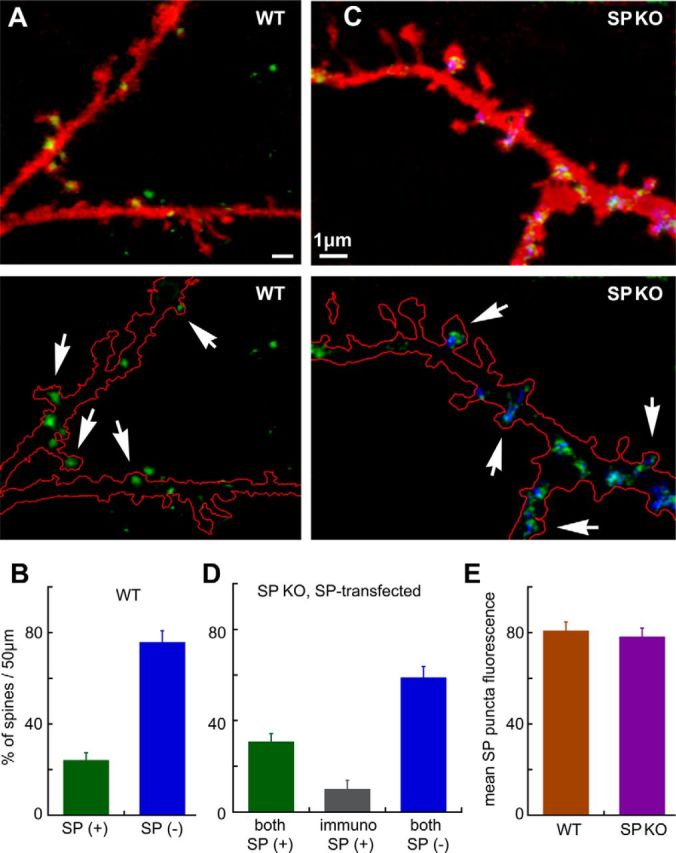
Colocalization of immunostained SP puncta and the transfected SP-GFP. In both wt (A, B) and SPKO (C, D) that had been transfected with SP-GFP and subsequently immunostained for SP, there is an overlap of SP staining in both the transfected species and the SP detected by immunocytochemistry. A, C, Top, Dendrite of the cell transfected with DsRed for imaging the morphology. Bottom, Silhouettes of the morphology to have a better image of the stained puncta. It should be added that no staining for SP puncta was found in the nontransfected SPKO cells (C, as in Fig. 2). In the wt group, only approximately one-third of the spines were endowed with SP puncta (B, 42 fields analyzed in 14 cells), and the same proportion was found in the SPKO cells transfected with SP-GFP (D) (27 fields examined). Together, the fluorescence intensity of the transfected and the wt cells was similar (E, 175 puncta measured, 9 cells imaged).
Figure 4.

Exposure of SP-GFP-transfected neurons to a conditioning medium (cLTP) that enhances activation of the NMDA receptor causes spine head expansion that is selectively found in SP containing spines (SP(+)). A, Low-power image of a neuron, transfected with DsRed to stain cell morphology and SP-GFP (green puncta). B, C, Distribution of different types of dendritic spines in the transfected neurons. The different shapes are illustrated below the bar graphs as (from left to right) large mushrooms, mushrooms, stubby, and thin. Yellow area represents SP-GFP puncta. Blue area represents immunostaining for synaptophysin (SY). C, Distribution of SP(+)-only spines in the same categories of dendritic spines. D, High-resolution images of a dendritic segment containing GFP-labeled SP in dendritic spines, before and at different times after a 3 min exposure to the conditioning medium. At the end of the experiment, the culture was immunostained for synaptophysin (SY, blue, right), and the spines were categorized into those being touched or not being touched by SY puncta. E, Net change in spine head perimeter measured 15 min and 1 h after exposure to the conditioning medium. Spines were categorized into SP(+) (green bars) and SP(−) (blue bars) (left), and spines of both categories, touched by SY puncta (right). The subpopulation of SP(+) spines that are attached to SY puncta expressed the largest change in volume after exposure to the conditioning medium. F, The measurement method of spine perimeter in three spines before (left) and after (right) the conditioning protocol. Scale bars: A, 10 μm; D, F, 1 μm.
Exposure of the cultures to a conditioning medium that caused cLTP of network connectivity produced a gradual increase in the spine head perimeter (Fig. 4D) that increased from 3.3 ± 0.09 μm in control to 3.51 ± 0.14 μm at 15 min after the washout of the conditioning medium and to 3.81 ± 0.14 μm at 1 h later (n = 44, p < 0.0028). This change was seen only in the SP(+) spines, whereas the SP(−) ones did not change within 1 h after the exposure to the conditioning medium (Fig. 4B,C). After the experiments, a subset of cultures were stained for the presynaptic marker synaptophysin (SY). The transfected neurons were identified, and the dendritic segments where the measurements were made were analyzed for the presence of SY puncta touching dendritic spines. Strikingly, the amount of change in spine perimeter was far larger in the SP-labeled spines that were also attached to SY puncta, amounting to 1.25 ± 0.073 μm compared with 0.18 ± 0.06 μm in the SY-negative spines, indicating that functional synapses tend to inflate much more readily than those that are not touched by presynaptic terminals (Fig. 4E, right). Obviously, we do not know whether the inflated spines were already touched by a SY puncta before the experiment or whether this became functional during the 1 h period after exposure to the conditioning medium.
Flash photolysis of caged glutamate
To obtain a better spatial resolution and determine whether the expansion of the spine head is a specific effect on the imaged spine or a general effect of activity on the neuronal network, we resorted to flash photolysis of caged glutamate, applied near selected SP(+) and SP(−) spines, in a recording medium containing 3 mm CaCl2, 0 mm MgCl2, and 0.5 μm TTX. A series of 5 flashes at 0.1 Hz near spine heads produced a rapid spine expansion that was detected already 30 s after the flash series and was highly significant 3 min later. At this time, the spine perimeter amounted to 60.6 ± 11.8% above control value (n = 34 spines in 7 experiments, p < 0.0001, paired t test; Fig. 5B). This, however, was seen only in SP(+) spines, whereas in SP(−) spines there were no changes in spine perimeter over the entire observation time of 20 min (Fig. 5B; n = 57 spines in the same 7 experiments). Interestingly, in spines that were adjacent to the stimulated ones (from 4 to 18 μm away from the stimulated spine), there was a slight but significant shrinkage of the spine head volume (by 37.9 ± 8.7%, Fig. 4B; n = 50 spines in the same experiments). Interestingly, the shrunk spines were both SP(+) and SP(−), with no clear distinction between them in reactivity to the stimulation. As before, the cultures were fixed at the end of the experiments and were stained for SY. Subsequently, the dendrites that had been imaged alive were identified and quantified for the presence of SY puncta. There was a large and more persistent change in spine perimeter in the SP(+)/SY(+) spines, compared with those not endowed with a presynaptic marker (n = 28 and n = 6 spines, respectively, p < 0.0009). No such effect was seen with SP(−)/SY(+) spines (Fig. 5C; n = 18 spines).
Figure 5.
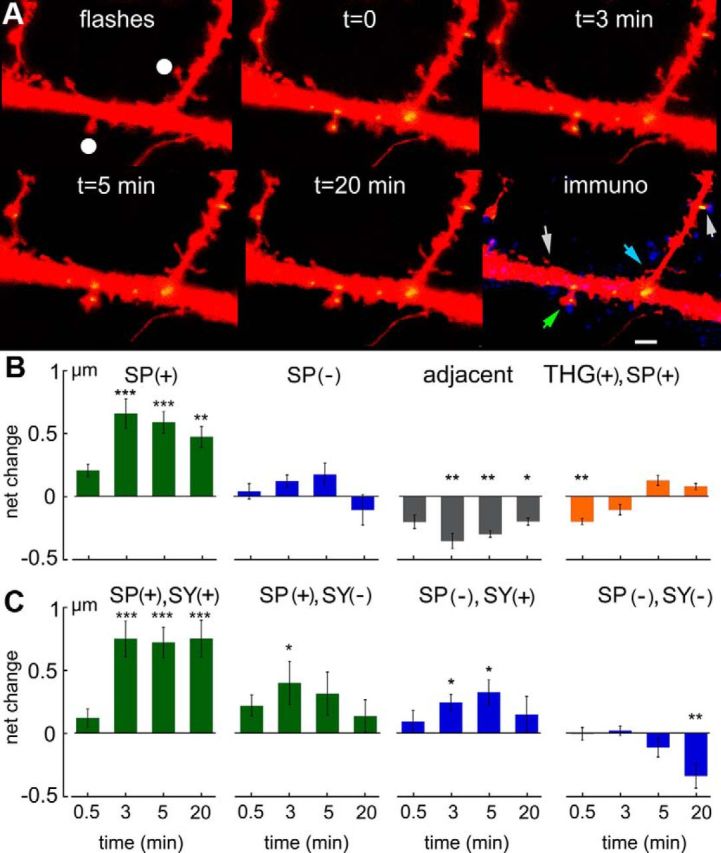
Flash photolysis of caged glutamate produces a rapid increase in the perimeter of SP(+) spines. A, Sample illustrations of a dendrite of DsRed-transfected SPKO cells, cotransfected with SP-GFP (green dots). Flashes were applied within a sphere marked by the white dots, and images were taken at different time intervals after the series of 5 flashes, as indicated. After the experiment, cultures were fixed and immunostained for SY as before (blue). Colored arrows indicate stimulated SP(+) (green) and SP(−) (blue) spines as well as two nonstimulated SP(+) (right) and (−) (left) spines (white arrows). Scale bar, 1 μm. B, C, Net changes in spine head perimeter at different times (3, 5, and 20 min after the flashes) in subgroups of spines (B): from left to right, SP(+) spines, SP(−) spines, spines that were 5–20 μm away from the ones hit by the uncaging of glutamate, and thapsigargin THG(+) pretreated SP(+) spines. Only the first group expressed a significant increase in spine perimeter over the entire period of observation. The group of spines adjacent to the flashed ones decreased their size significantly. C, The different spines were categorized to SP(+), having SY (SY+), or not having one or both. Apparently, only the group that had both SP and were attached to SY expressed a marked and sustained increase in spine size. *p < 0.05, **p < 0.01, ***p < 0.001.
The role of calcium stores
SP has been associated with calcium stores (Vlachos et al., 2009); and indeed, it was shown that flash photolysis of caged calcium induces release of calcium from stores in dendritic spines (Korkotian and Segal, 2011). To assess the role of calcium stores in the correlation between SP and spine expansion, we incubated cultures with thapsigargin (1 μm), which prevents the loading of calcium into the stores and thereby causes their depletion (Rogers et al., 1995). In the presence of thapsigargin, which by itself had no effect on SP puncta in spines (data not shown), glutamate uncaging was no longer able to cause spine expansion (n = 29 spines; Fig. 5B). This indicates that calcium stores are effective in the regulation of spine plasticity in SP(+) dendritic spines.
The difference in plastic properties between SP(+) and SP(−) spines can result from the difference in presence of different plasticity-associated proteins or even the difference in the synthetic machinery of these proteins. It can also result from a difference in the ability to accumulate higher concentrations of calcium ions needed to activate calcium-dependent kinases, which trigger the plastic process. In a previous study (Vlachos et al., 2009), we demonstrated that spines that were endowed with SP could generate a larger postsynaptic current response to glutamate than SP(−) spines. To examine this possibility further, we studied rapid [Ca2+]i transients caused by local flash photolysis of caged glutamate (Fig. 6). In each experiment, a line was scanned between the spine head and the parent dendrite, and the transient [Ca2+]i elevation was averaged separately for SP(+) and SP(−) spines, in the same dendritic branches. There was a much larger disparity between [Ca2+]i transients in the spine head and parent dendrites in the SP(+) than in the SP(−) spines (Fig. 6A–C). This disparity was obvious in the long (n = 17) and mushroom (n = 24) spines but was not seen in stubby spines (Fig. 6G,H). No such disparity was seen in the SP(−) spines, either in the long (n = 15) or in the mushroom types (n = 47) (Fig. 6E). By comparison, there was no difference in magnitude or time course of [Ca2+]i rise in the dendrites of all groups of spines (Fig. 6I, right). All in all, there was a parallel change in spine volumes, such that spines that generated a larger calcium transient tended to increase their size more than spines with smaller calcium transients, regardless of spine shape (r = 0.64, p < 0.0001; Fig. 6J). In all three spine categories, SP(−) did not present a spine volume change after exposure to glutamate.
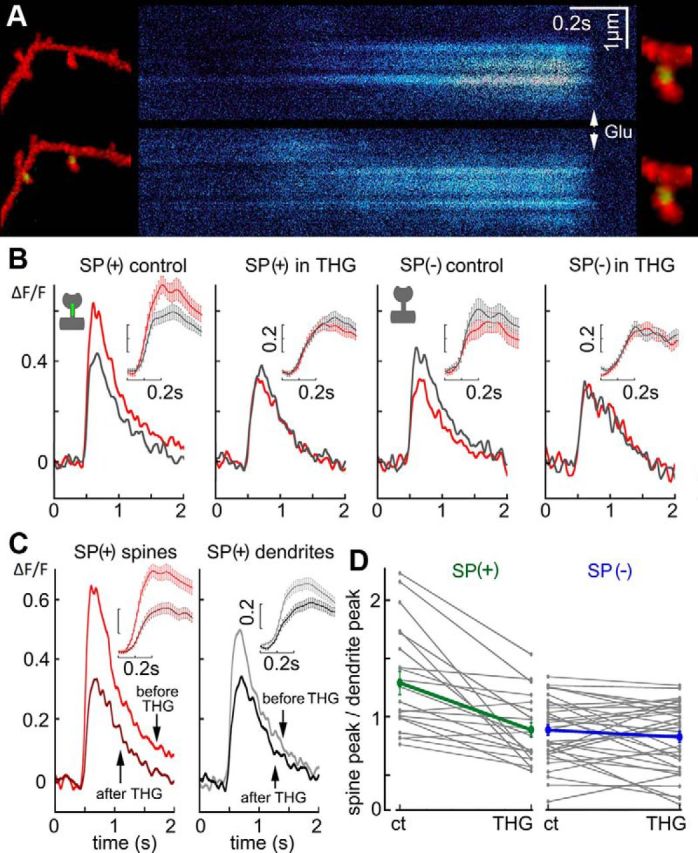
Figure 6.
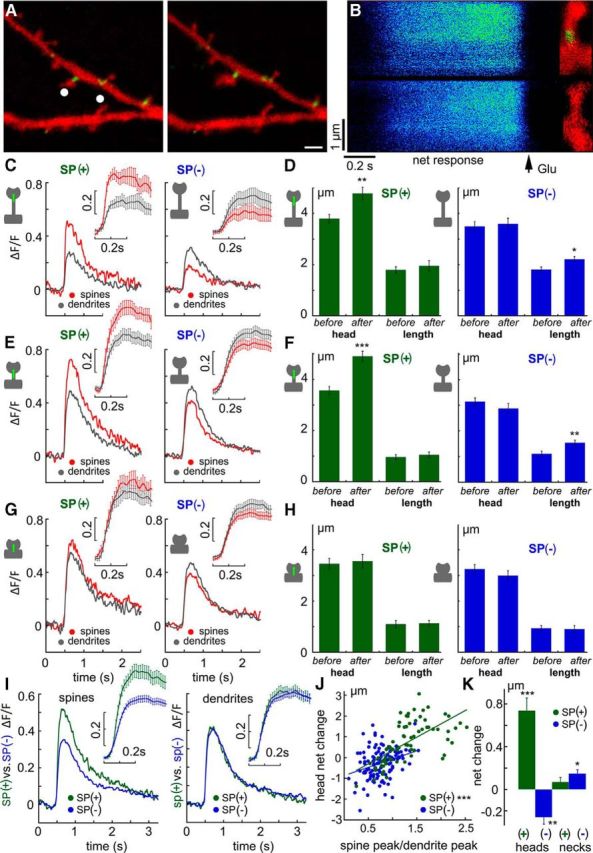
[Ca2+]i transients in response to photolysis of caged glutamate are larger in SP(+)-containing spines regardless of spine shape. A, Sample illustration of a dendritic segment of a DsRed-transfected neuron, containing GFP-SP (green). White dots indicate placement of the flash of caged glutamate. A line was scanned between spine head and parent dendrite in this and all other experiments. Scale bar, 1 μm. B, Line scans of the spines illustrated on the right, one containing SP (top) and one missing it (bottom). Lines were scanned from right to left, with background subtracted, and the [Ca2+]i transient (hot color) decays within 2 s after the flash of glutamate. A smaller response is seen in both images in the dendritic shaft compartment. C, E, G, Averages of changes in fluorescence (DF/F) in response to caged glutamate in spine (red) and dendrite (gray) compartments calculated separately for SP(+) (left) and SP(−) (right) spines (n = 54 and n = 109, respectively). Insets, The response at the peak, with SEM for each averaged time point. C, Long mushroom spines. E, Short mushrooms. G, Stubby spines. D, F, H, Changes in spine head perimeter of the same spines imaged in C, E, G, respectively. Values shown are spine head perimeters before and after the exposure to glutamate (left) and length of spine neck under the same conditions. Green represents SP(+) spines; blue represents SP(−) spines. No apparent change in spine neck length was recorded in any of the groups. I, Comparison between calcium transients in SP(+) and SP(−) spines. Although there is no difference in the dendritic compartment (right), spine heads containing SP expressed a much larger [Ca] transient than SP(−) spines. J, A correlation between spine/neck calcium disparity and the magnitude of change in spine perimeter. A clear correlation (r = 0.64, p < 0.01) was seen in SP(+) spines (green) but not in SP(−) ones (blue). K, A summary diagram of changes in spine perimeter and length of spine necks in SP(+) and SP(−) spines recorded in the present series of experiments. A clear difference was seen in the changes in spine head perimeter, but no difference in neck length for SP(+) spines and a small difference in SP(−) spines. *p < 0.05, **p < 0.01, ***p < 0.001.
Finally, assuming that the difference in calcium transients is the result of activation of calcium stores that are associated with the spine apparatus (see below), we compared the effects of flash photolysis of caged glutamate on calcium transients in the same set of spines, before and after incubation of the cultures with thapsigargin (Fig. 7A). As in the previous experiments, there was a significant difference between SP(+) and SP(−) spines in the spine/dendrite disparity (n = 24 and n = 26 spines, respectively; Fig. 7B). However, in only the SP(+) spines, there was a marked reduction in the spine response to glutamate after exposure to thapsigargin, as well as a significant effect on dendritic responses, whereas the responses of the SP(−) spines to glutamate were not changed. These data are presented in a schematic plot (Fig. 7D) to indicate that SP(+) spine reactivity to glutamate is selectively sensitive to thapsigargin, implying an involvement of calcium stores in the transient [Ca2+]i generated by glutamate, which may underlie the enhanced plasticity of these spines.
Molecular mechanisms linked to SP: stromal interacting molecule 1 (STIM1) and Orai1
STIM1 is an intracellular sensor of levels of stored calcium, which responds to a reduction in [Ca]I by activating the plasma membrane calcium channel Orai1 (Klejman et al., 2009, Hartmann et al., 2014). We have analyzed the colocalization of either STIM1 and Orai1 with SP and examined possible changes in distribution of these two molecules in SPKO cultures. In normal wt cultures, STIM1 was found throughout the dendrites but was preferentially localized in spines that contained SP (Fig. 8A,C,D; 19 cells measured, 27 fields of 3D reconstructed dendritic segments). This was even more conspicuous when only mushroom spines were analyzed and the disparity between SP(+) and SP(−) was even larger (Fig. 8D). This preferential spine localization was lost in the SPKO cells where most mushroom spines were devoid of STIM1 puncta, whereas dendritic shaft STIM1 density was similar to the wt case (Fig. 8B,D; 12 cells examined).
By comparison, Orai1 puncta were smaller and more discrete and were also found in both dendritic shaft and spines (Fig. 9A; 17 cells examined). There was a significant colocalization of SP and Orai1 puncta in dendritic spines of wt cells (Fig. 9A, arrowheads). Strikingly, there were many more Orai1(+) in spines of the wt than the SPKO (Fig. 9B,C). This difference was maintained when analyzing separately mushroom, short, and stubby spines (Fig. 9D), whereas the total amount of Orai1 puncta was the same in the dendrites of wt and the SPKO neurons (Fig. 9E). These results point to a potential role of SP that needs to be explored further in biochemical studies: Our results suggest that SP is instrumental in directing STIM1 and Orai1 into dendritic spines, indicating that SP may act via an interaction with the store-operated calcium entry channel.
Figure 9.
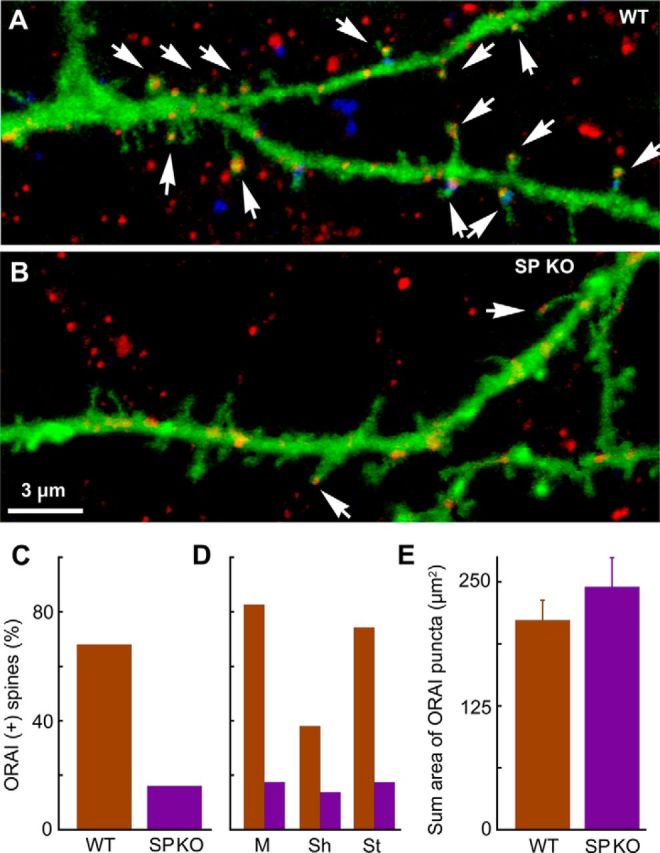
Codistribution of Orai1 and SP in wt and SPKO cells. Cells were transfected with GFP for morphology and immunostained for SP (blue) and Orai1 (red). A, wt cell. Arrows indicate colocalization. B, An SPKO cell that does not stain for SP. The distribution of Orai1 in the spines is also indicated by arrowheads. C, Proportion of Orai1-positive spines in wt and SPKO neurons. A total of 100 spines were counted for both groups of 17 wt and 9 SPKO cells. D, The distribution of Orai1 in different spine morphologies: mushroom (M), short (Sh), and stubby (St). E, The density of Orai1 in the dendritic shafts is not different between wt and SPKO dendrites (1120 puncta in wt and 910 in SPKO dendrites for the same length of dendrites).
Structural correlate of SP
As in previous studies, SP has been associated with the spine apparatus, such that in SPKO mice, the spine apparatus is absent (Deller et al., 2003). In the current study, we confirmed this observation also in cultured hippocampal neurons, where spine apparatus was found in some dendritic spines (Fig. 10) of wt and transfected SPKO cells, but not in nontransfected SPKO cells. This indicates that SP is instrumental in the construction of the spine apparatus, which probably reflects the structural basis of calcium stores in spines.
Figure 10.

Presence of spine apparatus in dendritic spines of dissociated cultures of hippocampal neurons. A, B, Two spines with spine apparatuses (arrows) from SP-transfected neurons in dissociated cultures, fixed at 3 weeks in vitro. Scale bars: A, 0.5 μm; B, 0.25 μm.
Discussion
The present study demonstrates that dendritic spines that contain SP are more able to increase their volume after exposure to plasticity-producing stimulation, be it exposure to global conditioning medium or local release of glutamate by flash photolysis. Both types of stimulation have been shown to cause formation of new spines (e.g., Engert and Bonhoeffer, 1999) and inflate existing ones (Matsuzaki et al., 2004). In previous studies in dissociated cultures, we and others have shown that overexpression of SP can cause an increase in reactivity to glutamate as well as enhance the delivery of glutamate receptors to the spine head after conditioning (Vlachos et al., 2009). In that study, we also suppressed SP expression with siRNA and obtained the expected reduction in ability to deliver GluRs into the synapses. The main technical advantage of the current study compared with that of Vlachos et al. (2013) in cultured brain slices is that the only SP molecule resident in the imaged neurons is the transfected species, which can be seen via its link to GFP. This simplifies the analysis of the roles of SP and allows a direct comparison between SP(+) and SP(−) spines in the same neurons. Not surprisingly, the results in the current study are more striking in that virtually no spine inflation was found in SP(−) spines. In the SP(+) spines, the inflation is correlated with the magnitude of the calcium transient and dependent on calcium stores; thapsigargin suppresses the responses to glutamate in these spines, as seen previously (Vlachos et al., 2009). Another recent report using cultured hippocampal slices has also indicated that SP is needed to produce homeostatic plasticity in dentate granular cells (Vlachos et al., 2013). These results confirm and extend earlier studies showing that lack of SP affects LTP in hippocampal slices (Deller et al., 2003), albeit with different magnitudes and induction protocols. The fact that thapsigargin blocks the morphological plasticity associated with SP indicates that calcium stores are activated in the SP(+) spines to enhance [Ca2+]i rise, which will be required for the initiation of plasticity.
Spine inflation as a result of excessive glutamate activation was described ∼10 years ago (Matsuzaki et al., 2004) and studied extensively since then. In the original report, it was suggested that small spines tend to inflate, whereas large mushroom-type spines are considered as “memory spines” and are less able to undergo further inflation. SP is associated with large, mature mushroom spines; hence, it is expected that they will not undergo further plastic changes. This was not confirmed in the present study, where these SP+ spines did undergo plastic changes, unlike the other ones, which tend to be smaller and thinner. This disparity may have to do with the plasticity induction protocol or the types of cells examined. One should note that, whereas the grand average of SP(−) spines did not show a clear trend toward an increase in spine dimensions after exposure to glutamate, individual spines within this group did show significant changes, and so it is possible that some subclassification is needed to clarify which spines do or do not change in response to glutamate.
It is interesting to note that the typical averaged response in the spines adjacent to those activated by glutamate was that of shrinkage (Fig. 5C). This was also the case for some of the SP(−) spines. It has been demonstrated that stimulation can, under certain conditions, produce LTD (Pi and Lisman, 2008), and this is associated with shrinkage of spines. LTD has long been associated with a moderate increase in [Ca2+]i that is not sufficient to activate kinases but is sufficient to activate phosphatases (Sala and Segal, 2014). It is possible that [Ca2+]i in the spines adjacent to the activated one was elevated to only submaximal levels, which may lead to spine shrinkage. This may also be the case for some SP(−) spines where calcium stores are not activated, leading to LTD and spine shrinkage (Okamoto et al., 2004). This possibility has to be studied in further experiments.
The spine expansion seen in the present study was rather rapid in the spines exposed to glutamate, with a peak response within 3 min of the stimulation. In contrast, the expansion seen after exposure to the conditioning medium was slow and peaked 30 min later. This range is typical of results reported in different studies (Sala and Segal, 2014) and may reflect the intensity of the stimulation under different recording conditions.
Another factor that appears to be important for spine expansion is the presence of a presynaptic terminal adjacent to the activated spines. This seems to be trivial because the conditioning medium facilitates release of glutamate from nerve terminals in addition to enhancing NMDA reactivity. Thus, it is likely that the released neurotransmitter will act to expand the postsynaptic spine. This, however, is also true for the case where glutamate activates directly the spine (as in Fig. 4C), but in these cases it is not known whether the terminal was present at the activated spine before activation or was added only later on, before fixation of the tissue.
The present experiments indicate that a major functional difference between SP(+) and SP(−) spines is in the ability to release calcium from stores in the spines, which will amplify the calcium response and allow activation of downstream molecular cascades. A mechanism that may be involved in this action of SP is the store-operated calcium entry (SOCE) channel, Orai1, linked to STIM1 (Klejman et al., 2009; Hartmann et al., 2014). We find these molecules in dendritic spines, in close association with SP, and their preferential localization in spines is impaired in SPKO cells. This indicates that SP may regulate the functionality of calcium stores via its interaction with the STIM/Orai channel. The role of these molecules in determining the plastic properties of dendritic spines is subject to further exploration.
Footnotes
This work was supported by German Israel Foundation Grant 1088-21.1/2010 and Israel Science Foundation Grant 805/09. M.F. is Senior Research Professor for Neuroscience of the Hertie Foundation.
The authors declare no competing financial interests.
References
- Asanuma K, Kim K, Oh J, Giardino L, Chabanis S, Faul C, Reiser J, Mundel P. Synaptopodin regulates the actin-bundling activity of alpha-actinin in an isoform-specific manner. J Clin Invest. 2005;115:1188–1198. doi: 10.1172/JCI23371. [DOI] [PMC free article] [PubMed] [Google Scholar]
- Asanuma K, Yanagida-Asanuma E, Faul C, Tomino Y, Kim K, Mundel P. Synaptopodin orchestrates actin organization and cell motility via regulation of RhoA signalling. Nat Cell Biol. 2006;8:485–491. doi: 10.1038/ncb1400. [DOI] [PubMed] [Google Scholar]
- Deller T, Merten T, Roth SU, Mundel P, Frotscher M. Actin-associated protein synaptopodin in the rat hippocampal formation: localization in the spine neck and close association with the spine apparatus of principal neurons. J Comp Neurol. 2000;418:164–181. doi: 10.1002/(SICI)1096-9861(20000306)418:2<164::AID-CNE4>3.0.CO;2-0. [DOI] [PubMed] [Google Scholar]
- Deller T, Korte M, Chabanis S, Drakew A, Schwegler H, Stefani GG, Zuniga A, Schwarz K, Bonhoeffer T, Zeller R, Frotscher M, Mundel P. Synaptopodin-deficient mice lack a spine apparatus and show deficits in synaptic plasticity. Proc Natl Acad Sci U S A. 2003;100:10494–10499. doi: 10.1073/pnas.1832384100. [DOI] [PMC free article] [PubMed] [Google Scholar]
- Engert F, Bonhoeffer T. Dendritic spine changes associated with hippocampal long-term synaptic plasticity. Nature. 1999;399:66–70. doi: 10.1038/19978. [DOI] [PubMed] [Google Scholar]
- Harris KM. Calcium from internal stores modifies dendritic spine shape. Proc Natl Acad Sci U S A. 1999;96:12213–12215. doi: 10.1073/pnas.96.22.12213. [DOI] [PMC free article] [PubMed] [Google Scholar]
- Hartmann J, Karl RM, Alexander RP, Adelsberger H, Brill MS, Rühlmann C, Ansel A, Sakimura K, Baba Y, Kurosaki T, Misgeld T, Konnerth A. STIM1 controls neuronal Ca(2+) signaling, mGluR1-dependent synaptic transmission, and cerebellar motor behavior. Neuron. 2014;82:635–644. doi: 10.1016/j.neuron.2014.03.027. [DOI] [PubMed] [Google Scholar]
- Ivenshitz M, Segal M. Simultaneous NMDA-dependent long-term potentiation of EPSCs and long-term depression of IPSCs in cultured rat hippocampal neurons. J Neurosci. 2006;26:1199–1210. doi: 10.1523/JNEUROSCI.2964-05.2006. [DOI] [PMC free article] [PubMed] [Google Scholar]
- Jedlicka P, Schwarzacher SW, Winkels R, Kienzler F, Frotscher M, Bramham CR, Schultz C, Bas Orth C, Deller T. Impairment of in vivo theta-burst long-term potentiation and network excitability in the dentate gyrus of synaptopodin-deficient mice lacking the spine apparatus and the cisternal organelle. Hippocampus. 2009;19:130–140. doi: 10.1002/hipo.20489. [DOI] [PubMed] [Google Scholar]
- Klejman ME, Gruszczynska-Biegala J, Skibinska-Kijek A, Wisniewska MB, Misztal K, Blazejczyk M, Bojarski L, Kuznicki J. Expression of STIM1 in brain and puncta-like co-localization of STIM1 and ORAI1 upon depletion of Ca(2+) store in neurons. Neurochem Int. 2009;54:49–55. doi: 10.1016/j.neuint.2008.10.005. [DOI] [PubMed] [Google Scholar]
- Korkotian E, Segal M. Synaptopodin regulates release of calcium from stores in dendritic spines of cultured hippocampal neurons. J Physiol. 2011;589:5987–5995. doi: 10.1113/jphysiol.2011.217315. [DOI] [PMC free article] [PubMed] [Google Scholar]
- Korkotian E, Oron D, Silberberg Y, Segal M. Confocal microscopic imaging of fast UV-laser photolysis of caged compounds. J Neurosci Methods. 2004;133:153–159. doi: 10.1016/j.jneumeth.2003.10.007. [DOI] [PubMed] [Google Scholar]
- Matsuzaki M, Honkura N, Ellis-Davis GC, Kasai H. Structural basis of long term potentiation in single dendritic spines. Nature. 2004;429:761–766. doi: 10.1038/nature02617. [DOI] [PMC free article] [PubMed] [Google Scholar]
- Mundel P, Heid HW, Mundel TM, Krüger M, Reiser J, Kriz W. Synaptopodin: an actin-associated protein in telencephalic dendrites and renal podocytes. J Cell Biol. 1997;139:193–204. doi: 10.1083/jcb.139.1.193. [DOI] [PMC free article] [PubMed] [Google Scholar]
- Okamoto K, Nagai T, Miyawaki A, Hayashi Y. Rapid and persistent modulation of actin dynamics regulates postsynaptic reorganization underlying bidirectional plasticity. Nat Neurosci. 2004;7:1104–1112. doi: 10.1038/nn1311. [DOI] [PubMed] [Google Scholar]
- Okubo-Suzuki R, Okada D, Sekiguchi M, Inokuchi K. Synaptopodin maintains the neural activity-dependent enlargement of dendritic spines in hippocampal neurons. Mol Cell Neurosci. 2008;38:266–276. doi: 10.1016/j.mcn.2008.03.001. [DOI] [PubMed] [Google Scholar]
- Pi HJ, Lisman JE. Coupled phosphatase and kinase switches produce the tristability required for long-term potentiation and long-term depression. J Neurosci. 2008;28:13132–13138. doi: 10.1523/JNEUROSCI.2348-08.2008. [DOI] [PMC free article] [PubMed] [Google Scholar]
- Rogers TB, Inesi G, Wade R, Lederer WJ. Use of thapsigargin to study Ca2+ homeostasis in cardiac cells. Biosci Rep. 1995;15:341–349. doi: 10.1007/BF01788366. [DOI] [PubMed] [Google Scholar]
- Sala C, Segal M. Dendritic spine: the locus of synaptic plasticity. Physiol Rev. 2014;94:141–188. doi: 10.1152/physrev.00012.2013. [DOI] [PubMed] [Google Scholar]
- Segal M, Vlachos A, Korkotian E. The spine apparatus, synaptopodin, and dendritic spine plasticity. Neuroscientist. 2010;16:125–131. doi: 10.1177/1073858409355829. [DOI] [PubMed] [Google Scholar]
- Vlachos A, Korkotian E, Schonfeld E, Copanaki E, Deller T, Segal M. Synaptopodin regulates plasticity of dendritic spines in hippocampal neurons. J Neurosci. 2009;29:1017–1033. doi: 10.1523/JNEUROSCI.5528-08.2009. [DOI] [PMC free article] [PubMed] [Google Scholar]
- Vlachos A, Ikenberg B, Lenz M, Becker D, Reifenberg K, Bas-Orth C, Deller T. Synaptopodin regulates denervation-induced homeostatic synaptic plasticity. Proc Natl Acad Sci U S A. 2013;110:8242–8247. doi: 10.1073/pnas.1213677110. [DOI] [PMC free article] [PubMed] [Google Scholar]
- Zhang XL, Pöschel B, Faul C, Upreti C, Stanton PK, Mundel P. Essential role for synaptopodin in dendritic spine plasticity of the developing hippocampus. J Neurosci. 2013;33:12510–12518. doi: 10.1523/JNEUROSCI.2983-12.2013. [DOI] [PMC free article] [PubMed] [Google Scholar]