Abstract
Specification of spinal cord neurons depends on gene regulation networks that impose distinct fates in neural progenitor cells (NPCs). Olig2 is a key transcription factor in these networks by inducing motor neuron (MN) specification and inhibiting interneuron identity. Despite the critical role of Olig2 in nervous system development and cancer progression, the upstream molecular mechanisms that control Olig2 gene transcription are not well understood. Here we demonstrate that Prox1, a transcription repressor and downstream target of proneural genes, suppresses Olig2 expression and therefore controls ventral spinal cord patterning. In particular, Prox1 is strongly expressed in V2 interneuron progenitors and largely excluded from Olig2+ MN progenitors (pMN). Gain- and loss-of-function studies in mouse NPCs and chick neural tube show that Prox1 is sufficient and necessary for the suppression of Olig2 expression and proper control of MN versus V2 interneuron identity. Mechanistically, Prox1 interacts with the regulatory elements of Olig2 gene locus in vivo and it is critical for proper Olig2 transcription regulation. Specifically, chromatin immunoprecipitation analysis in the mouse neural tube showed that endogenous Prox1 directly binds to the proximal promoter of the Olig2 gene locus, as well as to the K23 enhancer, which drives Olig2 expression in the pMN domain. Moreover, plasmid-based transcriptional assays in mouse NPCs suggest that Prox1 suppresses the activity of Olig2 gene promoter and K23 enhancer. These observations indicate that Prox1 controls binary fate decisions between MNs and V2 interneurons in NPCs via direct repression of Olig2 gene regulatory elements.
Keywords: motor neurons, neural progenitor cells, Olig2, transcriptional control, V2 interneurons
Introduction
During development of the central nervous system (CNS) a large variety of cell types are specified via a combined action of extrinsic morphogenetic cues and intrinsic gene regulatory networks (Jessell, 2000; Marquardt and Pfaff, 2001). Olig2 is a central player and master regulator of many distinct neural fates in the CNS. In the early ventral neural tube, Olig2 specifies the motor neuron progenitor domain (pMN) via repressive actions on other transcription factors (Briscoe and Novitch, 2008). Although Olig2 is a key regulator for the specification of motor neurons (MNs) and other neural subtypes (Mizuguchi et al., 2001; Novitch et al., 2001; Zhou et al., 2001; Lu et al., 2002; Takebayashi et al., 2002; Zhou and Anderson, 2002; Li et al., 2011; Hafler et al., 2012), as well as cancer progression (Marie et al., 2001; Aguirre-Cruz et al., 2004; Tabu et al., 2006; Ligon et al., 2007; Mehta et al., 2011; Sun et al., 2011), the transcription factors that directly control its expression are largely elusive. It was only recently shown that miRNA-17-3p is involved in the repression of Olig2 expression and specification of pMN domain (J. A. Chen et al., 2011).
To further understand the mechanistic basis of Olig2 gene regulation, we investigated the possibility that additional factor(s) may be involved in the transcriptional network that controls Olig2 expression. To this end, we and others have previously shown that Prox1, a homeodomain transcription factor with a key role in cell type specification in various organs and tissues (Wigle and Oliver, 1999; Wigle et al., 1999, 2002; Sosa-Pineda et al., 2000; Dyer et al., 2003; Harvey et al., 2005; Risebro et al., 2009; Kaltezioti et al., 2010; Elkouris et al., 2011), is strongly expressed in neural tube during development (Misra et al., 2008; Kaltezioti et al., 2010). Moreover, we showed that Prox1 coordinately regulates cell cycle exit of neural progenitor cells (NPCs) with induction of generic aspects of neuronal differentiation (Misra et al., 2008; Kaltezioti et al., 2010). Most importantly, Prox1 expression is mainly confined in interneuron progenitors, being largely excluded from the MNs in chick spinal cord (Misra et al., 2008; Kaltezioti et al., 2010). Additionally, studies from other groups have shown that overexpression of Olig2 in chick spinal cord is sufficient to suppress Prox1 expression, while proneural genes, such as Ascl1 (Mash1) and Neurog2 (Ngn2), which synchronize subtype specification with generic aspects of neurogenesis, are able to induce Prox1 expression (Torii et al., 1999; Misra et al., 2008). Furthermore, in the Pax6sey/sey mutant mice, where Olig2 expression is downregulated and MN differentiation is severely impaired (Ericson et al., 1997), Prox1 expression is upregulated into the MN domain (Misra et al., 2008). These observations indicate a negative correlation of Prox1 with Olig2 function and MN lineage specification.
Here we provide functional evidence that Prox1 is indeed a critical regulator of Olig2 and binary fate decisions in the ventral NPCs. In particular, we show that endogenous Prox1 is able to directly bind and regulate the Olig2 proximal promoter and enhancer elements in vivo. Through this action, Prox1 is sufficient and necessary for the suppression of Olig2 transcription and MN identity in the spinal cord.
Materials and Methods
In situ hybridization on cryosections.
Nonradioactive in situ hybridization on cryosections and preparations for digoxigenin-labeled probes were performed as previously described (Politis et al., 2007a,b; Kaltezioti et al., 2010).
RNA extraction and real-time RT-PCR analysis.
Total RNA was isolated by using the RNAeasy Kit (Qiagen) followed by treatment with RQ1 DNase (Promega). Quantitative real-time RT-PCR analysis was performed as described previously (Politis et al., 2007a,b; Kaltezioti et al., 2010). Primer sets used in RT-PCR assays are as follows: mOlig2-For: CACAGGAGGGACTGTGTCCT, mOlig2-Rev: GGTGCTGGAGGAAGATGACT, mGAPDH-For: AACTCCCTCAAGATTGTCAGCAA, and mGAPDH-Rev: ATGTCAGATCCACAACGGATACA.
Immunohistochemistry.
Prox1 was detected using a rabbit polyclonal anti-Prox1 antibody (ReliaTech) or a mouse monoclonal antibody (Millipore Bioscience Research Reagents). Mouse monoclonal antibodies against MNR2 (Hb9), Islet1, Lim3, Lhx1/5, Pax3, Pax7, Pax6, and Nkx6.1 were obtained from Developmental Studies Hybridoma Bank (University of Iowa, Iowa City, IA). Goat polyclonal anti-Olig2 antibody was purchased from Santa Cruz Biotechnology(C-17, sc-19969) and rabbit polyclonal anti-Olig2 from Millipore Bioscience Research Reagents (AB9610). Mouse monoclonal anti-βIII-tubulin was from Covance and rabbit Sox1 from Cell Signaling Technology (4194S). Chx10 and Sox2 antibodies were kindly provided from Dr. Laskaro Zagoraiou (BRFAA, Athens, Greece). Anti-GFP was purchased from Invitrogen and anti-Flag, anti-Myc, and anti-His from Sigma. Secondary antibodies conjugated with Alexa Fluor 488 (green), 568 (red), or 647 (far red) were purchased from Invitrogen. Cell nuclei were labeled with Hoechst 33258 or DAPI (1:2000; Invitrogen).
ChIPs.
ChIP assays were performed essentially as previously described (Kaltezioti et al., 2010; Foskolou et al., 2013). Spinal cords were dissected from E12.5 mice embryos and 25 μg of chromatin was used per IP reaction with up to 3 μg of antibody. Chromatin-antibody immunocomplexes were formed using affinity-purified antibodies to Prox1 (ReliaTech, 102-PA32). Chromatin–IgG immunocomplexes were used as control.
The following set of primers was used to amplify the genomic loci from murine Olig2 gene as indicated in Figure 5A (in all cases we used two different reverse primers for real-time PCR and verification with conventional PCR, due to product size limitations): vDistal-For: CTCTTGCCAACCCTGAAGAC, vDistal-Rev: CAGAGAATTGGGAGGAATCG, vDistal-Rev2: GAATGCTCAGGATTGGGAAA, Distal 1.1 kb-For: GGCACCAAGATGTTGGAAGT, Distal 1.1 kb-Rev: CCCACTCCCTTAGCTCCTTT, Distal 1.1 kb-Rev2: GGGAAGAAATCGCAATTCAT, Proximal 1.1 kb-For: GCCTGACGCTACAGTGACAA, Proximal 1.1 kb-Rev: TGATGTCACCCGGCTAATTC, Proximal 1.1 kb-Rev2: GAAAGGGCGAGCTGAAGAA, 3′-UTR-For: CCCTCCTGTTGTCTCTCCTG, 3′-UTR-Rev: CCAGTCGGGTAAGAAACCAA, 3′-UTR-Rev2: TTGGGATTATTCCATTCCACA, K23a-For: CCTGCTTGTCTTTGGAGAGG, K23a-Rev: GAGACAGCAGGGCAAGATTC, and K23a-Rev2: CAGTCCAGCAGAAGAACACCT.
Figure 5.
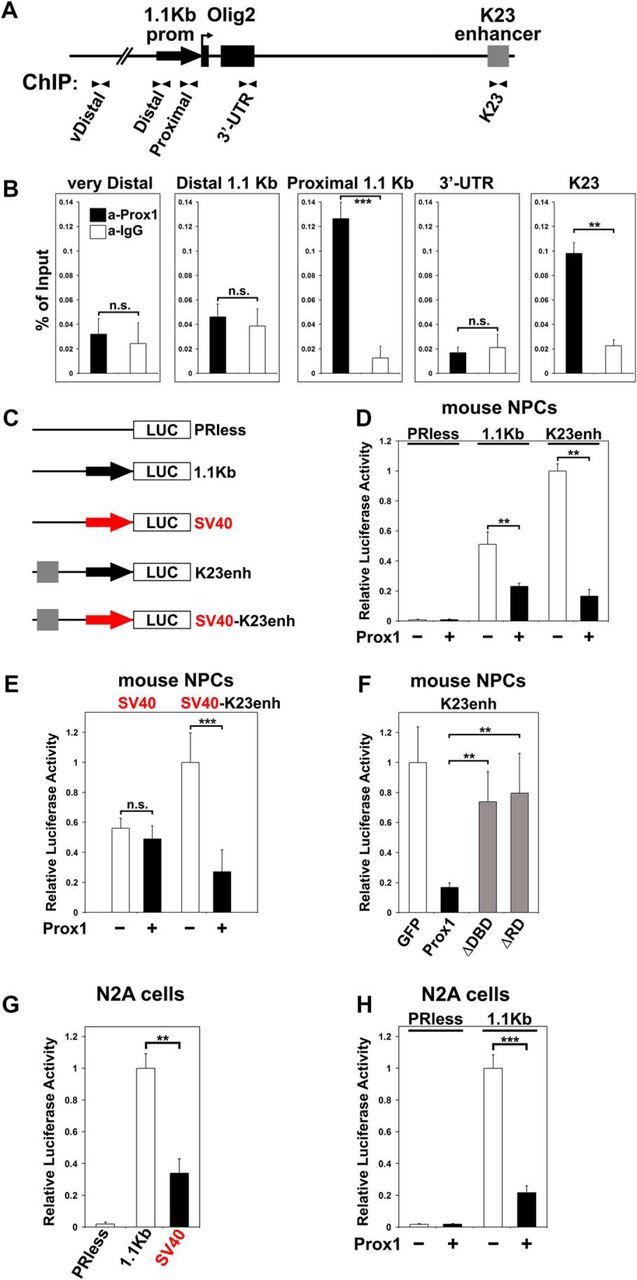
Prox1 regulates Olig2 expression via direct transcriptional suppression of Olig2 gene. A, Schematic representation of the organization of Olig2 gene locus. B, ChIP analysis for the binding of Prox1 to the proximal 1.1 kb Olig2 promoter and K23 enhancer in chromatin prepared from the spinal cords of E12.5 mouse embryos. The immunoprecipitated DNAs from these experiments were analyzed and quantified with real-time qPCR assays. The primer pairs used are indicated with arrows in A; **p < 0.01, ***p < 0.001, n.s: p > 0.05 (t test), n = 4. C, Schematic representation of the five luciferase reporter constructs used for the transcriptional assays, including the murine 1.1 kb Olig2 promoter fused with luciferase (1.1 kb), SV40 promoter fused with luciferase (SV40), K23 enhancer upstream of the 1.1 kb (K23enh), and K23 enhancer upstream of the SV40 (SV40-K23enh), as well as empty vector (PRless). D, Transcriptional assays in NPCs, cotransfected with Prox1 (+) or GFP (−) expression vectors and luciferase reporter constructs 1.1 kb or K23enh, represented in C, as indicated. For both 1.1 kb and K23enh, **p < 0.01 (t test), n = 4. E, Transcriptional assays in NPCs, cotransfected with Prox1 (+) or GFP expression (−) vectors and luciferase reporter constructs (SV40 or SV40-K23enh) represented in C, as indicated. For SV40 reporter: n.s., p > 0.05 (t test), n = 4; for SV40-K23enh: ***p < 0.001 (t test), n = 4. F, Transcriptional assays in mouse NPCs cotransfected with K23enh and GFP, WT-Prox1, ΔDBD-Prox1, or ΔRD-Prox1, as indicated. For both ΔDBD-Prox1 and ΔRD-Prox1 versus Prox1: **p < 0.01 (t test) n = 4; for both ΔDBD-Prox1 and ΔRD-Prox1 versus GFP: p > 0.1 (t test), n = 4. In all luciferase experiments, data are represented as the mean ± SD of quadruplicate assays. G, Transcriptional assays in N2A cells transfected with various promoter constructs as indicated in C. For 1.1 kb versus SV40, **p < 0.01 (t test), n = 4. H, Transcriptional assays in N2A cells cotransfected with PRless or 1.1 kb constructs and Prox1 (+) or GFP (−) expression vectors, respectively, as indicated. For 1.1 kb, ***p < 0.001 (t test), n = 4.
Luciferase assays.
Luciferase reporter assays were performed with luciferase/β-galactosidase kits (Promega), in mouse primary NPCs and the Neuro2A cell line after AMAXA electroporation (Lonza) and Lipofection (Lipofectamine 2000; Invitrogen), respectively (Kaltezioti et al., 2010; Foskolou et al., 2013). Five different luciferase reporter constructs were used for transcriptional assays, including the murine 1.1 kb Olig2 promoter fused with luciferase (1.1 kb), K23 enhancer upstream of the 1.1 kb (K23enh), SV40 promoter fused with luciferase (SV40; Clontech), K23 enhancer upstream of the SV40 (SV40-K23enh), and empty promoterless vector (PRless; Clontech). All experiments were done in quadruplicate and repeated at least three times.
Culture of NPCs and overexpression studies.
NPC cultures from E14.5 embryonic mouse spinal cords were prepared and analyzed as previously described (Politis et al., 2007a,b; Kaltezioti et al., 2010). For Prox1, Olig2, or GFP overexpression, cells were transfected using an AMAXA electroporator (Lonza; 5 μg of plasmid DNA per electroporation). These vectors were previously described (Kaltezioti et al., 2010). The pCDNA3-Olig2 vector was constructed for this study from total brain from E12.5 mouse CNS by RT-PCR and standard cloning methodology. Viral transduction with lentivirus-expressing shProx1 was performed in NPCs as recommended by the supplier (Sigma, TRC lentiviral library). The reference number and corresponding sequence for each shRNA construct used in this study were previously described (Foskolou et al., 2013).
In ovo electroporation.
Unilateral overexpression of transgenes and shRNA constructs in the chick neural tube by in ovo electroporation method was performed as previously described (Politis et al., 2007b; Kaltezioti et al., 2010). The pCAGGs-Prox1, pCAGGs-ΔDBD-Prox1, pCAGGs-NICD, pCAGGs-GFP, and pCAGGS empty vectors and shRNA constructs were previously described in detail (Kaltezioti et al., 2010). The myc-tagged RCAS-cOlig2 expression vector for rescue experiments in chick embryos was kindly provided by Despina Stamataki and James Briscoe (MRC, London, UK).
Mouse lines.
Olig2Cre/+ mice (Wu et al., 2006; Dessaud et al., 2007, 2008, 2010; J. A. Chen et al., 2011) were generated in the Jessell laboratory, Columbia University, and kindly provided to our laboratory from Tom Jessell and Laskaro Zagoraiou (BRFAA, Athens, Greece). The ROSA26-loxP-STOP-loxP-RFP mice were obtained from The Jackson Laboratory. All animals were handled in strict accordance with good animal practice as defined by the relevant European and Greek animal welfare bodies. The sex of the animal embryos used in this study was not determined.
Statistical analysis.
The measurements and experimental values from independent experiments were analyzed by two-tailed Student's t test. The results are shown as mean values of independent experiments ± STD. The p values were determined with Excel software.
Results
Prox1 expression is largely excluded from Olig2+ cells of the pMN domain
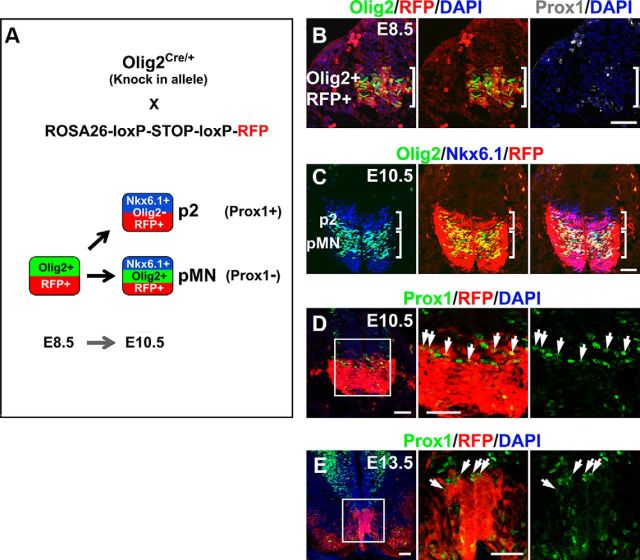
Prox1 expression in the dorsal neural tube marks a transitory cell population between ventricular zone (VZ) and mantle zone (MZ) that has exited the cell cycle and begun to express markers of postmitotic neurons such as SCG10 (Fig. 1A–D). We and others have previously shown that Prox1, in these cells, acts to suppress proliferation and induce generic aspects of early neuronal differentiation in the interneuron lineage (Misra et al., 2008; Kaltezioti et al., 2010). In contrast, in the ventral spinal cord the pattern of Prox1 expression is significantly different. In particular, Prox1 is not detected in the majority of progenitor and postmitotic MNs in chick and mouse neural tube during neurogenic phase of embryonic development (Fig. 1). Most importantly, Prox1 expression is largely excluded from Olig2+ cells. Thus, Prox1 and Olig2 costainings in developing chick and mouse neural tube revealed that Olig2 expression appears first at early developmental stages (Fig. 1 A,E,I) and then Prox1 expression follows at a slightly later stage (Fig. 1). Few double-positive cells are observed in the boundaries between pMN and p2 domains (Fig. 1F–H,J,K, arrows). Olig2 is a key player in this specification decision by inducing the pMN fate (Mizuguchi et al., 2001; Novitch et al., 2001; Takebayashi et al., 2002; Lee et al., 2005; Briscoe and Novitch, 2008). Therefore, Olig2 might be initially expressed in naive progenitors that have not yet been engaged in a specific lineage, and upon V2 specification Prox1 is expressed in these progenitors to suppress Olig2 expression, inhibit MN identity, and allow V2 interneuron specification. To initially test this scenario, we performed lineage-tracing experiments using Olig2Cre/+ knock-in mice in which one allele of Olig2 is replaced with the Cre recombinase gene (Fig. 2A; Wu et al., 2006; Dessaud et al., 2007, 2008, 2010; J. A. Chen et al., 2011). First, by analyzing Olig2Cre/+;ROSA26-loxP-STOP-loxP-RFP embryos at E8.5, we demonstrated that RFP is only detected in Olig2+ cells and confirmed that Prox1 is not expressed at this stage (Fig. 2B), while on E10.5 RFP is also detected in Olig2-/Nkx6.1+ cells of the p2 progenitor domain dorsally to pMN (Fig. 2C), supporting previous reports that suggest Olig2 is transiently expressed in a subset of p2 progenitors during spinal cord development (Wu et al., 2006; Dessaud et al., 2007, 2008, 2010; J. A. Chen et al., 2011). Second, we were able to detect Prox1+/RFP+ cells exactly above the pMN domain (Fig. 2D,E), indicating that Prox1 is indeed expressed in progenitor cells that have previously expressed Olig2. Together, these results suggest that Olig2 is transiently expressed in a subset of ventral progenitors that will later become Prox1+, downregulate Olig2, and acquire p2 fate. Moreover, this scenario is consistent with the previously reported data indicating that a common pool of naive progenitors appears early in development that will then be segregated into separate lineages, either MN or V2 interneuron (Wu et al., 2006; Dessaud et al., 2007, 2008, 2010; J. A. Chen et al., 2011).
Figure 1.
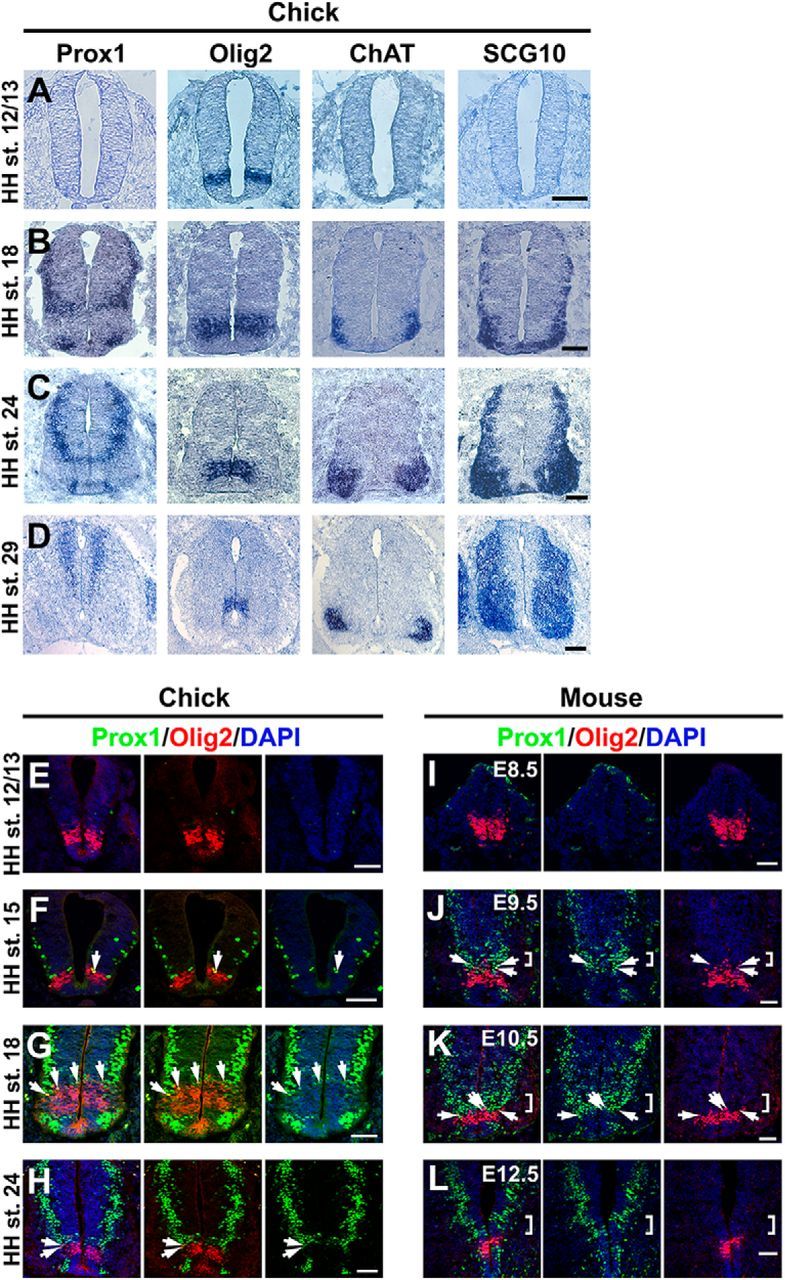
Spatiotemporal expression patterns of Prox1 and Olig2 in chick and mouse neural tube. A–D, In situ hybridizations with Prox1 and comparison with Olig2, ChAT, and SCG10 on adjacent cryosections from HH stages 12/13 (A), 18 (B), 24 (C), and 29 (D) chick spinal cord. E–H, Double immunostainings of Prox1 (green) and Olig2 (red) in HH stage 12/13 (E), HH stage 15 (F), HH stage 18 (G), and HH stage 24 (H) chick spinal cord. The arrows indicate cells that coexpress Prox1 and Olig2. I–L, Double immunostainings of Prox1 (green) and Olig2 (red) in E8.5 (I), E9.5 (J), E10.5 (K), and E12.5 (L) mouse spinal cord. The square brackets indicate the Prox1+ cells, exactly above the Olig2+ cells in the p2 domain. The arrows indicate cells that coexpress Prox1 and Olig2. Scale bars: A–C, 50 μm; D, 100 μm; E–L, 50 μm.
Figure 2.
Lineage-tracing experiments using Olig2Cre/+ knock-in mice. A, Schematic representation of the Olig2 lineage-tracing experiments. Progenitor cells of the ventral spinal cord that express Olig2 and all their progeny are marked by RFP expression in Olig2Cre/+;ROSA26-loxP-STOP-loxP-RFP embryos. Analyses of these embryos are presented in B–E. B, Triple immunostaining of Olig2 (green), RFP (red), and Prox1 (gray) in E8.5 mouse spinal cord. The brackets indicate the Olig2/RFP expression domain that is characterized by the absence of Prox1-expressing cells at this early stage. C, Triple immunostaining of Olig2 (green), Nkx6.1 (blue), and RFP (red) in E10.5 mouse spinal cord. The brackets indicate the p2 (Nkx6.1+ and Olig2−) and pMN (Nkx6.1+ and Olig2+) domains, as indicated. Note that RFP+ cells are detected into the p2 domain. D, E, Double immunostainings of Prox1 (green) and RFP (red) in E10.5 (D) or E13.5 (E) mouse spinal cords. The arrows indicate cells that coexpress Prox1 and RFP. Scale bars: 50 μm.
In agreement with this scenario, cells exactly above the MN domain express Prox1 into the zone of highly proliferating progenitors of the VZ in both chick and mouse spinal cord (Figs. 1, 3A,I,J). These Prox1+ cells, by striking contrast to all other Prox1+ cells along the dorsoventral axis, indicate characteristics of mitotic VZ progenitor cells (Sox2+ or Ki67+; Fig. 3A,I,J, brackets), probably marking a cell population that corresponds to V2 progenitors (p2 domain). We confirmed this notion by showing that Prox1+ cells in the VZ are Nkx6.1+, Irx3+, and Olig2− in the early chick spinal cord, indicating the expression of Prox1 in p2 domain (Fig. 3B–D). Furthermore, double immunostainings during later stages for endogenous Prox1 and Chx10 or Gata3, markers for postmitotic V2a and V2b interneurons, respectively, showed partial colocalization with both markers in the border between VZ and MZ, suggesting that Prox1 is expressed in the lineages of V2a and V2b interneurons (Fig. 3E–H). Similarly, in the mouse spinal cord, Prox1+ cells are Nkx6.1+, Olig2−, and Nkx6.2− (a marker for p1 domain) in the VZ (Fig. 3K,L, brackets), as well as Chx10+ (V2a), Gata3+ (V2b), and Sox1+ (V2c) in the MZ (Fig. 3M–O). By measuring the number of dorsal Prox1+/Nkx6.1+/Olig2− cells versus total dorsal Nkx6.1+/Olig2− cells (p2 progenitors), we concluded that Prox1 is expressed in the 74.5 ± 8.9% (n = 5) of p2 progenitors at E10.5. These observations indicate that Prox1 is expressed in V2 lineage (p2 and V2 domains) and largely excluded from p1 domain and MN lineage (pMN and MN domains; Fig. 3P). Collectively, these data lead to the intriguing hypothesis that Prox1 may negatively regulate Olig2 gene expression to suppress MN identity and promote V2 interneuron differentiation.
Figure 3.
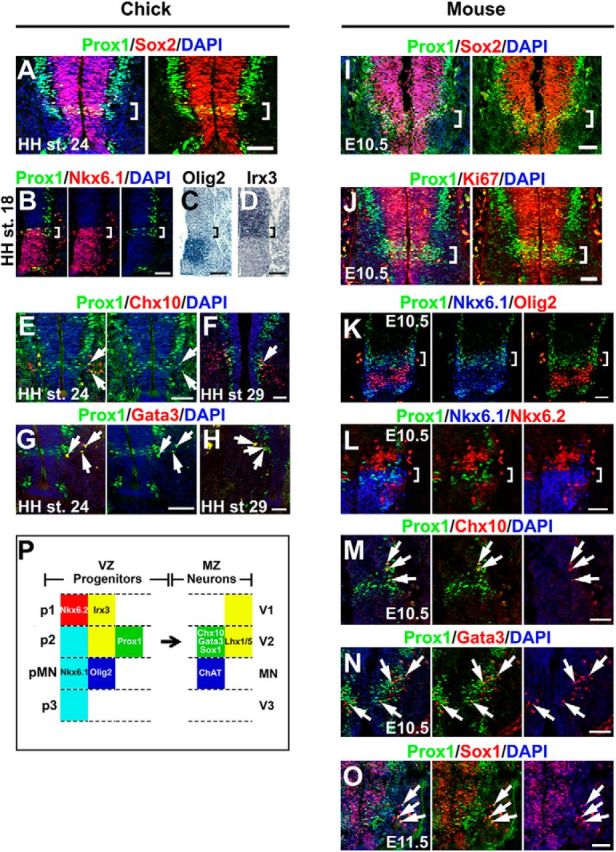
Prox1 is expressed in the V2 interneuron progenitors in embryonic chick and mouse spinal cord. A, Double immunostaining of Prox1 (green) and Sox2 (red) in HH stage 24 chick spinal cord. The square brackets indicate the expression of Prox1 in the proliferating cells of the VZ, Prox1+/Sox2+ cells, exactly above the MN domain. B–D, Double immunostaining of Prox1 (green) and Nkx6.1 (red; B) and in situ hybridizations for Olig2 (C) and Irx3 (D) on adjacent cryosections from HH stage 18 chick spinal cord. The square brackets indicate the Prox1+ cells in p2 domain (Nkx6.1+, Olig2−, and Irx3+). E–H, Double immunostainings of Prox1 (green) and Chx10 (red; E, F) or Gata3 (red; G, H) in HH stages 24 (E, G) and 29 (F, H) chick spinal cord. The arrows indicate cells that coexpress Prox1 and the V2a interneuron marker, Chx10, or the V2b marker, Gata3. The partial colocalization could be explained by the previous observations that Prox1 expression is downregulated before acquisition of terminal neuronal identity in spinal cord interneurons (Misra et al., 2008; Kaltezioti et al., 2010). I, Double immunostaining of Prox1 (green) and Sox2 (red) in E10.5 mouse spinal cord. The square brackets indicate the expression of Prox1 in the proliferating cells of the VZ, Prox1+/Sox2+ cells, exactly above the MN domain. J, Double immunostaining of Prox1 (green) and Ki67 (red) in E10.5 mouse spinal cord. The square brackets indicate the expression of Prox1 in the proliferating cells of the VZ, Prox1+/Ki67+ cells, exactly above the MN domain. K, Triple Prox1 (green), Nkx6.1 (blue), and Olig2 (red) immunostaining in E10.5 mouse spinal cord. The square brackets indicate the Prox1+ cells in p2 domain (Nkx6.1+ and Olig2−). L, Triple Prox1 (green), Nkx6.1 (blue), and Nkx6.2 (red) immunostaining in E10.5 mouse spinal cord. The square brackets indicate the Prox1+ cells in p2 domain (Nkx6.1+ and Nkx6.2−). M–O, Double immunostaining of Prox1 and Chx10 (M), Gata3 (N), or Sox1 (O) in E10.5 or E11.5 mouse spinal cords, as indicated. The arrows indicate the cells that coexpress Prox1 and Chx10 (V2a), Gata3 (V2b), and Sox1 (V2c). The partial colocalization could be explained by the previous observations that Prox1 expression is downregulated before acquisition of terminal neuronal identity in spinal cord interneurons (Misra et al., 2008; Kaltezioti et al., 2010). P, In the schematic diagram, we summarize the experimental data showing that Prox1 is expressed in the p2 domain of VZ. Scale bars: 50 μm.
Prox1 directly suppresses Olig2 gene expression
To explore this hypothesis, we used an in vitro culture system using NPCs derived from embryonic mouse spinal cord (Politis et al., 2007b; Kaltezioti et al., 2010). Similar to the in vivo situation (Fig. 1E–L), endogenous Prox1 expression is excluded from Olig2+ NPCs (Fig. 4A–C). Most significantly, forced expression of Prox1 in NPCs was sufficient to block Olig2 expression in a cell-autonomous manner (GFP: 31.3 ± 1.4 vs Prox1: 3.8 ± 1.2, n = 5, p < 0.001; Fig. 4D–F). Conversely, shRNA-mediated knock-down of Prox1 increased the percentage of Olig2+ cells (shControl: 32.9 ± 1.8 vs shProx1: 43.4 ± 2.0, n = 5, p < 0.05) and Olig2 mRNA expression (shControl: 1 ± 0.18 vs shProx1: 1.9 ± 0.53, n = 5, p < 0.05; Fig. 4G–J). On the other hand, Olig2 overexpression strongly repressed Prox1 expression (GFP: 14.0 ± 2.4 vs Olig2: 1.2 ± 0.5, n = 4, p < 0.001; Fig. 4K–M). Moreover, previously published ChIP-Seq data from another group suggest that Olig2 directly interacts with the Prox1 gene locus during MN differentiation (Mazzoni et al., 2011), which additionally supports our hypothesis of a direct cross-inhibitory regulation.
Figure 4.
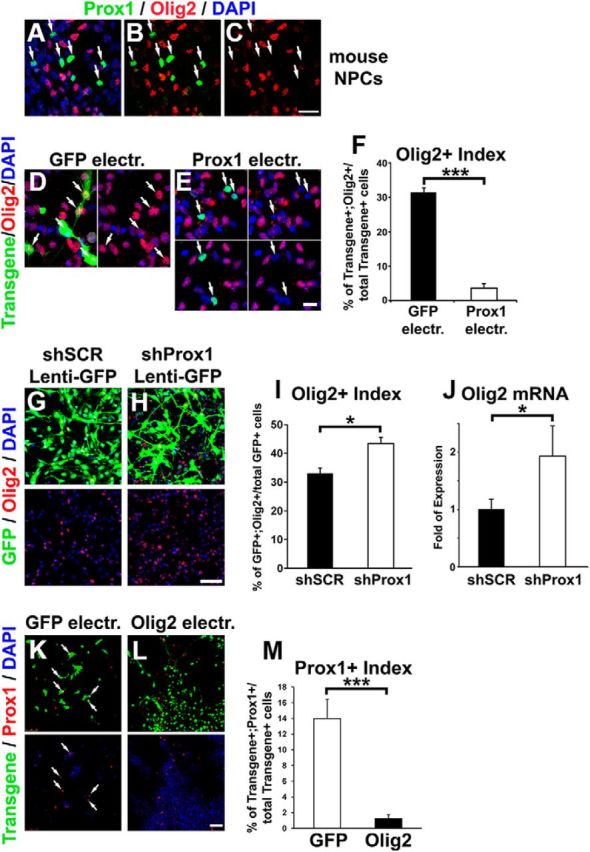
Prox1 is sufficient and necessary for proper regulation of Olig2 expression in NPCs derived from mouse spinal cord. A–C, Double Prox1 (green) and Olig2 (red) immunostaining of NPCs isolated from E12.5 mouse spinal cord and cultured in vitro. The Prox1+/Olig2− cells are indicated with arrows. D, E, Double GFP/Olig2 (D) and Flag/Olig2 (E) immunostainings of mouse NPCs electroporated with GFP or Prox1, respectively. Prox1 was detected with the anti-Flag antibody. Arrows indicate the transgene-positive cells. F, Quantification of the transgene+ cells that are Olig2+ (percentage of transgene+;Olig2+/total transgene+). *** p < 0.001 (t test), n = 5. G, H, Double GFP/Olig2 immunostainings of mouse NPCs infected with lentiviruses overexpressing GFP and either scramble shRNA (shSCR, G) or shRNA targeting murine Prox1 (shProx1, H). The efficiency of shProx1 vector has been previously shown (Foskolou et al., 2013). I, Quantification of the GFP+ cells that are Olig2+ in NPCs infected with GFP-shSCR or GFP-shProx1 lentiviruses, as indicated (percentage of GFP+;Olig2+/total GFP+). *p < 0.05 (t test), n = 5. J, Real-time RT-PCR analysis for Olig2 gene expression in mouse NPCs infected with GFP-shSCR or GFP-shProx1 lentiviruses, as indicated, *p < 0.05 (t test), n = 5. K, L, Double GFP/Prox1 (K) or myc/Prox1 (L) immunostainings of mouse NPCs electroporated with GFP or Olig2 (carrying the myc tag), respectively. Double-positive cells are indicated with the white arrows. M, Quantification of transgene+ cells that are Prox1+ (percentage of transgene+;Prox1+/total transgene+) in NPCs electroporated with GFP or Olig2. ***p < 0.001 (t test), n = 4. Scale bars: A–C, 20 μm; D, E, 10 μm; G, H, K, L, 50 μm.
We next investigated whether physiological levels of endogenous Prox1 are sufficient to allow binding at the regulatory elements of Olig2 gene in vivo. Two basic DNA regulatory units have been described for the murine Olig2 gene: the minimal 1.1 kb promoter, which confers basal transcription activity independent of the cellular context (C. T. Chen et al., 2008; Zhang et al., 2008), and the K23 enhancer, located ∼10 kb downstream of the gene (Fig. 5A; Sun et al., 2006). K23 enhancer specifically directs the expression of Olig2 in the MN lineage (Sun et al., 2006). By performing in vivo ChIP experiments using chromatin prepared from spinal cords of E12.5 mouse embryos, we showed that endogenous Prox1 protein directly interacts with the proximal 1.1 kb promoter (aProx1: 0.126 ± 0.013 vs aIgG: 0.012 ± 0.009, n = 4, p < 0.001) and K23 enhancer (aProx1: 0.098 ± 0.009 vs aIgG: 0.022 ± 0.005, n = 4, p < 0.01), but not with control sequences, including the distal 1.1 kb promoter (aProx1: 0.047 ± 0.010 vs aIgG: 0.039 ± 0.014, n = 4, n.s.: p > 0.05), the very distal genomic region (vDistal, 64.8 kb upstream of Olig2; aProx1: 0.032 ± 0.013 vs aIgG: 0.024 ± 0.017, n = 4, n.s.: p > 0.05), and the 3′-end of Olig2 (3′-UTR; aProx1: 0.017 ± 0.004 vs aIgG: 0.021 ± 0.011, n = 4, n.s.: p > 0.05). Likewise, control IgGs were not able to precipitate the proximal 1.1 kb promoter or K23 enhancer, suggesting a specific and direct interaction between Prox1 and Olig2 gene regulatory elements (Fig. 5B).
To further evaluate these interactions, we created a set of luciferase constructs with 1.1 kb promoter and K23 enhancer (Fig. 5C), and performed transcriptional assays in NPCs and Neuro2A neuroblastoma (N2A) cells. First, by inserting the 1.1 kb promoter upstream of the luciferase reporter gene, we confirmed its ability to confer strong promoter activity in NPCs and N2A, compared with empty vector (PRless; Figs. 5D,G, respectively) or SV40, a strong viral promoter (1.1 kb: 1 ± 0.09 vs SV40: 0.34 ± 0.09, n = 4, p < 0.01; Fig. 5G). Most importantly, Prox1 was able to suppress the activity of 1.1 kb Luc construct in NPCs and N2A cells by 54.6% (GFP control: 0.51 ± 0.08 vs Prox1: 0.23 ± 0.02, n = 4, p < 0.01) and 77.9% (GFP control: 1 ± 0.09 vs Prox1: 0.22 ± 0.04, n = 4, p < 0.001), respectively (Fig. 5D,H). Second, by inserting the K23 enhancer upstream of the 1.1 kb, we showed that K23 is able to further increase transcription of this promoter in NPCs, consistent with an enhancer function. Notably, this activity was efficiently blocked by Prox1 overexpression (GFP control: 1 ± 0.05 vs Prox1: 0.15 ± 0.04, n = 4, p < 0.01; Fig. 5D). Similar repression by Prox1 was observed when K23 was fused with the SV40 minimal promoter instead of the 1.1 kb (GFP control: 1 ± 0.2 vs Prox1: 0.27 ± 0.15, n = 4, p < 0.001; Fig. 5E, right pair of columns), whereas the control construct carrying only the SV40 minimal promoter remained unaffected (GFP control: 0.56 ± 0.07 vs Prox1: 0.49 ± 0.08, n = 4, n.s.: p > 0.05; Fig. 5E, left pair of columns). Furthermore, deletion of either the DNA binding domain (ΔDBD) or the repression domain (ΔRD), which is specifically required for the repressive function of Prox1 (Steffensen et al., 2004; Kaltezioti et al., 2010), was sufficient to relieve the Prox1-mediated suppression of K23 transcription activity in NPCs (Prox1: 0.17 ± 0.03 vs ΔDBD: 0.74 ± 0.2 and Prox1: 0.17 ± 0.03 vs ΔRD: 0.79 ± 0.26, respectively; for both deletion constructs n = 4, p < 0.01; Fig. 5F), indicating that these domains are necessary for Prox1-mediated suppression of Olig2.
Ectopic expression of Prox1 suppresses Olig2 expression and MN generation in vivo
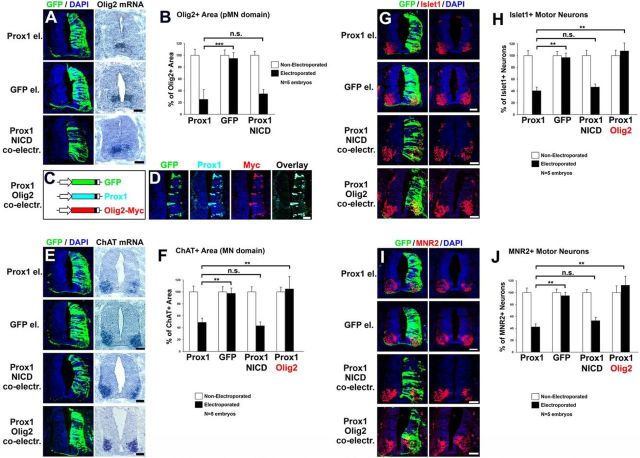
To further evaluate the ability of Prox1 to suppress Olig2 in vivo, we misexpressed Prox1 unilaterally in the chick neural tube by in ovo electroporation. Accordingly, Prox1 misexpression in the pMN domain efficiently blocked the expression of Olig2 at the mRNA level 48 h after electroporation (a.e.; Prox1: 25.3 ± 12.8 vs GFP: 94.7 ± 9.9, n = 5, p < 0.001; Fig. 6A,B) or 24 h a.e. (Prox1: 20.7 ± 13.6 vs GFP: 92.6 ± 17.1, n = 4, p < 0.01; data not shown) and protein level 24 h a.e. (Prox1: 18.7 ± 9.4 vs GFP: 97.8 ± 15.2, n = 4, p < 0.001; Fig. 8A,B). Consistent with this effect on Olig2 and the fact that Olig2 is the master regulator for MN generation (Mizuguchi et al., 2001; Novitch et al., 2001; Takebayashi et al., 2002; Lee et al., 2005; Briscoe and Novitch, 2008), a strong reduction in the number of MNs was also observed. In particular, a striking reduction in the expression of ChAT marker for mature MNs by 49.9% was observed in the ventral neural tube of Prox1-electroporated embryos 48 h a.e., compared with control GFP-electroporated embryos (Prox1: 48.8 ± 7.3 vs GFP:97.5 ± 8.9, n = 5, p < 0.01; Fig. 6E,F). A concomitant reduction in the expression of earlier markers in the MN lineage was also evident, including the transcription factors Islet1 and MNR2 by 58.3% (Prox1: 40.3 ± 6.3 vs GFP: 96.7 ± 7.6, n = 5, p < 0.01) and 55.4% (Prox1: 42.3 ± 5.3 vs GFP: 94.8 ± 5.9, n = 5, p < 0.01), respectively (Fig. 6G–J). In addition, no evidence of apoptosis was observed 48 h a.e. in the neural tube or specifically in the pMN or MN domain (Kaltezioti et al., 2010; data not shown), excluding the possibility that cells were depleted due to an apoptotic effect of Prox1. These observations suggest that Prox1 is sufficient to suppress the generation of MNs via its ability to repress Olig2 expression. To exclude the possibility that this effect is mediated by the negative action of Prox1 on Notch1 signaling (Kaltezioti et al., 2010), since genetic inactivation of Notch1 from NPCs suppresses MN identity and induces V2 (Yang et al., 2006), we performed co-overexpression experiments with the constitutively active intracellular domain of mammalian Notch1 (NICD). Thus, coexpression of NICD was not sufficient to rescue the effect of Prox1 on MN generation (for ChAT, Prox1-NICD: 43.2 ± 6.8 vs Prox1: 48.8 ± 7.3; for Islet1, Prox1-NICD: 46.6 ± 5.1 vs Prox1: 40.3 ± 6.3; for MNR2, Prox1-NICD: 52.9 ± 5.9 vs Prox1: 42.3 ± 5.3; for all markers n = 5 and n.s.: p > 0.05; Fig. 6E–J). On the contrary, coexpression of Olig2 was sufficient to rescue the negative action of Prox1 in MN generation (for ChAT, Prox1-Olig2: 105.1 ± 20.7 vs Prox1: 48.8 ± 7.3; for Islet1, Prox1-Olig2: 108.1 ± 13.5 vs Prox1: 40.3 ± 6.3; for MNR2, Prox1-Olig2: 112.6 ± 15.1 vs Prox1: 42.3 ± 5.3; for all markers n = 5 and p < 0.01; Fig. 6C,D,E–J), indicating that Prox1-mediated suppression of Olig2 is responsible for the negative effect of Prox1 on MN generation. Additionally, coexpression of NICD was not sufficient to rescue the effect of Prox1 on repressing Olig2 (Prox1-NICD: 34.7 ± 9.9 vs Prox1: 25.3 ± 12.8, n = 5; n.s.: p > 0.05; Fig. 6A,B), excluding an action of Prox1 on Olig2 via its ability to counteract Notch1 signaling. Collectively, this evidence suggests that Prox1 inhibits MN generation via Olig2 repression.
Figure 6.
Prox1 is sufficient for the suppression of Olig2 gene expression and inhibition of MN generation in vivo. A, GFP/DAPI staining and in situ hybridization for Olig2 in consecutive sections 48 h a.e. with Prox1/GFP, GFP alone, or Prox1/GFP and NICD. B, Quantitative analysis of the Olig2+ area using ImageJ software. The data are presented as percentage of the nonelectroporated side of the spinal cord. For Prox1 versus GFP alone: ***p < 0.001 (t test), n = 5; for Prox1 versus Prox1+ NICD: n.s. p > 0.05 (t test), n = 5. All cases referred to the electroporated side. C, Schematic representation of the GFP, Prox1, and Olig2 expression vectors. Note that Olig2 is tagged with Myc epitope and thus can be detected with anti-Myc immunostaining. D, Triple immunofluorescence analysis on spinal cord section with GFP, Prox1, and Myc 48 h a.e. with Prox1/GFP/Olig2, as indicated. E, GFP/DAPI staining and in situ hybridization for ChAT in consecutive sections 48 h a.e. with Prox1/GFP, GFP alone, Prox1/GFP and NICD, or Prox1/GFP and Olig2. F, Quantitative analysis of the ChAT+ area using ImageJ software. These data are presented as percentage of the nonelectroporated side of the spinal cord. For Prox1 versus GFP alone: **p < 0.01 (t test), n = 5; for Prox1 versus Prox1 + NICD: n.s. p > 0.05 (t test), n = 5; for Prox1 versus Prox1 + Olig2: **p < 0.01 (t test), n = 5. All cases referred to the electroporated side. G, Double GFP/Islet1 immunostainings in cryosections 48 h a.e. with Prox1/GFP, GFP alone, Prox1/GFP and NICD, or Prox1/GFP and Olig2. H, Quantitative analysis of the number of Ιslet1+ MNs. These data are presented as percentage of cells of the nonelectroporated side of spinal cord. For Prox1 versus GFP: **p < 0.01 (t test), n = 5; for Prox1 versus Prox1 + NICD: n.s. p > 0.05 (t test), n = 5; for Prox1 versus Prox1 + Olig2: **p < 0.01 (t test), n = 5. All cases referred to the electroporated side. I, Double GFP/MNR2 immunostainings in cryosections 48 h a.e. with Prox1/GFP, GFP alone, Prox1/GFP and NICD, or Prox1/GFP and Olig2. J, Quantitative analysis of the number of MNR2+ MNs. These data are presented as percentage of cells of the nonelectroporated side of the spinal cord. For Prox1 versus GFP: **p < 0.01 (t test), n = 5; for Prox1 versus Prox1 + NICD: n.s. p > 0.05 (t test), n = 5; for Prox1 versus Prox1 + Olig2: **p < 0.01 (t test), n = 5. All cases referred to the electroporated side. Scale bars: 50 μm.
Figure 8.
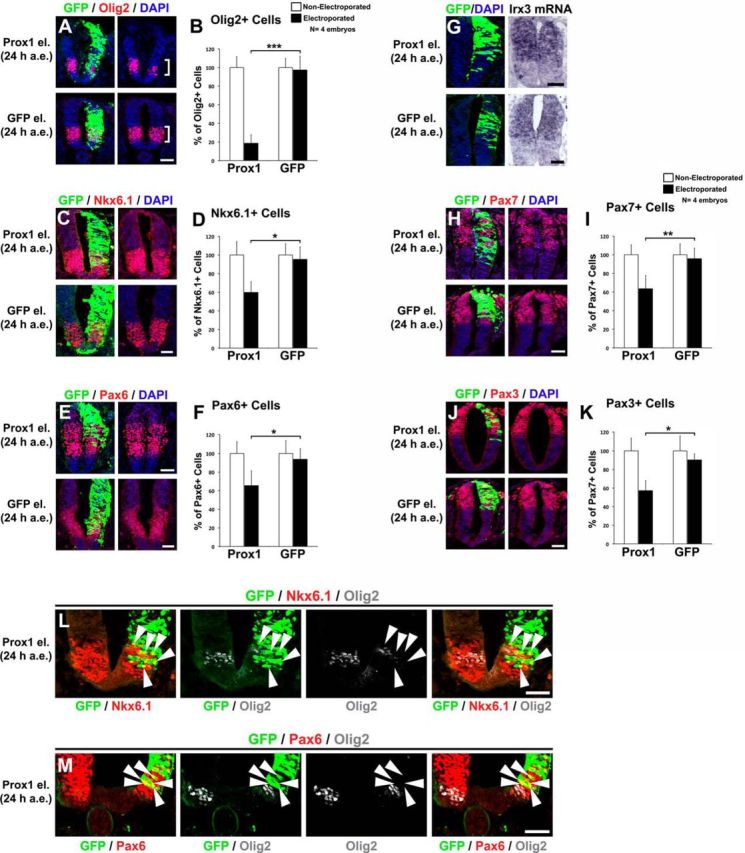
Comparison of Prox1-mediated effect on Olig2 expression with that on other markers for neural progenitors, including Nkx6.1, Pax6, Irx3, Pax7, and Pax3. A, Double GFP/Olig2 immunostainings in cryosections 24 h a.e. with Prox1/GFP (top) or GFP alone (bottom). The square brackets indicate the pMN domain. Note the strong reduction of Olig2+ cells in the pMN domain. B, Quantitative analysis of the number of Olig2+ MNs. These data are presented as percentage of cells of the nonelectroporated side of the spinal cord. For Prox1 versus GFP, ***p < 0.001 (t test), n = 4. All cases referred to the electroporated side. C, Double GFP/Nkx6.1 immunostainings in cryosections 24 h a.e. with Prox1/GFP (top) or GFP alone (bottom). D, Quantitative analysis of the number of Nkx6.1+ cells. These data are presented as percentage of cells of the nonelectroporated side of the spinal cord. For Prox1 versus GFP, *p < 0.05 (t test), n = 4. All cases referred to the electroporated side. E, Double GFP/Pax6 immunostainings in cryosections 24 h a.e. with Prox1/GFP (top) or GFP alone (bottom). F, Quantitative analysis of the number of Pax6+ cells. These data are presented as percentage of cells of the nonelectroporated side of the spinal cord. For Prox1 versus GFP, *p < 0.05 (t test), n = 4. All cases referred to the electroporated side. G, GFP/DAPI staining and in situ hybridization for Irx3 in consecutive sections 24 h a.e. with Prox1/GFP (top) or GFP alone (bottom). H, Double GFP/Pax7 immunostainings in cryosections 24 h a.e. with Prox1/GFP (top) or GFP alone (bottom). I, Quantitative analysis of the number of Pax7+ cells. These data are presented as percentage of cells of the nonelectroporated side of the spinal cord. For Prox1 versus GFP, **p < 0.01 (t test), n = 4. All cases referred to the electroporated side. J, Double GFP/Pax3 immunostainings in cryosections 24 h a.e. with Prox1/GFP (top) or GFP alone (bottom). K, Quantitative analysis of the number of Pax3+ cells. These data are presented as percentage of cells of the nonelectroporated side of the spinal cord. For Prox1 versus GFP, *p < 0.05 (t test), n = 4. All cases referred to the electroporated side. L, Triple immunostaining of GFP (green), Nkx6.1 (red), and Olig2 (gray; artificially pseudocolored after confocal analysis) in cryosection 24 h a.e. with Prox1/GFP. The arrowheads indicate the GFP+, Nkx6.1+, and Olig2− cells into the Nkx6.1 expression domain. Note the strong reduction in the Olig2 expression. M, Triple immunostaining of GFP (green), Pax6 (red), and Olig2 (gray; artificially pseudocolored after confocal analysis) in cryosection 24 h a.e. with Prox1/GFP. The arrowheads indicate the GFP+, Pax6+, and Olig2− cells into the Pax6 expression domain. Scale bars: 50 μm.
Furthermore, to test whether these in vivo actions of Prox1 are mediated through its ability to regulate Olig2 transcription, we used the ΔDBD-Prox1 overexpression construct in chick neural tube. In good agreement with the transcriptional assays in ex vivo cultured NPCs (Fig. 5F), misexpression of the ΔDBD-Prox1 in the chick neural tube was not able to recapitulate the effect of WT-Prox1 (Fig. 7). Specifically, the mutant Prox1 version could not suppress Olig2 gene expression (ΔDBD Prox1: 94.9 ± 5.1 vs Prox1: 25.3 ± 12.8, n = 3 and p < 0.01; Fig. 7C,D) or MN identity (for ChAT, ΔDBD Prox1: 97.7 ± 7.3 vs Prox1: 48.8 ± 7.3; for Islet1, ΔDBD Prox1: 94.9 ± 4.9 vs Prox1: 40.3 ± 6.3; for MNR2, ΔDBD Prox1: 96.7 ± 8.1 vs Prox1: 42.3 ± 5.3; for all markers n = 3 and p < 0.01; Fig. 7E–J), further showing that the Prox1 effect on Olig2 and MNs is achieved via its ability to regulate transcription.
Figure 7.
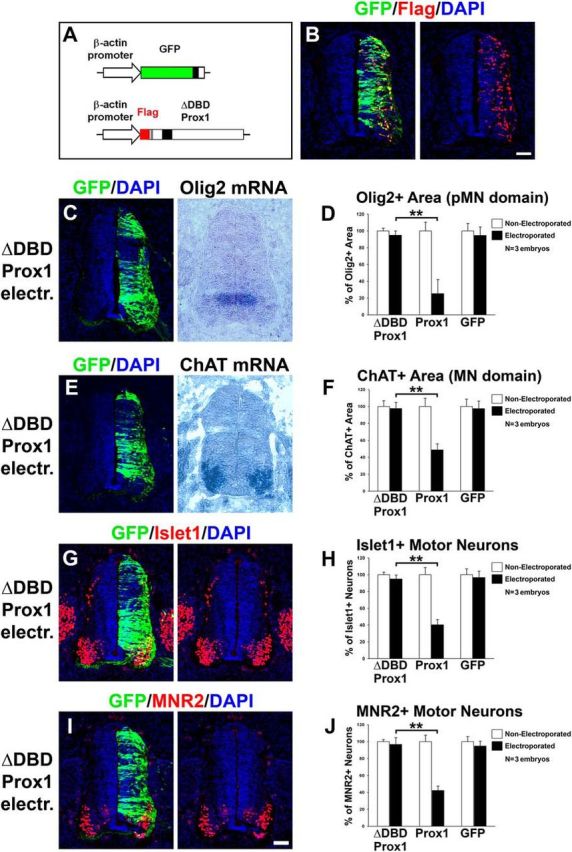
DBD domain of Prox1 is required in vivo for the Prox1-mediated effect on inhibiting Olig2 expression and MN generation. A, Schematic representation of the ΔDBD-Prox1 expression vector. Note that ΔDBD-Prox1 is tagged with Flag epitope and thus can be detected with anti-Flag immunostaining. B, Double immunofluorescence analysis on spinal cord section with GFP and Flag 48 h a.e. with ΔDBD-Prox1/GFP, as indicated. C, GFP/DAPI staining and in situ hybridization for Olig2 mRNA in consecutive sections 48 h a.e. with ΔDBD-Prox1. D, Quantitative analysis of the Olig2+ area. These data are presented as percentage of the nonelectroporated side of the spinal cord. The data for Prox1 and GFP electroporations are as in Figure 6B, and presented here for comparison. For ΔDBD-Prox1 versus Prox1, **p < 0.01 (t test), n = 3 embryos. All cases referred to the electroporated side. E, GFP/DAPI staining and in situ hybridization for ChAT mRNA in consecutive sections 48 h a.e. with ΔDBD-Prox1. F, Quantitative analysis of the ChAT+ area. These data are presented as percentage of the nonelectroporated side of the spinal cord. The data for Prox1 and GFP electroporations are as in Figure 6F, and presented here for comparison. For ΔDBD-Prox1 versus Prox1, **p < 0.01 (t test), n = 3 embryos. All cases referred to the electroporated side. G–J, Double immunostainings for GFP/Islet1 (G) and GFP/MNR2 (I) 48 h a.e. with ΔDBD-Prox1. H, J, Quantitative analysis of the number of Islet1+ MNs (H) and MNR2+ MNs (J). These data are presented as percentage of the nonelectroporated side. The data for Prox1 and GFP electroporations are as in Figure 6, H and J, respectively, and presented here for comparison. For Islet1+: ΔDBD-Prox1 versus Prox1, **p < 0.01 (t test), n = 3 embryos; for MNR2+: ΔDBD-Prox1 versus Prox1, **p < 0.01 (t test), n = 3 embryos. All cases referred to the electroporated side. Scale bars: 50 μm.
We then wanted to investigate whether Prox1 affects the expression of other progenitor markers in a manner similar to Olig2. Considering the strong prodifferentiation effect of Prox1 on NPCs (Misra et al., 2008; Kaltezioti et al., 2010), we expected a reduction in the expression of all these markers. However, the question that we sought to answer was whether this reduction is similar to that of Olig2. For this reason, we performed our analysis in the early time point of 24 a.e. to minimize the effect of Prox1 on inducing neuronal differentiation, which is evident at 48 h a.e. (Misra et al., 2008; Kaltezioti et al., 2010). As expected, Prox1 was sufficient to repress the expression of all markers tested, including Nkx6.1 (Prox1: 59.8 ± 11.5 vs GFP: 95.3 ± 13.2, n = 4, p < 0.05; Fig. 8C,D), Pax6 (Prox1: 65.5 ± 15.8 vs GFP: 93.7 ± 11.4, n = 4, p < 0.05; Fig. 8E,F), Irx3 (Fig. 8G), Pax7 (Prox1: 63.5 ± 14.1 vs GFP: 95.7 ± 11.3, n = 4, p < 0.01; Fig. 8H,I), and Pax3 (Prox1: 57.2 ± 10.9 vs GFP: 90.2 ± 6.5, n = 4, p < 0.05; Fig. 8J,K). Interestingly, the ability of Prox1 to repress Olig2 expression was much more striking compared with all other markers in the same experimental system (Prox1: 18.7 ± 9.4 vs GFP: 97.8 ± 15.2, n = 4, p < 0.001; Fig. 8A,B). In particular, the Prox1-mediated reduction of Olig2 was 80.8% compared with 37.2% for Nkx6.1, 30.1% for Pax6, 33.7% for Pax7, and 36.6% for Pax3, suggesting a distinct mode of action of Prox1 on Olig2. In accordance with these observations, we were able to identify double GFP+/Nkx6.1+ cells and GFP+/Pax6+ cells but not double GFP+/Olig2+ cells in the same sections after Prox1 electroporation (Fig. 8L,M, arrowheads). Overall, these data further corroborate and support a direct effect of Prox1 on Olig2 gene regulation.
Prox1 expression is necessary for suppression of Olig2 expression and MN identity in the spinal cord
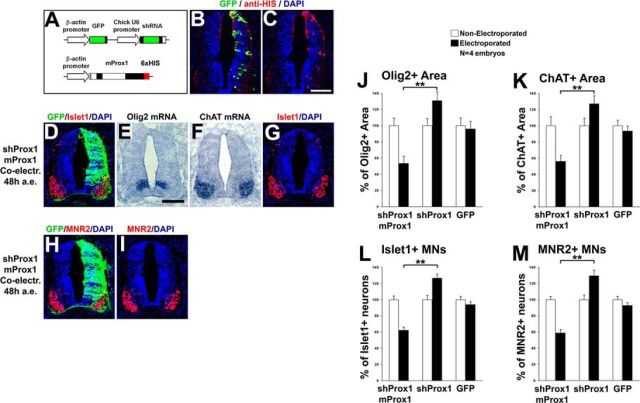
We next examined the requirement of Prox1 for suppressing Olig2 expression and MN generation. To inhibit Prox1 expression, we used a previously published set of shRNA vectors (Kaltezioti et al., 2010; Das et al., 2006). The effective knock-down of endogenous chick Prox1 in the neural tube by these vectors has been previously assessed (Kaltezioti et al., 2010) and verified here (Fig. 9A–C). Conversely to overexpression experiments, shRNA-mediated knockdown of Prox1 caused an expansion in Olig2 expression domain toward the dorsal area of V2 progenitors, either 48 h a.e. (shProx1: 131 ± 10.9 vs shControl: 97.6 ± 9.9, n = 5, p < 0.05; Fig. 9D–F) or 24 h a.e. (shProx1: 121.2 ± 7.6 vs shControl: 94.2 ± 10.4, n = 5, p < 0.05; Fig. 9G–J). This effect was specific for Prox1 depletion since a control nontargeting construct did not alter the expression of Olig2 (Fig. 9D–F,I,J). Consistently, knock-down of Prox1 clearly enlarged the expression domain of ChAT in the ventral spinal cord by 37.4% compared with shControl (shProx1: 127 ± 9.9 vs shControl: 92.4 ± 12.9, n = 5, p < 0.05; Fig. 10A,B). Moreover, the numbers of ventral Islet1+ and MNR2+ cells were increased upon Prox1 ablation by 34.6% (shProx1: 126.7 ± 4.6 vs shControl: 94.1 ± 3.3, n = 5, p < 0.05) and 36.8% (shProx1: 129.4 ± 6.6 vs shContol: 94.6 ± 4.7, n = 5, p < 0.05), respectively (Fig. 10C–F), indicative of a positive effect on the generation of MNs. Conversely, the number of dorsal Islet1+ cells that comprise a cell population of dorsal interneurons (dI3) was strongly reduced by 52% (shProx1: 45.8 ± 7.6 vs shControl: 95.5 ± 9.3, n = 5; p < 0.01) in the same sections (Fig. 10C, arrow), suggesting that the shProx1-mediated induction in the numbers of MNs is specific for this neuronal lineage. To exclude off-target effects, the Prox1-shRNA construct was co-electroporated with a rescue construct containing the murine Prox1 coding sequence, which is not targeted by the chick Prox1-shRNA sequence (Fig. 11A–C; Kaltezioti et al., 2010). Coexpression of murine Prox1 was sufficient to block the Prox1-shRNA-mediated induction of Olig2 (shProx1-mProx1: 53.5 ± 8.6 vs shProx1: 131 ± 10.9, n = 4, p < 0.01) and MN markers, ChAT (shProx1-mProx1: 56.1 ± 7.2 vs shProx1: 127 ± 9.9, n = 4, p < 0.01), Islet1 (shProx1-mProx1: 62.1 ± 3.9 vs shProx1: 126.7 ± 4.6, n = 4, p < 0.01), and MNR2 (shProx1-mProx1: 58.7 ± 4.2 vs shProx1: 129.4 ± 6.6, n = 4, p < 0.01; Fig. 11D–M). Instead, we were now able to revert these phenotypes by suppressing the expression of Olig2 or MN markers. Collectively, these observations imply that Prox1 is required for the correct specification of MN identity in the ventral spinal cord. Interestingly, the expansion of Olig2 expression or MN domain upon depletion of Prox1 was restricted to the ventral spinal cord, suggesting a limited misspecification, probably at the expense of V2 lineage.
Figure 9.
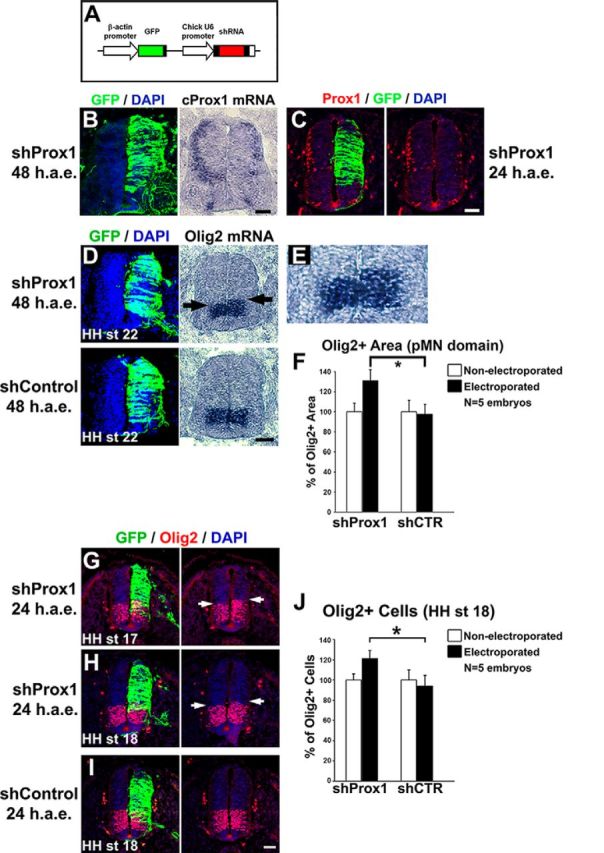
Prox1 is necessary for the suppression of Olig2 gene expression in vivo. A, Schematic representation of the shRNA-based constructs used in this study. GFP under the control of chick β-actin promoter was also included to follow expression of the shRNA. B, GFP/DAPI staining and in situ hybridization for cProx1 gene in consecutive sections 48 h a.e. with shProx1. C, Double GFP/Prox1 immunostaining 24 h a.e. with shProx1. D, GFP/DAPI staining and in situ hybridization for Olig2 in consecutive sections 48 h a.e. with shProx1 or shControl. Arrows in the micrograph indicate the dorsal expansion of Olig2 expression area toward the p2 domain compared with nonelectroporated side. E, The micrograph in B is a larger magnification of the Olig2 expression domain in D. F, Quantitative analysis of the Olig2+ area using ImageJ software. These data are presented as percentage of the nonelectroporated side of the spinal cord. For shProx1 versus shControl, *p < 0.05 (t test), n = 5 embryos. All cases referred to the electroporated side. G–I, Double GFP/Olig2 immunostainings in cryosections 24 h a.e. with shProx1 (G, H) or shControl (I) and analysis at HH stage 17 (G) or HH stage 18 (H, I). Arrows in the micrograph indicate the dorsal expansion of Olig2 expression area toward the p2 domain compared with nonelectroporated side. J, Quantitative analysis of the number of Olig2+ progenitor cells. These data are presented as percentage of cells of the nonelectroporated side of the spinal cord. For shProx1 versus shControl, *p < 0.05 (t test), n = 5 embryos. All cases referred to the electroporated side. Scale bars: A: 50 μm.
Figure 10.
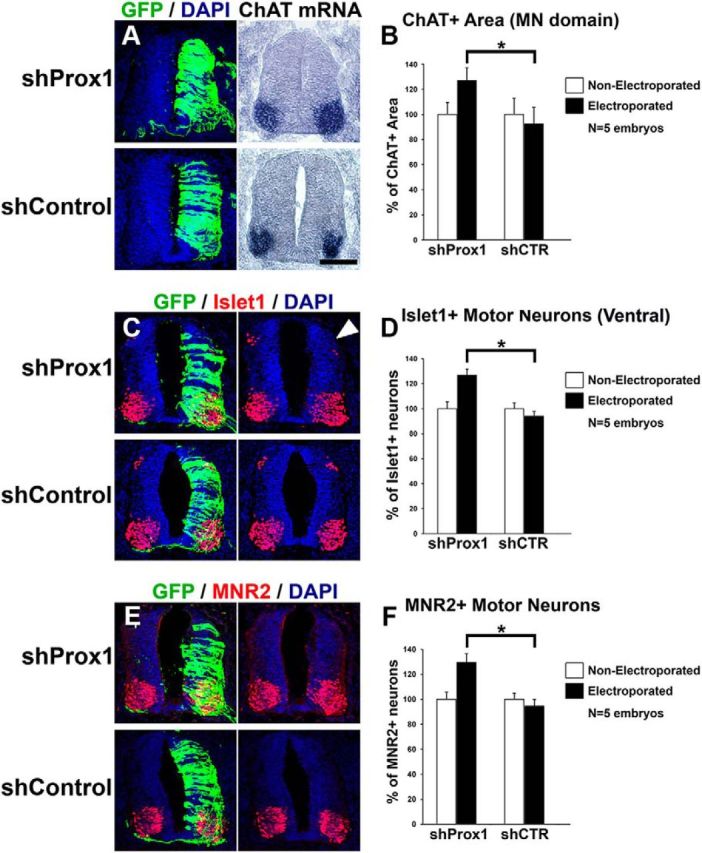
Prox1 is necessary for the inhibition of MN generation. A, GFP/DAPI staining and in situ hybridization for ChAT in consecutive sections 48 h a.e. with shProx1 or shControl vectors. B, Quantitative analysis of the ChAT+ area using ImageJ software. These data are presented as percentage of the nonelectroporated side of the spinal cord. For shProx1 versus shControl, *p < 0.05 (t test), n = 5 embryos. All cases referred to the electroporated side. C, E, Double GFP/Islet1 (C) and GFP/MNR2 (E) immunostainings in cryosections 48 h a.e. with shProx1 or shControl. The arrow in C indicates the Islet1+interneurons in the dorsal part of chick spinal cord. D, F, Quantitative analysis of the number of Islet1+ MNs (D) and MNR2+ MNs (F). These data are presented as percentage of cells of the nonelectroporated side of the spinal cord. For Islet1+ MNs: shProx1 versus shControl, *p < 0.05 (t test), n = 5 embryos; for MNR2+ MNs: shProx1 versus shControl, *p < 0.05 (t test), n = 5 embryos. All cases referred to the electroporated side. Scale bars: 75 μm.
Figure 11.
Rescue of the shRNA-Prox1-mediated induction of Olig2 expression and MN generation by murine Prox1. A, Schematic representation of the shProx1 and murine Prox1 expression vectors. Note that shProx1 can be detected with GFP and murine Prox1 is tagged with 6xHIS epitope, and thus can be detected with anti-HIS immunostaining. B, C, Double GFP/HIS immunostaining 48 h after co-electroporation of shProx1 and murine Prox1 constructs. Note that murine Prox1 is distributed in the same cells as the shProx1 construct. D–I, Double immunostainings for GFP/Islet1 (D, G) and GFP/MNR2 (H, I), and in situ hybridizations for Olig2 (E) and ChAT (F), in consecutive sections 48 h a.e., with shProx1 and murine Prox1 constructs. J, K, Quantitative analysis of the Olig2+ (J) and ChAT+ (K) areas presented in E and F, respectively, using ImageJ software. These data are presented as percentage of the nonelectroporated side of the spinal cord. The data for shProx1 electroporations are as in Figure 9F (Olig2) and Figure 10B (ChAT), and are presented here for comparison. For Olig2+ area (E), shProx1 + mProx1 versus shProx1, **p < 0.01 (t test); shProx1 + mProx1 versus GFP, **p < 0.01 (t test), n = 4 embryos. For ChAT+ area (F), shProx1 + mProx1 versus shProx1, **p < 0.01 (t test); shProx1 + mProx1 versus GFP, **p < 0.01 (t test), n = 4 embryos. All cases referred to the electroporated side. L, M, Quantitative analysis of the number of Islet1+ MNs (L) and MNR2+ MNs (M) presented in G and I, respectively. These data are presented as percentage of the nonelectroporated side. The data for shProx1 electroporations are as in Figure 10D (Islet1) and F (MNR2), and presented here for comparison. For Islet+ MNs (L), shProx1 + mProx1 versus shProx1, **p < 0.01 (t test); shProx1 + mProx1 versus GFP, **p < 0.01 (t test), n = 4 embryos. For MNR2+ MNs (M), shProx1 + mProx1 versus shProx1, **p < 0.01 (t test); shProx1 + mProx1 versus GFP, **p < 0.01 (t test), n = 4 embryos. All cases referred to the electroporated side. Scale bars: 100 μm.
Prox1 depletion inhibits p2 progenitors and V2 interneuron generation in vivo
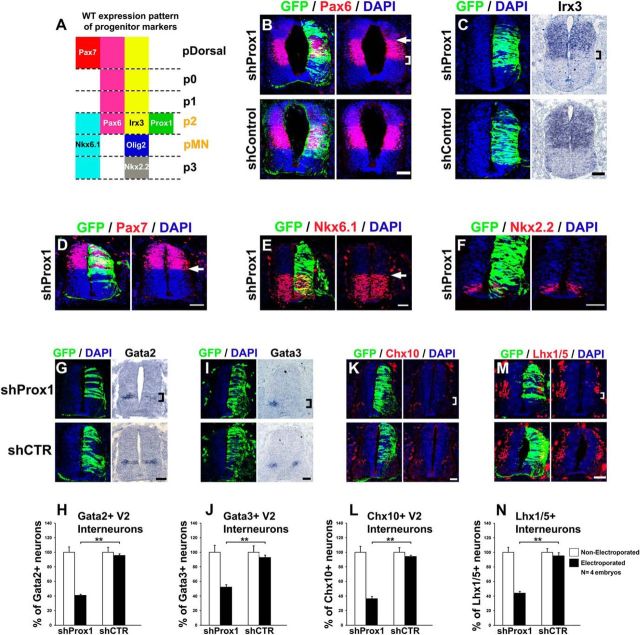
To investigate this possibility, we first tested whether the expansion of Olig2 expression domain is accompanied with reduction of p2. Accordingly, Prox1 knock-down caused a concomitant contraction of the ventral boundaries of Pax6 and Irx3 expression domains (Fig. 12A–C), which correspond to the boundary between p2 and pMN (Fig. 12A). These results are in accordance with the observation that Olig2 exerts inhibitory regulation on Irx3 and Pax6 (Ericson et al., 1997; Briscoe et al., 1999, 2000; Mizuguchi et al., 2001; Novitch et al., 2001; Briscoe and Novitch, 2008). Moreover, the boundaries of more dorsal domains, including the dorsal boundary of Pax6 and ventral boundary of Pax7 (pDorsal/p0, Fig. 12A) were not affected (Fig. 12B,D, arrows, respectively), proposing a specific effect in the ventral spinal cord. We also investigated whether the p1/p2 and pMN/p3 boundaries were affected by using Nkx6.1 and Nkx2.2 markers, respectively (Fig. 12A). Prox1 depletion was not able to alter the dorsal boundary of Nkx6.1 and Nkx2.2 expression domains (Fig. 12E,F), indicating that the expansion of pMN is not extended to the p1 or p3 domains. Therefore, in agreement with the observation that Prox1 is strongly expressed in the p2 domain and not in p1, pMN, or p3 (Fig. 3P), we conclude that Prox1 depletion specifically mis-specifies MN progenitors at the expense of V2 progenitors.
Figure 12.
Prox1 expression in p2 domain is required for the proper acquisition of p2 progenitor identity and V2 interneuron generation. A, Schematic diagram of the wild-type expression pattern of progenitor markers in ventral spinal cord. The p2 and pMN are marked with orange color to indicate that the boundary between these domains is affected by shProx1. B, Double GFP/Pax6 immunostainings in cryosections 48 h a.e. with shProx1 (top) or shControl (bottom). The square bracket indicates the contraction of ventral boundary of Pax6+ domain in the shProx1 electroporated side. Conversely, the arrow indicates the dorsal boundary of Pax6+ domain, which remains unaffected under the same conditions. C, GFP/DAPI staining and in situ hybridization for Irx3 in consecutive sections 48 h a.e. with shProx1 (top) or shControl (bottom). The square bracket indicates the contraction of ventral boundary of Irx3+ domain. D, Double GFP/Pax7 immunostaining in cryosection 48 h a.e. with shProx1. The arrow indicates the ventral boundary of Pax7+ cells, which remains unaffected. E, Double GFP/Nkx6.1 immunostaining in cryosection 48 h a.e. with shProx1. The arrow indicates the dorsal boundary of Nkx6.1+ cells, which remains unaffected. F, Double GFP/Nkx2.2 immunostaining in cryosection 48 h a.e. with shProx1. Note that the domain of Nkx2.2+ cells (p3) is not affected by shProx1. G, GFP/DAPI staining and in situ hybridization for Gata2 in consecutive sections 48 h a.e. with shProx1 (top) or shControl (bottom). H, Quantitative analysis of the Gata2+ area using ImageJ. For shProx1 versus shControl, **p < 0.01 (t test), n = 4 embryos. All cases referred to the electroporated side. I, GFP/DAPI staining and in situ hybridization for Gata3 in consecutive sections 48 h a.e. with shProx1 (top) or shControl (bottom). J, Quantitative analysis of the Gata3+ area using ImageJ. For shProx1 versus shControl, **p < 0.01 (t test), n = 4 embryos. All cases referred to the electroporated side. K, M, Double GFP/Chx10 (K) and GFP/Lhx1/5 (M) immunostainings in cryosections 48 h a.e. with shProx1 (top) or shControl (bottom). L, N, Quantitative analysis of the number of Chx10+ (L) and Lhx1/5+ cells (N). For Chx10+ cells: shProx1 versus shControl, **p < 0.01 (t test), n = 4 embryos; for Lhx1/5+ cells: shProx1 versus shControl, **p < 0.01 (t test), n = 4 embryos. All cases referred to the electroporated side. The square brackets indicate the domains of Gata2+ (G), Gata3+ (I), and Chx10+ (K) V2 interneurons, as well as Lhx1/5+ V2 interneurons (M), which are strongly reduced after shProx1 electroporation. Scale bars: 50 μm.
As a result, the number of mature V2 interneurons was reduced upon Prox1 knock-down. In particular, a strong reduction in the number of cells that express the postmitotic V2 markers, Gata2 (early V2 and V2b; shProx1: 40.9 ± 0.9 vs shControl: 95.7 ± 1.9, n = 4, p < 0.01), Gata3 (V2b; shProx1: 52.4 ± 3.3 vs shControl: 92.8 ± 3.6, n = 4, p < 0.01), and Chx10 (V2a; shProx1: 36.2 ± 3.3 vs shControl: 94.1 ± 1.7, n = 4, p < 0.01), was observed (Fig. 12G–L). Furthermore, knock-down of Prox1 reduced the expression of Lhx1/5 (shProx1: 43.8 ± 2.4 vs shControl: 95.2 ± 4.3, n = 4, p < 0.01), a general marker for interneurons (Fig. 12M,N), especially in the ventral most domain of Lhx1/5 expression, where V2 interneurons reside.
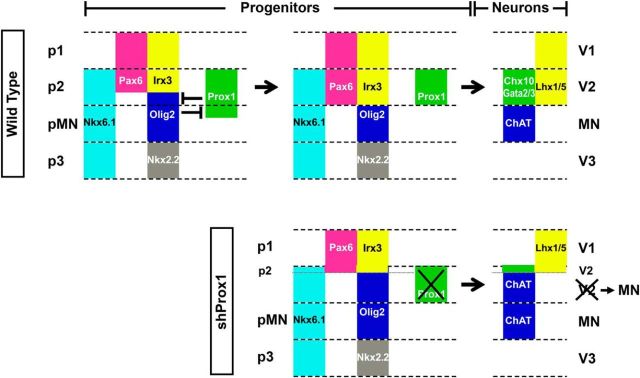
In conclusion, our observations indicate that Prox1 is a critical regulator of Olig2 gene expression by directly inhibiting the activity of 1.1 kb and K23 transcription regulatory elements. Through this action, Prox1 controls binary fate decisions between MNs and V2 interneurons in the embryonic spinal cord (Fig. 13).
Figure 13.
Schematic representation of our proposed model for the role of Prox1 in p2/pMN boundary specification. During the early stages of ventral spinal cord development a subset of naive progenitors are generated that will later give rise to either V2 interneurons or MNs (Wu et al., 2006; Dessaud et al., 2007, 2008, 2010; J. A. Chen et al., 2011). A cross-inhibitory transcriptional regulation between Prox1 and Olig2 determines the V2 or MN cell fate by refining the p2/pMN boundary. In the dorsal-most progenitors, Prox1 expression is sustained to suppress Olig2, inhibit MN generation, and promote V2 identity (Chx10+, Gata2+, Gata3+, and ventral Lhx1/5+). Conversely, in the ventral-most progenitors, Olig2 expression is sustained to repress Prox1, block V2 identity, and allow MN specification (ChAT+). Consistent with this model, upon shRNA-mediated knock-down of Prox1 (shProx1), its inhibitory effect on Olig2 is alleviated and the expression domain of Olig2 (pMN) is dorsally expanded at the expense of p2.
Discussion
Asymmetric divisions of NPCs during development create a hierarchy of differentiation decisions between alternative neural fates. Regulatory networks of transcription factors play a fundamental role in these specification events by suppressing the activation of genetic programs specifying alternative cell fates (Briscoe et al., 2000; Jessell, 2000; Marquardt and Pfaff, 2001; Briscoe and Novitch, 2008; Dessaud et al., 2010; Balaskas et al., 2012). Accordingly, Olig2 specifies MN identity in the ventral spinal cord by suppressing the genetic program for V2 interneurons (Lu et al., 2002; Zhou and Anderson, 2002). Interestingly, lineage-tracing experiments suggest that Olig2 is initially expressed in progenitor cells that will later generate not only MNs but also V2 interneurons (Fig. 2A–C; Dessaud et al., 2010; J. A. Chen et al., 2011), indicating that another repressor(s) acts to suppress Olig2 and allow V2 specification. Here, we show that Prox1 accomplishes this action by directly interacting with the regulatory elements of Olig2 gene in vivo. Moreover, physiological levels of endogenous Prox1 are critical for the negative regulation of Olig2 gene expression in vitro and in vivo. Most importantly, we present functional evidence that Prox1 exerts a repressive action in Olig2 transcription specifically at the boundaries between pMN and p2 during spinal cord development. This function is sufficient and necessary for the proper regulation of binary fate decisions between MNs and V2 interneurons. Therefore, we suggest that Prox1-mediated suppression of Olig2 in p2 blocks MN specification and allows induction of the genetic program for V2 differentiation (Fig. 13). Consistent with this molecular mechanism, genetic ablation of Olig2 in mouse spinal cord results in the ventral expansion of Pax6 and Irx3 expression domains toward pMN and increases the V2 interneurons, which also expand into the MN domain without affecting the Nkx2.2 domain (p3) or the numbers of V3 interneurons (Lu et al., 2002; Takebayashi et al., 2002; Zhou and Anderson, 2002; Li et al., 2011). Conversely, ectopic expression of Olig2 in the chick neural tube suppresses Pax6 and Irx3 expression and V2 interneuron generation and induces ectopic MNs only into V2 domain (Mizuguchi et al., 2001; Novitch et al., 2001; Lu et al., 2002). All these Olig2-mediated effects in p2 are faithfully recapitulated by Prox1 knock-down (Fig. 13, bottom), further supporting our mechanistic model for Prox1 action in the ventral spinal cord via Olig2 suppression.
Consistently, Olig2 overexpression is able to suppress endogenous Prox1 in mouse NPCs (Fig. 4K–M) and chick spinal cord (Misra et al., 2008), suggesting a cross-inhibitory regulatory interaction between these factors. In agreement, Prox1 and Olig2 are expressed in a complementary manner in the developing mouse and chick spinal cord (Fig. 1). However, during earlier stages of neuronal development Olig2 is transiently expressed in a subset of naive progenitors (Dessaud et al., 2010; J. A. Chen et al., 2011) that will later express Prox1 and generate cell types of the V2 interneuron lineage (Figs. 1, 2). These data are consistent with the scenario that during the hierarchy of differentiation Olig2 is expressed first in naive progenitors of p2 and pMN domains and then Prox1 is induced in p2 progenitors to downregulate Olig2 and promote V2 identity. Thereby, we propose here that the cross-inhibitory regulation between Prox1 and Olig2 plays a critical role in the specification and boundary refinement of these two distinct neuronal subtypes (Fig. 13). Considering the role of sonic hedgehog (Shh) in inducing the expression of Olig2 (Lu et al., 2000; Briscoe and Novitch, 2008), an interesting question arising from this cross-inhibitory regulation is whether Shh signaling affects the expression of Prox1. Although it is tempting to speculate that Shh may negatively affect Prox1 expression and therefore participate in the Shh-mediated transcriptional code for ventral neural tube patterning, we believe that this possibility is quite unlikely. Specifically, the expression pattern of Prox1 is not consistent with such a regulation by the Shh gradient of activity, since it is expressed above and below pMN domain, as well as in intermediate progenitor cells that have exited the cell cycle and localized in dorsal and ventral areas above and below MN domain (Misra et al., 2008; Kaltezioti et al., 2010). If Prox1 expression was repressed at a distinct concentration of Shh, we would not expect to be specifically excluded from the pMN/MN domains. In addition, the temporal pattern of the initiation of Prox1 expression is also inconsistent with such an action, because it is induced quite after the expression of Olig2, Nkx6.1, Pax6, Irx3, and other Shh-regulated factors (Figs. 1, 2).
Although the Prox1-mediated suppression of Olig2 can sufficiently explain the requirement for Prox1 in V2 lineage specification, we cannot exclude additional actions of Prox1 in other determinants of V2 lineage. In this regard, a follow-up question is whether Prox1 is engaged in regulatory interactions with other components of the genetic network that define ventral neuronal subtypes. Specifically, the repressive action of Olig2 on Pax6 and the cross-regulatory interactions between Olig2 and Irx3 or miRNA-17–3p are also implicated in the establishment of p2/pMN identities (Ericson et al., 1997; Briscoe et al., 2000; Mizuguchi et al., 2001; Novitch et al., 2001; Zhou and Anderson, 2002; Briscoe and Novitch, 2008; J. A. Chen et al., 2011; Mazzoni et al., 2011). Prox1 ablation results in a dorsal expansion of the expression boundaries between Olig2 and Irx3 or Pax6, indicating that Prox1 plays a regulatory role in these repressive loops. This role could be adequately explained by the direct action of Prox1 in Olig2 transcription regulatory elements. However, despite these mechanistic interactions, we cannot exclude a number of additional direct or indirect effects of Pax6, Irx3, and/or miRNA-17-3p on Prox1 function, or vice versa. An attractive scenario would be that these factors cooperate to maintain Olig2 expression levels below a threshold in p2 domain above which pMN specification is induced at the expense of p2.
Furthermore, an intriguing question is why Prox1 knock-down in more dorsal positions cannot induce the ectopic generation of MNs. We show here that in more dorsal domains Prox1 ablation is not sufficient to de-repress Olig2 expression and thus the program for MN generation remains suppressed (Figs. 9, 10). We suggest that this could be due to another repressor/factor, acting upstream of Prox1 in the hierarchy of neuronal specification, which suppresses Olig2 outside the V2 lineage. Olig2 expression may be initiated in the subset of progenitors that are engaged in the V2/MN lineages and therefore alternative dorsal fates may have lost the ability to de-repress Olig2 due to transcription and/or epigenetic factors. Consistently, it has been shown that ectopic expression of Olig2 is sufficient to induce MN generation only in the p2, possibly due to the fact that outside p2 Olig2 needs auxiliary factors to complete this action (Mizuguchi et al., 2001; Novitch et al., 2001). In accordance, Olig2 misexpression is sufficient to induce ectopic MNs in more dorsal positions when co-overexpressed with Neurog2 (Mizuguchi et al., 2001). Paradoxically, Neurog2 alone is sufficient to strongly induce the expression of Prox1 (Misra et al., 2008). However, Olig2 coexpression is able to block the Neurog2-mediated induction of Prox1 (Misra et al., 2008), suggesting that Olig2 can override the effect of Neurog2 on enhancing Prox1, consistent with their ability to ectopically activate the MN program outside p2. Therefore, we suggest that Prox1 specifically acts in p2 to inhibit the Olig2-mediated program for MN specification.
Taken together, these observations indicate that Prox1 is an integral component of the gene regulation network for neuronal subtype specification in the developing spinal cord. We and others have previously shown that Prox1 is a downstream target of proneural genes and induces generic neurogenesis via inactivation of Notch1 signaling (Misra et al., 2008; Kaltezioti et al., 2010). Moreover, we recently showed that Prox1 acts as a tumor suppressor gene in nervous system-related cancers by regulating basic components of the cell cycle machinery, including Cyclins, p27-Kip1, and Cdc25A, to induce cell cycle arrest (Foskolou et al., 2013). This anti-proliferative action of Prox1 could also be involved in the exit of p2 progenitors from the cell cycle and induction of terminal V2 differentiation, which is consistent with the observation that Prox1 appears in later stages of ventral specification, after the detection of Olig2 in early/naive progenitors of pMN/p2. Therefore, we would like to further propose a central role for Prox1 in the regulatory mechanisms coupling subtype specification with induction of generic aspects of neurogenesis and cell cycle exit of NPCs.
To conclude, in this study we have unveiled for the first time to our knowledge a novel means of Olig2 regulation in the developing spinal cord, which involves direct transcriptional repression of proximal 1.1 kb promoter and K23 regulatory elements of Olig2 gene locus by Prox1. In addition, we have demonstrated that this transcriptional repression has profound implications in ventral spinal cord patterning and binary fate decisions between MNs and V2 interneurons. This mechanism is of paramount importance for generating the correct numbers of ventral V2 interneurons and MNs from a duly sustained pool of NPCs.
Footnotes
This work was supported by the ARISTEIA-II Grant (from the General Secretariat of Research and Technology, Athens, Greece), the IKYDA Grant (from the Greek Ministry of Education) and Fondation Sante Grant to P.P. H.R. is supported by the Wilhelm-Sander-Stiftung. We thank Iosifina Foskolou, Georgia Kouroupi, Laskaro Zagoraiou, and Aristidis Charonis for critically reading this manuscript, as well as Mina Gouti, Stavros Mallas, Laskaro Zagoraiou, and Tom Jessell for reagents and experimental tools.
The authors declare no competing financial interests.
References
- Aguirre-Cruz L, Mokhtari K, Hoang-Xuan K, Marie Y, Criniere E, Taillibert S, Lopes M, Delattre JY, Sanson M. Analysis of the bHLH transcription factors Olig1 and Olig2 in brain tumors. J Neurooncol. 2004;67:265–271. doi: 10.1023/B:NEON.0000024190.56750.81. [DOI] [PubMed] [Google Scholar]
- Balaskas N, Ribeiro A, Panovska J, Dessaud E, Sasai N, Page KM, Briscoe J, Ribes V. Gene regulatory logic for reading the Sonic Hedgehog signaling gradient in the vertebrate neural tube. Cell. 2012;148:273–284. doi: 10.1016/j.cell.2011.10.047. [DOI] [PMC free article] [PubMed] [Google Scholar]
- Briscoe J, Novitch BG. Regulatory pathways linking progenitor patterning, cell fates and neurogenesis in the ventral neural tube. Philos Trans R Soc Lond B Biol Sci. 2008;363:57–70. doi: 10.1098/rstb.2006.2012. [DOI] [PMC free article] [PubMed] [Google Scholar]
- Briscoe J, Sussel L, Serup P, Hartigan-O'Connor D, Jessell TM, Rubenstein JL, Ericson J. Homeobox gene Nkx2.2 and specification of neuronal identity by graded Sonic hedgehog signalling. Nature. 1999;398:622–627. doi: 10.1038/19315. [DOI] [PubMed] [Google Scholar]
- Briscoe J, Pierani A, Jessell TM, Ericson J. A homeodomain protein code specifies progenitor cell identity and neuronal fate in the ventral neural tube. Cell. 2000;101:435–445. doi: 10.1016/S0092-8674(00)80853-3. [DOI] [PubMed] [Google Scholar]
- Chen CT, Gottlieb DI, Cohen BA. Ultraconserved elements in the Olig2 promoter. PLoS One. 2008;3:e3946. doi: 10.1371/journal.pone.0003946. [DOI] [PMC free article] [PubMed] [Google Scholar]
- Chen JA, Huang YP, Mazzoni EO, Tan GC, Zavadil J, Wichterle H. Mir-17-3p controls spinal neural progenitor patterning by regulating Olig2/Irx3 cross-repressive loop. Neuron. 2011;69:721–735. doi: 10.1016/j.neuron.2011.01.014. [DOI] [PMC free article] [PubMed] [Google Scholar]
- Das RM, Van Hateren NJ, Howell GR, Farrell ER, Bangs FK, Porteous VC, Manning EM, McGrew MJ, Ohyama K, Sacco MA, Halley PA, Sang HM, Storey KG, Placzek M, Tickle C, Nair VK, Wilson SA. A robust system for RNA interference in the chicken using a modified microRNA operon. Dev Biol. 2006;294:554–563. doi: 10.1016/j.ydbio.2006.02.020. [DOI] [PubMed] [Google Scholar]
- Dessaud E, Yang LL, Hill K, Cox B, Ulloa F, Ribeiro A, Mynett A, Novitch BG, Briscoe J. Interpretation of the sonic hedgehog morphogen gradient by a temporal adaptation mechanism. Nature. 2007;450:717–720. doi: 10.1038/nature06347. [DOI] [PubMed] [Google Scholar]
- Dessaud E, McMahon AP, Briscoe J. Pattern formation in the vertebrate neural tube: a sonic hedgehog morphogen-regulated transcriptional network. Development. 2008;135:2489–2503. doi: 10.1242/dev.009324. [DOI] [PubMed] [Google Scholar]
- Dessaud E, Ribes V, Balaskas N, Yang LL, Pierani A, Kicheva A, Novitch BG, Briscoe J, Sasai N. Dynamic assignment and maintenance of positional identity in the ventral neural tube by the morphogen sonic hedgehog. PLoS Biol. 2010;8:e1000382. doi: 10.1371/journal.pbio.1000382. [DOI] [PMC free article] [PubMed] [Google Scholar]
- Dyer MA, Livesey FJ, Cepko CL, Oliver G. Prox1 function controls progenitor cell proliferation and horizontal cell genesis in the mammalian retina. Nat Genet. 2003;34:53–58. doi: 10.1038/ng1144. [DOI] [PubMed] [Google Scholar]
- Elkouris M, Balaskas N, Poulou M, Politis PK, Panayiotou E, Malas S, Thomaidou D, Remboutsika E. Sox1 maintains the undifferentiated state of cortical neural progenitor cells via the suppression of Prox1-mediated cell cycle exit and neurogenesis. Stem Cells. 2011;29:89–98. doi: 10.1002/stem.554. [DOI] [PubMed] [Google Scholar]
- Ericson J, Rashbass P, Schedl A, Brenner-Morton S, Kawakami A, van Heyningen V, Jessell TM, Briscoe J. Pax6 controls progenitor cell identity and neuronal fate in response to graded Shh signaling. Cell. 1997;90:169–180. doi: 10.1016/S0092-8674(00)80323-2. [DOI] [PubMed] [Google Scholar]
- Foskolou IP, Stellas D, Rozani I, Lavigne MD, Politis PK. Prox1 suppresses the proliferation of neuroblastoma cells via a dual action in p27-Kip1 and Cdc25A. Oncogene. 2013;32:947–960. doi: 10.1038/onc.2012.129. [DOI] [PubMed] [Google Scholar]
- Hafler BP, Surzenko N, Beier KT, Punzo C, Trimarchi JM, Kong JH, Cepko CL. Transcription factor Olig2 defines subpopulations of retinal progenitor cells biased toward specific cell fates. Proc Natl Acad Sci U S A. 2012;109:7882–7887. doi: 10.1073/pnas.1203138109. [DOI] [PMC free article] [PubMed] [Google Scholar]
- Harvey NL, Srinivasan RS, Dillard ME, Johnson NC, Witte MH, Boyd K, Sleeman MW, Oliver G. Lymphatic vascular defects promoted by Prox1 haploinsufficiency cause adult-onset obesity. Nat Genet. 2005;37:1072–1081. doi: 10.1038/ng1642. [DOI] [PubMed] [Google Scholar]
- Jessell TM. Neuronal specification in the spinal cord: inductive signals and transcriptional codes. Nat Rev Genet. 2000;1:20–29. doi: 10.1038/35049541. [DOI] [PubMed] [Google Scholar]
- Kaltezioti V, Kouroupi G, Oikonomaki M, Mantouvalou E, Stergiopoulos A, Charonis A, Rohrer H, Matsas R, Politis PK. Prox1 regulates the notch1-mediated inhibition of neurogenesis. PLoS Biol. 2010;8:e1000565. doi: 10.1371/journal.pbio.1000565. [DOI] [PMC free article] [PubMed] [Google Scholar]
- Lee SK, Lee B, Ruiz EC, Pfaff SL. Olig2 and Ngn2 function in opposition to modulate gene expression in motor neuron progenitor cells. Genes Dev. 2005;19:282–294. doi: 10.1101/gad.1257105. [DOI] [PMC free article] [PubMed] [Google Scholar]
- Li H, de Faria JP, Andrew P, Nitarska J, Richardson WD. Phosphorylation regulates OLIG2 cofactor choice and the motor neuron-oligodendrocyte fate switch. Neuron. 2011;69:918–929. doi: 10.1016/j.neuron.2011.01.030. [DOI] [PMC free article] [PubMed] [Google Scholar]
- Ligon KL, Huillard E, Mehta S, Kesari S, Liu H, Alberta JA, Bachoo RM, Kane M, Louis DN, Depinho RA, Anderson DJ, Stiles CD, Rowitch DH. Olig2-regulated lineage-restricted pathway controls replication competence in neural stem cells and malignant glioma. Neuron. 2007;53:503–517. doi: 10.1016/j.neuron.2007.01.009. [DOI] [PMC free article] [PubMed] [Google Scholar]
- Lu QR, Yuk D, Alberta JA, Zhu Z, Pawlitzky I, Chan J, McMahon AP, Stiles CD, Rowitch DH. Sonic hedgehog—regulated oligodendrocyte lineage genes encoding bHLH proteins in the mammalian central nervous system. Neuron. 2000;25:317–329. doi: 10.1016/S0896-6273(00)80897-1. [DOI] [PubMed] [Google Scholar]
- Lu QR, Sun T, Zhu Z, Ma N, Garcia M, Stiles CD, Rowitch DH. Common developmental requirement for Olig function indicates a motor neuron/oligodendrocyte connection. Cell. 2002;109:75–86. doi: 10.1016/S0092-8674(02)00678-5. [DOI] [PubMed] [Google Scholar]
- Marie Y, Sanson M, Mokhtari K, Leuraud P, Kujas M, Delattre JY, Poirier J, Zalc B, Hoang-Xuan K. OLIG2 as a specific marker of oligodendroglial tumour cells. Lancet. 2001;358:298–300. doi: 10.1016/S0140-6736(01)05499-X. [DOI] [PubMed] [Google Scholar]
- Marquardt T, Pfaff SL. Cracking the transcriptional code for cell specification in the neural tube. Cell. 2001;106:651–654. doi: 10.1016/S0092-8674(01)00499-8. [DOI] [PubMed] [Google Scholar]
- Mazzoni EO, Mahony S, Iacovino M, Morrison CA, Mountoufaris G, Closser M, Whyte WA, Young RA, Kyba M, Gifford DK, Wichterle H. Embryonic stem cell-based mapping of developmental transcriptional programs. Nat Methods. 2011;8:1056–1058. doi: 10.1038/nmeth.1775. [DOI] [PMC free article] [PubMed] [Google Scholar]
- Mehta S, Huillard E, Kesari S, Maire CL, Golebiowski D, Harrington EP, Alberta JA, Kane MF, Theisen M, Ligon KL, Rowitch DH, Stiles CD. The central nervous system-restricted transcription factor Olig2 opposes p53 responses to genotoxic damage in neural progenitors and malignant glioma. Cancer Cell. 2011;19:359–371. doi: 10.1016/j.ccr.2011.01.035. [DOI] [PMC free article] [PubMed] [Google Scholar]
- Misra K, Gui H, Matise MP. Prox1 regulates a transitory state for interneuron neurogenesis in the spinal cord. Dev Dyn. 2008;237:393–402. doi: 10.1002/dvdy.21422. [DOI] [PubMed] [Google Scholar]
- Mizuguchi R, Sugimori M, Takebayashi H, Kosako H, Nagao M, Yoshida S, Nabeshima Y, Shimamura K, Nakafuku M. Combinatorial roles of olig2 and neurogenin2 in the coordinated induction of pan-neuronal and subtype-specific properties of motoneurons. Neuron. 2001;31:757–771. doi: 10.1016/S0896-6273(01)00413-5. [DOI] [PubMed] [Google Scholar]
- Novitch BG, Chen AI, Jessell TM. Coordinate regulation of motor neuron subtype identity and pan-neuronal properties by the bHLH repressor Olig2. Neuron. 2001;31:773–789. doi: 10.1016/S0896-6273(01)00407-X. [DOI] [PubMed] [Google Scholar]
- Politis PK, Rohrer H, Matsas R. Expression pattern of BM88 in the developing nervous system of the chick and mouse embryo. Gene Expr Patterns. 2007a;7:165–177. doi: 10.1016/j.modgep.2006.06.007. [DOI] [PubMed] [Google Scholar]
- Politis PK, Makri G, Thomaidou D, Geissen M, Rohrer H, Matsas R. BM88/CEND1 coordinates cell cycle exit and differentiation of neuronal precursors. Proc Natl Acad Sci U S A. 2007b;104:17861–17866. doi: 10.1073/pnas.0610973104. [DOI] [PMC free article] [PubMed] [Google Scholar]
- Risebro CA, Searles RG, Melville AA, Ehler E, Jina N, Shah S, Pallas J, Hubank M, Dillard M, Harvey NL, Schwartz RJ, Chien KR, Oliver G, Riley PR. Prox1 maintains muscle structure and growth in the developing heart. Development. 2009;136:495–505. doi: 10.1242/dev.030007. [DOI] [PMC free article] [PubMed] [Google Scholar]
- Sosa-Pineda B, Wigle JT, Oliver G. Hepatocyte migration during liver development requires Prox1. Nat Genet. 2000;25:254–255. doi: 10.1038/76996. [DOI] [PubMed] [Google Scholar]
- Steffensen KR, Holter E, Båvner A, Nilsson M, Pelto-Huikko M, Tomarev S, Treuter E. Functional conservation of interactions between a homeodomain cofactor and a mammalian FTZ-F1 homologue. EMBO Rep. 2004;5:613–619. doi: 10.1038/sj.embor.7400147. [DOI] [PMC free article] [PubMed] [Google Scholar]
- Sun T, Hafler BP, Kaing S, Kitada M, Ligon KL, Widlund HR, Yuk DI, Stiles CD, Rowitch DH. Evidence for motoneuron lineage-specific regulation of Olig2 in the vertebrate neural tube. Dev Biol. 2006;292:152–164. doi: 10.1016/j.ydbio.2005.12.047. [DOI] [PubMed] [Google Scholar]
- Sun Y, Meijer DH, Alberta JA, Mehta S, Kane MF, Tien AC, Fu H, Petryniak MA, Potter GB, Liu Z, Powers JF, Runquist IS, Rowitch DH, Stiles CD. Phosphorylation state of Olig2 regulates proliferation of neural progenitors. Neuron. 2011;69:906–917. doi: 10.1016/j.neuron.2011.02.005. [DOI] [PMC free article] [PubMed] [Google Scholar]
- Tabu K, Ohnishi A, Sunden Y, Suzuki T, Tsuda M, Tanaka S, Sakai T, Nagashima K, Sawa H. A novel function of OLIG2 to suppress human glial tumor cell growth via p27Kip1 transactivation. J Cell Sci. 2006;119:1433–1441. doi: 10.1242/jcs.02854. [DOI] [PubMed] [Google Scholar]
- Takebayashi H, Nabeshima Y, Yoshida S, Chisaka O, Ikenaka K. The basic helix-loop-helix factor olig2 is essential for the development of motoneuron and oligodendrocyte lineages. Curr Biol. 2002;12:1157–1163. doi: 10.1016/S0960-9822(02)00926-0. [DOI] [PubMed] [Google Scholar]
- Torii Ma, Matsuzaki F, Osumi N, Kaibuchi K, Nakamura S, Casarosa S, Guillemot F, Nakafuku M. Transcription factors Mash-1 and Prox-1 delineate early steps in differentiation of neural stem cells in the developing central nervous system. Development. 1999;126:443–456. doi: 10.1242/dev.126.3.443. [DOI] [PubMed] [Google Scholar]
- Wigle JT, Oliver G. Prox1 function is required for the development of the murine lymphatic system. Cell. 1999;98:769–778. doi: 10.1016/S0092-8674(00)81511-1. [DOI] [PubMed] [Google Scholar]
- Wigle JT, Chowdhury K, Gruss P, Oliver G. Prox1 function is crucial for mouse lens-fibre elongation. Nat Genet. 1999;21:318–322. doi: 10.1038/6844. [DOI] [PubMed] [Google Scholar]
- Wigle JT, Harvey N, Detmar M, Lagutina I, Grosveld G, Gunn MD, Jackson DG, Oliver G. An essential role for Prox1 in the induction of the lymphatic endothelial cell phenotype. EMBO J. 2002;21:1505–1513. doi: 10.1093/emboj/21.7.1505. [DOI] [PMC free article] [PubMed] [Google Scholar]
- Wu S, Wu Y, Capecchi MR. Motoneurons and oligodendrocytes are sequentially generated from neural stem cells but do not appear to share common lineage-restricted progenitors in vivo. Development. 2006;133:581–590. doi: 10.1242/dev.02236. [DOI] [PubMed] [Google Scholar]
- Yang X, Tomita T, Wines-Samuelson M, Beglopoulos V, Tansey MG, Kopan R, Shen J. Notch1 signaling influences v2 interneuron and motor neuron development in the spinal cord. Dev Neurosci. 2006;28:102–117. doi: 10.1159/000090757. [DOI] [PubMed] [Google Scholar]
- Zhang X, Horrell SA, Delaney D, Gottlieb DI. Embryonic stem cells as a platform for analyzing neural gene transcription. Stem Cells. 2008;26:1841–1849. doi: 10.1634/stemcells.2007-0902. [DOI] [PubMed] [Google Scholar]
- Zhou Q, Anderson DJ. The bHLH transcription factors OLIG2 and OLIG1 couple neuronal and glial subtype specification. Cell. 2002;109:61–73. doi: 10.1016/S0092-8674(02)00677-3. [DOI] [PubMed] [Google Scholar]
- Zhou Q, Choi G, Anderson DJ. The bHLH transcription factor Olig2 promotes oligodendrocyte differentiation in collaboration with Nkx2.2. Neuron. 2001;31:791–807. doi: 10.1016/S0896-6273(01)00414-7. [DOI] [PubMed] [Google Scholar]


