

Abstract
Sensory responses are modulated by internal factors including attention, experience, and brain state. This is partly due to fluctuations in neuromodulatory input from regions such as the noradrenergic locus ceruleus (LC) in the brainstem. LC activity changes with arousal and modulates sensory processing, cognition, and memory. The main olfactory bulb (MOB) is richly targeted by LC fibers and noradrenaline profoundly influences MOB circuitry and odor-guided behavior. Noradrenaline-dependent plasticity affects the output of the MOB; however. it is unclear whether noradrenergic plasticity also affects the input to the MOB from olfactory sensory neurons (OSNs) in the glomerular layer. Noradrenergic terminals are found in the glomerular layer, but noradrenaline receptors do not seem to acutely modulate OSN terminals in vitro. We investigated whether noradrenaline induces plasticity at the glomerulus. We used wide-field optical imaging to measure changes in odor responses following electrical stimulation of LC in anesthetized mice. Surprisingly, odor-evoked intrinsic optical signals at the glomerulus were persistently weakened after LC activation. Calcium imaging selectively from OSNs confirmed that this effect was due to suppression of presynaptic input and was prevented by noradrenergic antagonists. Finally, suppression of responses to an odor did not require precise coincidence of the odor with LC activation. However, suppression was intensified by LC activation in the absence of odors. We conclude that noradrenaline release from LC has persistent effects on odor processing already at the first synapse of the main olfactory system. This mechanism could contribute to arousal-dependent memories.
Keywords: glomerulus, memory, neuromodulation, noradrenaline, olfactory bulb, plasticity
Introduction
Sensory responses, cognition, and behavior are modulated by noradrenaline (for review, see Usher et al., 1999; Aston-Jones and Cohen, 2005; Bouret and Sara, 2005; Valentino and Van Bockstaele, 2008; Berridge et al., 2012; Devore and Linster, 2012), which is released throughout the forebrain by the brainstem nucleus locus ceruleus (LC). In the main olfactory bulb (MOB), noradrenaline is involved in odor learning and discrimination of many stimuli, including social cues (Pissonnier et al., 1985; Sullivan et al., 1989, 1992, 2000; Kendrick et al., 1991; Rangel and Leon, 1995; Brennan et al., 1998; Guérin et al., 2008; Mandairon et al., 2008). Yet, it remains unclear which cell types are persistently modulated by noradrenaline.
Olfactory sensory neurons (OSNs) and mitral/tufted cells (MTs) form the first synapse of the main olfactory system. Axonal terminals of OSNs expressing the same receptor proteins converge onto MTs, forming glomeruli at the MOB surface (Chen and Shepherd, 2005). This organization defines a spatial representation of odors (Mombaerts, 2006) that is readily imaged (Rubin and Katz, 1999; Uchida et al., 2000; Meister and Bonhoeffer, 2001; Wachowiak and Cohen, 2001; Bozza et al., 2004; Lin da et al., 2006; Fletcher et al., 2009; Ma et al., 2012). In deeper layers MTs receive inhibitory feedback from granule cells (Jahr and Nicoll, 1980; Isaacson and Strowbridge, 1998).
Noradrenaline can acutely inhibit granule cells (Nai et al., 2009, 2010; Linster et al., 2011), and thereby transiently disinhibits MTs, which may contribute to plastic changes in the MOB (Pandipati et al., 2010). Indeed, responses of MTs to odors presented during noradrenaline release are incrementally and persistently suppressed (Wilson et al., 1987; Sullivan et al., 1989; Shea et al., 2008). This is correlated with an increase in GABA relative to glutamate (Kendrick et al., 1992; Brennan et al., 1998) suggesting that the suppression involves inhibition.
The glomerular layer also receives noradrenergic input and expresses adrenergic receptors (Day et al., 1997; Winzer-Serhan et al., 1997a,b), thus interneurons in the glomerular layer may also regulate OSN output. While acute activation of noradrenaline receptors did not modulate OSN output in one study (Hayar et al., 2001), persistent effects were not assessed.
We investigated whether LC activation persistently modulates OSN activity in anesthetized mice. We measured the activation of glomeruli with wide-field imaging of intrinsic optical and fluorescent calcium signals. Surprisingly, we observed a persistent noradrenaline-dependent reduction in the odor response of OSNs. The suppression affected the responses to odors presented during or between LC activation trials equally. However, the suppression was intensified when no odors were presented during the LC stimulation phase. Arousal-dependent olfactory memories may therefore alter odor-evoked synaptic activity as peripheral as the first synapse in the main olfactory system.
Materials and Methods
Animals.
Mice were 6–16 weeks old, of both sexes, and housed in the institution's animal facilities. Intrinsic optical signals were measured in C57BL/6 mice (The Jackson Laboratory) and fluorescent calcium signals were measured in a transgenic mouse line (tetO-GCaMP2/OMP-IRES-tTA; a gift from C.R. Yu, Stowers Institute for Medical Research, Kansas City, MO). To generate these mice, a tetO-GCaMP2 mouse line was crossed with another line carrying an OMP-IRES-tTA allele (He et al., 2008; Ma et al., 2012). In this mouse, expression of OMP leads to the transcription of a bicistronic RNA for both OMP and tTA (Yu et al., 2004) and in turn to the expression of the fluorescent Ca2+ sensor GCaMP2 in olfactory sensory neurons.
Genotyping (tetO-GCaMP2/OMP-IRES-tTA).
After weaning (d21) tail samples were collected form isoflurane-anesthetized mice. The samples were solved in lysis buffer (10 mm NaOH and 0.1 mm EDTA) and additional proteinase K at 37°C. The proteinase K was deactivated in a 95°C water bath. The PCR solution included 1 μl of the DNA solution (diluted 20×), 10 μl PCR master mix (Promega; GoTaq Green Master Mix M7123), 7 μl nuclease free water, and 1 μl of each primer (10 μm; IDENTIFY 5′ and 3′ primers ATCGATTCTAGAATTCGCTGTCTG; CTTATCGTCATCGTCGTACAGAT).
PCR cycle.
Two minutes at 95°C, 35 cycles (30 s at 95°C, 1 min 53°C to 59°C, 1 min at 72°C) and 5 min at 72°C, stored at 4°C.
Anesthesia.
During all surgeries the mice were initially anesthetized with ketamine and xylazine (100/5 mg/kg). The anesthesia was maintained with a syringe pump (Harvard Apparatus; Pump 11) loaded with a ketamine/saline solution (90 mg/kg/h; i.p. infusion). The sole injection of xylazine was made >2.5 h before stimulation of locus ceruleus.
Implantation of the stimulation electrode.
Tungsten electrodes (MicroProbes; 1 MΩ) were shortened to 8 mm from the tip and soldered to new contacts before implantation. Impedance measurement ensured that the electrodes were not damaged. During the procedure the location of the electrode tip was verified through electrophysiology. Locus ceruleus neurons exhibit a characteristic shape and rate of action potentials and respond to tail pinches (Shea et al., 2008). The electrode was secured with dental cement and the scalp was sutured. The cut was further sealed with tissue adhesive (Vetbond; n-butyl cyanoacrylate). An anti-inflammatory drug (meloxicam or Loxicom) was injected to facilitate recovery (1–10 d, 1 mg/kg).
Acute cranial window.
A cranial window for imaging was acutely implanted over the MOB immediately before the experiment. A plate with a round window was glued to the exposed skull over the main olfactory bulbs using Super Glue (cyanoacrylate). After the glue had hardened, the mouse was placed in a warming tube and the head was fixed in a holder via the plate. A craniotomy was opened to reveal the dorsal surfaces of both main olfactory bulbs (compare Figs. 1A, 3A) using a dental drill and a breakable blade holder. Care was taken to remove the bone without injuring the dura mater. The craniotomy was filled with 1.5% agarose (Sigma-Aldrich; Agarose type VII-A, low gelling temperature) and covered with a round (3 mm diameter) cover glass that fits inside the window in the plate. For antagonist experiments, phentolamine (10 μm) and propranolol (10 μm) were dissolved in the agarose used to fill the imaging window. We tested the efficacy of this application method with gabazine and NBQX (see Results).
Figure 1.

Intrinsic optical signals reveal suppression of glomerular responses after LC stimulation in the presence of odors. A, The response of glomeruli on the dorsal surface of the left hemisphere of the MOB to two odors as imaged with IOSs (inset: A, anterior; P, posterior; L, left; R, right). The blue and red arrows denote each of the responsive glomeruli identified by the analysis. These images were generated by subtracting images acquired during odor presentation from those acquired before odor presentation. B, An average response before LC stimulation (black trace) is contrasted with the average response trace afterward (red trace) in the same glomerulus. The two traces indicated illumination over time. The traces were each averaged over 20 trials, corrected for a slow baseline decay (see Materials and Methods), and then normalized to their respective average value before odor onset. The polygonal black markers and vertical dotted lines mark beginning and end of odor presentation. The y-axis therefore indicates the deviation from baseline activation in percentage of the baseline. We inverted the y-axis so that higher values indicate stronger activation. C–E, The y-axis indicates response strength after LC stimulation while the x-axis indicates response strength before LC stimulation. Small circles indicate the activity of glomeruli, and larger filled circles indicate the median glomerular response for each animal and odor. C, D, Show the data for glomeruli responding to the paired odor (red, presented with LC-stimulation trials) and unpaired odor (blue, presented between LC-stimulation trials) on the hemisphere ipsilateral and contralateral to the stimulated LC, respectively (9 animals). E, Shows the results of the sham control (4 animals). Data from both odors and hemispheres were combined in this case. F, The ratio between the response before and after LC stimulation was calculated for each glomerulus. The histograms display the distribution of glomeruli for the sham control and for the actual experiment divided by hemisphere.
Figure 3.

The pattern of suppression across glomeruli is consistent with a divisive gain mechanism. A, A plot of all ipsilateral glomerular responses measured with GCaMP2 imaging from Figure 2C, plotted with the same conventions. Baseline and postpairing responses are linearly correlated and the scatter plot is fit with a line that passes through the origin. The inset shows a plot at the same scale of mean activity during the odor among nonresponsive regions of the MOB. B, A scatter plot of suppression ratio against the baseline response for each glomerulus shows no correlation. C, D, Box plots of the distributions of changes in absolute fluorescence seen over the glomeruli plotted in A and B following sham stimulation (C) and LC stimulation (D). In each plot, changes in absolute fluorescence are indicated for the pre-odor (resting) period (black) and the odor period (red).
Imaging apparatus.
The mouse was positioned under a CCD video camera (Vosskühler CCD-1300QF) attached to a macro lens assembly (Nikon normal AF Nikkor 50 mm auto lens and Nikon telephoto AF DC Nikkor 105 mm lens; Petzold et al., 2008). The camera was focused on the glomerular layer of the main olfactory bulbs. The aperture was set to 8 for intrinsic optical signals and 2 for fluorescent signals, and the focal length was set to infinite. LEDs of different wavelengths were used for illumination. Intrinsic signals were visible in far/infrared light (∼780 nm), while fluorescence was excited by blue light (470 nm wavelength). A bandpass emission filter was placed in front of the blue LEDs and a 510 nm long-pass optical filter (Chroma Filters HQ510lp) was placed in front of the CCD camera to filter out the blue light from the LED.
Odor presentation.
The odors were presented using a custom-built olfactometer containing an eight-way solenoid that controls oxygen flow through eight vials, seven of which contained odorants dissolved in mineral oil (0.5% or 1%), and the remaining vial was empty (blank). Odorized oxygen was diluted 5:1 into a continuous carrier stream for a total flow of 2.5 L/min. To prevent odor accumulation, air was collected behind the animal with a vacuum pump. Odor presentation was 20 s when measuring intrinsic signals and 3 s when measuring calcium signals.
Electrical stimulation of locus ceruleus.
The implanted electrode was connected to an isolated pulse stimulator (A-M Systems; Model 2100) and a ground electrode was positioned under the skin behind the mouse's ear. The pulse generator was triggered 1 s before odor presentation onset. The stimulation consisted of 40 μA biphasic pulses of 100 μs duration generated at 5 Hz for 24 s (intrinsic optical imaging) or 5 s (calcium imaging).
Automated experimental control and data acquisition.
Custom software written in LabView (written by D.E.) controlled the data acquisition hardware and stimulus delivery according to a scripted protocol. The olfactometer, LEDs, and pulse stimulator were controlled by a digital I/O card (National Instruments; PCI-6503) connected with the devices via a terminal block (National Instruments; CB-50LP). For camera control and image acquisition a separate image acquisition card (National Instruments; IMAQ PCI-1422-LVDS) was used.
Imaging protocol.
During each trial, images were acquired from the camera before, during, and after odor presentation and stored as monochromatic image stacks. For intrinsic signals we acquired 250 frames before, 500 frames during, and another 250 frames after odor presentation at 25 frames per second (fps). For fluorescent signals we acquired 100 frames before, 75 frames during, and 50 frames after odor presentation at 25 fps. Differences in the frame counts for the two measurements reflect the different timescales necessary to acquire reliable signals.
Experimental sequence.
First, seven different odors and clean air were each presented three times in a “pretest.” Based on the responses, two odors were selected for the experiment. The two odors were presented alternately throughout the experiment with an interstimulus interval of 70 s (30 s for the moderated protocol). Each experiment consisted of two imaging phases spanning 15–20 odor repetitions with an intervening LC stimulation phase. During the stimulation phase, 30 LC stimulus trains were applied at regular intervals. One of the two selected odors was presented simultaneously with LC stimulation; the other odor was presented between LC stimulations. In the results, an experiment is defined as performance of the above procedure in one mouse and yielded measurement of two odor responses from either one or two hemispheres (ipsilateral and/or contralateral). Each mouse was stimulated only once.
Verification of the stimulation site.
After the experiment ended, the position of the stimulation electrode was marked by an electrolytic lesion using a pulse stimulator (three pulses at −10 μA, 10 s). Then the mouse was given a lethal injection of Euthasol and perfused with PBS followed by 4% paraformaldehyde. The skull was stored in paraformaldehyde overnight before the brain was extracted. The brain was then placed in 30% sucrose in PBS overnight, cut into 60 μm slices, and stained with cresyl violet.
Data analysis.
For quantification, the raw image stacks were analyzed with our custom MATLAB (The MathWorks; RRID:nlx_153890) software (written by D.E.). Active areas on the olfactory bulb were made visible by dividing the average frame image acquired during stimulation by the average frame image acquired before stimulation (Meister and Bonhoeffer, 2001). Typical results are shown in Figures 1A and 2A. Regions of interest that corresponded to activated glomeruli for each odor were identified and the mean grayscale value was computed frame by frame from the raw image data. This produced a signal trace for every repetition and every glomerulus. The single repetition traces were then averaged for repetitions before and after odor pairing, respectively. Slow baseline shifts were corrected by fitting an exponential function to the baseline and subtracting it from the data. This analysis resulted in traces like those shown in Figures 1B and 2B. Only glomeruli that showed a clear response correlated with odor onset in at least one of the experimental phases were included in the dataset. From the traces we calculated the signal strength for each experimental phase as (|Rb − Ra|)/Rb * 100 with Rb as the mean baseline reflectance/fluorescence and Ra the mean reflectance/fluorescence during odor stimulation (plateau phase).
Figure 2.

Fluorescent OSN calcium signals reveal suppression of glomerular responses after LC stimulation in the presence of odors. A, The response of OSN terminals (glomeruli) on the dorsal surface of the left hemisphere of the MOB to two odors as imaged with GCaMP2 (inset: A, anterior; P, posterior; L, left; R, right). The blue and red arrows denote each of the responsive glomeruli identified by the analysis. These images were generated by subtracting images acquired during odor presentation from those acquired before odor presentation. B, An average response before LC stimulation (black trace) is contrasted with the average response trace afterward (red trace) in the same glomerulus. The two traces indicated illumination over time. The traces were each averaged over 20 trials, corrected for a slow baseline decay (see Materials and Methods), and then normalized to their respective average value before odor onset. The polygonal black markers and vertical dotted lines mark beginning and end of odor presentation. Due to the normalization, the y-axis indicates the deviation from baseline activation in percentage of the baseline. C–E, The y-axis indicates response strength after LC stimulation while the x-axis indicates response strength before LC stimulation. Small circles indicate the activity of glomeruli, and larger filled circles indicate the median glomerular response for each animal and odor. C, D, Show the data for glomeruli responding to the paired odor (red, presented with LC-stimulation trials) and unpaired odor (blue, presented between LC-stimulation trials) on the hemisphere ipsilateral and contralateral to the stimulated LC, respectively (5 animals). E, Shows the results of the sham control (5 animals). Data from both odors and hemispheres were combined in this case. F, The ratio between the response before and after LC stimulation was calculated for each glomerulus. The histogram indicates the distribution of glomeruli for the sham control and for the actual experiment divided by hemisphere.
Statistics.
The Kruskal–Wallis test (a nonparametric test for differences between independent distributions) followed by Tukey's honestly significant difference test was used to identify statistically significant differences (MATLAB; The MathWorks).
Results
We aimed to assess the persistent effects of noradrenaline from LC on odor responses in the glomeruli. We chose to use wide-field imaging because it allowed us to measure the amplitude of glomerular signals over an extended time period for multiple glomeruli (Rubin and Katz, 1999; Uchida et al., 2000; Meister and Bonhoeffer, 2001; Wachowiak and Cohen, 2001; Bozza et al., 2004; Lin da et al., 2006; Fletcher et al., 2009; Ma et al., 2012). As an initial step, we imaged intrinsic optical signals (IOSs), which reveal spots of activity that correspond to glomeruli.
IOSs are suppressed after LC stimulation during ongoing odor presentation
We measured the effects of LC activation on IOSs in the MOB. Figure 1A shows two differential images (mean odor frame − mean baseline frame) of the left MOB. Images were processed as described in Materials and Methods. Dark spots represent regions showing a change in reflectance of infrared light (indicative of neural activity) in response to two odors. Arrows indicate the locations of all activated glomeruli identified by our analysis in this example. Figure 1B shows an example of the temporal profile of the signal observed in one of these glomeruli. There is a clear deflection of the signal just after odor onset and a return to baseline after odor offset. As in this example, substantial attenuation of the signal was typically observed following LC stimulation.
To quantify this result, we stimulated LC via an implanted electrode 30 times and alternately presented two odors during this phase. Before and after stimulation we imaged the response of the glomeruli activated by both odors for 20 trials each. Sham control mice were treated identically, but we did not apply stimulation current to the LC.
In mice that received no stimulation current in the LC (“sham” condition), the glomerular IOSs measured before and after LC stimulation were indistinguishable. In Figure 1E, the mean response strength for the last 20 trials is plotted over the mean response strength for the first 20 trials, for each glomerulus (n = 88, from both hemispheres; four mice). The large transparent dots indicate median values for each animal. Clustering of the data along the unity line demonstrates that response strengths were stable and unaffected by sham LC stimulation.
In contrast, in mice that did receive LC stimulation in conjunction with odors (“paired” condition), IOSs in response to both odors were largely suppressed from baseline levels during the poststimulation phase (Fig. 1C,D). Most glomeruli on both hemispheres exhibited reduced responses after the LC-stimulation phase (n = 127 glomeruli, ipsilateral MOB; n = 82 glomeruli, contralateral MOB; nine mice), as the data points are mostly below the unity line. In some cases, the suppression was so complete that imperfect baseline correction of unresponsive glomeruli left a small negative signal (Fig. 1 C,D). Note also that some glomeruli increased responses after LC stimulations, but almost all of them derived from two mice tested on separate occasions. One of these mice yielded responsive glomeruli on the contralateral hemisphere that were all suppressed. In light of these observations, we are hesitant to conclude that enhancement is a widespread occurrence.
Figure 1F shows histograms of the ratio between the poststimulation and baseline response strengths (suppression ratio; see Materials and Methods) for all glomeruli in control mice, ipsilateral glomeruli in LC-stimulated mice, and contralateral glomeruli in LC-stimulated mice. For both populations of glomeruli (ipsilateral and contralateral) in LC-stimulated mice, this ratio was significantly lower than 1 [for the non-normally distributed data we report the median and the upper bounds of the first and third quartiles (Q1 and Q3, respectively); ipsilateral: median 0.44, Q1: 0.25, Q3: 0.76; contralateral: median 0.58, Q1: 0.30, Q3: 0.84; Wilcoxon signed rank test, contralateral: p = 0.000, ipsilateral: p = 0.000). However, this was not the case for glomeruli in control mice (median: 0.9975, Q1: 0.728, Q3: 1.27; Wilcoxon signed rank test, p = 0.89). Comparison of the three distributions showed that distributions for both hemispheres significantly differed from the control distribution (Kruskal–Wallis, χ2 = 53.75, p = 0.000, post hoc Tukey's HSD), but they were not different from each other (post hoc Tukey's HSD).
During the LC-stimulation phase, only one of the odors was presented simultaneously with LC stimulation (Fig. 1C,D, paired), while the other odor was presented between LC stimulations (Fig. 1C,D, unpaired). Yet, the suppression of glomerular responses was observed for both odors. Comparison between the distributions of suppression ratio for the two odors yielded no significant difference (Kruskal–Wallis, χ2 = 0.86, p = 0.35). Thus, LC-mediated plasticity of glomerular responses does not require temporal coincidence of LC activation and the affected odor.
Fluorescent calcium signals in OSNs are suppressed after LC stimulation
Intrinsic optical signals are closely correlated with the activity of OSNs, but they are not a direct measurement of activity in the axonal terminals of OSNs. Instead, the increase in red light absorbance that constitutes the IOS is due to locally increased blood flow and appears to be mediated by astrocyte activity in response to glutamate release (Gurden et al., 2006; Petzold et al., 2008; Soucy et al., 2009). The extent of contributions to these signals from other elements affected by glutamate release remains unclear.
We hypothesized that the changes we observed in glomerular activity after LC stimulation were due to reduced synaptic input from OSNs. Therefore, we moved on to more directly measure OSN synaptic input using wide-field fluorescence imaging in a mouse line that expresses the genetically encoded calcium sensor GCaMP2 exclusively in OSNs (OMP-GCaMP2; Yu et al., 2004; He et al., 2008; Ma et al., 2012).
We treated raw data for GCaMP2 fluorescence signals from OSNs in the same manner as data from IOS experiments (Fig. 2A,B). Figure 2A shows two differential images of the left MOB that reveal changes in GCaMP2 fluorescence evoked by two different odors. The round bright dots are glomeruli that were activated in response to the stimulus. Arrows indicate responsive glomeruli that were identified and selected for further analysis. As with the IOS data, we corrected for slow baseline decay in brightness. Comparison of the mean responses taken from a representative glomerulus before and after the stimulation phase reveals clear response suppression after LC stimulation (Fig. 2B).
In these experiments, we measured the effects of LC stimulation specifically on the presynaptic input from OSNs in OMP-GCaMP2 mice. As before, we repeatedly stimulated LC while alternately presenting two odors and imaged the response to the same two odors before and after this stimulation phase. Figure 2, C–F, depicts the results of these experiments in the identical format as in Figure 1C–F. In the absence of LC stimulation (sham condition), the calcium signals from OSNs at the glomeruli did not change (n = 58, from both hemispheres; five mice). This is illustrated by the scatter plot in Figure 2E, in which the data for most glomeruli fall close to the unity line.
As seen with IOSs, the fluorescent calcium response to odors was suppressed after LC stimulation (Fig. 2C,D). The measurements for nearly all glomeruli on both hemispheres (n = 62 glomeruli, ipsilateral MOB; n = 24 glomeruli, contralateral MOB; five mice) were at or below the unity line. Plotted as histograms of suppression ratio, the distributions for ipsilateral and contralateral glomeruli in LC-stimulated mice were significantly lower than 1 (ipsilateral: median 0.52, Q1: 0.41, Q3: 0.66; contralateral: median 0.54, Q1: 0.42, Q3: 0.83; Wilcoxon signed rank test, contralateral: p = 0.000, ipsilateral: p = 0.000). In contrast to the findings with IOSs, the sham control mice also show a deviation from 1, which we attribute to bleaching (median: 0.74, Q1: 0.62, Q3: 0.88; Wilcoxon signed rank test, p = 0.000). Comparison of the populations shows that the distributions of ipsilateral and contralateral glomeruli differ significantly from the distribution of control glomeruli (Kruskal–Wallis; χ2 = 25.3; p = 0.000; post hoc Tukey's HSD), but not from each other.
As was the case with the IOS data, the suppression of glomerular responses was evident for both the paired and unpaired odors. Comparing the suppression ratios for glomeruli responsive to the two odors, we found no significant difference (Kruskal–Wallis; χ2 = 3.02; p = 0.083). These data confirm that LC-mediated plasticity of OSN input to the glomeruli does not require temporal coincidence of LC activation and the affected odor.
Further analyses of the changes across all glomeruli are consistent with LC stimulation causing a change in the gain of presynaptic input to the MOB. In other words, the degree of suppression was the same regardless of the initial strength of the signal in a given glomerulus. Figure 3A shows that the data from Figure 2C are well fitted to a linear function that passes through the origin. For the ipsilateral glomeruli, responses seen after LC stimulation were significantly linearly correlated to those seen at baseline (Pearson correlation coefficient r = 0.79, p = 0.000). Figure 3B further shows that the relative amount of suppression for glomeruli was unrelated to their baseline response strength (Pearson correlation coefficient r = −0.15, p = 0.16). These observations are consistent with LC-stimulation pairing uniformly scaling input to all active glomeruli. As shown in Figure 3A (inset), this modulation was not evident in unresponsive glomeruli. Our data further reveal that this effect is not simply due to changes in resting fluorescence. No change in the absolute brightness of responsive glomeruli during baseline or odor periods was observed in sham controls (Fig. 3C). While there was evidence of absolute brightness changes after LC stimulation, those changes were comparable during baseline and odor periods (Fig. 3D).
Odor responses imaged in OMP-GCaMP2 mice were sufficiently strong and reliable to permit examination of the fluctuations of responses from trial to trial. In Figure 4, A–D, we show the trial-by-trial data for these experiments. The scatter plots indicate the response strength of each glomerulus normalized to the baseline activity during each odor presentation. We did not image during the LC-stimulation period (repetitions 21–50) to limit bleaching effects. A general downward shift is apparent; however, glomeruli activated during LC stimulation were further suppressed.
Figure 4.
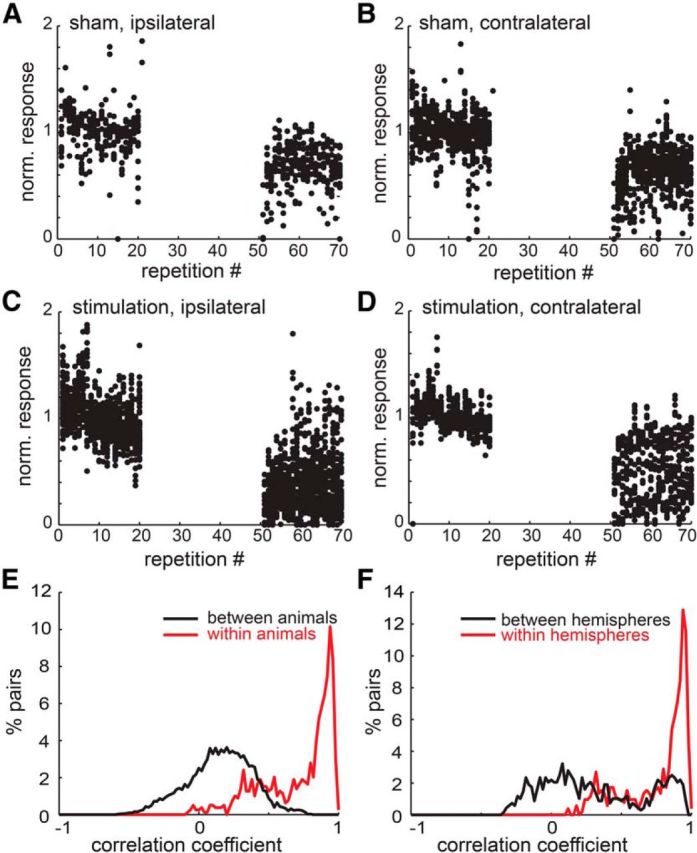
Trial-by-trial calcium signals and correlation between glomeruli. We show the calcium response of all glomeruli to the two odors on each hemisphere from all animals. All plots indicate the response strength during the experiment, normalized to the mean activation during the first 20 odor presentations, as the baseline varied for each glomerulus. No imaging was performed during the LC activation. A, B, For sham control experiments, the responses of glomeruli on the hemispheres ipsilateral and contralateral to the stimulation electrode, respectively. C, D, Corresponding data for animals undergoing LC stimulation. E, F, Correlation histograms of percentage pairs over correlation coefficient (bin size 0.04). Autocorrelations were omitted. E, The red line corresponds to pairs of glomeruli responding to the same odor in the same mouse. The black line shows correlation of glomeruli from different animals. F, The red line corresponds to pairs of glomeruli that respond to the same odor and are located in the same hemisphere. The black line corresponds to pairs of glomeruli that respond to the same odor but were found on different hemispheres of the MOB.
The change in signal strength over repetitions in glomeruli, which respond to the same odor and are located on the same hemisphere, were highly correlated. To show correlations between groups of glomeruli we present correlation histograms as percentage of pairs over the correlation coefficient (bin size = 0.04 bins) in Figure 4E,F. In Figure 4E we show that glomeruli, which respond to the same odor within a mouse, correlate well (red line) while glomeruli do not correlate across animals (black line). In Figure 5F we show that glomeruli, which respond to the same odor but are localized on different hemispheres, correlate only weakly (black line) while those located on the same hemisphere correlate well.
Figure 5.

Application of drugs in agarose to the MOB surface effectively manipulates glomerular transmission. We dissolved GABA antagonist gabazine (A) or AMPA antagonist NBQX (B) in agarose (10 μm) and applied the agarose to the surface of the MOB. Action potentials were recorded from multiple units with extracellular electrophysiology. A, B, Top, Shows a histogram (bin size: 10 s) of multi-unit spike rates during application of gabazine (A) or NBQX (B). The gray bar indicates the application of drug. The middle (1) and bottom (2) parts show raw recording traces taken at time points corresponding with the arrows 1 and 2, respectively. Gabazine successfully disinhibited mitral cells and NBQX successfully inhibited mitral cell firing.
Effects of LC stimulation on OSNs depend on noradrenaline receptors
We showed that LC stimulation triggers persistent changes in glomerular responses to odors, and we attribute these changes to reduced synaptic activity at OSN terminals. The question remains whether these effects are caused by noradrenaline release in the glomerular layer, or they involve an indirect mechanism. To answer this question, we topically applied the α- and β-noradrenergic receptor antagonists phentolamine and propranolol to the MOB surface during imaging experiments. The drugs were dissolved in the agarose placed on the brain surface in the cranial window (see Materials and Methods) and were therefore present throughout the experiment.
Initially, we used electrophysiology to confirm that drugs applied in this manner gain access to the glomerular layer. These controls were performed with the GABAA receptor antagonist gabazine (10 μm; n = 2) and AMPA-type glutamate receptor antagonist NBQX (10 μm; n = 2) while recording electrical signals in the main olfactory bulb. Gabazine and NBQX reliably and reversibly excited and suppressed multi-unit action potentials, respectively, in the mitral cell layer (Fig. 5) when dissolved in agarose and applied to the dorsal surface of the MOB. Thus we found it safe to use this method to apply noradrenaline receptor antagonists.
Pilot experiments using phentolamine and propranolol showed that doses >60 μm phentolamine and propranolol alone or in combination abolished responses in the fluorescent calcium signal (data not shown). When we lowered the concentration to 10 μm, the odor responses remained stable throughout a time frame suitable for our experiments. Given the low dose of antagonists, and to operate within the potentially limited window of drug effects, we chose to apply a moderated LC-stimulation protocol as described previously (Shea et al., 2008).
First we confirmed that this moderate LC-stimulation regime still reliably resulted in a suppression of odor-evoked fluorescent calcium signals after the stimulation phase (Fig. 6A; n = 48 glomeruli; three mice). Then we separately performed experiments in different mice with phentolamine and propranolol present throughout the procedure. The suppression was significantly attenuated in the presence of the antagonists (Fig. 6B; n = 42 glomeruli; four mice).
Figure 6.

Blocking noradrenaline receptors abolished the suppression of glomerular responses after LC stimulation. A, B, The y-axis indicates response strength after pairing while the x-axis indicates response strength before pairing. Small circles indicate the activation of glomeruli; larger filled circles indicate the median for each animal and odor. A, B, Show glomeruli responding to the paired odor (red, presented during LC-stimulation trials) and unpaired odor (blue, presented between LC-stimulation trials) on both hemispheres, for the animals treated with noradrenaline antagonists (B, 4 animals) and saline control animals (A, 3 animals). C, The ratio between the response before and after LC stimulation was calculated for the glomeruli in each group and the distribution is illustrated in the histogram.
The responses after LC stimulations were linearly related to the baseline responses in control (Pearson correlation coefficient r = 0.93, p = 0.000) as well as noradrenaline antagonist (Pearson correlation coefficient r = 0.87, p = 0.000) experiments (Fig. 6A,B). The histogram of suppression ratio in Figure 6C reveals a rightward shift in the distribution with antagonists (median: 0.81, Q1: 0.71, Q3: 0.88; Wilcoxon signed rank test, p = 0.000) compared with the distribution of glomeruli without antagonists (median: 0.60, Q1: 0.53, Q3: 0.68; Wilcoxon signed rank test, p = 0.000). These two distributions were significantly different (Kruskal–Wallis, χ2 = 37.48, p = 0.000). Thus, the observed suppression of OSN input to the MOB after LC stimulation at least partly depends on noradrenaline receptor activation in the superficial MOB.
LC stimulation in the absence of odors intensifies suppression of OSN input
Since suppression of odor responses equally affected odors whether they occurred on or between simulation trials, we directly tested whether LC stimulation could suppress glomerular responses when no odors were present during the LC-stimulation phase (unpaired LC stimulation). These experiments were performed in the same manner as the moderated stimulation protocol above with the exception that no odor was presented during the stimulation phase.
Unexpectedly, when no odors were present during the LC-stimulation phase, all imaged glomeruli in all experiments were suppressed (n = 58 glomeruli; four mice; Fig. 7A). The close linear relationship between baseline and poststimulation responses (Pearson correlation coefficient r = 0.93, p = 0.000) was again consistent with uniform scaling of responses to odors not presented during the stimulation phase. The histograms of suppression ratio in Figure 7B reveal a leftward shift in the distribution from unpaired LC stimulation (median: 0.44, Q1: 0.38, Q3: 0.47; Wilcoxon signed rank test, p = 0.000) compared with that of not only sham stimulation, but also paired LC stimulation. All three distributions were significantly different (Kruskal–Wallis, χ2 = 104.3, p = 0.000). Therefore, LC suppression was actually stronger when stimulation was performed in the absence of an odor.
Figure 7.

LC stimulation in the absence of odors leads to enhanced suppression compared with LC stimulation in the presence of odors. A, The y-axis indicates response strength after unpaired LC stimulation (stimulation in the absence of an odor) while the x-axis indicates response strength before stimulation. Small circles indicate the activation of glomeruli (n = 58); large filled circles indicate the median for each animal odor (4 animals). The plot shows glomeruli on both hemispheres responding to either of two odors. B, The ratio between the response before and after stimulation was calculated for all glomeruli and the distribution is illustrated in the histogram. For comparison, the according distributions are shown for sham control experiments (top) and LC stimulation using the same protocol that was paired to odors (middle).
Discussion
Here we investigated modulation of synaptic input from olfactory sensory neurons to the glomeruli of the main olfactory bulb in anesthetized mice following a phase of increased noradrenaline release. By comparing the magnitude of IOS odor responses in the glomeruli before and after LC stimulation during odor exposure, we found that glomerular activity was suppressed long term by noradrenaline. Subsequent imaging experiments using mice expressing the genetically encoded calcium sensor GCaMP2 selectively in OSNs allowed us to confirm that this suppression is implemented as a reduction in the gain of presynaptic input to the glomeruli. Pharmacological manipulations revealed that LC-mediated suppression required noradrenergic receptor activation in the glomerular layer. Surprisingly, LC stimulation in the absence of odors also resulted in reduction of odor response, which appears to be even stronger. Thus, the presence of odors during episodes of elevated noradrenaline levels is not necessary to induce suppression of odor responses.
We were surprised to find that OSN terminals undergo persistent modulation by noradrenaline. Although noradrenergic fibers from LC course through all layers of the MOB (McLean et al., 1989), and noradrenergic receptors are present in the glomerular layer (Day et al., 1997; Winzer-Serhan et al., 1997a,b), these inputs are sparser than those to deeper layers. Moreover, an in vitro study that examined modulation of signaling in the glomerulus did not detect any acute changes in the presence of noradrenaline (Hayar et al., 2001). Interestingly, odor-conditioned fear memories were also recently shown to modify presynaptic glomerular inputs (Kass et al., 2013).
The role of granule cells in the noradrenergic modulation of MTs has been the subject of more intensive study than the glomerular processes. In vitro studies of the MOB circuit have established that noradrenaline acutely enhances the sensitivity of MTs to odor input directly and via release of inhibition from granule cells (Hayar et al., 2001; Nai et al., 2010; Pandipati et al., 2010; Linster et al., 2011). These in vitro observations are consistent with the acute effects of LC stimulation in vivo (Jiang et al., 1996). The synergy of sensitization and disinhibition of the mitral cells has been proposed as a key step in initiating long-term changes to the MOB network, including habituation or suppression of MTs and enhancement of oscillatory rhythms (Brennan and Keverne, 1997; Gire and Schoppa, 2008; Shea et al., 2008; Pandipati et al., 2010).
Shea et al. (2008) also stimulated LC in vivo during odor presentation and found that odor responses in MTs were suppressed after LC-odor pairing. The MTs also showed a reduced odor response which, at least in part, may be a consequence of the effects we found in the olfactory sensory neurons. We also stimulated LC unilaterally; however, by imaging both olfactory bulbs we observed OSN input suppression in both hemispheres of the main olfactory bulb. This was not completely unexpected as it is known that a minority of noradrenergic LC neurons decussate and terminate in the contralateral MOB. Consistent with this asymmetry, the suppression in the contralateral hemisphere was smaller than in the ipsilateral hemisphere.
Shea et al. (2008) did not test whether LC stimulation without odors affects responses in MTs, but they did find that response suppression was specific for odors coincident with LC stimulation. In light of these results, we expected that any suppression of OSNs would also be selective for odors coincident with LC activation. From our data it appears possible that activating LC in the absence of odor stimuli may actually enhance OSN suppression. If this is the case, exposure to an odor during the LC-stimulation phase, even between LC-stimulation trains, may partially “protect” OSNs from suppression. This leads us to speculate that the effects of LC stimulation may change by interaction with incoming sensory data at the level of the whole MOB. Such a mechanism could specifically suppress the whole main olfactory system when it is not providing information about a noradrenaline release-evoking event. We find this an intriguing possibility which, however, needs further study.
How is a lasting suppression of OSN input to the MOB implemented in the bulbar network? One possibility is that OSN synaptic terminals undergo enhanced inhibition from periglomerular cells. Periglomerular cells are GABAergic and regulate synaptic input to the glomeruli through presynaptic inhibition of OSN terminals (Murphy et al., 2005). Thus, coordinated modulation of this network could plausibly implement the gain suppression we see here. These cells could also be a source for increased GABA release in response to a memorized odor that is observed in vivo after noradrenaline-dependent odor learning (Kendrick et al., 1992; Brennan et al., 1998). However, further detailed study will be required to test this speculation.
At first, it may seem counterintuitive that sensory responses to a learned stimulus would be reduced rather than sensitized. However, habituation—diminishing behavioral responses to a repeated and therefore familiar stimulus—is one of the most fundamental forms of learning. Behavioral habituation is frequently manifested in the brain by neuronal habituation (Horn, 1986). Moreover, sensory plasticity frequently includes dynamic increases in inhibition (for review, see Carcea and Froemke, 2013). Broad inhibition is an important component for enhancing the salience or “signal-to-noise ratio” by filtering redundant or overlapping portions of competing representations (Olshausen and Field, 2004; Assisi et al., 2007; Koulakov and Rinberg, 2011; Sachdev et al., 2012; King et al., 2013). We speculate that this may be the case here. Indeed, there is some indication in our data that responses to odors presented during the pairing phase may be partially protected from even stronger suppression. Such a bias could enhance sparseness. Ultimately, “sparsening” of the representation will entail increases in the activity of a small number of neurons in response to the learned stimulus against a background of global response reduction. This may be implemented as a two-stage process consisting of a nonselective subtraction and rectification step followed by multiplicative amplification. We speculate that noradrenergic modulation of the glomeruli may be a mechanism for implementing the first stage of representational sparsening.
Putting our findings into a behavioral context, several forms of noradrenaline-dependent memories are accompanied by physiological changes in the main olfactory bulbs (Wilson et al., 1987; Sullivan et al., 1989; Yuan et al., 2002). Furthermore, selective behavioral and physiological changes in response to an odor can be induced by increasing release of noradrenaline in the presence of that odor (Sullivan et al., 2000; Shea et al., 2008). This simulates what would occur during an episode of arousal. We therefore argue that there is strong evidence that LC-mediated plasticity in the olfactory bulb constitutes an important mechanism for arousal to facilitate odor memory formation. Surprisingly, these memories seem to affect even the initial detection of a stimulus by altering the signal as early as in the receptor neurons.
Footnotes
This work is supported by an award from The Esther A. and Joseph Klingenstein Fund to S.D.S. We thank D. Albeanu for generously providing technical assistance with our imaging system and C.R. Yu for the transgenic animals used in this study.
The authors declare no competing financial interests.
References
- Assisi C, Stopfer M, Laurent G, Bazhenov M. Adaptive regulation of sparseness by feedforward inhibition. Nat Neurosci. 2007;10:1176–1184. doi: 10.1038/nn1947. [DOI] [PMC free article] [PubMed] [Google Scholar]
- Aston-Jones G, Cohen JD. An integrative theory of locus coeruleus-norepinephrine function: adaptive gain and optimal performance. Annu Rev Neurosci. 2005;28:403–450. doi: 10.1146/annurev.neuro.28.061604.135709. [DOI] [PubMed] [Google Scholar]
- Berridge CW, Schmeichel BE, España RA. Noradrenergic modulation of wakefulness/arousal. Sleep Med Rev. 2012;16:187–197. doi: 10.1016/j.smrv.2011.12.003. [DOI] [PMC free article] [PubMed] [Google Scholar]
- Bouret S, Sara SJ. Network reset: a simplified overarching theory of locus coeruleus noradrenaline function. Trends Neurosci. 2005;28:574–582. doi: 10.1016/j.tins.2005.09.002. [DOI] [PubMed] [Google Scholar]
- Bozza T, McGann JP, Mombaerts P, Wachowiak M. In vivo imaging of neuronal activity by targeted expression of a genetically encoded probe in the mouse. Neuron. 2004;42:9–21. doi: 10.1016/S0896-6273(04)00144-8. [DOI] [PubMed] [Google Scholar]
- Brennan PA, Keverne EB. Neural mechanisms of mammalian olfactory learning. Prog Neurobiol. 1997;51:457–481. doi: 10.1016/S0301-0082(96)00069-X. [DOI] [PubMed] [Google Scholar]
- Brennan PA, Schellinck HM, de la Riva C, Kendrick KM, Keverne EB. Changes in neurotransmitter release in the main olfactory bulb following an olfactory conditioning procedure in mice. Neuroscience. 1998;87:583–590. doi: 10.1016/S0306-4522(98)00182-1. [DOI] [PubMed] [Google Scholar]
- Carcea I, Froemke RC. Cortical plasticity, excitatory-inhibitory balance, and sensory perception. Prog Brain Res. 2013;207:65–90. doi: 10.1016/B978-0-444-63327-9.00003-5. [DOI] [PMC free article] [PubMed] [Google Scholar]
- Chen WR, Shepherd GM. The olfactory glomerulus: a cortical module with specific functions. J Neurocytol. 2005;34:353–360. doi: 10.1007/s11068-005-8362-0. [DOI] [PubMed] [Google Scholar]
- Day HE, Campeau S, Watson SJ, Jr, Akil H. Distribution of α1a-, α1b- and α1d-adrenergic receptor mRNA in the rat brain and spinal cord. J Chem Neuroanat. 1997;13:115–139. doi: 10.1016/S0891-0618(97)00042-2. [DOI] [PubMed] [Google Scholar]
- Devore S, Linster C. Noradrenergic and cholinergic modulation of olfactory bulb sensory processing. Front Behav Neurosci. 2012;6:52. doi: 10.3389/fnbeh.2012.00052. [DOI] [PMC free article] [PubMed] [Google Scholar]
- Fletcher ML, Masurkar AV, Xing J, Imamura F, Xiong W, Nagayama S, Mutoh H, Greer CA, Knöpfel T, Chen WR. Optical imaging of postsynaptic odor representation in the glomerular layer of the mouse olfactory bulb. J Neurophysiol. 2009;102:817–830. doi: 10.1152/jn.00020.2009. [DOI] [PMC free article] [PubMed] [Google Scholar]
- Gire DH, Schoppa NE. Long-term enhancement of synchronized oscillations by adrenergic receptor activation in the olfactory bulb. J Neurophysiol. 2008;99:2021–2025. doi: 10.1152/jn.01324.2007. [DOI] [PubMed] [Google Scholar]
- Guérin D, Peace ST, Didier A, Linster C, Cleland TA. Noradrenergic neuromodulation in the olfactory bulb modulates odor habituation and spontaneous discrimination. Behav Neurosci. 2008;122:816–826. doi: 10.1037/a0012522. [DOI] [PMC free article] [PubMed] [Google Scholar]
- Gurden H, Uchida N, Mainen ZF. Sensory-evoked intrinsic optical signals in the olfactory bulb are coupled to glutamate release and uptake. Neuron. 2006;52:335–345. doi: 10.1016/j.neuron.2006.07.022. [DOI] [PubMed] [Google Scholar]
- Hayar A, Heyward PM, Heinbockel T, Shipley MT, Ennis M. Direct excitation of mitral cells via activation of alpha 1-noradrenergic receptors in rat olfactory bulb slices. J Neurophysiol. 2001;86:2173–2182. doi: 10.1152/jn.2001.86.5.2173. [DOI] [PubMed] [Google Scholar]
- He J, Ma L, Kim S, Nakai J, Yu CR. Encoding gender and individual information in the mouse vomeronasal organ. Science. 2008;320:535–538. doi: 10.1126/science.1154476. [DOI] [PMC free article] [PubMed] [Google Scholar]
- Horn G. Memory, imprinting and the brain: an inquiry into mechanisms, Oxford Psychology Series. Cambridge, UK: Oxford UP; 1986. [Google Scholar]
- Isaacson JS, Strowbridge BW. Olfactory reciprocal synapses: dendritic signaling in the CNS. Neuron. 1998;20:749–761. doi: 10.1016/S0896-6273(00)81013-2. [DOI] [PubMed] [Google Scholar]
- Jahr CE, Nicoll RA. Dendrodendritic inhibition: demonstration with intracellular recording. Science. 1980;207:1473–1475. doi: 10.1126/science.7361098. [DOI] [PubMed] [Google Scholar]
- Jiang M, Griff ER, Ennis M, Zimmer LA, Shipley MT. Activation of locus coeruleus enhances the responses of olfactory bulb mitral cells to weak olfactory nerve input. J Neurosci. 1996;16:6319–6329. doi: 10.1523/JNEUROSCI.16-19-06319.1996. [DOI] [PMC free article] [PubMed] [Google Scholar]
- Kass MD, Rosenthal MC, Pottackal J, McGann JP. Fear learning enhances neural responses to threat-predictive sensory stimuli. Science. 2013;342:1389–1392. doi: 10.1126/science.1244916. [DOI] [PMC free article] [PubMed] [Google Scholar]
- Kendrick KM, Lévy F, Keverne EB. Importance of vaginocervical stimulation for the formation of maternal bonding in primiparous and multiparous parturient ewes. Physiol Behav. 1991;50:595–600. doi: 10.1016/0031-9384(91)90551-X. [DOI] [PubMed] [Google Scholar]
- Kendrick KM, Lévy F, Keverne EB. Changes in the sensory processing of olfactory signals induced by birth in sheep. Science. 1992;256:833–836. doi: 10.1126/science.1589766. [DOI] [PubMed] [Google Scholar]
- King PD, Zylberberg J, DeWeese MR. Inhibitory interneurons decorrelate excitatory cells to drive sparse code formation in a spiking model of V1. J Neurosci. 2013;33:5475–5485. doi: 10.1523/JNEUROSCI.4188-12.2013. [DOI] [PMC free article] [PubMed] [Google Scholar]
- Koulakov AA, Rinberg D. Sparse incomplete representations: a potential role of olfactory granule cells. Neuron. 2011;72:124–136. doi: 10.1016/j.neuron.2011.07.031. [DOI] [PMC free article] [PubMed] [Google Scholar]
- Lin da Y, Shea SD, Katz LC. Representation of natural stimuli in the rodent main olfactory bulb. Neuron. 2006;50:937–949. doi: 10.1016/j.neuron.2006.03.021. [DOI] [PubMed] [Google Scholar]
- Linster C, Nai Q, Ennis M. Nonlinear effects of noradrenergic modulation of olfactory bulb function in adult rodents. J Neurophysiol. 2011;105:1432–1443. doi: 10.1152/jn.00960.2010. [DOI] [PMC free article] [PubMed] [Google Scholar]
- Ma L, Qiu Q, Gradwohl S, Scott A, Yu EQ, Alexander R, Wiegraebe W, Yu CR. Distributed representation of chemical features and tunotopic organization of glomeruli in the mouse olfactory bulb. Proc Natl Acad Sci U S A. 2012;109:5481–5486. doi: 10.1073/pnas.1117491109. [DOI] [PMC free article] [PubMed] [Google Scholar]
- Mandairon N, Peace S, Karnow A, Kim J, Ennis M, Linster C. Noradrenergic modulation in the olfactory bulb influences spontaneous and reward-motivated discrimination, but not the formation of habituation memory. Eur J Neurosci. 2008;27:1210–1219. doi: 10.1111/j.1460-9568.2008.06101.x. [DOI] [PubMed] [Google Scholar]
- McLean JH, Shipley MT, Nickell WT, Aston-Jones G, Reyher CK. Chemoanatomical organization of the noradrenergic input from locus coeruleus to the olfactory bulb of the adult rat. J Comp Neurol. 1989;285:339–349. doi: 10.1002/cne.902850305. [DOI] [PubMed] [Google Scholar]
- Meister M, Bonhoeffer T. Tuning and topography in an odor map on the rat olfactory bulb. J Neurosci. 2001;21:1351–1360. doi: 10.1523/JNEUROSCI.21-04-01351.2001. [DOI] [PMC free article] [PubMed] [Google Scholar]
- Mombaerts P. Axonal wiring in the mouse olfactory system. Annu Rev Cell Dev Biol. 2006;22:713–737. doi: 10.1146/annurev.cellbio.21.012804.093915. [DOI] [PubMed] [Google Scholar]
- Murphy GJ, Darcy DP, Isaacson JS. Intraglomerular inhibition: signaling mechanisms of an olfactory microcircuit. Nat Neurosci. 2005;8:354–364. doi: 10.1038/nn1403. [DOI] [PubMed] [Google Scholar]
- Nai Q, Dong HW, Hayar A, Linster C, Ennis M. Noradrenergic regulation of GABAergic inhibition of main olfactory bulb mitral cells varies as a function of concentration and receptor subtype. J Neurophysiol. 2009;101:2472–2484. doi: 10.1152/jn.91187.2008. [DOI] [PMC free article] [PubMed] [Google Scholar]
- Nai Q, Dong HW, Linster C, Ennis M. Activation of alpha1 and alpha2 noradrenergic receptors exert opposing effects on excitability of main olfactory bulb granule cells. Neuroscience. 2010;169:882–892. doi: 10.1016/j.neuroscience.2010.05.010. [DOI] [PMC free article] [PubMed] [Google Scholar]
- Olshausen BA, Field DJ. Sparse coding of sensory inputs. Curr Opin Neurobiol. 2004;14:481–487. doi: 10.1016/j.conb.2004.07.007. [DOI] [PubMed] [Google Scholar]
- Pandipati S, Gire DH, Schoppa NE. Adrenergic receptor-mediated disinhibition of mitral cells triggers long-term enhancement of synchronized oscillations in the olfactory bulb. J Neurophysiol. 2010;104:665–674. doi: 10.1152/jn.00328.2010. [DOI] [PMC free article] [PubMed] [Google Scholar]
- Petzold GC, Albeanu DF, Sato TF, Murthy VN. Coupling of neural activity to blood flow in olfactory glomeruli is mediated by astrocytic pathways. Neuron. 2008;58:897–910. doi: 10.1016/j.neuron.2008.04.029. [DOI] [PMC free article] [PubMed] [Google Scholar]
- Pissonnier D, Thiery JC, Fabre-Nys C, Poindron P, Keverne EB. The importance of olfactory bulb noradrenalin for maternal recognition in sheep. Physiol Behav. 1985;35:361–363. doi: 10.1016/0031-9384(85)90309-9. [DOI] [PubMed] [Google Scholar]
- Rangel S, Leon M. Early odor preference training increases olfactory bulb norepinephrine. Brain Res Dev Brain Res. 1995;85:187–191. doi: 10.1016/0165-3806(94)00211-H. [DOI] [PubMed] [Google Scholar]
- Rubin BD, Katz LC. Optical imaging of odorant representations in the mammalian olfactory bulb. Neuron. 1999;23:499–511. doi: 10.1016/S0896-6273(00)80803-X. [DOI] [PubMed] [Google Scholar]
- Sachdev RN, Krause MR, Mazer JA. Surround suppression and sparse coding in visual and barrel cortices. Front Neural Circuits. 2012;6:43. doi: 10.3389/fncir.2012.00043. [DOI] [PMC free article] [PubMed] [Google Scholar]
- Shea SD, Katz LC, Mooney R. Noradrenergic induction of odor-specific neural habituation and olfactory memories. J Neurosci. 2008;28:10711–10719. doi: 10.1523/JNEUROSCI.3853-08.2008. [DOI] [PMC free article] [PubMed] [Google Scholar]
- Soucy ER, Albeanu DF, Fantana AL, Murthy VN, Meister M. Precision and diversity in an odor map on the olfactory bulb. Nat Neurosci. 2009;12:210–220. doi: 10.1038/nn.2262. [DOI] [PubMed] [Google Scholar]
- Sullivan RM, Wilson DA, Leon M. Norepinephrine and learning-induced plasticity in infant rat olfactory system. J Neurosci. 1989;9:3998–4006. doi: 10.1523/JNEUROSCI.09-11-03998.1989. [DOI] [PMC free article] [PubMed] [Google Scholar]
- Sullivan RM, Zyzak DR, Skierkowski P, Wilson DA. The role of olfactory bulb norepinephrine in early olfactory learning. Brain Res Dev Brain Res. 1992;70:279–282. doi: 10.1016/0165-3806(92)90207-D. [DOI] [PubMed] [Google Scholar]
- Sullivan RM, Stackenwalt G, Nasr F, Lemon C, Wilson DA. Association of an odor with activation of olfactory bulb noradrenergic beta-receptors or locus coeruleus stimulation is sufficient to produce learned approach response to that odor in neonatal rats. Behav Neurosci. 2000;114:957–962. doi: 10.1037/0735-7044.114.5.957. [DOI] [PMC free article] [PubMed] [Google Scholar]
- Uchida N, Takahashi YK, Tanifuji M, Mori K. Odor maps in the mammalian olfactory bulb: domain organization and odorant structural features. Nat Neurosci. 2000;3:1035–1043. doi: 10.1038/79857. [DOI] [PubMed] [Google Scholar]
- Usher M, Cohen JD, Servan-Schreiber D, Rajkowski J, Aston-Jones G. The role of locus coeruleus in the regulation of cognitive performance. Science. 1999;283:549–554. doi: 10.1126/science.283.5401.549. [DOI] [PubMed] [Google Scholar]
- Valentino RJ, Van Bockstaele E. Convergent regulation of locus coeruleus activity as an adaptive response to stress. Eur J Pharmacol. 2008;583:194–203. doi: 10.1016/j.ejphar.2007.11.062. [DOI] [PMC free article] [PubMed] [Google Scholar]
- Wachowiak M, Cohen LB. Representation of odorants by receptor neuron input to the mouse olfactory bulb. Neuron. 2001;32:723–735. doi: 10.1016/S0896-6273(01)00506-2. [DOI] [PubMed] [Google Scholar]
- Wilson DA, Sullivan RM, Leon M. Single-unit analysis of postnatal olfactory learning: modified olfactory bulb output response patterns to learned attractive odors. J Neurosci. 1987;7:3154–3162. doi: 10.1523/JNEUROSCI.07-10-03154.1987. [DOI] [PMC free article] [PubMed] [Google Scholar]
- Winzer-Serhan UH, Raymon HK, Broide RS, Chen Y, Leslie FM. Expression of α2 adrenoceptors during rat brain development—I. α2A messenger RNA expression. Neuroscience. 1997a;76:241–260. doi: 10.1016/S0306-4522(96)00368-5. [DOI] [PubMed] [Google Scholar]
- Winzer-Serhan UH, Raymon HK, Broide RS, Chen Y, Leslie FM. Expression of α2 adrenoceptors during rat brain development—II. α2C messenger RNA expression and [3H]rauwolscine binding. Neuroscience. 1997b;76:261–272. doi: 10.1016/S0306-4522(96)00369-7. [DOI] [PubMed] [Google Scholar]
- Yu CR, Power J, Barnea G, O'Donnell S, Brown HE, Osborne J, Axel R, Gogos JA. Spontaneous neural activity is required for the establishment and maintenance of the olfactory sensory map. Neuron. 2004;42:553–566. doi: 10.1016/S0896-6273(04)00224-7. [DOI] [PubMed] [Google Scholar]
- Yuan Q, Harley CW, McLean JH, Knöpfel T. Optical imaging of odor preference memory in the rat olfactory bulb. J Neurophysiol. 2002;87:3156–3159. doi: 10.1152/jn.00917.2001. [DOI] [PubMed] [Google Scholar]