

Abstract
We determined the encoding properties of single cells and the decoding accuracy of cell populations in the medial premotor cortex (MPC) of Rhesus monkeys to represent in a time-varying fashion the duration and serial order of six intervals produced rhythmically during a synchronization-continuation tapping task. We found that MPC represented the temporal and sequential structure of rhythmic movements by activating small ensembles of neurons that encoded the duration or the serial order in rapid succession, so that the pattern of active neurons changed dramatically within each interval. Interestingly, the width of the encoding or decoding function for serial order increased as a function of duration. Finally, we found that the strength of correlation in spontaneous activity of the individual cells varied as a function of the timing of their recruitment. These results demonstrate the existence of dynamic representations in MPC for the duration and serial order of intervals produced rhythmically and suggest that this dynamic code depends on ensembles of interconnected neurons that provide a strong synaptic drive to the next ensemble in a consecutive chain of neural events.
Keywords: medial premotor cortex, neural dynamics, sequential processing, temporal processing
Introduction
A rhythm can be defined as a regular and repeated pattern of movement and sound, and it is considered a supramodal entity fully determined by both its sequential and time information (Merchant and Honing, 2013). We can recognize and reproduce a large number of rhythms, suggesting that individual rhythms can be internally represented; however, the neural mechanisms underlying representation of rhythms are not understood. In contrast, the neural underpinnings of motor sequential behavior and of interval timing have been separately investigated. For example, the medial premotor cortex [MPC; supplementary motor area (SMA) and pre-SMA] is considered a critical node in the control of movement sequences. Cells in this area increase in activity before a specific sequence of three movements or between particular pairs of movements during the push—pull–turn task (Tanji and Shima, 1994). MPC also shows responses associated with the serial order of a movement (i.e., first, second, or third movements) regardless of the sequence structure (Clower and Alexander, 1998). In addition, imaging studies have implicated the MPC as a fundamental area for temporal information processing during motor-timing tasks involving single or multiple intervals (Rao et al., 1997; Wiener et al., 2010). Single cells recorded from MPC encode the duration and the context in which intervals are produced during motor-timing tasks (Mita et al., 2009). Indeed, the activity of MPC cells was recorded in a recent neurophysiological study using a synchronization-continuation task (SCT), where monkeys tapped on a push-button to produce six isochronous intervals in a sequence. The results showed that the tapping behavior in the SCT may depend on the cyclic interplay between different neuronal chronometers in MPC that quantify in their instantaneous activity the time passed and the remaining time for an action (Merchant et al., 2011). MPC cells are also tuned to the duration of the produced intervals in this task and all possible preferred intervals are represented in the cell population, suggesting that this area has an abstract representation of time (Merchant et al., 2013a). Finally, cells in MPC can be tuned to both the serial order and the duration of the intervals produced rhythmically (Merchant et al., 2013a).
A strong position in the timing literature is the notion that the quantification of time is a dynamical and computational ability of all cortical circuits, and that it may be performed locally. This view, based on network simulations and in vitro experiments, implies that cortical networks can tell time as a result of time-dependent changes in synaptic topology and cellular biophysics, which influence the population response to behavioral events in a history-dependent manner (Karmarkar and Buonomano, 2007; Goel and Buonomano, 2014). Thus, a critical and unresolved question is whether the cells that are tuned to serial order and/or interval show dynamical interactions that may define the temporal and sequential structure of rhythmic behavior. Here we determined the encoding properties and the decoding accuracy of small ensembles of interconnected MPC cells to reconstruct in a time-varying fashion the duration and serial order of the six intervals produced during the SCT.
Materials and Methods
General.
All the animal care, housing, and experimental procedures were approved by the National University of Mexico Institutional Animal Care and Use Committee and conformed to the principles outlined in the Guide for Care and Use of Laboratory Animals (NIH, publication number 85-23, revised 1985). The two monkeys (Macaca mulatta, both males, 5–7 kg BW) were monitored daily by the researchers and the animal care staff, and every second day from the veterinarian, to check the conditions of health and welfare. To ameliorate their condition of life we routinely introduced in the home cage (1.3 m3) environment toys (often containing items of food that they liked) to promote their exploratory behavior. The researcher that tested the animals spent half an hour per day interacting with the monkeys directly, giving, for example, new objects to manipulate.
SCT.
The SCT has been described in detail previously (Zarco et al., 2009; Merchant et al. 2011). On each trial, the monkey tapped a button seven times in succession (producing six intervals) with the goal of maintaining a constant intertap interval duration across all taps. (In this paper we refer to the time period between taps as “intervals” and to the amount of time between taps as “interval duration” or “duration.”) The first four taps were made synchronously with a repetitive cue stimulus (either a visual stimulus presented on a computer monitor or an auditory tone). The monkey then had to tap the button three more times with the same intertap duration as instructed by the cues (Fig. 1). Five different intertap durations were used: 450, 550, 650, 850, and 1000 ms. During the recording of each group of cells (one “set”), the monkey performed five repetitions of each duration (for a total of 25 trials), with durations randomly ordered within each repetition. Trials were separated by an intertrial time of 1.2–4 s.
Figure 1.

Illustration of an SCT. Monkeys were required to push a button (r, gray line) each time stimuli with a constant interstimulus interval duration (s, black line) were presented, which resulted in a stimulus-movement cycle. After four consecutive synchronized movements, the stimuli stopped and the monkeys continued tapping with a similar interval duration for three additional intervals. Hence, six intertap intervals were generated by the monkeys in each trial. The instructed durations, defined by brief auditory or visual stimuli, were 450, 550, 650, 850, and 1000 ms, and were chosen pseudorandomly within a repetition.
Neural recording.
The extracellular activity of single neurons in the medial premotor areas was recorded using a system with seven independently movable microelectrodes (Merchant et al., 2001; 1–3 MΩ, Uwe Thomas Recording). All the isolated neurons were recorded regardless of their activity during the task, and the recording sites changed from session to session. At each site, raw extracellular membrane potentials were sampled at 40 kHz. Single-unit activity was extracted from these records using the Plexon off-line sorter (Plexon). Structural MRI was used to localize the recording sites (Merchant et al., 2011). An initial ANOVA using the discharge rate during the key-holding (control) period as a dependent variable, and the recording time across all trials of the SCT as a factor, was performed for each neuron to identify cells whose activity changed significantly during the recording. A significant variation of baseline rate across trials was taken to indicate instability of the cell's task responsiveness, and, therefore, these cells were excluded from further analyses. Of a total of 1570 cells recorded in the MPC in both monkeys (1267 of Monkey 1 and 303 of Monkey 2), 1083 did not show a statistically significant effect of recording time during the control period and were analyzed further. It is important to clarify that the 1083 cell dataset used in the present manuscript was analyzed before (Merchant et al., 2011, 2013a). In one paper we described the ramping activity of cells during the SCT and a serial-reaction time control task (Merchant et al., 2011), and in the other we reported the tuning properties of MPC cells to the duration and serial order, using the discharge rate of cells across all the intervals (Merchant et al., 2013a), without any analysis of the time-varying activity and functional coupling of cells across the intertap intervals.
Selection of significant cells.
We selected for further analysis those cells whose firing rates during each interval were significantly related to either the serial order of the interval or interval duration, using a two-way ANOVA that included as factors the Serial Order, Interval Duration, and Serial Order × Duration interaction. Cells were included if their activity was significantly related to serial order or duration in this ANOVA at a threshold of p < 0.05; 352 and 298 of 1083 cells met this inclusion criterion for serial order and duration, respectively, and were used in the subsequent analyses.
Mutual information analysis.
For each cell, we calculated the mutual information (MI) of its firing rate and the serial order or duration of the interval, at each time bin. MI of the cell's firing rate in a bin (r) and the serial order of the interval (I) was computed as follows:
 |
where p(r, I) is the joint probability of r and I, p(r) is the probability of a particular spike rate across all rates for that cell during that bin, and p(I) is the probability of each serial order or duration: 0.167 (1/6) for serial order and 0.2 (1/5) for duration (Nelken et al., 2005).
Decoding sequence serial order within an intertap interval.
We used a pattern classification analysis (“classify” function in the MATLAB Statistical Toolbox; MathWorks) to decode the serial order of each produced interval (Crowe et al., 2010). First, we divided each trial into time bins such that each interval contained 20 time bins (Fig. 2A). This meant that if the monkey perfectly matched an instructed interval duration, each bin of an instructed 450 ms interval would be 22.5 ms long (450/20 = 22.5), each bin of the 550 ms instructed interval would be 27.5 ms long, and so on. Since monkeys actually produced a range of intervals, the time bins on any particular produced interval were usually slightly shorter or longer than if a perfect interval had been produced. We then calculated the firing rate of each of the 352 significant neurons within each bin. We used the pattern of firing rates across all 352 serial-order cells to decode which of six serial-order positions (1–6, representing the three Synchronization intervals and three Continuation intervals) that the bin had been recorded from, as follows. First, we organized the neural data at each bin into observations, defined as a repetition of a particular bin within one of the six intervals within a trial, across all 25. Thus, at each time bin there were 150 observations of serial-order position (25 trials each of serial orders 1–6; Fig. 2B). We collapsed across serial orders, since this variable changed within a trial, allowing us to compare population activity across serial orders during a canonical intertap interval. Using these observations, we determined the degree to which neural activity represented serial order by classifying each observation as one of the six serial orders, based on the pattern of firing rates across the population of cells. In this analysis, 4/5 of the observations were used as training data to obtain an average pattern of activity across the neural population for each serial order. The activity pattern recorded on each of the remaining 1/5 of observations was then compared with each of the average patterns, and that observation was classified as the serial order with the closest matching average pattern. The percentage of observations correctly classified was an indication of the strength with which the neural population represented serial order. This process was repeated four more times such that every observation was classified at each bin. We then repeated this analysis at each time bin, initially using training and testing observations from the same time bin (i.e., classifications were based on the match between patterns of activity on different observations all taken from the same bin within a produced interval). This produced an overall decoding time course, which shows the strength of serial-order representation from the start of a produced interval to its end.
Figure 2.
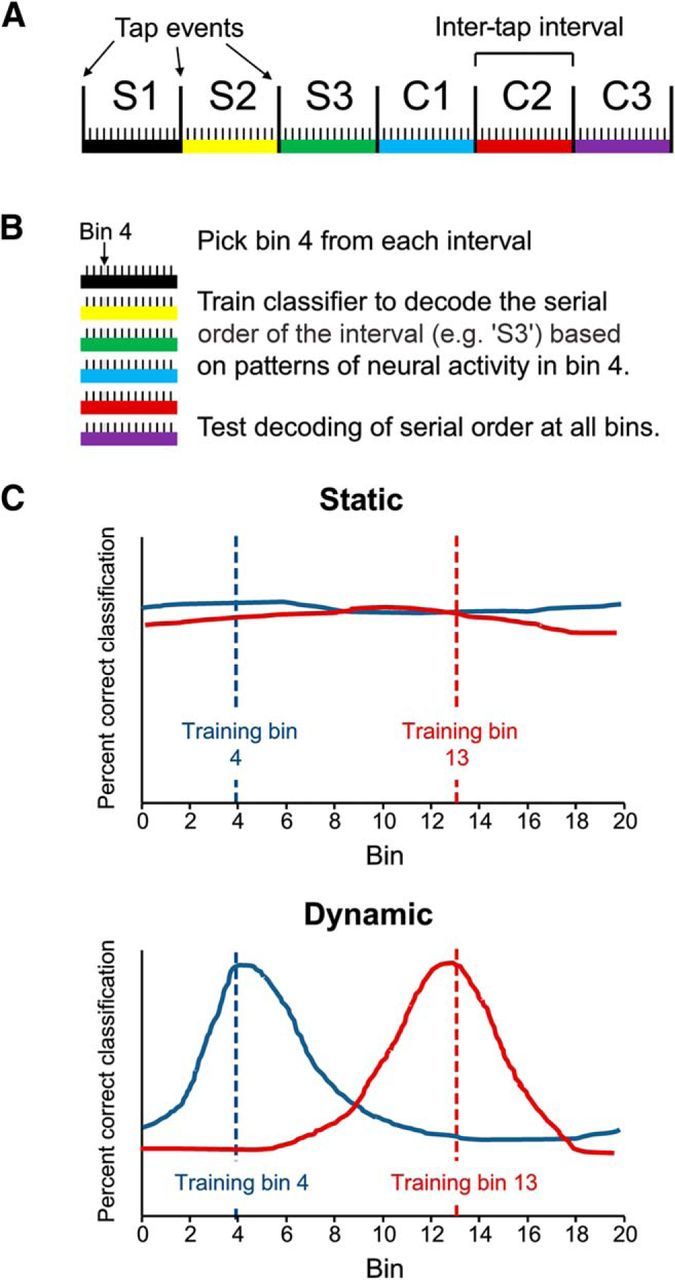
Illustration of serial-order decoding analysis. A, Each trial consisted of six produced intertap intervals (colored bars S1–C3) per duration. Monkeys performed five trials in each set. B, To decode serial order during the intertap interval, we divided each interval into equally spaced bins and collected observations at each bin across six intervals and five trials. Thus, at each bin, we obtained 30 observations. We used the patterns of activity of 352 cells to decode the serial order of each of the 30 observations. On each iteration of the decoding, we trained the decoder at one bin and used the resulting classification functions to decode serial order at all bins. We repeated this process using each bin as the training bin, providing one decoding time course for every bin. The proportion of observations correctly classified at each bin is an indication of how reliably patterns of activity across the population vary as a function of serial order. C, By training the decoder at a particular bin (dashed lines) and classifying at all other bins (solid lines), we were able to test whether the representation of serial order was static over time or dynamic. If patterns of neural activity that represent different serial orders remain the same across the intertap interval (Static representation, top), decoding accuracy should be consistent across all bins, no matter which bin was used to train the decoder. If serial order was represented by different patterns of activity at different times (Dynamic representation, bottom), then decoding should be highest at bins nearest the training bin.
To determine whether the representation of serial order was dynamic, we extended the above analysis by training the decoder on one bin, and using the average patterns of activity thus generated, classified observations taken from all 20 bins within the interval. If the same patterns of neural activity were associated with serial orders across the entire interval, decoding accuracy should remain unaffected by testing at different bins from where the training data were obtained (Fig. 2C, Static). Alternatively, if the representation of serial order was dynamic, patterns of activity that could be used to successfully decode serial order at one time would fail to provide information at other times in the trial, and decoding accuracy would decrease at these other times (Fig. 2C, Dynamic). We tested this by training the decoder with 4/5 of observations from one time bin and decoding 1/5 of the observations at each of 20 bins in the interval, and then repeating this cross-validation four more times until all observations were classified. We iterated this analysis by using each of the 20 bins as a training set, producing 20 decoding time courses, each with one bin used to train the classifier. This analysis was repeated for observations at each interval (450–1000 ms) separately, using 20 bins every time (bin sizes thus ranged from 22.5 to 50 ms). Illustrated decoding time courses were smoothed using a low-pass filter with a cutoff of 5/interval (e.g., 11 Hz for the 450 ms duration, 5 Hz for the 1000 ms duration).
Decoding interval duration.
We decoded the interval duration across all time bins within all the trials with a method analogous to that used for decoding serial order, using the population of 298 duration cells. At each bin, we classified each of 25 trials into one of five interval durations. As with the serial-order decoding, we trained our classifier at a particular bin, and then decoded duration at all bins to obtain a decoding time course. We iterated this procedure so that all bins in a trial were used as training bins.
Baseline correlation of subsets of cells participating in serial-order or duration representation.
To determine which cells were contributing to the successful decoding of serial order or duration at each normalized time bin, we computed a MI time course and compared it to the decoding time courses produced by training the decoding algorithm at each of the normalized bins (20 and 10 bins per interval for serial order and duration analyses, respectively). The MI analysis provides a measure indicating how each cell's activity regularly varies across durations or serial orders (Nelken et al., 2005). The decoding analysis above likewise detects consistent variation in activity across serial orders or durations, but does so at the population level. For each decoding time course produced, we found a set of neurons with similar MI time courses by computing the correlation between the two time courses. Specifically, we correlated each cell's MI time course with all decoding time courses, each produced by training the decoding algorithm at a particular time bin. A cell was defined as part of the subset contributing to decoding at bin B if its MI time course was significantly correlated (p < 0.0001) with the population decoding time course trained at bin B.
We measured the correlation of baseline activity of cell pairs selected in the above analysis. For each possible lag in assigned bin (0–19 for serial order, 0–59 for duration), we found all cell pairs with that lag [e.g., for bin lag of 5, Cell A (bin 1) and Cell B (bin 6) form a pair, Cell C (bin 13) and Cell D (bin 18) form another]. We then correlated pretrial activity (the 400 ms before the trial) across trials for each cell pair, and calculated the percentage of cell pairs with a significant (p < 0.05) correlation, across simultaneously recorded cells (points in Fig. 8A,B) and nonsimultaneously recorded cells (average percentage of cells significant shown by dashed line in Fig. 8B,C). Since cells could be assigned to more than one bin, it is possible for a cell pair's pretrial correlation to be counted for more than one bin lag. Because of the difficulty of finding simultaneously recorded cells at the many bin lags available in the analysis of duration cells, we used larger normalized bins (10 per interval) in this analysis to improve our signal.
Figure 8.

Decoding time courses. Each colored time course was generated by training the decoder at a particular bin, indicated by the vertical line of the same color, and then classifying serial order or duration at all bins. A, Example time courses showing the time evolution of serial-order representation. Decoding performance is highest near the training bin and falls off over time, indicating a dynamic representation. In this example, decoding was performed on trials with instructed durations of 1000 ms (∼50 ms bin width), using 30 observations at each time point (5 trials × 6 serial orders). Since there were six intertap intervals, chance decoding was 17%. The horizontal dashed line indicates the average decoding performance of the decoder on 100 bootstrap iterations of the analysis, in which serial orders were randomized. The horizontal dotted line indicates the 95th percentile of the bootstrap distribution. B, Example time courses showing dynamic representation of intertap interval duration. Decoding performance peaks at the training bin, and shows a cyclical variation, with similar peaks in other intertap intervals (25 observations at each time point: 5 trials × 5 durations). Since there were five durations, chance decoding was 20%. Horizontal dashed and dotted lines indicate the mean and 95th percentile of 100 bootstrap iterations performed by randomizing duration. C, Example times courses of duration decoding when data were collapsed across intervals, as in the serial-order analysis. Dashed and dotted lines as in B.
Results
Two monkeys performed an SCT (Fig. 1) wherein they tapped a key in time with four evenly spaced visual or auditory stimuli (synchronization phase) and then continued to tap three more times with same duration (continuation phase). Hence, six intervals were produced in each trial. Five instructed intertap durations were used: 450, 550, 650, 850, and 1000 ms. In each set of trials, the monkeys performed five repetitions of each intertap duration. The monkeys were able to accurately produce the instructed intervals, showing an average underestimation of ∼50 ms across durations in the SCT (Merchant et al., 2013a). In addition, the temporal variability of the monkeys' tapping performance (defined as the SD of the individual inter-response intervals) increased linearly as a function of duration. Hence, the monkeys showed appropriate tempo performance in the SCT (Zarco et al., 2009; Merchant and Honing, 2013).
We analyzed the activity of 1083 MPC neurons during the SCT. Of these, 352 had activity that varied significantly (p < 0.05) with the serial order of the intertap interval (i.e., whether it was the first, second, etc., interval; “serial order cells”). Figure 3, left, shows the activity of three serial-order cells. In this and subsequent analyses, we normalized across all five durations by dividing each interval into 20 bins; in this case we then averaged firing rate across all trials. In addition to the variation in firing rate across intertap intervals (different serial orders), these cells also displayed peaks of activity within intervals that repeated cyclically in other intervals. The strength with which these cells represented serial order, as measured by MI, tended to scale with average firing rate (Fig. 3, right). Interestingly, the peak of MI for serial order was at different time bins for the three cells, suggesting that the encoding of the task parameter was dynamical. Representation of serial order within each cell was similar across all intertap durations. For example, the cell in Figure 3A is also shown in Figure 4A, which depicts its activity averaged across all trials of each intertap duration (20 bins per intertap interval). This cell shows highest activity during the first Synchronization interval (S1) and lowest activity during the first Continuation interval (C1), at all durations. Additionally, the time within an interval that cells' activity was most related to serial order was also consistent across durations (Fig. 4B). Indeed, the peak of the MI time course was in a similar bin across durations, with a median SEM of 1.1 bins across the population of serial-order cells (Fig. 4C). These findings support the notion of the encoding of serial-order scales across durations, showing a representation that is relative to the total duration of the produced interval.
Figure 3.

Activity of sample cells, averaged across intertap interval durations using normalized bins (20 bins per interval for all durations). A, Left, Shows the average firing rate (across 30 trials) of a neuron whose activity varied as a function of the serial order of intertap interval. Vertical lines indicate tap events. The three Synchronization intervals (S1–S3) and three Continuation intervals (C1–C3) are indicated under the x-axis. Right, Shows the average firing rate (solid line) and MI of firing rate and serial order (dashed line), within the intertap interval, across 180 observations (30 trials × 6 serial orders). B, C, Activity of two other cells with activity significantly related to serial order. Maximum possible MI = 2.58 bits.
Figure 4.
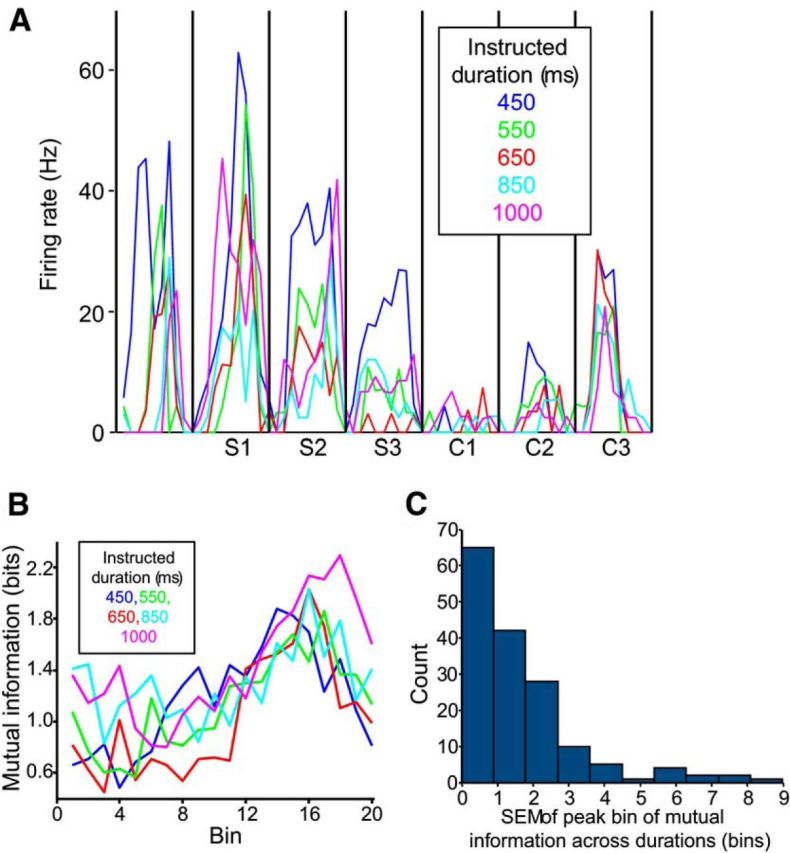
The activity of serial-order cells across interval durations (20 bins per interval). A, The average firing rate of a serial-order neuron, across the five instructed intertap durations (5 trials per duration). Vertical lines indicate tap events. Synchronization (S1–S3) and Continuation (C1–C3) intervals are indicated under the x-axis. B, The MI time courses for a serial-order neuron, across the five durations (30 observations–6 serial orders × 5 trials–per point). MI tended to peak late in the interval at all durations (maximum possible MI = 2.58 bits). C, Gaussian curves were fit to each cell's MI time course, at each duration (e.g., the lines in B). We calculated the SEM of the peaks of these curves (in bins), for each cell, across durations. The histogram shows these SEM values; lower values indicate cells with similar peaks across durations (e.g., the cell in B). Data are from 169 cells with at least two successful Gaussian fits with peaks in the bin range.
In addition to serial-order cells, we also found a population of 298 cells with activity that varied significantly (p < 0.05) as a function of instructed interval duration. Figure 5 shows the average firing rate of such a duration cell with a preference for long durations. Note that the width of the peak in rate is similar across all durations for which the cell was active (550–1000 ms). Since the plot is scaled to show 20 bins per interval regardless of the duration, this indicates that the cell was active for about the same proportion of each interval, across all durations. As with the serial-order cells, the strength of duration representation (MI) in this cell peaked during periods of high firing rate (Fig. 5B) at specific bins, not across all the interval. Interestingly, 118 cells showed significant modulations in their activity for both serial order and duration. Thus, it is obvious that the duration dynamics depicted in Figure 5B also show that these cells have a “preferred” serial order by virtue of a peak in one of them, though only approximately 1/3 of them are statistically related to serial order.
Figure 5.
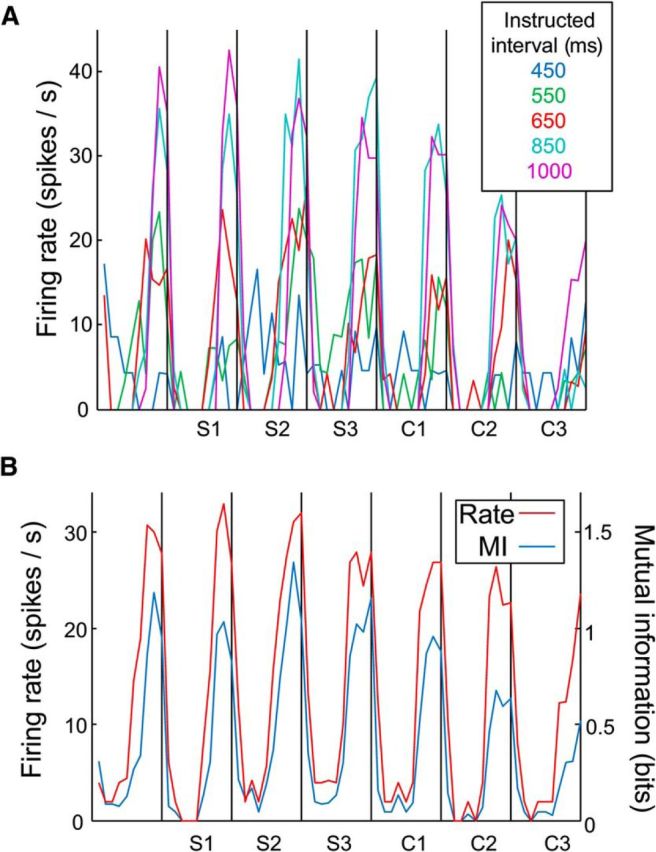
The activity of a duration cell, using normalized bin across durations (20 bins per interval). A, The average firing rate of a neuron whose activity varied as a function of the intertap interval duration, at each duration (5 trials per duration). Conventions as in Figure 2. B, Activity averaged across durations, compared with the MI of this cell's firing rate and intertap interval duration (across 25 trials–5 trials × 5 durations). Maximum possible MI = 2.32 bits.
Dynamic representation of serial-order and interval duration
In general, cells displayed cyclical activity patterns similar to those seen in Figures 3–5, with a large peak in activity in one of the intertap intervals repeated in other intervals, aligned to the tap events. This, combined with cells having preferred serial orders, resulted in a dynamic pattern of activity across the population of cells. Figure 6A shows the average normalized firing rate of the population of serial-order cells, aligned to the bin of peak activity. Smaller flanking peaks occur at successive intertap intervals (Fig. 7A). There was a dynamic activation of cells throughout the task. A similar dynamic pattern of activation is seen in the population of duration cells (Figs. 6B, 7B). Consequently, these findings suggest that discrete neural ensembles encode, through small time windows, the temporal and sequential structure of the SCT.
Figure 6.

Dynamic activity within populations of serial-order and duration cells. A, Average normalized firing rate of cells with activity significantly related to serial order, aligned to bin of maximum rate. Each intertap interval was divided into 20 bins. Vertical lines indicate tap events. Synchronization (S1–S3) and Continuation (C1–C3) intervals are indicated under the x-axis. Data averaged over 25 trials. B, Average normalized firing rate of cells with activity significantly related to duration, aligned to bin of maximum rate. Each intertap interval was divided into 20 bins. All data are collapsed across durations and averaged over 25 trials.
Figure 7.

Average normalized firing rate of cells with activity significantly related to serial order (N = 352 cells; A) or duration (N = 298 cells; B), aligned to bin of maximum rate. Each intertap interval was divided into 20 bins.
We corroborated the dynamic nature of population activity with a decoding analysis. In separate analyses (one for serial order and one for duration) we used the activity of cells to decode task-relevant variables (serial order or duration) in a time-resolved fashion using 20 equally sized bins (Crowe et al., 2010; see Methods and Fig. 2 for a detailed description of the analysis). The percentage correct classification of this decoding analysis indicates the strength of representation of serial order within the neuronal population at a particular time bin. To determine whether the representations of serial order and duration were dynamic or static, we trained our decoder at each bin, and decoded at all bins each time the decoder was trained. This generated one decoding time course for each training bin. If patterns of neural activity representing serial order or duration remained the same throughout the trial, then decoding accuracy should remain relatively constant across the interval (i.e., patterns of activity representing particular values of the variable would be the same at the training bin as at all other bins). On the contrary, if different patterns of neural activity represented a serial order or duration at different times within the interval (e.g., different sets of cells were active), then decoding accuracy should be highest at the training bin, but fall off as decoding is performed at bins farther away. We found strong evidence that the decoding was dynamic. Figure 8A shows six decoding time courses obtained by training the decoding algorithm at six bins, and decoding serial order at all bins each time. Each decoding time course displays a peak at the training bin, and declines at further bins. For example, when the pattern of population activity in bin four was used to train the decoder (Fig. 8A, black dashed line), decoding was nearly 80% accurate at that bin, but was at near chance levels at bin 20 (Fig. 8A, black curved line). Likewise, when the decoder was trained using patterns of neural activity recorded during the 16th bin, the decoding time course peaked later in the interval. These results indicate that patterns of neural activity representing serial order changed over the course of the interval. We performed the serial-order decoding analysis separately for each instructed duration, and found similar results across all durations. Consistently, decoding time courses across durations (Fig. 9A–E) displayed peaks that were in close alignment to the training bins, as illustrated in Figure 8. A similar relationship between decoding peak and training bin was seen when we performed the decoding analysis after combining data across all durations (Fig. 9F).
Figure 9.

Serial-order decoding time course peaks as a function of training bins, at each instructed duration. A–E, Each dot represents the peak, in time bins, of a fitted Gaussian curve to the decoding time course obtained when the decoder was trained at the bin indicated on the x-axis (30 observations; 5 trials × 6 serial orders). Nonlinear regression was used to produce the fits. Dots at bin zero on the y-axis represent a failure of the nonlinear regression to provide a fit. Each instructed duration (450–1000 ms) was broken into 20 equal bins. Lines indicate a best fit of all nonzero points. F, Decoding time course peaks when data from all durations were combined (150 observations; 5 trials × 5 durations × 6 intervals).
The decoding analysis also confirmed that the intertap duration was represented dynamically. Duration decoding accuracy peaked at the training bins (Fig. 8B) and fell off away from the training bin. Unlike with serial order, which varied within a trial, we were able to decode duration across the entire trial. Interestingly, decoding accuracy showed a cyclical pattern in which decoding accuracy peaked not only at training bins, but also at other bins in the same intra-interval position. To more easily see the dynamic representation of intertap duration we decoded duration after collapsing bins across intervals, as in the serial-order analyses (Fig. 8C). These results suggest that duration cells are cyclically engaged, encoding the duration across each sequential element (S1–S3 and C1–C3) of the SCT.
Scaling of serial-order representation across durations
The shape of MI and decoding time courses provides information about the speed at which the neural representations of serial-order change. A sharp peak in the MI time course indicates a narrow window over which a cell represents serial order. Similarly, narrow peaks in decoding time courses indicate a rapidly changing pattern of activity, where the training at one bin is only good for decoding within a small temporal window. A broader peak indicates the opposite. Figure 10 shows the width, in milliseconds, of Gaussian curves fitted to MI (Fig. 10A) and decoding (Fig. 10C) time courses at each duration. Interestingly, as the duration increased, so did the width of the time courses, indicating that cells–at both the single-cell and population level–represented serial order for a longer time at the longer intertap durations. We measured this increase in width as a fraction of the duration time of the instructed duration (Fig. 10B,D). Proportionally, time course width remained relatively stable across all durations, indicating a scalar representation of serial order in this task.
Figure 10.
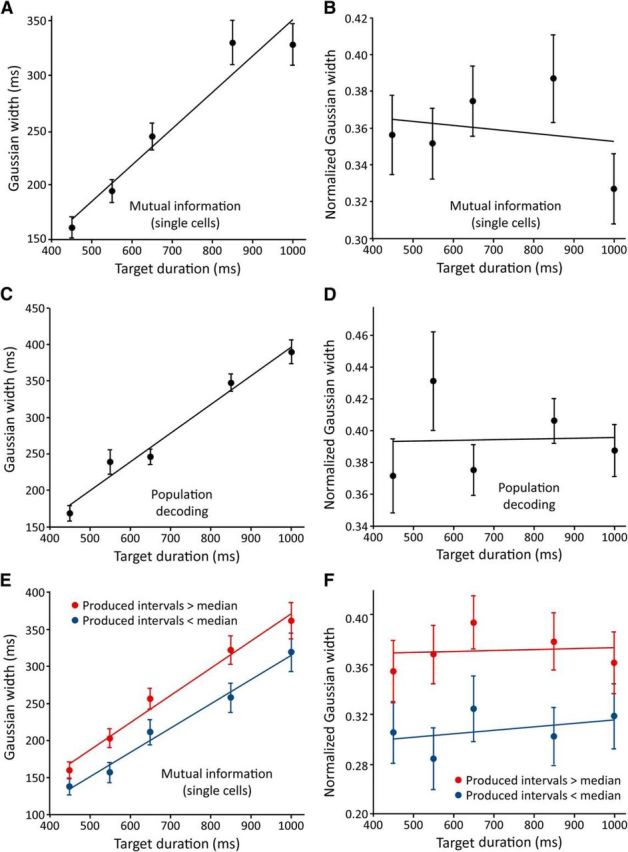
Average serial-order MI and decoding time course widths as a function of duration. A, MI of each cell's firing rate and serial order were calculated at each bin, separately at each duration. Gaussian curves were fitted to each MI time course and their width parameters (in milliseconds) were averaged across cells (N = 99, 105, 110, 76, 77 curve widths for durations of 450, 550, 650, 850, and 1000 ms; these numbers vary because the nonlinear regression was not able to fit all time courses). B, The data from A are re-expressed as a fraction of an instructed interval duration. C, D, Time-resolved population decoding of serial order was performed separately at each duration, and Gaussian curves were fitted to the resulting time courses (N = 13, 16, 15, 17, 17 curve widths for durations 450–1000 ms). Average widths in milliseconds shown in C and widths normalized to intertap interval shown in D. E, F, The MI analysis was repeated for intervals that were split into those whose actual durations were above (red) and below (blue) the median for that instructed duration. All error bars ± SEM.
To further test the relationship between peaks in serial-order representation time courses and the animals' behavior, we performed the MI analysis above after splitting the intervals into two groups: those in which the monkeys produced an intertap time that was below the median for that instructed duration, and those with intertap times above the median. On those intervals in which the monkeys tended to produce shorter intertap durations the MI time course widths were shorter, and vice versa (Fig. 10E,F; p < 0.001, ANOVA).
Baseline correlation of simultaneously recorded neurons
We explored a possible mechanism by which different cell groups that represent the temporal and sequential structure of rhythmic behavior become active at different times during the SCT. For this purpose, we used the significant correlation in baseline firing rate of simultaneously recorded cells as an indirect measure of neural connectivity, as suggested in previous studies (de la Rocha et al., 2007). Our hypothesis was that cells representing serial order or duration in adjacent bins would have a higher correlation in baseline firing rate, relative to cells participating in bins separated by a large portion of the intertap interval. To test this, we first identified the subset of cells participating in serial-order or duration representation at each bin as those cells whose MI time course was significantly positively correlated with the population decoding time course obtained with training data at that bin. This provided us with two groups of cells at each time bin (one group of serial-order cells and one of duration cells) that contributed to the overall population representation of serial order or duration at that bin. We then correlated the baseline activity of all simultaneously recorded task-relevant neuron pairs, and plotted the percentage of cells with significantly correlated baseline activity (Fig. 11) based on the lag between the bins the cells had been assigned. For example, for serial-order cells these lags ranged from a lag of 0 bins, meaning the cells were participating in the same bin, to a lag of 19 bins, meaning one cell participated in the first bin and one participated in the last). Surprisingly, we found that among serial-order cells baseline correlations were highest among cell pairs with medium to long bin lags (Fig. 11A), and among duration cells baseline correlations peaked at medium bin lags, cycling up and down across intervals (Fig. 11C). Because MI and decoding of serial order must be done across intervals, serial-order cells were assigned bins relative to a standardized interval. Given that serial-order cells fire differentially across intervals, it is possible that cells with assigned bins adjacent to each other in the relative time frame may have peak firing rates in different intervals and thus not have peak rates adjacent in absolute time. To test whether baseline correlations varied as a function of the distance between cells' peak firing rates, we assigned serial-order cells to bins based on whether their mean firing rate in that bin was ≥90th percentile of mean firing rate across all bins. In this case, baseline correlations showed a cyclical pattern with respect to bin lag that was similar to that seen with duration cells (Fig. 11B).
Figure 11.

Correlation in baseline firing rate for pairs of cells. A, Serial-order cells. Points represent the percentage of simultaneously recorded cell pairs that had a significant (p < 0.05) correlation in baseline firing rate across trials, based on their assigned bin lags. Dashed line represents the average correlation across all nonsimultaneously recorded cells pairs, across all bin lags. As for all serial-order analyses, data are collapsed across serial order within trials. B, Baseline correlation of serial-order cells whose bin lags were assigned based on the cells' bins of peak firing rate, across the entire trial (all six intervals). Vertical lines indicate the tap events. Data beyond lag 55 are not shown because of high variability in the data (seen somewhat in lags 30–55). C, Baseline correlation of simultaneously recorded duration cells, as a function of bin lag. This analysis used intertap intervals broken into 10 bins (vs 20 used in other analyses) to reduce noise. The data go beyond one interval since the variable, duration, was constant across an entire trial. Vertical lines indicate the tap events. Data beyond lag 55 are not shown because of high variability in the data. All error bars = ±SE.
Discussion
We determined the dynamic properties of MPC cells to represent the duration and serial order of the six intervals produced during the SCT. This was done in a time-resolved fashion, so that encoding and decoding analyses were performed across equally sized bins that defined an intertap interval among the duration and serial-order dimensions. We found strong evidence supporting the notion that the temporal and sequential structure of the task is coded in a dynamic fashion by MPC cell populations. Both the MI of single cells and the accuracy of the neural population decoding showed time-varying changes, so that peaks and systematic decays of representation levels were observed for serial order and duration. In addition, the width of the Gaussian decoding or encoding time courses increased as a function of the duration of the intervals produced in the SCT, which indicates that the neural activity patterns representing serial order changed in a scalar fashion across durations. Interestingly, we observed that the dynamic representation of serial order and duration depends on the consecutive onset of different neural sets at different time bins within the intertap interval. In fact, these discrete neural ensembles showed significant correlations in their basal discharge rate with the neural ensembles that are activated consecutively, suggesting a strong anatomofunctional linkage inside the MPC. Therefore, these results support the concept of a dynamic representation of duration and serial order during the SCT, where discrete neural ensembles encode these parameters through small time windows. The rapid activation of neurons provides a strong synaptic drive to the next ensemble in a consecutive chain of neural events. The present findings could be consistent with different anatomical configurations.
The neural bases of the serial order of a small number of discrete hand movements arranged in a sequence have been deeply investigated in the behaving monkey. Single-unit recording studies have found neural signals encoding the sequential structure of such movements in the lateral prefrontal cortex (Averbeck et al., 2003) and the basal ganglia (Kermadi and Joseph, 1995). In addition, many studies have documented the strong serial-order representation in MPC during three movement-sequence tasks (see Tanji, 2001). Finally, the transient inactivation of either SMA or pre-SMA by microinjection of muscimol profoundly impairs the ability to perform a memorized sequence of multiple movements correctly (Nakamura et al., 1999). Hence, it is evident that the serial-order organization of sequential movements depends on a neural circuit of cortical and subcortical areas wherein MPC plays a critical role. Remarkably, the neural circuit engaged in perceptual and motor timing shows a large overlap with the network controlling movement sequences (Macar et al., 2006; Wiener et al., 2010), suggesting that the same distributed system can encode serial-order and timing information during rhythmic behaviors such as music and dance (Janata and Grafton, 2003; Phillips-Silver and Trainor, 2005; Grahn and Brett, 2007; Merchant et al., 2015).
Imaging and lesion studies have shown that the perception and production of rhythms in human subjects depends of the cortico-basal ganglia-thalamo-cortical circuit, where the MPC is a crucial processing node (Sakai et al., 1999; Schubotz et al., 2000; Merchant et al., 2008a, 2013b; Perez et al., 2013; Bartolo et al., 2014). A tempting idea is that the dynamical representation of serial order and duration in MPC cells observed here is also present during rhythmic entrainment in music performance and dance in human subjects. Although it is evident that monkeys temporalize their behavior during the SCT (Zarco et al., 2009; Donnet et al., 2014), some precautions should be taken when extrapolating the neural underpinnings of rhythmic behavior from macaques to humans, since monkeys' asynchronies are larger during the SCT (Zarco et al., 2009; Honing and Merchant, 2014), and macaques cannot detect the beat of complex rhythms, although they are sensitive to the start of rhythmic groups (Honing et al., 2012).
The strong phenomenological covariation of sequence and time, revealed by encoding and decoding algorithms, suggests that the sequential and timing information that define a rhythmic behavior depends on the dynamic representation of both parameters within the MPC. Therefore, as far as we know, we are providing the first neurophysiological evidence supporting the dynamic nature of neural signals tuned to the serial order and tempo of rhythmic execution. These results are concordant with the current idea that cortical networks compute time as a result of time-dependent changes in synaptic and cellular properties, which influence the population response to behavioral events in a history-dependent manner (Karmarkar and Buonomano, 2007; Goel and Buonomano, 2014).
In the hundreds of milliseconds range, the temporal performance across a wide range of timing tasks, including rhythmic behaviors, follows the scalar property. This property defines a linear relationship between the variability of temporal performance and interval duration, in conformity with Weber's law (Gibbon et al., 1997; Merchant et al., 2008b). Weber's law is given as SD(T) = kT, where k is a constant corresponding to the Weber fraction. Indeed, the coefficients of variation (σ/μ) or the Weber fractions show similar values in a variety of tasks and species, suggesting a dedicated temporal mechanism in the hundreds of milliseconds (Ivry and Hazeltine, 1995; Merchant et al., 2008c, 2013b). The fact that the width of the Gaussian encoding and decoding time courses for serial order increased as a function of the duration of the intervals produced in the SCT gives evidence in favor of a scalar representation of time during rhythmic execution. Indeed, the coefficient of variation of the MI of single cells and the decoding time courses of cell populations were similar across the tested duration range from 450–1000 ms (Fig. 10), providing, as far as we know, the first neural correlate of the scalar property of timing during a rhythmic paradigm. Finally, the relative representation of time, showing the same encoding and decoding of serial order and duration when the interval duration is normalized, supports the notion that the neural mechanism for rhythmic behavior depends on a relative representation of time, instead of absolute timing, as suggested in fMRI studies (Teki et al., 2011).
The representation of duration and serial order during the SCT showed two important properties: the cells' response dynamics and the modularity of the neural ensembles engaged in this dynamics. The neural dynamics was characterized by both the MI of single cells and the accuracy of the neural population decoding, with clear peaks and systematic decays in the representation strength for serial order and duration. The peaks in decoding at different periods of the rhythmic sequence were tightly associated with the consecutive onset of neural sets that encoded the serial order or duration during small time windows. Hence, this rapid succession of different cell ensembles may generate a chain of neural events that defined the rhythmic progression of movements during the SCT.
Because we were able to analyze the dynamics of duration encoding and decoding across the entire trial of six intervals produced rhythmically, we had the opportunity to determine the cyclic changes in time representation suggesting that the duration cells are engaged in dynamic coding of duration every time an interval is produced in the SCT. A crucial point is that the cyclic and dynamic entrainment of duration and serial-order cells is accompanied by recurring baseline correlations between pairs of cells, supporting the idea that time is represented in the trajectories of cell ensembles that show cyclical interactions across intervals executed rhythmically (Buonomano and Laje, 2010).
The neuronal ensembles (representing either serial order or duration) were probably arranged in interconnected modules since they showed the highest baseline-activity correlations among cell pairs with medium bin lags in a cyclic fashion. It has been shown that significant correlations in the spontaneous activity are indicative of synaptic relations between the simultaneously recorded cells (de la Rocha et al., 2007) and that neurons with similar tuning properties tend to have correlated spontaneous activity. For example, neurons with similar preferred directions in primary motor cortex or preferred line orientations in primary visual cortex, show correlated spontaneous activity and a columnar organization (Hubel and Wiesel, 1969; Lee et al., 1998; Kenet et al., 2003; Georgopoulos et al., 2007). Consequently, our results support the notion of the rapid recruitment of distinct ensembles of interconnected neurons, which provide a strong synaptic drive to the next ensemble (Abeles, 1982). Different anatomofunctional arrangements could explain the observed (putative) cyclical interconnection between, including the synfire chains, where the encoding of a behavioral feature depends on the traveling of neural activity along a chain of neural groups (Gewaltig et al., 2001).
Footnotes
This work is supported by CONACYT: 151223, PAPIIT: IN200511 grants to H.M. We thank Matt Chafee and Juan Carlos Mendez for their fruitful comments on this manuscript. We also thank Luis Prado, Raul Paulín, and Juan José Ortiz for their technical assistance.
The authors declare no competing financial interests.
References
- Abeles M. Local cortical circuits: an electrophysiological study. Berlin: Springer; 1982. [Google Scholar]
- Averbeck BB, Crowe DA, Chafee MV, Georgopoulos AP. Neural activity in prefrontal cortex during copying geometrical shapes: II. Decoding shape segments from neural ensembles. Exp Brain Res. 2003;150:142–153. doi: 10.1007/s00221-003-1417-5. [DOI] [PubMed] [Google Scholar]
- Bartolo R, Prado L, Merchant H. Information processing in the primate basal ganglia during sensory guided and internally driven rhythmic tapping. J Neurosci. 2014;34:3910–3923. doi: 10.1523/JNEUROSCI.2679-13.2014. [DOI] [PMC free article] [PubMed] [Google Scholar]
- Buonomano DV, Laje R. Population clocks: motor timing with neural dynamics. Trends Cogn Sci. 2010;14:520–527. doi: 10.1016/j.tics.2010.09.002. [DOI] [PMC free article] [PubMed] [Google Scholar]
- Clower WT, Alexander GE. Movement sequence-related activity reflecting numerical order of components in supplementary and presupplementary motor areas. J Neurophysiol. 1998;80:1562–1566. doi: 10.1152/jn.1998.80.3.1562. [DOI] [PubMed] [Google Scholar]
- Crowe DA, Averbeck BB, Chafee MV. Rapid sequences of population activity patterns dynamically encode task-critical spatial information in parietal cortex. J Neurosci. 2010;30:11640–11653. doi: 10.1523/JNEUROSCI.0954-10.2010. [DOI] [PMC free article] [PubMed] [Google Scholar]
- de la Rocha J, Doiron B, Shea-Brown E, Josić K, Reyes A. Correlation between neural spike trains increases with firing rate. Nature. 2007;448:802–806. doi: 10.1038/nature06028. [DOI] [PubMed] [Google Scholar]
- Donnet S, Bartolo R, Fernandes JM, Cunha JP, Prado L, Merchant H. Monkeys time their movement pauses and not their movement kinematics during a synchronization-continuation rhythmic task. J Neurophysiol. 2014;111:2138–2149. doi: 10.1152/jn.00802.2013. [DOI] [PubMed] [Google Scholar]
- Georgopoulos AP, Merchant H, Naselaris T, Amirikian B. Mapping of the preferred direction in the motor cortex. Proc Natl Acad Sci U S A. 2007;104:11068–11072. doi: 10.1073/pnas.0611597104. [DOI] [PMC free article] [PubMed] [Google Scholar]
- Gewaltig MO, Diesmann M, Aertsen A. Propagation of cortical synfire activity: survival probability in single trials and stability in the mean. Neural Netw. 2001;14:657–673. doi: 10.1016/S0893-6080(01)00070-3. [DOI] [PubMed] [Google Scholar]
- Gibbon J, Malapani C, Dale CL, Gallistel C. Toward a neurobiology of temporal cognition: advances and challenges. Curr Opin Neurobiol. 1997;7:170–184. doi: 10.1016/S0959-4388(97)80005-0. [DOI] [PubMed] [Google Scholar]
- Goel A, Buonomano DV. Timing as an intrinsic property of neural networks: evidence from in vivo and in vitro experiments. Philos Trans R Soc Lond B Biol Sci. 2014;369 doi: 10.1098/rstb.2012.0460. 20120460. [DOI] [PMC free article] [PubMed] [Google Scholar]
- Grahn JA, Brett M. Rhythm and beat perception in motor areas of the brain. J Cogn Neurosci. 2007;19:893–906. doi: 10.1162/jocn.2007.19.5.893. [DOI] [PubMed] [Google Scholar]
- Honing H, Merchant H. Differences in auditory timing between human and non-human primates. Behav Brain Sci. 2014;7:274. doi: 10.3389/fnins.2013.00274. [DOI] [PubMed] [Google Scholar]
- Honing H, Merchant H, Háden G, Prado L, Bartolo R. Rhesus monkeys (Macaca mulatta) can detect rhythmic groups in music, but not the beat. PLoS One. 2012;7:e51369. doi: 10.1371/journal.pone.0051369. [DOI] [PMC free article] [PubMed] [Google Scholar]
- Hubel DH, Wiesel TN. Anatomical demonstration of columns in the monkey striate cortex. Nature. 1969;221:747–750. doi: 10.1038/221747a0. [DOI] [PubMed] [Google Scholar]
- Ivry RB, Hazeltine RE. Perception and production of temporal intervals across a range of durations: evidence of a common timing mechanism. J Exp Psychol Hum Percept Perform. 1995;21:3–18. doi: 10.1037/0096-1523.21.1.3. [DOI] [PubMed] [Google Scholar]
- Janata P, Grafton ST. Swinging in the brain: shared neural substrates for behaviors related to sequencing and music. Nat Neurosci. 2003;6:682–687. doi: 10.1038/nn1081. [DOI] [PubMed] [Google Scholar]
- Karmarkar UR, Buonomano DV. Timing in the absence of clocks: encoding time in neural network states. Neuron. 2007;53:427–438. doi: 10.1016/j.neuron.2007.01.006. [DOI] [PMC free article] [PubMed] [Google Scholar]
- Kenet T, Bibitchkov D, Tsodyks M, Grinvald A, Arieli A. Spontaneously emerging cortical representations of visual attributes. Nature. 2003;425:954–956. doi: 10.1038/nature02078. [DOI] [PubMed] [Google Scholar]
- Kermadi I, Joseph JP. Activity in the caudate nucleus of monkey during spatial sequencing. J Neurophysiol. 1995;74:911–933. doi: 10.1152/jn.1995.74.3.911. [DOI] [PubMed] [Google Scholar]
- Lee D, Port NL, Kruse W, Georgopoulos AP. Variability and correlated noise in the discharge of neurons in motor and parietal areas of the primate cortex. J Neurosci. 1998;18:1161–1170. doi: 10.1523/JNEUROSCI.18-03-01161.1998. [DOI] [PMC free article] [PubMed] [Google Scholar]
- Macar F, Coull J, Vidal F. The supplementary motor area in motor and perceptual time processing: fMRI studies. Cogn Process. 2006;7:89–94. doi: 10.1007/s10339-005-0025-7. [DOI] [PubMed] [Google Scholar]
- Merchant H, Honing H. Are non-human primates capable of rhythmic entrainment? Evidence for the gradual audiomotor evolution hypothesis. Front Neurosci. 2013;7:274. doi: 10.3389/fnins.2013.00274. [DOI] [PMC free article] [PubMed] [Google Scholar]
- Merchant H, Battaglia-Mayer A, Georgopoulos AP. Effects of optic flow in motor cortex and area 7a. J Neurophysiol. 2001;86:1937–1954. doi: 10.1152/jn.2001.86.4.1937. [DOI] [PubMed] [Google Scholar]
- Merchant H, Luciana M, Hooper C, Majestic S, Tuite P. Interval timing and Parkinson's disease: heterogeneity in temporal performance. Exp Brain Res. 2008a;184:233–248. doi: 10.1007/s00221-007-1097-7. [DOI] [PubMed] [Google Scholar]
- Merchant H, Zarco W, Prado L. Do we have a common mechanism for measuring time in the hundreds of millisecond range? Evidence from multiple-interval timing tasks. J Neurophysiol. 2008b;99:939–949. doi: 10.1152/jn.01225.2007. [DOI] [PubMed] [Google Scholar]
- Merchant H, Zarco W, Bartolo R, Prado L. The context of temporal processing is represented in the multidimensional relationships between timing tasks. PLoS One. 2008c;3:e3169. doi: 10.1371/journal.pone.0003169. [DOI] [PMC free article] [PubMed] [Google Scholar]
- Merchant H, Zarco W, Pérez O, Prado L, Bartolo R. Measuring time with different neural chronometers during a synchronization-continuation task. Proc Natl Acad Sci U S A. 2011;108:19784–19789. doi: 10.1073/pnas.1112933108. [DOI] [PMC free article] [PubMed] [Google Scholar]
- Merchant H, Pérez O, Zarco W, Gámez J. Interval tuning in the primate medial premotor cortex as a general timing mechanism. J Neurosci. 2013a;33:9082–9096. doi: 10.1523/JNEUROSCI.5513-12.2013. [DOI] [PMC free article] [PubMed] [Google Scholar]
- Merchant H, Harrington DL, Meck WH. Neural basis of the perception and estimation of time. Annu Rev Neurosci. 2013b;36:313–336. doi: 10.1146/annurev-neuro-062012-170349. [DOI] [PubMed] [Google Scholar]
- Merchant H, Grahn J, Trainer L, Rohrmeier M, Fitch TW. Finding the beat, a neuro-computational approach. Philos Trans R Soc Lond B Biol Sci. 2015 doi: 10.1098/rstb.2014.0093. in press. [DOI] [PMC free article] [PubMed] [Google Scholar]
- Mita A, Mushiake H, Shima K, Matsuzaka Y, Tanji J. Interval time coding by neurons in the presupplementary and supplementary motor areas. Nat Neurosci. 2009;12:502–507. doi: 10.1038/nn.2272. [DOI] [PubMed] [Google Scholar]
- Nakamura K, Sakai K, Hikosaka O. Effects of local inactivation of monkey medial frontal cortex in learning of sequential procedures. J Neurophysiol. 1999;82:1063–1068. doi: 10.1152/jn.1999.82.2.1063. [DOI] [PubMed] [Google Scholar]
- Nelken I, Chechik G, Mrsic-Flogel TD, King AJ, Schnupp JW. Encoding stimulus information by spike numbers and mean response time in primary auditory cortex. J Comput Neurosci. 2005;19:199–221. doi: 10.1007/s10827-005-1739-3. [DOI] [PubMed] [Google Scholar]
- Perez O, Kass RE, Merchant H. Trial time warping to discriminate stimulus-related from movement-related neural activity. J Neurosci Methods. 2013;212:203–210. doi: 10.1016/j.jneumeth.2012.10.019. [DOI] [PubMed] [Google Scholar]
- Phillips-Silver J, Trainor LJ. Feeling the beat: movement influences infant rhythm perception. Science. 2005;308:1430. doi: 10.1126/science.1110922. [DOI] [PubMed] [Google Scholar]
- Rao SM, Harrington DL, Haaland KY, Bobholz JA, Cox RW, Binder JR. Distributed neural systems underlying the timing of movements. J Neurosci. 1997;17:5528–5535. doi: 10.1523/JNEUROSCI.17-14-05528.1997. [DOI] [PMC free article] [PubMed] [Google Scholar]
- Sakai K, Hikosaka O, Miyauchi S, Takino R, Tamada T, Iwata NK, Nielsen M. Neural representation of a rhythm depends on its interval ratio. J Neurosci. 1999;19:10074–10081. doi: 10.1523/JNEUROSCI.19-22-10074.1999. [DOI] [PMC free article] [PubMed] [Google Scholar]
- Schubotz RI, Friederici AD, von Cramon DY. Time perception and motor timing: a common cortical and subcortical basis revealed by fMRI. Neuroimage. 2000;11:1–12. doi: 10.1006/nimg.1999.0514. [DOI] [PubMed] [Google Scholar]
- Tanji J. Sequential organization of multiple movements: involvement of cortical motor areas. Annu Rev Neurosci. 2001;24:631–651. doi: 10.1146/annurev.neuro.24.1.631. [DOI] [PubMed] [Google Scholar]
- Tanji J, Shima K. Role for supplementary motor area cells in planning several movements ahead. Nature. 1994;371:413–416. doi: 10.1038/371413a0. [DOI] [PubMed] [Google Scholar]
- Teki S, Grube M, Kumar S, Griffiths TD. Distinct neural substrates of duration-based and beat-based auditory timing. J Neurosci. 2011;31:3805–3812. doi: 10.1523/JNEUROSCI.5561-10.2011. [DOI] [PMC free article] [PubMed] [Google Scholar]
- Wiener M, Turkeltaub P, Coslett HB. The image of time: a voxelwise meta-analysis. Neuroimage. 2010;49:1728–1740. doi: 10.1016/j.neuroimage.2009.09.064. [DOI] [PubMed] [Google Scholar]
- Zarco W, Merchant H, Prado L, Mendez JC. Subsecond timing in primates: comparison of interval production between human subjects and rhesus monkeys. J Neurophysiol. 2009;102:3191–3202. doi: 10.1152/jn.00066.2009. [DOI] [PMC free article] [PubMed] [Google Scholar]