

Abstract
A fundamental task of the visual system is to extract figure–ground boundaries between images of objects, which in natural scenes are often defined not only by luminance differences but also by “second-order” contrast or texture differences. Responses to contrast modulation (CM) and other second-order stimuli have been extensively studied in human psychophysics, but the neuronal substrates of second-order responses in nonhuman primates remain poorly understood. In this study, we have recorded single neurons in area V2 of macaque monkeys, using both CM patterns as well as conventional luminance modulation (LM) gratings. CM stimuli were constructed from stationary sine wave grating carrier patterns, which were modulated by drifting envelope gratings of a lower spatial frequency. We found approximately one-third of visually responsive V2 neurons responded to CM stimuli with a pronounced selectivity to carrier spatial frequencies, and often orientations, that were clearly outside the neurons' passbands for LM gratings. These neurons were “form-cue invariant” in that their tuning to CM envelope spatial frequency and orientation was very similar to that for LM gratings. Neurons were tuned to carrier spatial frequencies that were typically 2–4 octaves higher than their optimal envelope spatial frequencies, similar to results from human psychophysics. These results are distinct from CM responses arising from surround suppression, but could be understood in terms of a filter-rectify-filter model. Such neurons could provide a functionally useful and explicit representation of segmentation boundaries as well as a plausible neural substrate for human perception of second-order boundaries.
Keywords: area V2, contrast modulation, non-Fourier, nonlinear, second order
Introduction
Natural images from everyday scenes are a complex mixture of objects and surfaces with numerous local features due to surface properties, occlusion boundaries, shadows, and illumination, which must be parsed by the visual system before higher-level processes, such as object recognition. Neurons in the early visual pathway have been conventionally thought to signal variations in local luminance (Fig. 1a, solid square), which can be encoded by visual cortex neurons with spatially linear receptive fields (Movshon et al., 1978; De Valois et al., 1982; Fig. 1b). But natural objects with textured surfaces can also give rise to gradients or discontinuities in local contrast, for example, at boundaries between different objects or surfaces (Fig. 1a, dashed square). Such contrast variations can enable segmentation of figure–ground boundaries (Arsenault et al., 2011), disambiguate the causes of observed boundaries (Schofield et al., 2010), and aid in perception of surface gloss (Motoyoshi et al., 2007). Specific neural detection mechanisms for contrast modulation (CM) have been inferred from human psychophysics (Graham, 2011), but in the primate visual system, the neural substrate for encoding such CMs remains unclear (El-Shamayleh and Movshon, 2011).
Figure 1.

Detection of contrast modulation. a, Objects in natural scenes can be delineated from one another by changes of contrast as well as by luminance differences, as in this photograph taken at the University of Science and Technology of China. The tree is clearly distinguished from the grassy background by a luminance difference (solid square), but the grass is distinguished from its reflection in the water primarily by a change in contrast (dashed square). b, Luminance variations can be detected by a linear spatial filter; however, pure contrast changes are invisible to such a filter when local luminance falling in adjacent excitatory and inhibitory regions averages to zero. c, Filter-rectify-filter (F-R-F) model. Early-stage filters mediate selectivity for fine structures (texture). The outputs are rectified and summed by a later, coarse-scale filter to detect contrast changes along a boundary. d, CM grating. CM gratings are generated by the product of a stationary high SF (fCarrier) sine wave grating (carrier) with a moving low SF (fEnvelope) sine wave grating (envelope). In the Fourier frequency domain (graphs to the sides of the stimulus images), such stimuli consist of a linear sum of three components closely centered about fCarrier, but no energy at fEnvelope. Black ellipses indicate bandwidth of a neuron's luminance response. A neuron was considered CM-responsive if it showed a bandpass response to a CM stimulus whose Fourier components were all clearly outside the neuron's frequency-selective range for luminance. In this and subsequent figures, we employ a unifying color scheme for signals or responses: red for carrier, blue for envelope, and black for luminance.
However, in the cat, many neurons in early cortical areas respond selectively to contrast-defined boundaries and are also selective to the spatial frequency (SF) of the constituent texture (“carrier”) patterns (Mareschal and Baker, 1999). Their preferred carrier SFs are typically ≥5–20× greater than their optimal modulation frequencies, thus distinct from CM responses arising from surround suppression (Tanaka and Ohzawa, 2009). Instead, such responses are consistent with a two-stage processing scheme (Fig. 1c) in which early, fine-scale receptive fields detect texture elements, followed by a much larger receptive field selective for coarse-scale variations in the early-stage responses (Landy and Graham, 2004).
However neurons of this sort have not been reported in early visual cortex of the macaque monkey, which is a close animal model of the human visual system, suggesting that such processing might only occur at higher levels of the visual cortex in primates (El-Shamayleh and Movshon, 2011). These findings raise several key questions about detection of CMs in the primate visual system: Do such neurons occur in the early visual cortex (V1/V2), or only at higher levels? Are CMs detected only by simple early nonlinearities of conventional luminance-coding neurons, or by specialized neuronal mechanisms? Do such neurons respond with similar orientation preference to contrast-defined and luminance-defined patterns (“form-cue invariance”)? Do neuronal responses to CM stimuli provide a plausible neural substrate for human psychophysics?
Here we approach these questions by recording single neurons in macaque area V2, an early visual cortical area known to exhibit more complex processing (Anzai et al., 2007; Willmore et al., 2010). We find that a substantial fraction of V2 cells show highly specific responses to CM stimuli. These responses are form-cue invariant and exhibit high ratios of carrier to modulation SF that are consistent with human psychophysics.
Materials and Methods
Animal preparation and maintenance.
Acute experiments were performed in 14 macaque monkeys (Macaca mulatta; 11 males and 3 females). All surgical and experimental procedures were in accordance with the guidelines and policies of the Canadian Council on Animal Care and were approved both by the Animal Care Committee of McGill University and by the Institutional Animal Care and Use Committee of the University of Science and Technology of China. Monkeys were first sedated with ketamine HCl (10 mg/kg) and then were maintained with isoflurane (3–5%, in oxygen) for venous cannulation, followed by propofol (5 mg · kg−1 · h−1, i.v.) during subsequent surgery. All surgical wounds were infused with 0.5% bupivacaine, and the corneas were protected with topical hydroxypropyl methylcellulose (2.3%). Electrocardiography, respiratory rate, oxygen saturation (SpO2), and expired CO2 were monitored (PM-7000, Mindray) throughout the surgery and subsequent recording. Expired CO2 was maintained at ∼4% and rectal temperature was kept at 37.5°C (Harvard Apparatus). After tracheal cannulation, the animal was mounted in a stereotaxic frame, with a long-acting anesthetic (2% lidocaine-HCl jelly) applied to all pressure points. A craniotomy was begun by thinning the skull ∼8 mm posterior to the ear bars and 9 mm lateral to the midline, to visualize the lunate sulcus. Then a smaller portion of the final layer of bone was removed above and posterior to the lunate sulcus for recording in visual cortical areas V1 and V2. A durotomy was made 0–5 mm posterior to the lunate sulcus and subsequently protected with 4.5% agarose and petroleum jelly.
Subsequent anesthesia and paralysis were established with loading doses of propofol (5 mg · kg−1, i.v.), d-tubocurarine (0.6 mg · kg−1, i.v.), and gallamine triethiodide (10.5 mg · kg−1, i.v.), followed by continuous infusion of propofol (4 mg · kg−1 · h−1, i.v.), sufentanil (0.8 μg · kg−1 · h−1, i.v.), d-tubocurarine (0.4 mg · kg−1 · h−1, i.v.), and gallamine triethiodide (7 mg · kg−1 · h−1, i.v.), supplemented with a mixture of O2/N2O (30:70). Atropine sulfate (1 mg, i.m.), dexamethasone (5 mg, i.m.), and penicillin (125 mg, i.m.) were administered every 12 h throughout the experiment. Supplemental fluids (Ringer's solution and 5% dextrose, i.v.) were administered, ≥120 ml every 12 h, adjusted based on urinary output.
The pupils were dilated with 0.25% tropicamide eye drops, and contact lenses were fitted to protect the corneas. The optic disks were back-projected to a plotting screen using an ophthalmoscope and corner cube prism. Spectacle lenses were selected using streak retinoscopy to ensure that the eyes were focused on the stimulus plane. Artificial pupils (2.5 mm diameter) were placed immediately in front of the contact lenses to further improve optical quality. Experiments typically lasted 3–5 d, during which the optical quality of the eyes and contact lenses were checked frequently, and the contact lenses were cleaned as necessary.
Tungsten microelectrodes (FHC) and linear array multielectrodes (A1x32, pad size 177 μm2; NeuroNexus) were used in these experiments. For linear arrays, the penetrations were made slightly posterior to the lunate sulcus and perpendicular to the brain surface, or, for tungsten microelectrodes, more posterior (2–5 mm) to the lunate sulcus at an angle of ∼40–90°. A typical tungsten electrode penetration first entered V1, and then went through white matter before reaching V2. The receptive fields of V2 neurons were at 6.8 ± 4.4° (mean ± SD) of visual eccentricity. The recording tracks were labeled by electrolytic lesions (2 μA, 5 s) or by fluorescent tracer deposition from precoated electrodes “DiI”, (1,1-dioctadecyl-3,3,3′,3′-tetramethylindocarbocyanine, 10% in ethanol; DiCarlo et al., 1996).
At the end of an experiment, the animal was perfused intracardially with cold saline (0.9%) followed by paraformalydehyde (0.4% in 0.1 m phosphate buffer, pH 7.4), and a small block of brain tissue removed. The tissue was sectioned parasagittally on a freezing microtome at 50 μm intervals, followed by Nissl or cytochrome oxidase staining. The cortical areas from which the neurons were recorded were identified based on physiological records of transitions between gray and white matter, transitions of optimal SF and orientation, depth of recording sites, eccentricity of receptive fields, and histologically observed recording tracks.
Visual stimuli.
Computer-controlled visual stimuli were displayed on a CRT monitor (1280 × 960 pixels, 75 Hz, 22 cd/m2 mean luminance; Sony G520), placed at 114 cm from the animal. The raster was displayed within 39.2 × 29.2 cm, giving approximately 65 pixels/° of visual angle with a Nyquist frequency of 32 cycles per degree (cpd). Custom software for stimulus generation and online data analysis was written in Matlab (MathWorks) using Psychophysics Toolbox (PTB-3) extensions (Brainard, 1997; Kleiner et al., 2007). Luminance nonlinearities of the CRT were corrected with an inverse gamma lookup table derived from careful calibration with a photometer, checked or recalibrated before each experiment.
CM gratings (Fig. 1d) were constructed by multiplying high SF static gratings (“carriers”; Michaelson contrast, 80%) with low SF moving modulators (“envelopes”; modulation depth, 100%). In the Fourier SF domain, the CM gratings consisted of a linear sum of three components closely centered about the carrier SF (Fig. 1d, bottom right). Luminance-defined sine wave gratings (Michelson contrast, 30%) were also used to measure luminance tuning properties and perform control experiments. A uniform mean luminance gray screen was displayed during all intertrial intervals and also used as a “blank” condition to measure spontaneous responses.
Data collection and experiment protocol.
Microelectrode signals as well as CRT timing data from a photocell (TSL12S, AMS) were recorded using a data acquisition system with on-line spike isolation (Cerebus, Blackrock Microsystems), and the isolated spike waveforms were analyzed online (poststimulus time histograms and tuning curves using average firing rate) for guidance of the subsequent experiment protocol. All signals were broad-band filtered (0.3–7 kHz), digitized at 30 kHz, and saved for detailed offline data analysis.
We adopted a protocol to search for and characterize CM responses similar to that previously used successfully in the cat (Li and Baker, 2012), i.e., first using responses to luminance-defined stimuli as a guide to likely modulation pattern parameters, with systematic testing of carrier parameters to find a neuron's optimal CM stimulus. For each measurement, randomly interleaved conditions as well as blank conditions were repeated 5–20 times. Optimal stimulus parameters for drifting luminance gratings were first measured to obtain the orientation, SF, temporal frequency, and size of the best grating for the neuron. With the envelope SF and orientation initially fixed at or near the neuron's optimal values for luminance gratings, a series of carrier SFs were first tested at each of 1–4 different fixed-carrier orientations. If the responses were bandpass tuned to a carrier SF that was clearly outside the neuron's luminance passband, then the neuron was considered CM-responsive and studied further. The carrier orientation tuning was systematically measured using the neuron's optimal carrier SF. The carrier SF tuning was then measured again using the optimized carrier orientation. For such neurons that were still sufficiently well isolated, envelope SF and orientation responses were then measured using the optimized carrier parameters. Neurons were identified as simple-type cells if the amplitude of the first Fourier component exceeded the mean response to a neuron's optimal drifting luminance grating, and otherwise were classified as complex-type cells (Skottun et al., 1991). The same modulation index measured for CM responses was highly correlated with that for luminance gratings (r60 = 0.75, p = 2.92 × 10⁻¹²). Thus, whether a neuron behaved like a simple-type or a complex-type cell was the same for both luminance and CM stimuli, as previously found for cat visual cortex neurons (Zhou and Baker, 1994).
Data analysis.
The recorded Cerebus data files were first transformed to Plexon data file format using custom software. The raw broadband data was filtered with a four-pole high-pass Butterworth digital filter (300 Hz cutoff) for subsequent extraction of spikes. Single-unit isolation was achieved by manual spike waveform classification using Offline-Sorter software (Plexon). To extract multiunit (MU) activity, the filtered signals were thresholded at 3 SD (Li and Baker, 2012). Tuning curves, based on average firing rate as a function of the stimulus parameter being varied, were constructed and fit with appropriate descriptive functions.
SF tuning.
SF response data were fit with a Gaussian function (DeAngelis et al., 1994) as follows:
 |
where R(sf) denotes response at SF sf, with k, SFopt, α, and R0 as free parameters. SFopt denotes the optimal SF.
Orientation tuning.
Orientation selectivity was characterized as orientation bias (OB; Leventhal et al., 2003; Li and Baker, 2012), which is a complex number incorporating all of the data points on the tuning curve within a vector summation as follows:
 |
where Rk is the spontaneous-subtracted mean response to a stimulus with orientation θk in radians. The angle provides the estimated optimal orientation, and the tuning bandwidth is defined as 1 − |OB|, with zero indicating response at only one orientation and unity corresponding to complete insensitivity to orientation (isotropy).
Surround suppression index.
Each neuron was tested with optimized drifting luminance gratings, carefully centered on the classical receptive field, of varying size (see Fig. 4a). The strength of surround suppression was characterized with a surround suppression index (SI; Cavanaugh et al., 2002) calculated with the formula (Rmax − Rsupp)/Rmax × 100%, where Rmax is the maximum response, and Rsupp is the response at the maximal grating size tested (7° in earlier experiments and 13° in later experiments). An SI of 100% represents complete suppression from the surround, while an SI of zero indicates an absence of any suppression.
Figure 4.

Surround suppression in CM-responsive neurons. a, Example measurement of neuron's response as a function of size of an optimized drifting luminance grating (error bars indicate mean ± SE). Surround SI (see Materials and Methods) is 13%. b, Histogram of SI values of all CM-responsive neurons in this study (median, 21.7%; N = 61).
Results
Each neuron's basic receptive field properties were first measured with drifting sinusoidal luminance gratings. Then CM stimuli were tested, using an envelope SF and orientation corresponding to the optimal values for luminance gratings, with a variety of carrier SFs and orientations. In the Fourier domain, the luminance energy of CM stimuli consists of three components closely centered about the high SF carrier (Fig. 1d). A neuron was considered CM-responsive if it responded significantly to a CM stimulus with none of its three SF components falling into its luminance passband (i.e., no response could be elicited by luminance gratings at these frequencies). For such neurons that were still sufficiently well isolated, we also measured envelope SF and orientation responses. Out of 167 V2 neurons recorded from 14 macaque monkeys, 62 neurons were clearly responsive to the CM stimuli.
SF tuning
SF responses of three example CM-responsive neurons are illustrated in the left-hand panels of Figure 2. Each of these neurons was clearly tuned not only to luminance SF (black) but also to the spatial components of CM gratings, i.e., envelope SF (blue) and carrier SF (red). Curves in blue depict envelope responses with the carrier SF held constant at its measured optimal value for that neuron. For the curves in red, the carrier SF was varied, while keeping envelope SF fixed at the measured optimal luminance SF.
Figure 2.

Examples of SF tuning of CM-responsive neurons in macaque V2. a, A typical CM-responsive single unit. This neuron was tuned to carrier SF (red), peaking at approximately 4.12 cpd, which was much higher than for luminance gratings (black; optimum, ∼0.52 cpd). The optimal envelope SF (blue) was ∼0.66 cpd, similar to but slightly higher than for luminance gratings. b, SF tuning curves of MU activity extracted from the same recording site as the neuron shown in a. c, A neuron whose optimal carrier SF was ∼24× higher than its optimal luminance SF. d, SF tuning curves of MU activity extracted from the same recording site as data shown in c. e, A neuron that exhibited similar response strength for CM gratings and for luminance gratings. f, SF tuning curves of MU activity extracted from the same recording site as the neuron in e. Spontaneous activity was removed in each plot. Error bars indicate ±SE.
The neuron in Figure 2a responded to luminance gratings (black) from 0.08 to ∼1.0 cpd, with an optimum at 0.52 cpd. However CM responses (red) were obtained only for a much higher range of carrier SFs with an optimal value of 4.12 cpd. Note that luminance gratings at these high SFs elicited little or no response. The neuron's envelope SF response (blue) was also bandpass, similar to the spatial response measured with luminance gratings but with a slightly higher optimal value (0.66 cpd). Thus the optimal carrier SF for this neuron was ∼6-fold higher than the optimal envelope SF, and almost eightfold greater than the optimal luminance SF.
The neuron in Figure 2c had an optimal carrier SF at 6.6 cpd, while the optimal luminance and envelope SFs were 0.27 and 0.26 cpd, respectively. The optimal carrier SF was ∼24-fold higher than the optimal SF for luminance gratings or envelopes.
For most V2 neurons examined, the strength of responses obtained with CM stimuli was significantly less than to luminance gratings (Fig. 2a,c). However, we also discovered some neurons that exhibited similar strength of response to CM stimuli and to luminance gratings. For instance, the peak responses of the neuron shown in Figure 2e displayed very similar values (∼11 spikes/s) when measured with either type of stimulus.
MU responses extracted from the same three recordings (Fig. 2, right) had tuning curves very similar to those for the simultaneously recorded single units (Fig. 2a,c,e). This result was generally observed and suggests that both kinds of SF selectivity for CM stimuli are clustered in macaque V2 in a similar manner as previously demonstrated for carrier SF in cat visual cortex (Li and Baker, 2012).
The CM-responsive neurons were bandpass tuned for all of these three SF responses on which they were tested. Note that the bandpass tuning to carrier SF, in a range that was clearly outside the neurons' luminance passbands, demonstrates that the observed CM responses were not luminance artifacts caused by nonlinearities of the CRT or early neural processing (Zhou and Baker, 1993).
Relationship between optimal SFs
The above three example neurons exhibited similar or identical optimal values for luminance and envelope SF response, but had much higher optimal carrier SFs. To examine the generality of this result across the population of sampled CM-responsive neurons, the optimal SFs measured using luminance gratings and CM stimuli are compared in scatterplots in the left column of Figure 3, where each point represents the optimal values obtained for one neuron to different stimuli. The histograms at the right show the distributions of ratios of the compared optimal values.
Figure 3.
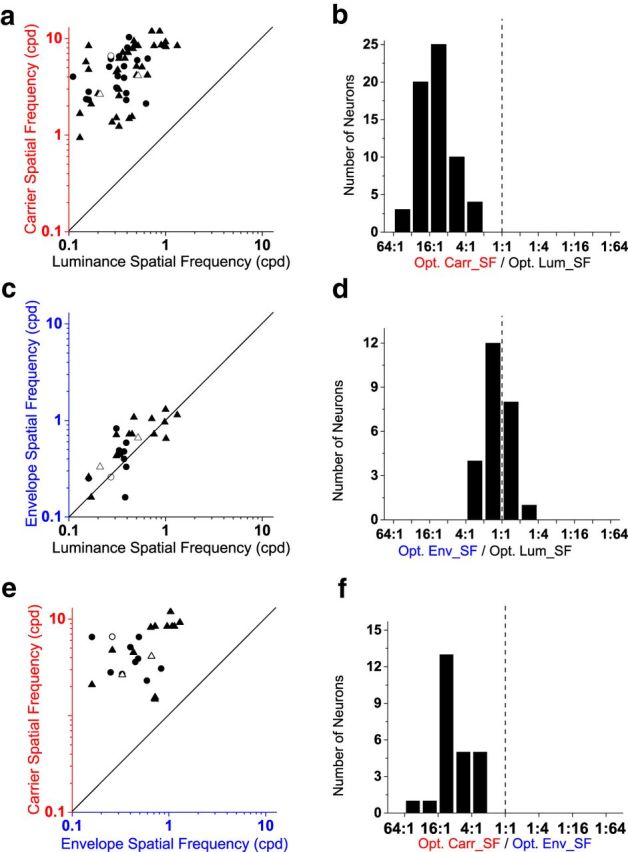
Optimal SFs for CM gratings and luminance gratings. a, c, e, Scatter plots of optimal SFs of sampled neurons. Each point represents one neuron's optimal SF for CM carriers plotted against that for luminance gratings (a), envelope plotted against luminance (c), and carrier plotted against envelope (e). Solid lines depict the unity ratio. b, d, f, Histograms of ratios for data shown in a, c, and e. b, Ratios of neurons' optimal carrier-to-luminance SF values (median, 12.8:1). d, Ratios of neurons' optimal envelope-to-luminance SF. The ratios were ∼1:1, indicating that a neuron's optimal envelope SF was similar to its optimal luminance SF (median, 1.32:1). f, Ratios of neurons' optimal carrier-to-envelope SF (median, 8.21:1). Due to limitations of recording stability, the envelope tuning properties were only measured in a subset of CM neurons. Thus there are 62 pairs shown in a and b, and 25 pairs in c–f. Circles indicate neurons with simple-type responses (21 in a, 10 in c and e). Triangles indicate neurons with complex-type responses (41 in a, 15 in c and e). Open symbols indicate the three example neurons shown in Figure 2.
Each neuron's optimal CM carrier SF is plotted against its optimal luminance SF in Figure 3a. The optimal carrier and luminance SF values are distributed in a range of ∼1–10 and 0.1–1 cpd, respectively. Note that all the data points fall in the upper left corner, well above the unity line, with a moderate degree of correlation (r60 = 0.56, p = 2.50 × 10⁻⁶). This result indicates that the optimal carrier SF of a given CM neuron is much higher than its optimal luminance SF. This relationship is more evident in the histogram of ratios of optimal carrier SF to optimal luminance SF (Fig. 3b). The ratios exhibited a range from 3.4-fold to 52-fold (median, 12.8), with most neurons (55 of 62) having optimal ratios between 4:1 and 32:1. Note that the lack of neurons with low ratios might have been due to the selection criterion of only including neurons for further analysis if the carrier SF tuning was higher than the luminance SF tuning.
The differences between optimal SF values for CM envelope and luminance stimuli are much less pronounced, as shown in Figure 3c. The data points are distributed along the unity line (r23 = 0.75, p = 1.49 × 10⁻⁵) indicating that the optimal envelope SF and luminance SF for a given neuron are similar, with a difference of <1 octave in 84% of tested neurons (21 of 25). The ratios of neurons' optimal CM envelope SF to their optimal luminance SF are distributed in a range from ∼1:2.4 to 2.7:1 with a median of 1.3:1, indicating that neurons typically showed only slightly higher optimal envelope than luminance SFs. A histogram plot of the ratios is shown in Figure 3d.
The ratio of optimal carrier SF to optimal envelope SF is theoretically important, for inferences about possible neuronal mechanisms as well as comparison to human psychophysics (see Discussion). Figure 3e plots the optimal carrier SF against optimal envelope SF for 25 CM-responsive neurons. The data points are scattered in the upper left corner, well above the unity line (r23 = 0.42, p = 0.048), indicating that a given neuron's optimal carrier SF is much higher than its optimal envelope SF. The ratios (Fig. 3f) ranged from 2.0-fold to 41-fold with a median of 8.2-fold, and were significantly >2.0 (Z = 4.36, p = 2.98 × 10⁻⁸, Wilcoxon signed-rank test).
To assess the possible role of surround suppression, we analyzed results from our initial characterization of each neuron, i.e., the response as a function of size of an optimized grating. From such data, we calculated a surround SI (see Materials and Methods). Figure 4a shows an example of a CM-responsive neuron's response as a function of grating size, in which the response increases with size of the grating patch up to an optimum of 3°, and subsequently declines to a smaller value (SI, 13%). A histogram of such SI values for all the CM-responsive neurons in our sample (Fig. 4b) reveals that 50% of these neurons (31 of 62) exhibited little or no surround suppression (SI, <20%). If surround suppression were the underlying mechanism for our CM responses, the histogram in Figure 4b should show a much greater prevalence of larger SI values.
Orientation tuning
The CM-responsive neurons were also orientation-selective for some or all of the orientation parameters of the stimuli on which they were tested. Figure 5 displays polar plots of orientation responses to luminance gratings (left column, black), CM envelopes (second column, blue), and CM carriers (third column, red), for the same three example neurons as in Figure 2. Curves in red depict carrier responses with the envelope orientation held constant at its measured optimal luminance orientation. For the curves in blue, the envelope orientation was varied, while keeping carrier orientation fixed at its measured optimal value for that neuron. Each of these neurons was clearly tuned not only to luminance orientation (black) but also to the envelope orientation (blue) and carrier orientation (red). The neuron in the top row responded to luminance gratings with an optimal orientation of 42.3° (Fig. 5a) and a bandwidth of 0.14. The CM envelope orientation response (Fig. 5b) exhibited an optimal value at 35.0°, which is similar to the optimal luminance value, but with a broader bandwidth (0.63). This neuron was also selective to carrier orientation (Fig. 5c) with an optimal value at 130.8° and a broadly tuned bandwidth (0.82).
Figure 5.

Orientation polar plots for the same three neurons shown in Figure 2. Each row shows data for one neuron. Distance from the origin represents magnitude of response and polar angle represents orientation and direction of motion. Reduced snapshot images of the stimuli are shown alongside the topmost plots, depicting the stimulus patterns corresponding to different orientations. Optimal orientation (Opt. Ori) and bandwidth (B.W.) of each tuning curve are given at bottom right corner of each plot. a, e, i, Neurons' responses to luminance gratings as a function of orientation. b, f, j, Response from the same three neurons to CM stimuli as a function of the envelope orientation, which showed similar orientation and direction preferences as the corresponding luminance responses (a, e, i). c, g, k, Orientation tuning to the carrier. Because the carrier was stationary, symmetric points were reflected about the origin. The optimal carrier orientation was not systematically correlated with the preferred luminance or envelope orientations. d, h, l, Each polar plot shows the orientation response of MU activity extracted from the corresponding recording sites as the neuron shown in the same row. The MU activity was clearly tuned not only to orientation of luminance gratings (black), but also to the orientation of the envelope (blue) and carrier (red) of CM gratings. The optimal orientations were similar to those for single-unit responses shown in the same row, suggesting that nearby CM neurons exhibited similar optimal values for each of these orientation parameters. Spontaneous activity was removed in each plot.
The neuron in the middle row exhibited optimal orientations for luminance (Fig. 5e) and envelope (Fig. 5f) at 42.1 and 31.9°, respectively, while the optimal value of carrier orientation was 92.7° (Fig. 5g). Again the optimal values for the luminance and envelope are very similar, but are not similar to the optimal values for the carrier. This neuron exhibited particularly narrow tuning bandwidth for both CM envelopes (0.03) and luminance gratings (0.08), and also narrow tuning for the CM carrier (bandwidth, 0.38).
For all of the neurons examined, the envelope response plots were generally very similar to the corresponding luminance plots, even for neurons selective to direction of motion. For example, the neuron in the bottom row of Figure 5 exhibited strong direction selectivity for motion of the envelope (Fig. 5j), which was consistent with its direction selectivity for luminance gratings (Fig. 5i).
Comparing the tuning curves for the CM carrier with those for luminance or CM envelope stimuli, there did not appear to be a fixed relationship between the optimal carrier and luminance orientations, or between optimal carrier and envelope orientations. For example, in one of the sample neurons (middle row), the optimal luminance orientation (Fig. 5e) and optimal envelope orientation (Fig. 5f) showed a difference of ∼60° from the optimal carrier orientation (Fig. 5g), while for the other two neurons (top and bottom rows), they were nearly orthogonal.
MU responses extracted from the same three recordings are shown in the right column of Figure 5. Again, the MU responses had very similar tuning curves to those found for the simultaneously recorded single units, suggesting that all three kinds of orientation selectivity are also clustered in macaque V2, in a similar manner as previously demonstrated in the cat (Li and Baker, 2012).
Relationship between optimal orientations
For the three example neurons in Figure 5, it is apparent that the optimal envelope and luminance orientations were very similar, but the optimal carrier orientations could be quite different. To evaluate these relationships across the sample population, we compared optimal orientations measured with luminance and CM gratings in each CM-responsive neuron.
In Figure 6a, the optimal carrier orientation for each neuron is plotted against its optimal luminance orientation. The solid line represents an equality ratio (same optimal orientations), whereas the two dashed lines indicate orthogonal preferred orientations. The data are highly scattered (r54 = 0.17, p = 0.21), indicating that there is no fixed relationship between the optimal carrier and luminance orientations. However, the histogram of differences in preferred orientations (Fig. 6b) is unimodally distributed (χ52 = 16.21; N = 56; p = 6.26 × 10⁻³; χ2 test of uniform distribution; dip, 0.039; p = 0.57, dip test of unimodality), suggesting that there were more CM neurons showing a difference of ∼90°.
Figure 6.
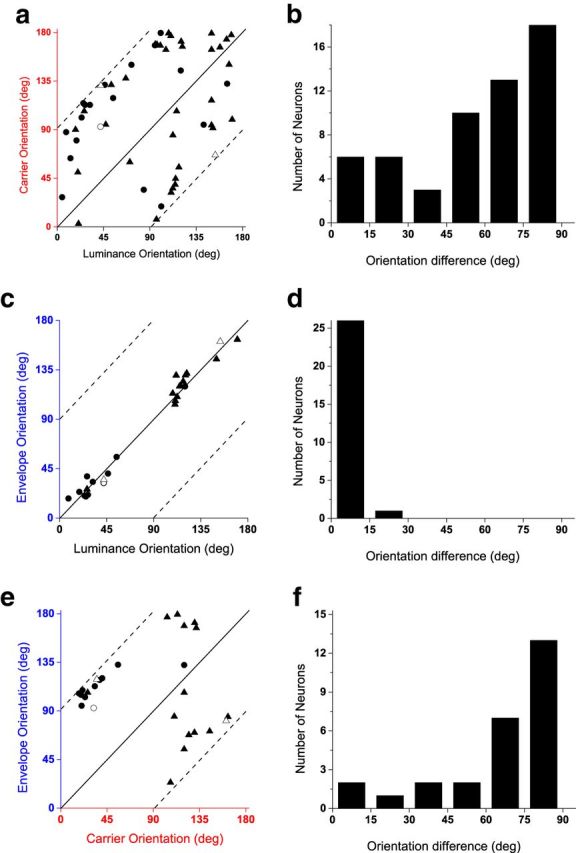
Measured optimal orientations to CM and luminance gratings, shown in similar format as Figure 3. a, c, e, Scatter plots of optimal orientations. Each point represents one neuron's measured optimal orientation to carrier versus luminance (a), envelope versus luminance (c), and envelope versus carrier (e). Solid and dashed lines depict orientation differences of 0 and ±90°, respectively. Circles and triangles indicate neurons with simple-type (20 in a, 11 in c and e) and complex-type (36 in a, 16 in c and e) responses, respectively. Open symbols indicate the three sample neurons shown in Figure 5. b, d, f, Histograms of differences between the preferred orientations for data shown in a, c, and e. The envelope tuning properties were only measured in a subset of CM-responsive neurons. Thus, 56 neurons are shown in a and b, and 27 neurons are shown in c–f.
The optimal CM envelope orientation for each neuron is plotted against its optimal luminance grating orientation in Figure 6c. The data points cluster closely around the equality line (r25 = 0.99, p < 1.00 × 10⁻¹⁹), demonstrating that a given neuron's orientation selectivity for envelopes was the same as for luminance gratings. The histogram of differences in preferred orientation (Fig. 6d) is highly unimodal (χ52 = 123.44; N = 27; p < 1.00 × 10⁻¹⁹; χ2 test of uniform distribution; dip, 0.050; p = 0.91, dip test of unimodality). This result clearly shows that these neurons were selective to a particular boundary orientation regardless of whether it was defined by luminance or contrast, a kind of “form-cue invariance” (see Discussion).
The relationship between the optimal envelope and carrier orientations of the CM stimulus is shown in Figure 6e,f. The data points (Fig. 6e) are highly scattered (r25 = 0.29, p = 0.14), suggesting no fixed relationship between the optimal envelope and carrier orientations. The histogram of orientation differences (Fig. 6f) is unimodally distributed (χ52 = 24.33; N = 27; p = 1.88 × 10⁻⁴; χ2 test of uniform distribution; dip, 0.042; p = 0.98, dip test of unimodality), suggesting that the orientation differences are more frequently ∼60–90°.
Carrier SFs inside luminance passband
In some of our experiments, we used linear array multielectrodes, in which our standard protocol of a series of different tuning curves was guided by the responses from a single selected channel. Subsequent analysis of neurons inadvertently recorded on other channels sometimes revealed responses to CM stimuli when the carrier SF was inside the neuron's luminance SF passband (Fig. 7). SF responses of an example neuron are shown in Figure 7a. The CM tuning properties of this neuron were measured with a carrier SF (red arrow) that was inside the neuron's frequency-selective range for luminance gratings (black). This neuron exhibited SF tuning for CM envelopes (blue) with a carrier SF (red) only ∼2× higher than its optimal envelope SF. For such neurons, the optimal carrier SFs were always ∼2× higher (median, 2.16; Fig. 7b) than the optimal envelope SFs - substantially lower than the carrier/envelope SF ratios of CM-responsive neurons that are the main subject of this study (median, 8.21; Fig. 3f). Hence we refer to these neurons as “2:1 neurons.”
Figure 7.

Tuning properties of response to CM gratings having carrier SFs inside a neuron's frequency-selective range for luminance gratings. a, Example of SF responses for one neuron. The SF tuning for luminance gratings is plotted in black. The CM tuning properties of this neuron were measured with a carrier SF (red arrow) that was inside the neuron's frequency-selective range for luminance gratings. The SF tuning for envelope responses is plotted in blue. Error bars indicate ±SE. b, Scatter plot of results from several similarly tested neurons. Each point indicates one neuron's carrier SF plotted against its optimal envelope SF. All points are distributed around a 2:1 ratio line (hence we refer to these as 2:1 neurons; N = 12). c–e, Orientation polar plots for the same neuron shown in a, for luminance gratings (c, black), CM carriers (d, red), and CM envelopes (e, blue). Distance from the origin represents magnitude of response and polar angle represents orientation. Optimal orientation (Opt. Ori) and bandwidth (B.W.) of each tuning curve are given at bottom-right of the plot. f, Scatter plot of 2:1 neurons' optimal envelope orientations plotted against their optimal luminance orientations (N = 13). Spontaneous activity was removed in tuning curve plots (a, c–e).
The orientation tuning properties for the same example neuron are shown in Figure 7c–e. Note that, unlike the neurons in Figure 5, this neuron exhibited similar optimal orientation for luminance (black) and carrier (red), but not envelope (blue). To investigate the relationship between optimal luminance orientations and optimal envelope orientations for these 2:1 neurons, the optimal envelope orientations are plotted against their optimal luminance orientations in Figure 7f. Unlike in Figure 6c,d, the neurons shown here do not exhibit any clear relationship between the optimal CM envelope orientations and their optimal luminance grating orientations, and thus are not form-cue invariant. Based on the differences of carrier/envelope SF ratios and the lack of form-cue invariant orientation tuning, the responses of these neurons are clearly a very different kind of CM response from the main parts of our results. Instead they resemble what would be expected from a surround suppression mechanism (Tanaka and Ohzawa, 2009; Hallum and Movshon, 2011; see Discussion).
Comparison with cat
The response properties of CM-responsive neurons in primate V2 are broadly similar to those in cat area 17/18 (Mareschal and Baker, 1998b, 1999; Tanaka and Ohzawa, 2006; Rosenberg et al., 2010; Rosenberg and Issa, 2011) in that they are clearly tuned to carrier SF, exhibit high ratios of optimal carrier to luminance or envelope SF, and show form-cue invariant orientation selectivity. However, they are different in some noteworthy details. To illustrate these differences, we compare data from macaques and cats in Figure 8.
Figure 8.

Comparison of tuning properties of CM neurons in macaque V2 and cat area 18. a, Optimal carrier SF of CM-responsive neurons in macaque V2 (median, 5.06 cpd; N = 62) and cat area 18 (median, 1.05 cpd; N = 32). b, Optimal envelope SF of CM-responsive neurons in macaque V2 (median, 0.59 cpd; N = 25) and cat area 18 (median, 0.06 cpd; N = 33). c, Distribution of carrier orientation tuning bandwidth measured from macaque V2 (N = 56) and cat area 18 (N = 21). Cat data from Mareschal and Baker (1999).
The most obvious species difference in CM responses is in the optimal SFs, shown in Figure 8a for the carrier tuning. For macaque neurons, the optimal carrier SFs are distributed in a range from 0.94 to 12 cpd with a median of 5.1 cpd, which are much higher than for cats (from 0.56 to 1.70 cpd; median, 1.05 cpd; U = 53; Z = −7.49; p = 3.07 × 10⁻¹⁹; r = 0.77, Mann–Whitney U test). Similar differences were seen in the envelope SF tuning results (Fig. 8b): the optimal envelope SFs are much higher for monkey neurons (median, 0.59 cpd) than for cats (median, 0.06 cpd; U = 2; Z = −6.44; p = 1.16 × 10⁻¹⁰; r = 0.84; Mann–Whitney U test). However this difference should not be surprising, given these species' rather different acuities and optimal SFs for luminance gratings (Movshon et al., 1978; Foster et al., 1985).
A second clear species difference was in carrier orientation tuning bandwidths, shown in Figure 8c. Unlike the CM-responsive neurons in cat area 18, for which carrier orientation bandwidths can often be quite broad or even isotropic (Mareschal and Baker, 1998a, 1999), the CM-responsive neurons in macaque V2 are often narrowly tuned to carrier orientation (U = 1061, Z = 5.40, p = 6.48 × 10⁻⁸, r = 0.62, Mann–Whitney U test).
Discussion
Our results have demonstrated that neurons in the early primate visual system can detect boundaries defined by variations not only in luminance but also in contrast. These neurons also exhibited clear spatial selectivity for carrier patterns of CM stimuli, indicating a specialized nonlinear mechanism for their detection. Most importantly, this carrier selectivity rules out possible artifactual responses due to spurious luminance signals from simple early nonlinearities or stimulus artifacts (Zhou and Baker, 1993, 1994). For example, a simple early nonlinearity due to inadequate gamma correction of the CRT display, or photoreceptor nonlinearities (MacLeod et al., 1992), would have been largely indiscriminate to the carrier pattern. Luminance signals from “pixel clumping” in noise carriers (Smith and Ledgeway, 1997) were not an issue due to our use of carrier patterns that were narrowband in SF and outside the luminance passband of each neuron. Artifactual CM responses from an “adjacent pixel nonlinearity” (Klein et al., 1996), in which a given pixel's luminance may depend on the preceding pixel along the CRT line scan, would always exhibit an optimal carrier SF at the highest value tested, and an optimal carrier orientation perpendicular to the CRT scan lines. Instead we found that different neurons were tuned to a variety of distinct carrier SFs and orientations. Thus it is highly unlikely that these CM responses are due to such luminance artifacts.
Surround suppression can give rise to tuned responses to CM gratings (Tanaka and Ohzawa, 2009; Hallum and Movshon, 2011; Figure 9a). However, approximately half of the CM-responsive neurons in this study exhibited little or no surround suppression to luminance gratings (Fig. 4). Also the high carrier/envelope SF ratios of our CM-responsive neurons (median, 8.21; Fig. 3e,f) are markedly inconsistent with a surround suppression mechanism, which yields carrier/envelope SF ratios of ∼2 (Tanaka and Ohzawa, 2009). In addition, the form-cue invariance and direction selectivity in many of our CM responses are inconsistent with a surround suppression mechanism (Tanaka and Ohzawa, 2009). From our multielectrode recordings, we also inadvertently obtained some “2:1 neurons” (Fig. 7) in which the ratios of the optimal carrier-to-envelope SFs are similar to those of surround suppression-mediated CM responses (Tanaka and Ohzawa, 2009; Hallum and Movshon, 2011). These neurons did not exhibit form-cue invariance (Fig. 7f), unlike our CM-responsive neurons (Fig. 6c). Thus it seems highly likely that these 2:1 neurons' responses to CM stimuli were mediated by surround suppression and not by the kind of mechanism underlying the responses described in the main body of this paper.
Figure 9.

Simplified hypothetical neural circuitries underlying V2 CM-responsive neuron's receptive field (RF). a, Surround suppression mechanism that can mediate contrast envelope response (Tanaka and Ohzawa, 2009). The carrier selectivity is primarily dependent on the classical RF (continuous lines). Thus, the optimal carrier orientation (red) is the same as the optimal luminance orientation (black). The optimal envelope orientation is dependent on the relative position of the classical RF (solid) and its suppressive surround (dotted). Thus, the envelope is tuned to the orientation (blue) at which the least surround suppression could be induced. b, A simple two-stage mechanism that could mediate CM responses. Fine-scale subunits are all tuned to similar orientation and SF. The CM carrier orientation tuning is dependent on subunits. Thus, there is no correlation between optimal carrier orientation (red) and the classical RF of the V2 neuron. On the other hand, because the envelope orientation preference arises from the RF of the V2 neuron, the optimal envelope orientation (blue) is similar to the optimal luminance orientation (black, cue-invariance).
The high ratios of preferred carrier-to-envelope SFs of the CM-responsive neurons are however consistent with a two-stage nonlinear processing [filter-rectify-filter (F-R-F)] model (Wilson et al., 1992; Landy and Graham, 2004), in which the early stage detects fine-scale carrier/texture elements, followed by a second stage that detects coarse-scale envelopes (Fig. 9b). However, the neuronal basis of such an F-R-F model is uncertain, particularly the first stage that detects texture elements (carrier). Such neurons must be SF and orientation selective, so a candidate for this stage might be V1 neurons (Mareschal and Baker, 1999), which provide substantial input to V2 (Van Essen et al., 1986). Alternatively, recent studies (Rosenberg et al., 2010; Rosenberg and Issa, 2011) found that nonlinear responses of cat lateral geniculate nucleus (LGN) Y-cells are tuned to carrier SF and orientation of CM gratings, suggesting that Y-like primate retinal ganglion cells (Crook et al., 2008) and magnocellular LGN neurons (Kaplan and Shapley, 1982) could provide carrier-tuned inputs to a subset of V1 neurons, which project to V2. Either source of early-stage processing would be consistent with the general idea that V1 neurons might act as subunits within a V2 neuron's receptive field to enable detection of complex patterns (Anzai et al., 2007).
Using reverse correlation to pseudorandom multiregion grating stimuli, Schmid et al. (2014) report nonlinear interaction kernels in V2 neurons that are form-cue invariant to luminance and orientation-defined boundaries, and that are not related to surround suppression. Such responses could also arise from an F-R-F mechanism (see below) and might reveal the same kind of second-order processing as described here, though their relationship to CM responses has not yet been demonstrated.
Tao et al. (2012) used local spectral reverse correlation to map SF-selective and orientation-selective subfields in primate V2. In principle, this method might reveal simple-type CM-responsive neurons, but this would require significantly smaller noise element sizes to resolve the high carrier SFs that we observe.
Some of the differences between cats and monkeys in CM-responsive neurons (Fig. 8) could make it more difficult to find such neurons in primates. For example, El-Shamayleh and Movshon (2011) reported a lack of second-order responses with high specific carrier tuning in primate V2, though their study primarily employed orientation-modulation stimuli with only a minority of results from CM patterns. First, for the quite high carrier SFs to be visible, optical quality of the eyes is essential. Using appropriate spectacle lenses selected by careful refraction, placement of artificial pupils and routine cleaning of contact lenses are very important for providing adequate retinal image contrast. Second, it is important to employ high-contrast stimuli. Human psychophysics (Schofield and Georgeson, 2003) and cat electrophysiology (Ledgeway et al., 2005) results demonstrate that contrast sensitivity to CM patterns is much lower than to luminance gratings, and a similar relationship is also likely in macaques. Third, the monkey CM-responsive neurons are highly selective to both carrier SF and orientation, and lack any fixed relationship between envelope and carrier spatial parameters (Figs. 3e, 6e). Thus a search procedure of systematically testing many combinations of carrier SF and orientation (see Materials and Methods) is clearly important in searching for CM-responsive neurons in macaque V2.
However, even with our procedures, we might have missed some CM-responsive neurons in our experiments. (1) Due to constraints of our setup, the highest carrier SF we tested was 11.9 cpd. We tried to reduce the impact of this constraint by concentrating our efforts on parts of V2 having receptive fields well away from the fovea, but we cannot rule out the possibility of CM neurons tuned to higher carrier SFs. (2) We assessed CM responsivity using static carrier patterns, but Rosenberg and Issa (2011) have reported that in the cat some CM-responsive neurons respond much better, or even exclusively, to moving carrier textures. If such neurons exist in primate V2, we would have missed them. (3) Although our optical refraction was performed very carefully, nevertheless it may have been subject to some error, which could seriously attenuate responses to these high carrier SFs (Ledgeway et al., 2005).
Detection of CM patterns has been of long-standing interest in human psychophysics (Graham, 2011), but previous neurophysiology that quantitatively probed CM carrier and envelope selectivity was in the cat, whose visual system has important differences from that of humans. With the present results from the macaque monkey, we can begin to make more meaningful comparisons with human psychophysics. In particular, the ratios of optimal carrier-to-envelope SF in these V2 neurons are similar to those found in human psychophysical studies that systematically assessed this ratio (Sutter et al., 1995; Dakin and Mareschal, 2000) and are consistent with the ratios yielding perceptual transparency from CM stimuli (Kawabe and Miura, 2004). In addition, a given CM-responsive neuron's preferred envelope orientation and direction were similar to its preferences for luminance stimuli. This form-cue invariance could be a substrate for human psychophysical results indicating form-cue invariant directional selectivity (Aaen-Stockdale et al., 2012).
Our findings raise the possibility that these neurons might also show specific form-cue invariant responses to still other kinds of stimuli. If the CM processing of primate V2 neurons can be described by a model like that of Figure 9b, then the same neurons might respond to other “second-order” stimuli, such as illusory contours (von der Heydt et al., 1984; Song and Baker, 2006), and other texture boundaries, such as orientation modulation boundaries, which have been explored in human psychophysics (Kingdom et al., 2003) and neurophysiology (Schmid et al., 2014). Since some V2 neurons are orientation selective to chromatic (Roe and Ts'o, 1999) as well as luminance contours (Anzai et al., 2007), and since texture and chromatic boundaries tend to co-occur in natural images (Johnson et al., 2005), it might be expected that some V2 neurons would be form-cue invariant to both kinds of stimuli.
We have demonstrated neurons in early primate visual cortex that exhibit highly selective tuning to CM carrier patterns, indicative of a specialized nonlinear mechanism. This is also the first demonstration of form-cue invariant second-order responses in primate V2. Thus, these neurons could provide a functionally useful, explicit representation of segmentation boundaries in natural images. The high ratios of preferred carrier SF to envelope SF make these neurons suitable for encoding the large-scale boundaries between fine-grain textures that are ubiquitous in natural images, and to which human psychophysics shows the greatest sensitivity.
Footnotes
This work was supported by a Canadian Institutes of Health Research (CIHR)–National Natural Science Foundation of China (NSFC) China–Canada Joint Health Initiative Collaboration grant (CCI-92217; NSFC-30811120423) to C.B. and to Y.Z.; the NSFC (NSFC 31230032) and the Fundamental Research Funds for the Central Universities (WK2100230002) to Y.Z.; and a CIHR operating grant (MOP-119498) to C.B. The authors thank Yong Tang for teaching us to perform the refraction, Mingjing Zhang and Guorong Li for contributing to the programming, Zhen Liang for contributing to the experimental setup, and Guangwei Xu for assistance with some of the experiments.
The authors declare no competing financial interests.
References
- Aaen-Stockdale C, Ledgeway T, McGraw P, Hess RF. Interaction of first- and second-order signals in the extraction of global-motion and optic-flow. Vision Res. 2012;68:28–39. doi: 10.1016/j.visres.2012.07.004. [DOI] [PubMed] [Google Scholar]
- Anzai A, Peng X, Van Essen DC. Neurons in monkey visual area V2 encode combinations of orientations. Nat Neurosci. 2007;10:1313–1321. doi: 10.1038/nn1975. [DOI] [PubMed] [Google Scholar]
- Arsenault E, Yoonessi A, Baker C., Jr Higher order texture statistics impair contrast boundary segmentation. J Vis. 2011;11(10):14. doi: 10.1167/11.10.14. [DOI] [PubMed] [Google Scholar]
- Brainard DH. The psychophysics toolbox. Spat Vis. 1997;10:433–436. doi: 10.1163/156856897X00357. [DOI] [PubMed] [Google Scholar]
- Cavanaugh JR, Bair W, Movshon JA. Nature and interaction of signals from the receptive field center and surround in macaque V1 neurons. J Neurophysiol. 2002;88:2530–2546. doi: 10.1152/jn.00692.2001. [DOI] [PubMed] [Google Scholar]
- Crook JD, Peterson BB, Packer OS, Robinson FR, Troy JB, Dacey DM. Y-cell receptive field and collicular projection of parasol ganglion cells in macaque monkey retina. J Neurosci. 2008;28:11277–11291. doi: 10.1523/JNEUROSCI.2982-08.2008. [DOI] [PMC free article] [PubMed] [Google Scholar]
- Dakin SC, Mareschal I. Sensitivity to contrast modulation depends on carrier spatial frequency and orientation. Vision Res. 2000;40:311–329. doi: 10.1016/S0042-6989(99)00179-0. [DOI] [PubMed] [Google Scholar]
- DeAngelis GC, Freeman RD, Ohzawa I. Length and width tuning of neurons in the cat's primary visual cortex. J Neurophysiol. 1994;71:347–374. doi: 10.1152/jn.1994.71.1.347. [DOI] [PubMed] [Google Scholar]
- De Valois RL, Albrecht DG, Thorell LG. Spatial frequency selectivity of cells in macaque visual cortex. Vision Res. 1982;22:545–559. doi: 10.1016/0042-6989(82)90113-4. [DOI] [PubMed] [Google Scholar]
- DiCarlo JJ, Lane JW, Hsiao SS, Johnson KO. Marking microelectrode penetrations with fluorescent dyes. J Neurosci Methods. 1996;64:75–81. doi: 10.1016/0165-0270(95)00113-1. [DOI] [PubMed] [Google Scholar]
- El-Shamayleh Y, Movshon JA. Neuronal responses to texture-defined form in macaque visual area V2. J Neurosci. 2011;31:8543–8555. doi: 10.1523/JNEUROSCI.5974-10.2011. [DOI] [PMC free article] [PubMed] [Google Scholar]
- Foster KH, Gaska JP, Nagler M, Pollen DA. Spatial and temporal frequency selectivity of neurones in visual cortical areas V1 and V2 of the macaque monkey. J Physiol. 1985;365:331–363. doi: 10.1113/jphysiol.1985.sp015776. [DOI] [PMC free article] [PubMed] [Google Scholar]
- Graham NV. Beyond multiple pattern analyzers modeled as linear filters (as classical V1 simple cells): useful additions of the last 25 years. Vision Res. 2011;51:1397–1430. doi: 10.1016/j.visres.2011.02.007. [DOI] [PubMed] [Google Scholar]
- Hallum LE, Movshon JA. Second-order selectivity of single units in macaque primary visual cortex (V1) and V2. J Vis. 2011;11(11):1198. doi: 10.1167/11.11.1198. [DOI] [Google Scholar]
- Johnson AP, Kingdom FA, Baker CL., Jr Spatiochromatic statistics of natural scenes: first- and second-order information and their correlational structure. J Opt Soc Am A Opt Image Sci Vis. 2005;22:2050–2059. doi: 10.1364/JOSAA.22.002050. [DOI] [PubMed] [Google Scholar]
- Kaplan E, Shapley RM. X and Y cells in the lateral geniculate nucleus of macaque monkeys. J Physiol. 1982;330:125–143. doi: 10.1113/jphysiol.1982.sp014333. [DOI] [PMC free article] [PubMed] [Google Scholar]
- Kawabe T, Miura K. Configuration effects on texture transparency. Spat Vis. 2004;17:187–200. doi: 10.1163/1568568041865971. [DOI] [PubMed] [Google Scholar]
- Kingdom FA, Prins N, Hayes A. Mechanism independence for texture-modulation detection is consistent with a filter-rectify-filter mechanism. Vis Neurosci. 2003;20:65–76. doi: 10.1017/s0952523803201073. [DOI] [PubMed] [Google Scholar]
- Klein SA, Hu QJ, Carney T. The adjacent pixel nonlinearity: problems and solutions. Vision Res. 1996;36:3167–3181. doi: 10.1016/0042-6989(96)00051-X. [DOI] [PubMed] [Google Scholar]
- Kleiner M, Brainard D, Pelli D. What's new in Psychtoolbox-3?. Paper presented at the 36th European Conference on Visual Perception; Arezzo, Italy. 2007. [Google Scholar]
- Landy MS, Graham N. Visual perception of texture. In: Chalupa LM, Werner JS, editors. The Visual Neurosciences. Cambridge, MA: MIT; 2004. pp. 1106–1118. [Google Scholar]
- Ledgeway T, Zhan C, Johnson AP, Song Y, Baker CL., Jr The direction-selective contrast response of area 18 neurons is different for first- and second-order motion. Vis Neurosci. 2005;22:87–99. doi: 10.1017/S0952523805221120. [DOI] [PubMed] [Google Scholar]
- Leventhal AG, Wang Y, Pu M, Zhou Y, Ma Y. GABA and its agonists improved visual cortical function in senescent monkeys. Science. 2003;300:812–815. doi: 10.1126/science.1082874. [DOI] [PubMed] [Google Scholar]
- Li G, Baker CL., Jr Functional organization of envelope-responsive neurons in early visual cortex: organization of carrier tuning properties. J Neurosci. 2012;32:7538–7549. doi: 10.1523/JNEUROSCI.4662-11.2012. [DOI] [PMC free article] [PubMed] [Google Scholar]
- MacLeod DI, Williams DR, Makous W. A visual nonlinearity fed by single cones. Vision Res. 1992;32:347–363. doi: 10.1016/0042-6989(92)90144-8. [DOI] [PubMed] [Google Scholar]
- Mareschal I, Baker CL., Jr A cortical locus for the processing of contrast-defined contours. Nat Neurosci. 1998a;1:150–154. doi: 10.1038/401. [DOI] [PubMed] [Google Scholar]
- Mareschal I, Baker CL., Jr Temporal and spatial response to second-order stimuli in cat area 18. J Neurophysiol. 1998b;80:2811–2823. doi: 10.1152/jn.1998.80.6.2811. [DOI] [PubMed] [Google Scholar]
- Mareschal I, Baker CL., Jr Cortical processing of second-order motion. Vis Neurosci. 1999;16:527–540. doi: 10.1017/s0952523899163132. [DOI] [PubMed] [Google Scholar]
- Motoyoshi I, Nishida S, Sharan L, Adelson EH. Image statistics and the perception of surface qualities. Nature. 2007;447:206–209. doi: 10.1038/nature05724. [DOI] [PubMed] [Google Scholar]
- Movshon JA, Thompson ID, Tolhurst DJ. Spatial summation in the receptive fields of simple cells in the cat's striate cortex. J Physiol. 1978;283:53–77. doi: 10.1113/jphysiol.1978.sp012488. [DOI] [PMC free article] [PubMed] [Google Scholar]
- Roe AW, Ts'o DY. Specificity of color connectivity between primate V1 and V2. J Neurophysiol. 1999;82:2719–2730. doi: 10.1152/jn.1999.82.5.2719. [DOI] [PubMed] [Google Scholar]
- Rosenberg A, Issa NP. The Y cell visual pathway implements a demodulating nonlinearity. Neuron. 2011;71:348–361. doi: 10.1016/j.neuron.2011.05.044. [DOI] [PubMed] [Google Scholar]
- Rosenberg A, Husson TR, Issa NP. Subcortical representation of non-Fourier image features. J Neurosci. 2010;30:1985–1993. doi: 10.1523/JNEUROSCI.3258-09.2010. [DOI] [PMC free article] [PubMed] [Google Scholar]
- Schmid AM, Purpura KP, Victor JD. Responses to orientation discontinuities in V1 and V2: physiological dissociations and functional inplications. J Neurosci. 2014;34:3559–3578. doi: 10.1523/JNEUROSCI.2293-13.2014. [DOI] [PMC free article] [PubMed] [Google Scholar]
- Schofield AJ, Georgeson MA. Sensitivity to contrast modulation: the spatial frequency dependence of second-order vision. Vision Res. 2003;43:243–259. doi: 10.1016/S0042-6989(02)00542-4. [DOI] [PubMed] [Google Scholar]
- Schofield AJ, Rock PB, Sun P, Jiang X, Georgeson MA. What is second-order vision for? Discriminating illumination versus material changes. J Vis. 2010;10(9):2. doi: 10.1167/10.9.2. [DOI] [PubMed] [Google Scholar]
- Skottun BC, De Valois RL, Grosof DH, Movshon JA, Albrecht DG, Bonds AB. Classifying simple and complex cells on the basis of response modulation. Vision Res. 1991;31:1079–1086. doi: 10.1016/0042-6989(91)90033-2. [DOI] [PubMed] [Google Scholar]
- Smith AT, Ledgeway T. Separate detection of moving luminance and contrast modulations: fact or artifact? Vision Res. 1997;37:45–62. doi: 10.1016/S0042-6989(96)00147-2. [DOI] [PubMed] [Google Scholar]
- Song Y, Baker CL. Neural mechanisms mediating responses to abutting gratings: luminance edges vs. illusory contours. Vis Neurosci. 2006;23:181–199. doi: 10.1017/S0952523806232036. [DOI] [PubMed] [Google Scholar]
- Sutter A, Sperling G, Chubb C. Measuring the spatial frequency selectivity of second-order texture mechanisms. Vision Res. 1995;35:915–924. doi: 10.1016/0042-6989(94)00196-S. [DOI] [PubMed] [Google Scholar]
- Tanaka H, Ohzawa I. Neural basis for stereopsis from second-order contrast cues. J Neurosci. 2006;26:4370–4382. doi: 10.1523/JNEUROSCI.4379-05.2006. [DOI] [PMC free article] [PubMed] [Google Scholar]
- Tanaka H, Ohzawa I. Surround suppression of V1 neurons mediates orientation-based representation of high-order visual features. J Neurophysiol. 2009;101:1444–1462. doi: 10.1152/jn.90749.2008. [DOI] [PubMed] [Google Scholar]
- Tao X, Zhang B, Smith EL, 3rd, Nishimoto S, Ohzawa I, Chino YM. Local sensitivity to stimulus orientation and spatial frequency within the receptive fields of neurons in visual area 2 of macaque monkeys. J Neurophysiol. 2012;107:1094–1110. doi: 10.1152/jn.00640.2011. [DOI] [PMC free article] [PubMed] [Google Scholar]
- Van Essen DC, Newsome WT, Maunsell JH, Bixby JL. The projections from striate cortex (V1) to areas V2 and V3 in the macaque monkey: asymmetries, areal boundaries, and patchy connections. J Comp Neurol. 1986;244:451–480. doi: 10.1002/cne.902440405. [DOI] [PubMed] [Google Scholar]
- von der Heydt R, Peterhans E, Baumgartner G. Illusory contours and cortical neuron responses. Science. 1984;224:1260–1262. doi: 10.1126/science.6539501. [DOI] [PubMed] [Google Scholar]
- Willmore BD, Prenger RJ, Gallant JL. Neural representation of natural images in visual area V2. J Neurosci. 2010;30:2102–2114. doi: 10.1523/JNEUROSCI.4099-09.2010. [DOI] [PMC free article] [PubMed] [Google Scholar]
- Wilson HR, Ferrera VP, Yo C. A psychophysically motivated model for two-dimensional motion perception. Vis Neurosci. 1992;9:79–97. doi: 10.1017/S0952523800006386. [DOI] [PubMed] [Google Scholar]
- Zhou YX, Baker CL., Jr A processing stream in mammalian visual cortex neurons for non-Fourier responses. Science. 1993;261:98–101. doi: 10.1126/science.8316862. [DOI] [PubMed] [Google Scholar]
- Zhou YX, Baker CL., Jr Envelope-responsive neurons in areas 17 and 18 of cat. J Neurophysiol. 1994;72:2134–2150. doi: 10.1152/jn.1994.72.5.2134. [DOI] [PubMed] [Google Scholar]