

Abstract
One of the striking manifestations of neuronal population activity is that of rhythmic oscillations in the local field potential. It is thought that such oscillatory patterns, including phase-amplitude coupling (PAC) and inter-regional synchrony, may represent forms of local and long-range cortical computations, respectively. Although it has been speculated that these two oscillatory patterns are functionally related, and bind disparate cortical assemblies to one another at different timescales, there is little direct evidence to support this hypothesis. We have demonstrated recently that theta to high-gamma PAC and interlaminar phase coherence at theta frequencies can be generated in human cortical slices maintained in vitro. Here we show that not only do such oscillatory patterns exist within human temporal neocortex, but that the strength of one is related to the strength of the other. We demonstrate that at theta frequencies, metrics of temporal synchrony between superficial and deep cortical laminae (phase-dependent power correlations, and phase coherence) are correlated to the magnitude of intralaminar PAC between theta and high-gamma. Specifically, our results suggest that interlaminar communication within human temporal neocortex and local laminar excitability are linked to one another through a dependence mediated by theta oscillations. More generally, our results provide evidence for the hypothesis that theta oscillations may coordinate inter-areal excitability in the human brain.
Keywords: cortical column, high-gamma, human cortex, phase-amplitude coupling, synchrony, theta
Introduction
Theta (4–10 Hz) oscillations are a ubiquitous rhythm found within almost all cortical and subcortical structures of the primate and murine brain (Womelsdorf et al., 2010). The functions theta oscillations subserve can be inferred from observations of inter-regional coherence (Womelsdorf et al., 2010) and modulation of gamma amplitude, so-called phase–amplitude coupling (PAC; Canolty and Knight, 2010). Inter-regional coherence is thought to coordinate information between disparate brain regions (Varela et al., 2001; Fries, 2005; Siegel et al., 2012), whereas the functions of theta-gamma PAC are likely multifarious, given the heterogeneity of gamma oscillations, and the underlying mechanisms of their generation are myriad (Womelsdorf et al., 2014). Regardless, narrow-band gamma oscillations (either low or high) are likely computationally different than broadband power changes (Miller, 2010; Buzsáki and Wang, 2012), with the latter likely a surrogate for cortical excitability (Ray et al., 2008; Manning et al., 2009; Miller, 2010). The cellular substrates underlying theta oscillations are speculative, particularly in the context of the human brain (Florez et al., 2013), but rodent work suggests a large repertoire of theta-generating mechanisms (Womelsdorf et al., 2014).
We have observed non-zero phase-lagged phase-synchronous theta oscillations between superficial and deep cortical layers in human neocortical slices, with temporal delays between these layers suggesting that infragranular layers play a leading role in driving these coherent oscillations (Florez et al., 2013). Consistent with these observations, electrophysiological studies in murine neocortex suggest that regular-spiking layer V neurons are responsible for exciting superficial principle cells at low frequencies, including the low-theta range (Carracedo et al., 2013). In addition to phase-synchronous theta oscillations between superficial and deep cortical layers, we also observed theta to high-gamma PAC in superficial and deep cortical layers of the human cortex (Florez et al., 2013) reminiscent of the PAC observed in vivo (Canolty et al., 2006).
Given (1) the phase synchrony we observe between cortical laminae at theta frequencies, (2) that high-gamma is likely a proxy for cortical excitability (Buzsáki et al., 2012), (3) that communication through coherence (CTC; Fries, 2005) functions by matching periods of excitability between regions, and (4) the dense cortical interlaminar connectivity (Douglas and Martin, 2004), we hypothesized that heightened periods of cortical excitability manifesting as theta to high-gamma PAC are associated with heightened periods of interlaminar theta synchrony.
We explore this hypothesis in human cortical tissue and show that stronger theta synchrony between layers is associated with greater theta to high-gamma PAC within layers. We suggest the “coordination though coherent phase–amplitude coupling” (von Nicolai et al., 2014) we observe provides evidence for coupling between theta synchrony and local neuronal excitability within cortical columns of the human brain.
Materials and Methods
The signals obtained from 23 patients (14 female) used in a previous report (Florez et al., 2013) were subjected to additional analysis. Local field potentials (LFPs) were recorded simultaneously in superficial (layers II/III, 200–700 μm from the pial surface) and deep (layers V–VI, 2000–3500 μm from the pial surface) layers (Köhling and Avoli, 2006) in 500-μm-thick temporal cortical slices (tangential to pia) using a single glass electrode in each layer (thin-walled borosilicate tubes with filaments; World Precision Instruments) filled with a solution containing 150 mm NaCl or a standard artificial CSF (ACSF; tip resistance of 1–2 MΩ). Signals were acquired at 10 kHz (low pass at 5 kHz). Recordings were obtained at 36°C in standard ACSF perfusion (baseline), during kainate (50 nm) applications, and during kainate plus carbachol (50 μm) conditions. For each slice, a single 30 s region displaying the largest power increase during kainate plus carbachol conditions was analyzed. For consistency, this was the same 30 s region analyzed previously (Florez et al., 2013). All analyses were written in MATLAB (2012a; MathWorks) or C.
Line noise (60 Hz) and its harmonics were removed via notch filtering before additional analysis using a 10,000 order finite impulse response (FIR) constrained least-squares (MATLAB function fircls.m) band stop filter with frequency range of ±2 Hz around the stop band run forward and backward (MATLAB function filtfilt.m) to obviate phase distortions. Bandpass filtering was performed with 10,000 order FIR Chebyshev windowed filters (MATLAB function fir1.m) with 100 dB side lobe attenuation run forward and backward.
Signals were decomposed (to obtain instantaneous phase and amplitude estimates) by either wavelet transformation or Hilbert transformation of bandpass-filtered signals (Bruns, 2004). Phase coherence (PC) was computed over a 5 cycle window using a point-by-point sliding window, making the PC estimates frequency dependent.
Correlations between PAC and synchrony were assessed using two methods. The first method involved computing PAC using the modulation index (MI; Tort et al., 2010), which we have used previously (Florez et al., 2013). Synchrony between lamina was assessed by using phase-dependent power correlations (PDPCs) that captures the strength of amplitude correlations between two oscillations around their “good” phase, which is the circular mean of the phase difference between laminae over time (Womelsdorf et al., 2007). For both MI and PDPC, significance between conditions as a function of frequency was computed using the Wilcoxon's rank-sum test and false discovery rate (FDR) correction (Benjamini and Hochberg, 1995). We excluded points in which significance was found for only a single frequency with no adjacent significant values. Both PDPC and MI require populating phase bins, which affords poor temporal resolution and requires long data segments (Dvorak and Fenton, 2014). The metrics were thus computed using the entire 30 s segments to obtain estimates as a function of frequency. Slice-by-slice statistical significance was obtained for PDPC and MI using 200 surrogates. Surrogates were generated using phase randomization plus Gaussian rescaling (Theiler et al., 1992) to replace either the deep layer signal (PC, PDPC) or the low-frequency time series (MI). PDPC–MI Spearman's correlations were computed groupwise since only a single PDPC and MI value at each frequency was obtained per slice. The p values obtained from the correlation for each frequency were FDR corrected. In addition, 95% confidence limits for the PDPC–MI correlation were obtained using surrogates.
The second method used a more time-resolved estimate of PAC that was computed from the PC between the high-frequency envelope (60–300 Hz) and low-frequency time series (Cohen, 2008). The precise low-frequency range for bandpass filtering (filter specifications as above) on a slice-by-slice basis were obtained from the peaks in the power spectra (MATLAB function pmtm.m) using two tapers over 1 s non-overlapping intervals. Alternatively, to survey PAC across a 4–30 Hz range, PAC was estimated as the wavelet PC (Florez et al., 2013) between the high-frequency envelope (60–300 Hz) and low-frequency time series between 4 and 30 Hz in steps of 0.5 Hz. PC between laminae was computed using 0.5 Hz steps across the low-frequency band. Having obtained time series of PC, and PAC for each slice, to compute group-level PAC–PC correlations, time series estimates of PAC and PC estimates were averaged over 1 s non-overlapping segments obtaining 30 PAC and PC points per slice. These values were normalized by the maximum for that slice to remove artificially inflated group-level correlations that arise from slice variability and then pooled across slices. PAC–PC correlations were computed as the Spearman's rank correlation at each frequency. This was performed for both superficial and deep layers and for each experimental condition. Confidence intervals for the correlations were obtained via Fisher's z-transformation.
Results
Interlaminar coherence
We have shown previously that theta oscillations in human neocortical slices display a non-uniform phase difference between superficial and deep laminae (Florez et al., 2013). The mean of these phases was significantly different from zero, suggesting that theta oscillations coordinate superficial and deep layers through propagated activity (Fig. 1A). To explore this further, we computed PDPC (Womelsdorf et al., 2007), which quantify the strength of amplitude correlations near the good phase of two oscillations. PDPC as a test of CTC are reflective of the amount of spike train information (transfer entropy) carried between two brain regions (Buehlmann and Deco, 2010), thus providing a surrogate for coordinated spiking activity.
Figure 1.

Synchronization between cortical layers is maximal in the theta frequency range. A, PC between superficial and deep cortical layers. B, PDPC at the good phase as a function of time computed using 30 s windows with 20 s overlap. C, PDPC computed over the 30 s time window indicated by the dotted lines. Color scheme is as indicated in B; black lines indicate areas of significance determined via bootstrapping (α = 0.05; see Materials and Methods). D, Average PDPC across slices for the different experimental conditions. Bars above the graphs indicate significance between conditions (red indicates kainate plus carbachol > baseline; orange indicates kainate plus carbachol > kainate; green indicates kainate > baseline). K, Kainate; K + C, kainate plus carbachol.
Mirroring PC (Fig. 1A), when periods of increased PDPC arose, each was short lived, lasting on average 45 ± 7 s (average across all events and experiments) and coinciding qualitatively with periods of increased PC (Fig. 1B). Time-resolved plots of PDPC along the good phase, using 30 s windows with 20 s of overlap (Fig. 1B), revealed that increased PDPC was specific to the theta frequency range (Fig. 1B,C) and occurred in a statistically significant manner most consistently during kainate plus carbachol conditions (19 of 25 slices; Table 1). Nonparametric statistical tests comparing PDPC across experimental conditions were significant when comparing the kainate plus carbachol condition to baseline (9–12 Hz) but nonsignificant under correction for multiple comparisons (Fig. 1D).
Table 1.
Number of slices (25 total) displaying significant (surrogate statistics) increases in PDPC and PAC organized by metric and experimental condition
| Baseline | Kainate | Kainate and carbachol | |
|---|---|---|---|
| PDPC | 6 | 10 | 19 |
| Superficial PAC | 2 | 3 | 18 |
| Deep PAC | 0 | 5 | 18 |
These results suggest that both theta power and theta synchrony are related to one another between cortical laminae. At the population level, increases in theta power within the LFP may arise from increased synchrony and/or number of theta-generating elements (i.e., neurons or small circuits; Buzsáki et al., 2012) and possibly increased spiking (Reimann et al., 2013).
PAC
To directly assess inferences about increases in excitability from the PDPC observed at theta frequencies, we examined PAC within superficial and deep layers. Analogous to the PDPC analyses, when periods of PAC arose, each was short lived in both the superficial (58 ± 18 s) and deep (41 ± 11 s) layers (average across all events and experiments). Time-resolved analyses of MI revealed particularly strong PAC in the theta range, especially in the kainate plus carbachol condition (18 of 25 slices; Table 1).
For both layers, comparative statistics between conditions (Fig. 2C) revealed significant PAC between theta and gamma frequencies. Significance was found between kainate plus carbachol to baseline (superficial, 5–15 Hz; deep, 4–15 Hz) and kainate plus carbachol to kainate (superficial, 7–14 Hz). Of note was that the phase-modulating frequency at which PAC was maximal was within the theta frequency similar to PDPC, and the modulated frequency was broadband (60–300 Hz). Such high-frequency broadband power increases represent a combination of high-frequency oscillations and spectral leakage from spiking activity (Tort et al., 2013; Fig. 2C), suggesting that the PAC we observe here arises from local excitability modulations at theta frequencies.
Figure 2.
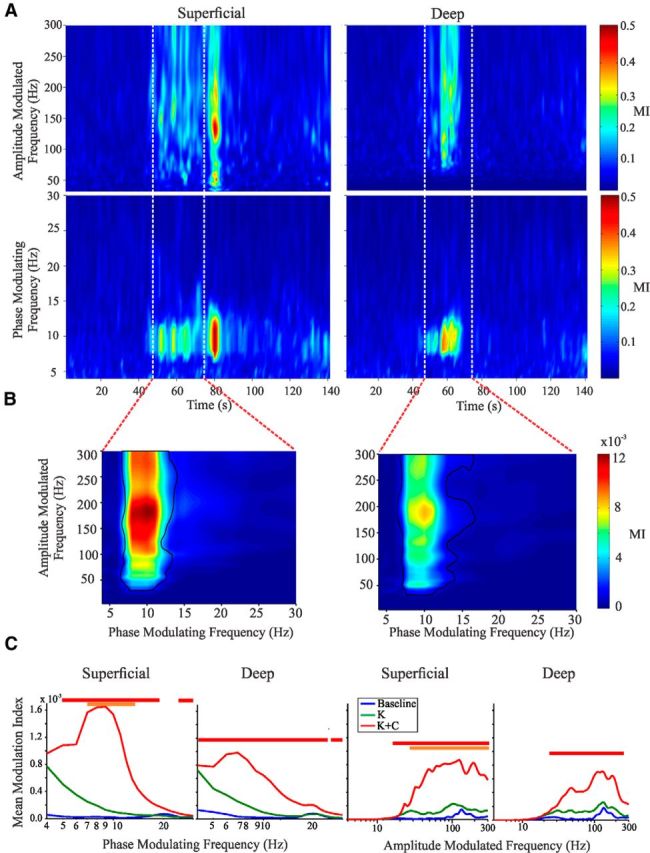
PAC waxes and wanes in superficial and deep cortical layers. A, Representative slice under kainate and carbachol conditions. Maximum values of MI for all amplitude-modulated frequencies (top figures) and phase-modulating frequencies (bottom figures) as a function of time, computed using 2 s windows with 1 s overlap. B, Full plots of MI for all phase-modulating and amplitude-modulated frequencies for the window of time indicated by the red lines in A; black lines indicate areas of significance determined via bootstrapping (α = 0.05). This 30 s window had been chosen previously for our primary analyses (Florez et al., 2013). C, Group statistics (see Materials and Methods) for MI comparing baseline, kainite, and kainite plus carbachol treatments. Lines above the graphs indicate significance (red indicates kainate plus carbachol > baseline; orange indicates kainate plus carbachol > kainate; green indicates kainate > baseline). K, Kainate; K + C, kainate plus carbachol.
PDPC and PAC correlations
From our results, it would appear that PAC can co-occur with PDPC (and PC), particularly within the theta frequency range (Table 2), with the temporal profiles of PDPC and PAC being similar. To quantify this apparent relationship between PDPC and PAC, we obtained PDPC and PAC estimates for each slice as a function of frequency by pooling the PDPC value at the good phase and the maximal PAC value for each phase-modulating frequency across slices (for schematic of analysis, see Fig. 3A). Two separate significance tests were performed on this correlation: (1) a direct test of significance of the Spearman's rank correlation; and (2) a bootstrapping test in which a phase-scrambled surrogate replaced the signal from the deep lamina. Significant correlation between PDPC and PAC was found in both layers (Fig. 3B) and primarily within the theta frequency range (the range of significant frequencies was between 4 and 12 Hz), although correlations were particularly consistent, significant, and strong in deep layers (Fig. 3B).
Table 2.
Number of slices (25 total) displaying significant increases (surrogate statistics) in both synchrony and PAC metrics organized by metric and experimental condition
| Baseline | Kainate | Kainate and carbachol | |
|---|---|---|---|
| PC–superficial PAC | 2 | 3 | 18 |
| PC–deep PAC | 0 | 2 | 16 |
| PDPC–superficial PAC | 2 | 5 | 18 |
| PDPC–deep PAC | 0 | 4 | 17 |
Figure 3.
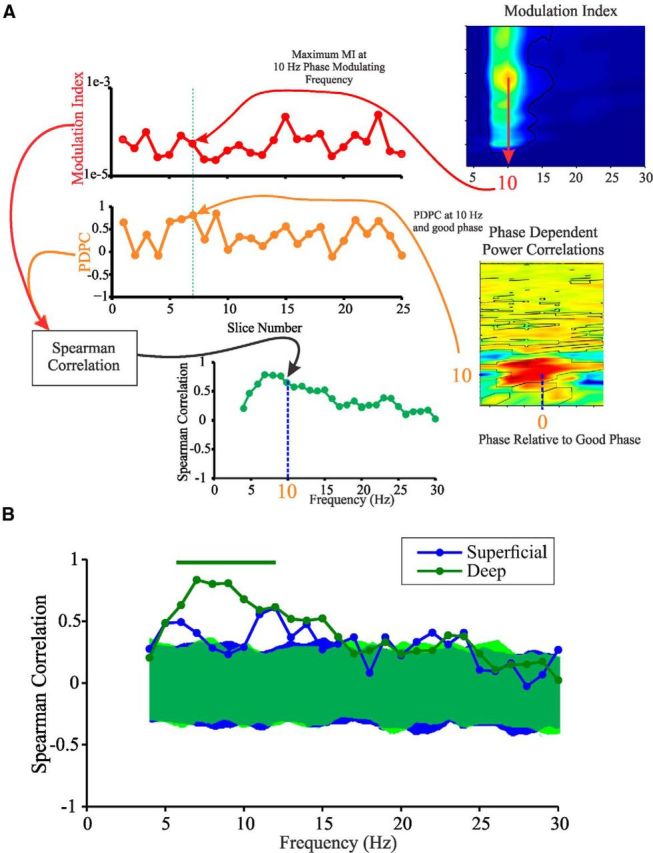
PDPC and MI are correlated at theta frequencies across slices. A, Schematic of the analysis for determining the correlation between PDPC and MI across slices. For each phase-modulating frequency and experimental condition, the maximal value of MI was found for each experimental trial and stored. The value of PDPC along the good phase was also stored for each frequency. A Spearman's rank correlation was then performed for the stored values for each frequency and experimental condition. The values of the Spearman's rank correlations were then plotted. B, Results of this analysis during kainate plus carbachol conditions. Bar above the plots indicates regions of significance for deep layers. Shaded regions in the plot indicate the 95% confidence intervals obtained from surrogate-generated correlation coefficient value distributions.
PC and PAC are correlated at short timescales
As is observed in vivo, PAC and synchrony waxed and waned (Figs. 1, 2) with time. However, since PDPC and MI were computed over long time windows, conclusions about the presence of PAC–synchrony correlations on a moment-to-moment basis are precluded. Thus, to assess whether PAC–synchrony correlations exist on shorter timescales, we utilized a second approach with better temporal resolution (Cohen, 2008). The transient nature of the theta oscillations is highlighted in Figure 4A, which also highlights the phase delay between layers, and high-frequency activity preceding the peak of the theta oscillations. These observations collectively argue against common reference, volume conduction, and filtering artifacts as confounds to interpreting the synchrony we observe, the PAC we compute (Kramer et al., 2008), and the correlations we elucidate between these two metrics.
Figure 4.
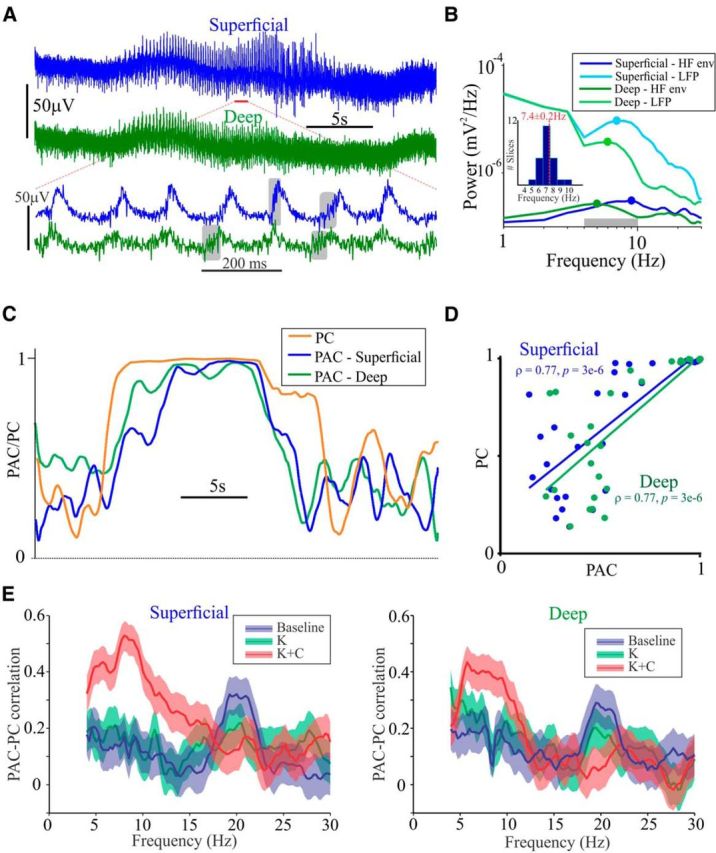
PAC and PC are correlated on a moment-to-moment basis. A, Exemplary 30 s of raw data displaying the waxing and waning in amplitude of cortical oscillations observed under kainate plus carbachol conditions. Below is an expanded region demarcated by the red bar. Gray boxes highlight some visually apparent examples of high-frequency activity. B, Power spectra of LFP and high-gamma envelope. The gray bar represents the frequency range over which PAC was estimated and equaled the minimum and maximum of these four values, −1 and +1 Hz, respectively. Inset plots the distribution of the average of this range computed analogously for each slice and associated mean ± SEM (red) of the group. Note that neither the peaks of the high-gamma envelopes were identical nor were the LFP for the deep and superficial layers. HF env, High-frequency envelope. C, PAC and PC values. Timescale is identical to top traces in A. D, Spearman's rank correlation between 1 s non-overlapping segments of PAC and PC for both superficial and deep cortical layers. A linear regression line is included for visualization only. E, Wavelet-based group statistics. PAC–PC correlations as a function of frequency plotted with 95% confidence intervals. K, Kainate; K + C, kainate plus carbachol.
For individual slices, power spectra of the LFP and the envelope of high-frequency activity (60–300 Hz) revealed peaks within the theta frequency range (Fig. 4B), albeit not precisely the same frequency between layers, or across signal sources (i.e., LFP vs high-frequency envelope). In this example, PAC was computed using a low-frequency range of 4–10 Hz that incorporated the peaks observed between 5 and 9 Hz in the power spectra (Fig. 4B), and demonstrated a marked temporal concordance with PC (Fig. 4C). This concordance was quantified using Spearman's rank correlation, which revealed significant correlations between PAC and PC in both superficial and deep layers (Fig. 4D).
Given the nonsimilarity of peak frequencies within the LFP and high-frequency envelope (Fig. 4B) and to determine the frequency specificity of the PAC–PC relationship, we surveyed across all potential frequencies between 4 and 30 Hz in 0.5 Hz steps. This revealed distinct peaks in correlation between PAC and PC within the theta frequency range in both superficial and deep cortical layers (Fig. 4E). In summary, the time-resolved PAC–PC correlations reveal a tight coupling between interlaminar theta synchrony and theta to high-gamma PAC in both superficial and deep cortical layers of human cortex.
Discussion
We extend our previous work to show that (1) theta to high-gamma PAC increases with increasing theta synchrony between cortical layers, (2) is most robustly observed during application of kainate plus carbachol, a time when theta oscillations are robustly generated, and (3) the correlations between PAC and synchrony are modulated on a moment-to-moment basis.
Our data represent a number of novel findings. First, PDPC to date have only been demonstrated at gamma frequencies (Womelsdorf et al., 2007). Modeling of this metric has revealed that information transfer (transfer entropy) is correlated to the strength of PDPC (Buehlmann and Deco, 2010), suggesting that the coherent theta oscillation we observe here may subserve information transfer between cortical laminae in vivo. Furthermore, axonal delays determine the strength, shape, and optimal frequency at which PDPC is operative (Eriksson et al., 2011), suggesting that a complex bilaminar theta resonant structural circuit motif (Womelsdorf et al., 2014) may underlie our observations. Such interlaminar interactions have been described for alpha oscillations within the occipital lobe (Bollimunta et al., 2008; Spaak et al., 2012), although the analogy to alpha activity in macaque inferotemporal cortex is likely more appropriate given its association with increased multiunit firing rather than inhibition (Mo et al., 2011). However, to address these commonalities, additional experimental delineation of “theta” versus “alpha” microcircuits in different brain regions and across species is required to go beyond frequency classification alone (Womelsdorf et al., 2014). Functionally, considering that superficial cortical layers represent the source of corticocortical projections (Douglas and Martin, 2004) and deep layers represent output to subcortical structures, theta oscillations may represent a mechanism for coordinating cortical output to cortical and subcortical targets.
Second, we demonstrate that two electrophysiological signatures of theta oscillations often considered separately—synchrony (Varela et al., 2001) and theta PAC to high-gamma (Canolty and Knight, 2010)—are related in magnitude within a cortical column. Recently, such “coordination through coherent phase–amplitude coupling” at theta and high-gamma frequencies has been demonstrated between rat cortex and striatum (von Nicolai et al., 2014). Our data are consistent with these findings and provide support for the suggestion that PAC–synchrony correlations may be a general mechanism for coordinating local to large-scale processing (von Nicolai et al., 2014). Furthermore, in light of the computer modeling performed by Buehlmann and Deco (2010) that revealed a causal link between spiking, PDPC, and information transfer, our data support a direct linkage between synchrony and spike train information provided that the high-gamma we observe here is considered a surrogate for spiking activity (Buzsáki et al., 2012; Tort et al., 2013).
The waxing and waning of both synchrony and PAC in a correlated manner suggests that flexible formation and dissolution of oscillatory cell assemblies is a prerequisite for dynamically routing information within and between circuits and for input selection (Womelsdorf et al., 2014). Interestingly, unlike the MI–PDPC correlations, which appeared most robustly in deep layers, our more temporally resolved correlation analyses revealed PAC–PC correlations in both layers. This may have been attributable to how the different synchrony and PAC metrics were computed or that the correlations were obtained at different temporal scales.
A dynamic circuit motif (Womelsdorf et al., 2014) to explain our findings would be predicated on inferring that the high-gamma we observe here reflects increased spike rates/coherence (Ray et al., 2008; Manning et al., 2009; Buzsáki et al., 2012; Scheffer-Teixeira et al., 2013), in addition to the postsynaptic potentials they beget (Miller, 2010). Interlaminar correlations between synchrony and PAC may thus be explained by the dominant role that deep layer neurons play in driving superficial layer excitability (Beltramo et al., 2013). Such deep layer excitability manifests as theta to high-gamma PAC, which drives the superficial layer manifesting as heightened interlaminar theta power, phase correlations, and superficial layer PAC. The increased PAC in both layers drives an intrinsically theta-resonant circuit toward increased temporal synchrony with waxing and waning periods of increased spiking maintaining the coordination. Although the specific cellular substrates, synaptic connectivity, and directionalities of communication that underlie such coordination through coherent PAC remains to be elucidated in both the human and murine brain (von Nicolai et al., 2014), our data suggest that this mechanism may be conserved across species and brain structures.
Footnotes
This work was supported by the Canadian Institutes of Health Research. We thank T. Womelsdorf for insightful discussions regarding the manuscript.
The authors declare no conflicts of interest.
References
- Beltramo R, D'Urso G, Dal Maschio M, Farisello P, Bovetti S, Clovis Y, Lassi G, Tucci V, De Pietri Tonelli D, Fellin T. Layer-specific excitatory circuits differentially control recurrent network dynamics in the neocortex. Nat Neurosci. 2013;16:227–234. doi: 10.1038/nn.3306. [DOI] [PubMed] [Google Scholar]
- Benjamini Y, Hochberg Y. Controlling the false discovery rate: a practical and powerful approach to multiple testing. J R Stat Soc B. 1995;57:289–300. [Google Scholar]
- Bollimunta A, Chen Y, Schroeder CE, Ding M. Neuronal mechanisms of cortical alpha oscillations in awake-behaving macaques. J Neurosci. 2008;28:9976–9988. doi: 10.1523/JNEUROSCI.2699-08.2008. [DOI] [PMC free article] [PubMed] [Google Scholar]
- Bruns A. Fourier-, Hilbert- and wavelet-based signal analysis: are they really different approaches? J Neurosci Methods. 2004;137:321–332. doi: 10.1016/j.jneumeth.2004.03.002. [DOI] [PubMed] [Google Scholar]
- Buehlmann A, Deco G. Optimal information transfer in the cortex through synchronization. PLoS Comput Biol. 2010;6:e1000934. doi: 10.1371/journal.pcbi.1000934. pii. [DOI] [PMC free article] [PubMed] [Google Scholar]
- Buzsáki G, Wang XJ. Mechanisms of gamma oscillations. Annu Rev Neurosci. 2012;35:203–225. doi: 10.1146/annurev-neuro-062111-150444. [DOI] [PMC free article] [PubMed] [Google Scholar]
- Buzsáki G, Anastassiou CA, Koch C. The origin of extracellular fields and currents—EEG, ECoG, LFP and spikes. Nat Rev Neurosci. 2012;13:407–420. doi: 10.1038/nrn3241. [DOI] [PMC free article] [PubMed] [Google Scholar]
- Canolty RT, Knight RT. The functional role of cross-frequency coupling. Trends Cogn Sci. 2010;14:506–515. doi: 10.1016/j.tics.2010.09.001. [DOI] [PMC free article] [PubMed] [Google Scholar]
- Canolty RT, Edwards E, Dalal SS, Soltani M, Nagarajan SS, Kirsch HE, Berger MS, Barbaro NM, Knight RT. High gamma power is phase-locked to theta oscillations in human neocortex. Science. 2006;313:1626–1628. doi: 10.1126/science.1128115. [DOI] [PMC free article] [PubMed] [Google Scholar]
- Carracedo LM, Kjeldsen H, Cunnington L, Jenkins A, Schofield I, Cunningham MO, Davies CH, Traub RD, Whittington MA. A neocortical delta rhythm facilitates reciprocal interlaminar interactions via nested theta rhythms. J Neurosci. 2013;33:10750–10761. doi: 10.1523/JNEUROSCI.0735-13.2013. [DOI] [PMC free article] [PubMed] [Google Scholar]
- Cohen MX. Assessing transient cross-frequency coupling in EEG data. J Neurosci Methods. 2008;168:494–499. doi: 10.1016/j.jneumeth.2007.10.012. [DOI] [PubMed] [Google Scholar]
- Douglas RJ, Martin KA. Neuronal circuits of the neocortex. Annu Rev Neurosci. 2004;27:419–451. doi: 10.1146/annurev.neuro.27.070203.144152. [DOI] [PubMed] [Google Scholar]
- Dvorak D, Fenton AA. Toward a proper estimation of phase-amplitude coupling in neural oscillations. J Neurosci Methods. 2014;225:42–56. doi: 10.1016/j.jneumeth.2014.01.002. [DOI] [PMC free article] [PubMed] [Google Scholar]
- Eriksson D, Vicente R, Schmidt K. A linear model of phase-dependent power correlations in neuronal oscillations. Front Comput Neurosci. 2011;5:34. doi: 10.3389/fncom.2011.00034. [DOI] [PMC free article] [PubMed] [Google Scholar]
- Florez CM, McGinn RJ, Lukankin V, Marwa I, Sugumar S, Dian J, Hazrati LN, Carlen PL, Zhang L, Valiante TA. In vitro recordings of human neocortical oscillations. Cereb Cortex. 2013 doi: 10.1093/cercor/bht235. doi: 10.1093/cercor/bht235. Advance online publication. Retrieved October 22, 2014. [DOI] [PubMed] [Google Scholar]
- Fries P. A mechanism for cognitive dynamics: neuronal communication through neuronal coherence. Trends Cogn Sci. 2005;9:474–480. doi: 10.1016/j.tics.2005.08.011. [DOI] [PubMed] [Google Scholar]
- Köhling R, Avoli M. Methodological approaches to exploring epileptic disorders in the human brain in vitro. J Neurosci Methods. 2006;155:1–19. doi: 10.1016/j.jneumeth.2006.04.009. [DOI] [PubMed] [Google Scholar]
- Kramer MA, Tort AB, Kopell NJ. Sharp edge artifacts and spurious coupling in EEG frequency comodulation measures. J Neurosci Methods. 2008;170:352–357. doi: 10.1016/j.jneumeth.2008.01.020. [DOI] [PubMed] [Google Scholar]
- Manning JR, Jacobs J, Fried I, Kahana MJ. Broadband shifts in local field potential power spectra are correlated with single-neuron spiking in humans. J Neurosci. 2009;29:13613–13620. doi: 10.1523/JNEUROSCI.2041-09.2009. [DOI] [PMC free article] [PubMed] [Google Scholar]
- Miller KJ. Broadband spectral change: evidence for a macroscale correlate of population firing rate? J Neurosci. 2010;30:6477–6479. doi: 10.1523/JNEUROSCI.6401-09.2010. [DOI] [PMC free article] [PubMed] [Google Scholar]
- Mo J, Schroeder CE, Ding M. Attentional modulation of alpha oscillations in macaque inferotemporal cortex. J Neurosci. 2011;31:878–882. doi: 10.1523/JNEUROSCI.5295-10.2011. [DOI] [PMC free article] [PubMed] [Google Scholar]
- Ray S, Crone NE, Niebur E, Franaszczuk PJ, Hsiao SS. Neural correlates of high-gamma oscillations (60–200 Hz) in macaque local field potentials and their potential implications in electrocorticography. J Neurosci. 2008;28:11526–11536. doi: 10.1523/JNEUROSCI.2848-08.2008. [DOI] [PMC free article] [PubMed] [Google Scholar]
- Reimann MW, Anastassiou CA, Perin R, Hill SL, Markram H, Koch C. A biophysically detailed model of neocortical local field potentials predicts the critical role of active membrane currents. Neuron. 2013;79:375–390. doi: 10.1016/j.neuron.2013.05.023. [DOI] [PMC free article] [PubMed] [Google Scholar]
- Scheffer-Teixeira R, Belchior H, Leão RN, Ribeiro S, Tort AB. On high-frequency field oscillations (>100 Hz) and the spectral leakage of spiking activity. J Neurosci. 2013;33:1535–1539. doi: 10.1523/JNEUROSCI.4217-12.2013. [DOI] [PMC free article] [PubMed] [Google Scholar]
- Siegel M, Donner TH, Engel AK. Spectral fingerprints of large-scale neuronal interactions. Nat Rev Neurosci. 2012;13:121–134. doi: 10.1038/nrn3137. [DOI] [PubMed] [Google Scholar]
- Spaak E, Bonnefond M, Maier A, Leopold DA, Jensen O. Layer-specific entrainment of gamma-band neural activity by the alpha rhythm in monkey visual cortex. Curr Biol. 2012;22:2313–2318. doi: 10.1016/j.cub.2012.10.020. [DOI] [PMC free article] [PubMed] [Google Scholar]
- Theiler J, Eubank S, Longtin A, Galdrikian B, Doyne Farmer J. Testing for nonlinearity in time series: the method of surrogate data. Nonlinear Phenomena. 1992;58:77–94. [Google Scholar]
- Tort AB, Komorowski R, Eichenbaum H, Kopell N. Measuring phase-amplitude coupling between neuronal oscillations of different frequencies. J Neurophysiol. 2010;104:1195–1210. doi: 10.1152/jn.00106.2010. [DOI] [PMC free article] [PubMed] [Google Scholar]
- Tort AB, Scheffer-Teixeira R, Souza BC, Draguhn A, Brankačk J. Theta-associated high-frequency oscillations (110–160 Hz) in the hippocampus and neocortex. Prog Neurobiol. 2013;100:1–14. doi: 10.1016/j.pneurobio.2012.09.002. [DOI] [PubMed] [Google Scholar]
- Varela F, Lachaux JP, Rodriguez E, Martinerie J. The brainweb: phase synchronization and large-scale integration. Nat Rev Neurosci. 2001;2:229–239. doi: 10.1038/35067550. [DOI] [PubMed] [Google Scholar]
- von Nicolai C, Engler G, Sharott A, Engel AK, Moll CK, Siegel M. Corticostriatal coordination through coherent phase-amplitude coupling. J Neurosci. 2014;34:5938–5948. doi: 10.1523/JNEUROSCI.5007-13.2014. [DOI] [PMC free article] [PubMed] [Google Scholar]
- Womelsdorf T, Schoffelen JM, Oostenveld R, Singer W, Desimone R, Engel AK, Fries P. Modulation of neuronal interactions through neuronal synchronization. Science. 2007;316:1609–1612. doi: 10.1126/science.1139597. [DOI] [PubMed] [Google Scholar]
- Womelsdorf T, Vinck M, Leung LS, Everling S. Selective theta-synchronization of choice-relevant information subserves goal-directed behavior. Front Hum Neurosci. 2010;4:210. doi: 10.3389/fnhum.2010.00210. [DOI] [PMC free article] [PubMed] [Google Scholar]
- Womelsdorf T, Valiante TA, Sahin NT, Miller KJ, Tiesinga P. Dynamic circuit motifs underlying rhythmic gain control, gating and integration. Nat Neurosci. 2014;17:1031–1039. doi: 10.1038/nn.3764. [DOI] [PubMed] [Google Scholar]