

Abstract
Transgenic mice expressing genetically encoded activity indicators are an attractive means of mapping mesoscopic regional functional cortical connectivity given widespread stable and cell-specific expression compatible with chronic recordings. Cortical functional connectivity was evaluated using wide-field imaging in lightly anesthetized Emx1-creXRosa26-GCaMP3 mice expressing calcium sensor in cortical neurons. Challenges exist because green fluorescence signals overlap with endogenous activity-dependent autofluorescence and are affected by changes in blood volume and oxygenation. Under the conditions used for imaging and analysis (0.1–1 Hz frequency band), autofluorescence and hemodynamic effects contributed 3% and 8% of the SD of spontaneous activity-dependent GCaMP3 fluorescence when signals were recorded through intact bone. To evaluate the accuracy and sensitivity of this approach, the topology of functional connections between somatomotor cortex (primary S1 and secondary S2 somatosensory, and primary motor cortex M1) was estimated. During sequences of spontaneous activity, calcium signals recorded at each location of area S1 were correlated with activity in contralateral area S1, ipsilateral area S2, and bilateral areas M1. Reciprocal results were observed when “seed pixels” were placed in S2 and M1. Coactivation of areas implies functional connections but could also be attributed to both regions receiving common upstream drive. These apparent connections revealed during spontaneous activity coactivation by GCaMP3 were confirmed by intracortical microstimulation but were more difficult to detect using intrinsic signals from reflected red light. We anticipate GCAMP wide-field imaging will enable longitudinal studies during plasticity paradigms or after models of CNS disease, such as stroke, where the weighting within these connectivity maps may be altered.
Keywords: connectome, cortical stimulation, optogenetic, resting state, tracing, transgenic mice
Introduction
To understand how information is processed and distributed between distant areas of mouse cortex, wide-field functional in vivo imaging approaches have been used (Grinvald and Hildesheim, 2004; Vanzetta and Grinvald, 2008; Homma et al., 2009; Grienberger and Konnerth, 2012; Knöpfel, 2012; Minderer et al., 2012; Stroh et al., 2012). While intrinsic optical signal imaging (IOS) can map the spatial organization of sensory inputs (Shmuel and Grinvald, 1996; Zepeda et al., 2004; Vanzetta and Grinvald, 2008; White et al., 2011), its sensitivity may be too low to accurately observe remote activity in connected regions during spontaneous activity. During the last decade, the emergence of high resolution and sensitive approaches, such as voltage sensitive dye (VSD) imaging, has enabled the elucidation of wide scale networks (Shoham et al., 1999; Grinvald and Hildesheim, 2004; Ferezou et al., 2007; Aronoff et al., 2010). However, this technique employing organic dye lacks cellular specificity and cannot be used for longitudinal studies. Protein-based voltage sensors are an exciting alternative (Knöpfel, 2012; Perron et al., 2012), offering cell-specific targeting and longitudinal assessment but are not widely available as transgenic mice.
Genetically encoded calcium indicators (GECIs) were successfully used to record responses within somatosensory and visual cortex of mice through chronic windows (Andermann et al., 2011; Grienberger and Konnerth, 2012; Minderer et al., 2012). However, AAV-viral vectors previously used were restricted to narrow spatial scales given the limited area covered by vector injections and issues with protein expression in some long-term studies (Zariwala et al., 2012). An alternative strategy is to use transgenic mice, such as the cross between Emx1-cre and Rosa26-GCaMP3 lines (termed “Emx-GCaMP” subsequently) that stably expresses the GCaMP3 within cells of the entire cerebral cortex (Ackman et al., 2012; Zariwala et al., 2012; ABI Mouse Connectivity, 2014). However, most single wavelength protein sensors of activity involve assessment of green fluorescence, which is contaminated by changes in autofluorescence (Shibuki et al., 2003; Coutinho et al., 2004; Murakami et al., 2004; Husson et al., 2007), blood volume (Frostig et al., 1990; Sirotin and Das, 2010), and oxygenation.
The goal of this work was to establish methodology for reliable wide-scale calcium imaging appropriate for regional mouse brain mapping with current and future mouse lines. Indeed, compared with VSD or IOS, calcium responses from Emx-GCaMP mice are enriched in neurons and sensitive enough to map the long-range connections. Long-range functional connections between areas of the somatomotor cortex (area S1, S2, and M1) were mapped by recording wide-field calcium responses during spontaneous activity through giant brain windows (Mohajerani et al., 2013) or intact bone (Hira et al., 2009; Silasi et al., 2013; Guo et al., 2014). Our results show that neuronal activity of each location of somatomotor cortex was associated with localized activity in distant connected regions of the same hemisphere, as well as within the opposite hemisphere. A key aspect of this approach is the large number of locations that can be investigated to reveal the spatial pattern of long-range connections within both acute and chronic studies.
Materials and Methods
Emx-GCaMP mice.
All procedures were approved by the University of British Columbia Animal Care Committee and conformed to the Canadian Council on Animal Care and Use guidelines. “Emx-GCaMP” animals of either sex (n = 21) were produced by crossing homozygous B6.129S2-Emx1tm1(cre)Krj/J strain (Jax no. 005628) with hemizygous B6;129S-Gt(ROSA)26Sortm38(CAG-GCaMP3)Hze/J strain (Jax no. 014538, Ai38) (Ackman et al., 2012; Zariwala et al., 2012). The presence of GCaMP3 expression was determined by genotyping each animal before each surgical procedure with PCR amplification of a 546 bp fragment (forward primer: 5′-CTT CAA GAT CCG CCA CAA CAT CG-3′; reverse primer, 5′-TTG AAG AAG ATG GTG CGC TCC TG-3′). This crossing is expected to produce a stable expression of GCaMP3 (Tian et al., 2009) within all excitatory neurons and glial cells across all layers of the cortex, but not in GABAergic neurons (Gorski et al., 2002; Kummer et al., 2012).
Surgical procedure and anesthesia.
To implant chronic windows, animals were anesthetized with isoflurane (2% in pure O2) and the body temperature was maintained at 37°C using a feedback-regulated heating pad monitored by a rectal thermometer. Mice received an intramuscular injection of 40 μl of dexamethasone (2 mg/ml) and a 0.5 ml subcutaneous injection of a saline solution containing burprenorphine (2 μg/ml), atropine (3 μg/ml), and glucose (20 mm) and were placed in a stereotaxic frame. After locally anesthetizing the scalp with lidocaine (0.1 ml, 0.2%), the skin covering the skull was removed and replaced by transparent dental cement and a glass coverslip (see Fig. 1D) (Silasi et al., 2013). A metal screw was attached to the chamber for future head fixation during recordings. At the end of the procedure, the animal received a second SC injection of saline (0.5 ml) with 20 mm of glucose and recovered in a warmed cage in pure O2 for 30 min. For subsequent chronic recordings, animals were anesthetized with isoflurane (1%–1.2%) to produce a constant level of activity, and the head was stabilized by attaching the screw to a pole mounted on a base-plate. The body temperature was maintained, and hydration was ensured by subcutaneous injection of saline (0.5 ml) with 20 mm of glucose at 2 h intervals.
Figure 1.

Cortical expression in Emx-GCaMP mice and chronic window. A, Cortical expression of GCaMP3 gene (in situ hybridization) in Emx-GCaMP animals. These data were collected for the experiment #100132540 of the Allen Brain Institute (Brain Atlas, Transgenic characterization: http://connectivity.brain-map.org/transgenic/experiment/100132540). B, In vivo two photon microscopy of the SR101 (top left) and GCaMP3 (top right) expression in cortex of Emx-GCaMP mice (excitation: 920 nm; depth: 120 μm). The imaging procedure was similar to those used in our previous studies (Winship et al., 2007). Bottom, SR101 (red) and GCaMP3 (green) expression merged and profile of the GCaMP3 against the SR101 expression. C, Left, Postmortem confocal microscopy of GCaMP3 fluorescence in cortical slices. Middle, Immunochemistry of rabbit antibodies to S100β revealed with Texas-RED-tagged secondary antibodies. Right, Merged images. The red and green arrows indicate a S100β positive/GCaMP3 negative cell and a S100β negative/GCaMP3 positive cell, respectively. D, Diagram of the chronic window implant in a sagittal (left) and coronal section (middle) of the head. Right, Diagram of the brain area exposed by the window.
For acute experiments, animals were anesthetized with isoflurane, placed in a stereotaxic frame, and the scalp was removed similarly than for chronic window implantation. Then, a custom-made stainless steel head-plate was adhered to the skull using dental cement and was connected with tubing to a water pump, which circulated temperature-controlled warmed water. A large bilateral or unilateral cranial window covering multiple cortical areas was made (Brown et al., 2009; Mohajerani et al., 2010, 2011, 2013; Lim et al., 2012). The cortex was covered with HEPES-buffered artificial CSF with low-melt agarose dissolved in (1.3%) and sealed with a glass coverslip (see Fig. 4A). During recording, the anesthesia was lowered (1%–1.5%), and the body temperature and hydration were maintained. At the end of each acute experiment, animals were killed with an intraperitoneal injection of pentobarbital (24 mg).
Figure 4.
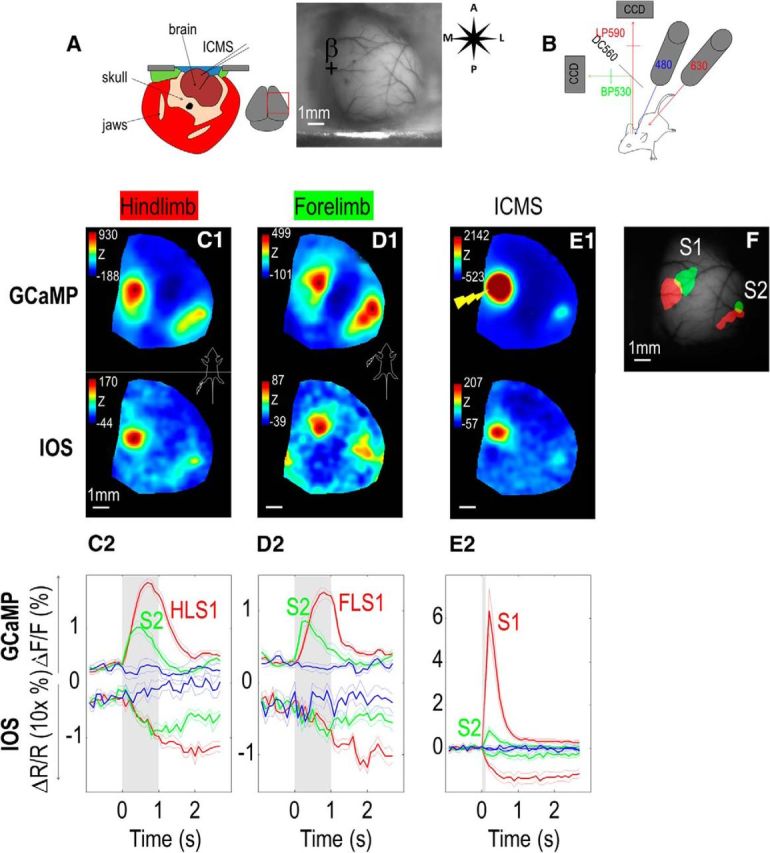
Sensory response recorded through an acute unilateral craniotomy. A, Diagram of the acute craniotomy in a coronal section of the head and green reflectance image. B, Diagram of the dual calcium/IOS imaging setup. Red (630 nm) and blue (480 nm) LEDs were used to illuminate the cortex. Collected light passed through a 560 dichroic filter. Green fluorescence was then filtered with a bandpass green filter (530 nm), whereas the IOS signal was filtered with a long pass red filter (590 nm). C1, Calcium and IOS responses (Z-score) for hindlimb stimulation (1 s train of 1 ms pulses, 100 Hz). C2, Temporal profile of calcium fluorescence and IOS signal (expanded 10× for a better comparison with calcium signal profile) in ROI within the contralateral HLS1 (red represents with stimulation; blue represents without stimulation) and S2 (green). D, Same as in C, response and temporal profile for forelimb stimulation. E, Same as in C, D, response and temporal profile for ICMS within area S1 (100 ms train of 0.1 ms × 100 μA electric pulses, 400 Hz). F, Location of calcium responses for hindlimb (red) and forelimb (green) stimulation overlaid on the basal GCaMP fluorescence.
Stimulation and recordings.
Images of the cortical surface were recorded through a pair of back-to-back photographic lenses (50 mm, 1.4 f:135 mm, 2.8 f or 50 mm, 1.4 f:30 mm, 2 f) coupled to a 1M60 Pantera CCD camera (Dalsa). To visualize the cortex and vasculature, the surface of the brain was illuminated with green light. Calcium indicators were excited with blue-light-emitting diodes (Luxeon, 470 nm) with bandpass filters (467–499 nm). Emission fluorescence was filtered using a 510–550 nm bandpass filter. For dual calcium/IOS recordings, a second red-light-emitting diode (Luxeon, 627 nm) and bandpass filter (620–650 nm) were used for illumination while the emission light path of was split with a dichroic mirror (cutoff = 560 nm) to a second similar CCD camera (see Fig. 4A). IOS signal reflectance was filtered using a 590 nm long pass filter. We collected 12-bit images at varying time resolution (6.66–100 ms; i.e., 10–150 Hz) using XCAP imaging software. When collecting somatosensory-evoked cortical activity, we used either electrical stimulation delivered through two metal pins inserted subcutaneously (for limb stimulation only) or piezoelectric bending actuators touching the skin of limb or individual or multiple whiskers. Intracortical electrical stimulations were applied to superficial layers of cortex during acute experiments only, with a 0.1 mΩ unipolar tungsten electrode. In recordings performed on acute preparations, acquisition of each trial was triggered by the electrocardiogram using a window discriminator. To isolate stimulus-related signals, alternate heartbeat-triggered recordings were acquired with and without stimulation. Each run consisted of 20 trials separated by a 10 s interval.
Analysis.
To remove the contribution of global and illumination fluctuations, raw data were corrected for each pixel (i,j) with the following:
 |
Where Ri,j,f and Rci,j,f are the raw and corrected fluorescence sequences, respectively. Tf is the global activity time course over the whole ROI, defined as follows:
 |
where x, y, X, and Y are the position and the size of the ROI. Si,j is the map of fluorescence value, defined as follows:
 |
and R̄ is the fluorescence average value defined as follows:
 |
where F is the number of frames.
To calculate the calcium response evoked by stimulation, images collected from the 20 trials were averaged and the normalized difference to the average baseline recorded before stimulation was calculated (ΔF/F). Then, the maximum response after the stimulation was calculated for sensory or cortical stimulation. To improve the reliability of mapping, Z-score was also used (Gias et al., 2005). The signal-to-noise ratio (SNR, calculated on averaged responses as well as on individual trials) of local and remote activation was calculated by measuring the ratio between the maximum response after stimulation (max(Sstim)) and the standard deviation of the signal before the stimulation (σ(Spre)):
 |
The onset of response was defined as the time where signal cross a threshold corresponding to 2× σ(Spre).
Spontaneous activity recording sequences were temporally pass-band filtered (0.1–1 Hz). To create seed pixel correlation map, the cross-correlation coefficient r values between the temporal profiles of one selected pixel and all the others of the ROI were calculated (White et al., 2011; Mohajerani et al., 2013). For every map presented, spatial smoothing (σ = 67–200 μm) was applied to improve contrast. To evaluate the consistency of mapping as a function of recording parameters, seed pixel correlation maps (for different recording session, temporal filtering, or duration) or sensory maps (for different recording session) were compared with a reference sensory map by calculating the error:
 |
where N is the number of pixels in the ROI, T is the seed pixel correlation or sensory map tested, and R is the reference sensory map after matching their normalized gray level distribution (histogram matching).
Results
Emx-GCaMP mouse characterization
Examination of Emx1-cre distribution based on data from the Allen Institute supported a widespread and relatively homogeneous distribution of cre across cortex (Fig. 1A). In vivo two-photon microscopy within these mice did not reveal a stronger expression of cre-dependent GCAMP3 within astrocytes, as examined using SR101 labeling (Nimmerjahn et al., 2004) (Fig. 1B). This observation was confirmed by postmortem immunochemistry showing that cells expressing high green fluorescence (GCAMP positive) were generally negative for S100β, a specific marker of astrocytes and oligodendrocytes (Hachem et al., 2005; Grosche et al., 2013) (Fig. 1C, green and red arrows). Moreover, because most astrocytes are expected to respond with slower kinetics than neurons (Winship et al., 2007; Schummers et al., 2008), the relatively fast responses presented here should be minimally affected by any residual glial signals similar to voltage-sensitive dye recordings where dye labeling is not cell-specific, but rapid signals largely reflect neuronal activity. Although this Emx1 promoter could be associated with off-target effects listed above, it leads to widespread and stable expression of the cre-recombinase and was chosen for this reason in the present study. However, in the future, more specific promoters, such as CamK2a (sparse expression in excitatory neurons) or Wfs1 (sparse expression in superficial layers), could be used (Madisen et al., 2010; Zariwala et al., 2012).
Sensory mapping in Emx-GCaMP mice through an intact skull chronic window
To record GCaMP3 fluorescence over several 10s of millimeters squared with minimal invasiveness, the skin over the skull was removed and replaced by transparent dental cement and a coverslip on the intact skull (Hira et al., 2009; Silasi et al., 2013; Guo et al., 2014), resulting in an 8 mm field of view through intact bone (Fig. 1D; and see Materials and Methods). To our knowledge, this is the largest chronic imaging chamber used for functional imaging of recombinant sensors in mice, and this approach allows longitudinal recording from both hemispheres over multiple months with a spatial resolution capable of resolving mesoscopic intracortical interactions. In the present study, all recordings were performed under light isoflurane anesthesia to collect a constant and reproducible level of neuronal activity. These conditions also facilitated the delivery of somatosensory stimulation and reduced movement artifacts caused by voluntary behavior. However, although awake and anesthetized states are expected to result in different forms of neuronal activity (Haider et al., 2013), previous work from our laboratory using VSD reported that the major cortical circuits were similar (Mohajerani et al., 2010, 2013). In the majority of the experiments, the stimulation of hindlimb (HL), forelimb (FL), or whiskers (WS) produced very well-restricted peak activation in the presumed contralateral area S1 in averaged records of evoked activity (Fig. 2A–D; Table 1). In some experiments, we also were able to observe a delayed ipsilateral S1 activation following stimulation of the contralateral paw (Fig. 2B,C; Table 1). During WS stimulation, remote delayed activations were observed within area M1 (Fig. 2D; Table 1). By combining the threshold responses of HL (red), FL (green), and WS (blue) stimulation, it was possible to reveal limited overlap between each activated region, as well as their cortical somatotopy within area S1 (Fig. 2E). Most of the experiments were recorded at 10 frames/s, but some controls were also performed at faster frame rate up to 150 frames/s (Fig. 2F). At higher frame rate, single trial recordings were strongly contaminated by heartbeat artifacts (6–8 Hz, black curve) that were partially removed by averaging (red and blue curves) or doing other processing steps. Other measures, such as bandpass filtering, also reduced the contribution of heartbeat artifacts. To further reduce these artifacts present during high-speed recording, different approaches exist, such as reflectance correction (Sirotin and Das, 2010), the use of FRET indicators such as the calcium sensor YC360 (Minderer et al., 2012), or the voltage sensor VSFP-Butterfly (Akemann et al., 2012), which, by design, are the most appropriate for artifact removal. Nevertheless, as presented later (see Fig. 6D), the mapping components observed during spontaneous activity in Emx-GCaMP mice were mainly located below 1 Hz, well away from the heartbeat contamination.
Figure 2.
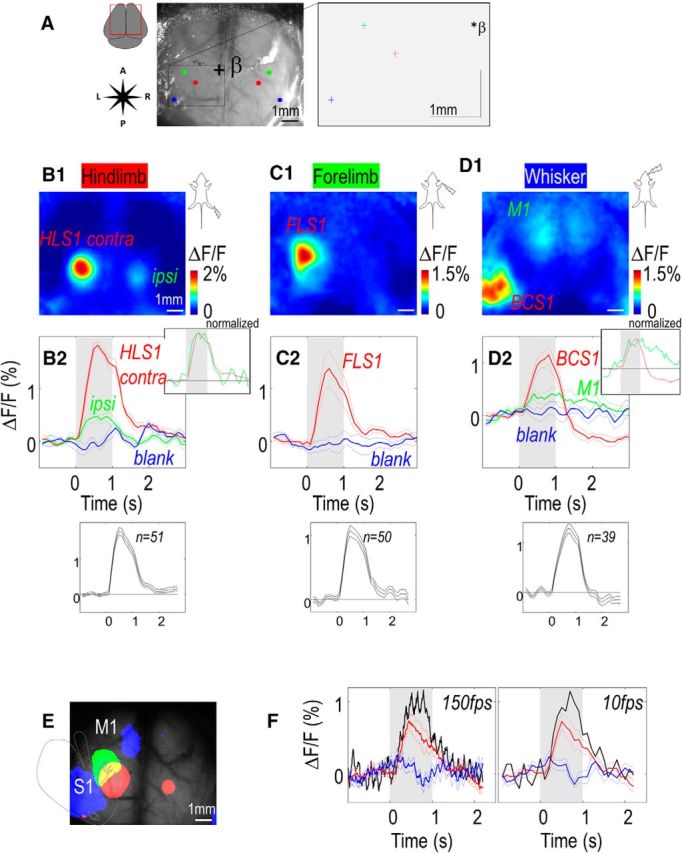
Sensory response recorded through a bilateral chronic window. A, Left, Green reflectance image. β indicates bregma. Colored circle represents locations of activations for HL, FL, and WS piezo-stimulation (1 s train of 1 ms pulses, 100 Hz). Right, Locations of activations (with x and y, SEM) relative to bregma. B1, Response (maximum ΔF/F) for hindlimb stimulation. Right upper box represents normalized curves. Right bottom box represents averaged value of all animals. B2, Thick line indicates profile of fluorescence in ROI within the contralateral HLS1 (red represents with stimulation; blue represents without stimulation) and ipsilateral S1 (green). Thin line indicates SEM. Gray background represents the window of stimulation. C, Response and profile for forelimb stimulation. D, Response and profile for whisker stimulation within the contralateral barrel cortex (BCS1; red represents with stimulation; blue represents without stimulation) and area M1 (green). In this example, stimulation was performed using piezo-stimulator touching a group of whiskers. Following the large positive responses were a >2 s undershoot (ΔF/F = −0.15 ± 0.06% for WS, 0.12 ± 0.05% for HL, and 0.09 ± 0.05% for FL stimulation) that could be attributed to either changes in cerebral blood volume or delayed inhibition. The undershoot was only consistently observed with WS stimulation and did not affect our mapping because it is based on relatively faster fluorescence changes. E, Location of responses for hindlimb (red), forelimb (green), and whisker stimulation (blue) overlaid on the basal GCaMP fluorescence. Gray dotted line indicates the putative homunculus (somatotopy) in left area S1. F, Profile of fluorescence for FL stimulation in another experiment (red represents with stimulation; blue represents without stimulation) presented for two different frame rates (left, 150 Hz; right, 10 Hz). Thick black line indicates single trial response.
Table 1.
Positions of contralateral sensory responses (relative to bregma ± SEM), amplitudes, onsets of responses, and SNR to different sensory and cortical stimulations. Ipsilateral and contralateral long-range responses are calculated relatively to the local responses. Values in parentheses are the numbers of experiments
| Category | HL (17 mice) | FL (15 mice) | WS (7 mice) | ICMS | |
|---|---|---|---|---|---|
| Contralateral responses | Lateral (mm) | 1.92 ± 0.06 (51) | 2.56 ± 0.06 (50) | 3.19 ± 0.06 (39) | — |
| Anterior (mm) | −0.55 ± 0.07 (51) | 0.05 ± 0.07 (50) | −1.54 ± 0.07 (39) | — | |
| Calcium ΔF/F (%) | 1.95 ± 0.1 (51) | 1.31 ± 0.07 (50) | 1.49 ± 0.1 (39) | — | |
| Calcium SNR | 9.2 ± 0.7 (51) | 6.7 ± 0.6 (50) | — | 65.5 ± 7.4 (37) | |
| Calcium SNR (single sweep) | 4.8 ± 0.2 (51) | 3.9 ± 0.2 (50) | — | 22.3 ± 1.9 (37) | |
| Calcium onset (s) | 0.22 ± 0.01 (49) | 0.34 ± 0.04 (50) | 0.31 ± 0.02 (36) | — | |
| IOS ΔR/R (%) | −0.11 ± 0.04 (2) | −0.09 ± 0.04 (2) | — | −0.12 ± 0.04 (2) | |
| IOS SNR | 11.7 ± 4.4 (2) | 7.1 ± 2.7 (2) | — | 8.6 ± 4.6 (2) | |
| IOS SNR (single sweep) | 4.1 ± 1.2 (2) | 3.4 ± 0.2 (2) | — | 4.8 ± 1.7 (2) | |
| Remote calcium responses | Relative response (%) | Ipsilateral: 37 ± 3 (42) | Ipsilateral: 50 ± 6 (37) | Ipsilateral: 31 ± 4 (30) | — |
| M1: 38 ± 4 (25) | |||||
| Onset (s)g | Ipsilateral: 0.66 ± 0.11 (28) | Ipsilateral: 0.56 ± 0.1 (18) | Ipsilateral: 0.64 ± 0.12 (13) | — | |
| M1: 0.31 ± 0.02 (36) | |||||
| Local versus remote calcium onset | p < 0.001 | p = 0.021 | p < 0.001 (contralateral) | — | |
| p = 0.002 (M1) | |||||
| IOS versus calcium local SNR | p = 0.141 | p = 0.908 | p = 0.085 | ||
| IOS versus calcium local responses | p = 0.0004 | p = 0.0019 | p = 0.0042 | ||
Figure 6.
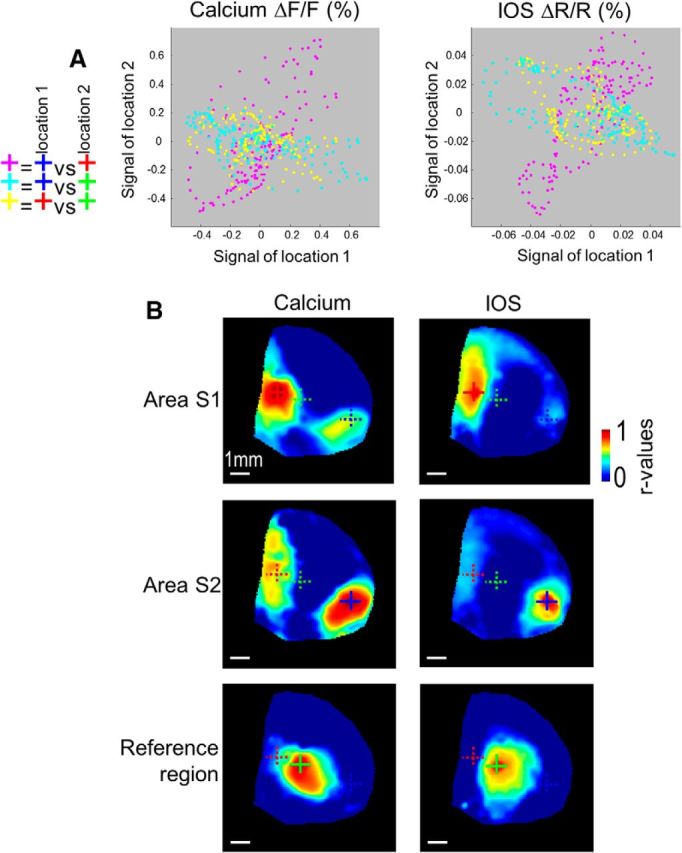
Long-range connections revealed by calcium spontaneous activity. A, Scatterplot of the calcium (left) and IOS signals (right) within the temporal window presented between signal of areas HLS1 (B, red cross) and S2 (blue cross: magenta dots) as well as between the reference region (green cross) and both areas HLS1 (yellow dots) and S2 (cyan dots). B, Seed pixel cross-correlation map based on calcium (right) and IOS signals (left). Location of the seed pixel: area S1HL indicated by the red cross, area S2 (blue cross), and reference pixel (green cross).
To evaluate the power of this approach for longitudinal studies, sensory responses through a bilateral intact bone chronic window were monitored every week for 10 consecutive weeks (Fig. 3). The example presented confirms the stability of optical transmission and fluorescence (Fig. 3A1). To evaluate the long-term stability of the responses, normalized amplitudes were plotted against time; and although some degree of variability was present, we did not observe any significant trend in amplitude change with time (Fig. 3A2,B; one-way ANOVA: p = 0.54, p = 0.45, and p = 0.93 for WS (n = 4), FL (n = 4), and HL (n = 4) stimulation respectively). The spatial sensory map pattern was also evaluated over 10 weeks, and no significant time-dependent change was apparent (Fig. 3C; p = 0.94, p = 0.85, and p = 0.63). Because all the recordings were collected under the same level of anesthesia, it is possible that variability could result from inconsistency in delivery of sensory stimulation or other stimulation-related factors.
Figure 3.

Longitudinal recording of sensory response. A, Top, Representative example of basal GCaMP fluorescence through an 8-mm-wide coverslip chronic window exposing ∼50 mm2 of cortex during 10 consecutive weeks in one mouse. Bottom, Contralateral normalized responses for HL (red), FL (green), and WS (blue) stimulation. B, Response (amplitude normalized by the maximal amplitude observed during the period) for WS (blue), FL (green), and HL (red) stimulation during the 10 consecutive weeks (n = 2 mice). C, Error (see Materials and Methods) between sensory map of the first week and the 10 consecutive weeks (thin lines indicate SEM; n = 14).
Consistent long-range connections revealed by sensory and cortical stimulation and by spontaneous activity
To extend the description of this approach to more lateral cortical areas and validate the sensory mapping, transcranial electric stimulation and acute craniotomy preparations were also used. Indeed, one limitation of our current bihemispheric chronic approach (Silasi et al., 2013) was the limited access to lateral areas, such as S2, which was not optically accessible during imaging. In addition, the chronic nature of the preparation made it incompatible with electrode-based stimulation techniques, such as intracortical microstimulation (ICMS), which can be used to reveal long-range intracortical connectivity. To circumvent these issues, acute lateral giant craniotomies can be used where the skull is removed to expose brain regions that include medial and lateral areas M1, S1, and S2 (Mohajerani et al., 2013) (Fig. 4A). Given the relative invasiveness of removing lateral facial muscles to measure the lateral cortex, creating giant chronic unilateral windows will involve further technical developments and were not used in the present study. Consistent with previous results, the stimulation of HL and FL produced very well-restricted activation in the presumed contralateral area S1 as well as regions more lateral that correspond to area S2 (responses relative to area S1: 44 ± 6%; n = 6, 4 mice; Fig. 4C1,D1,F). No difference was observed in the onset of response between areas S1 and S2 (0.28 ± 0.02 s (n = 99) and 0.30 ± 0.04 s (n = 5), respectively, p = 0.847), although this was probably limited by the sampling rate used and signal-to-noise properties. To bypass the activation of the presumed area S2 by sensory input, local ICMS of the recipient zone of HL in area S1 (HLS1) was evoked and produced long-range remote activation within area S2 with a similar spatial pattern as previously presented (Fig. 4E1). These remote and separated activations most likely involve reciprocal corticocortical and cortico-thalamo-cortical connections (Theyel et al., 2010). A more complete description of the local and remote activations evoked by ICMS is present in Figure 10.
Figure 10.

Cortical stimulation mapping of functional connections. A1, Calcium responses (maximum ΔF/F) for cortical stimulation (ICMS) in three different locations of area S1 through a bilateral acute craniotomy. A2, Location of thresholded functional responses (in red, green, and blue) overlaid on the basal GCaMP fluorescence. Contralateral responses being lower than the threshold, they do not appear on these thresholded images. B, Calcium responses in area S2 for cortical stimulations in three different locations of area S1 through a unilateral acute craniotomy.
To compare the activations produced by the calcium sensor with the commonly used functional mapping approach IOS, dual imaging acquisition of both green GCaMP3 epifluorescence and red reflectance (Harrison et al., 2009) was collected in parallel (Fig. 4B). Compared with calcium wide-field imaging, local activations evoked by both sensory and cortical microstimulation were more than one order of magnitude weaker when collected with IOS (Fig. 4C2–E2; Table 1). Nevertheless, the long-range responses in area S2 (calculated relatively to local response) were in the same range between calcium imaging and IOS (relative responses: 44 ± 7% (n = 5) and 23.1 ± 5.4% (n = 21) for IOS and calcium imaging respectively, p = 0.083, NB: HL, FL, and cortical stimulation were grouped). In the same way, SNRs were comparable with both these approaches locally (Table 1) and remotely in S2 (SNR = 3.21 ± 0.74 (n = 5) and 2.74 ± 0.44 (n = 21) for IOS and calcium, respectively, p = 0.633). Although IOS was associated with smaller local responses than calcium signals, it produced similar remote activity (relative to local responses) as defined by SNR. Although the SNRs for GCAMP3 and IOS were similar within regions of peak activity, IOS maps often contained areas of patchy noise (see quantification below).
To further develop the Emx-GCaMP model, we evaluated whether connections previously revealed with cortical and sensory stimulation could also be observed during spontaneous calcium activity under similar experimental conditions. Figure 5A, B1 presents the temporal pattern of green fluorescence during resting state spontaneous activity in one location of area S1 corresponding to HLS1 (in red), as well as within the area S2 (in blue) and a reference region between these 2 areas (in green) indicated by crosses in Figures 5C and 6B. Locations of HLS1 and S2 were experimentally determined by ICMS. Large fluctuations were observed every ∼4 s (∼0.25 Hz) within both regions with a comparable temporal profile indicating that these two distant networks undergo coactivation, which could emerge from reciprocal connections or common input (Fig. 5C, events i, ii, and iii). Figure 5B2 presents the temporal pattern of intrinsic red reflectance showing time lagged negative deflections in both areas S1 and S2 for the same events previously described. Finally, the scatterplots of both fluorescence and reflectance clearly demonstrate a positive relationship between signals of areas S1 and S2 (magenta dots) and a weak relationship between signals of both areas S1 or S2 and the reference region (Fig. 6A, yellow and cyan dots). To evaluate the spatial extent of this activity pattern, temporal cross-correlation was calculated between the signal in a reference pixel (i.e., “seed pixel,” indicated by the red cross within area HLS1) and all the other pixels within a video of 6000 image frames, corresponding to a 10 min time series of spontaneous activity (Fig. 6B). High r values indicated locations with a high degree of similarity between local signals and the “seed pixel” location. Using this approach, it was possible to observe that the spontaneous activity profile in HLS1 was strongly correlated with area S2, which also matched with the long-range activity pattern revealed by sensory stimulation and by ICMS. Conversely, spontaneous activity profile in area S2 was strongly correlated with area HLS1, whereas the signal in the reference region was uncorrelated with both areas HLS1 and S2. To compare the long-range connectivity patterns comprised within spontaneous activity of calcium signals with connectivity patterns within spontaneous IOS activity, seed pixel maps were also calculated from red reflectance images that were recorded simultaneously. Using the sensory maps as a reference, we show that, although the long-range connection pattern was visible with IOS, its location and extent were less consistent and weaker compared with those observed with GCaMP3 (error: 0.011 ± 0.002 (n = 10) and 0.033 ± 0.011 (n = 5) for calcium imaging and IOS respectively, p = 0.012; see Materials and Methods).
Figure 5.
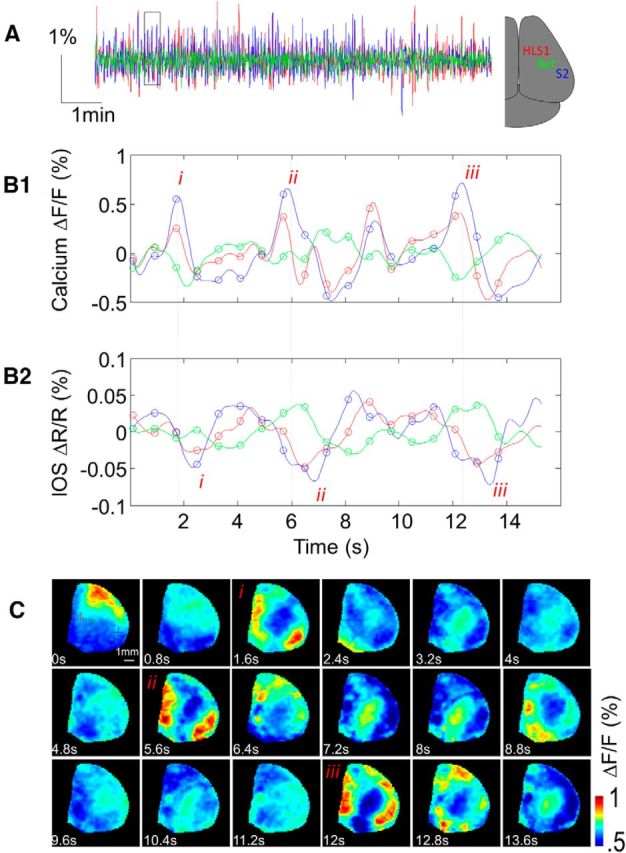
Region-specific spontaneous calcium activity. A, Calcium signal fluctuations recorded from three locations in the cortex (areas S1 and S2 and a reference region, indicated by the red, blue, and green crosses, respectively, in C. These data are collected during the same experiment presented in Figure 4. B1, Magnification of calcium signal in a temporal window. Each circle represents the location of an image presented in B2. IOS signal of the same temporal window. C, Calcium signals observed in each temporal location indicated in B1.
The consistency of spontaneous activity patterns was evaluated over 10 weeks using the sensory maps as a reference (for HL, FL, or WS stimulation, Fig. 7A). We did not observe significant variation in their pattern (one-way ANOVA: p = 0.22). To evaluate the amount of resting state calcium activity needed to map long-range connections under light isoflurane anesthesia, seed pixel correlation maps were generated for different recording durations ranging from 1.7 to 600 s (Fig. 7B). Using the sensory maps as a reference, we show that highly reliable and representative correlation maps can be observed using as little as 9.1 ± 3.2 s (n = 10, for −3 dB cutoff (−50%); 38.0 ± 16.3 s for −1 dB (−20%)) of spontaneous activity, similar to previous observations using VSD imaging (Mohajerani et al., 2013). In previous examples (Figs. 5 and 6), seed pixel maps were generated after 0.1–1 Hz temporal pass-band filtering VSD signals. However, when Fourier transformation was applied to the signals, no dominant frequency peak appeared (Fig. 6C). Thus, to identify the temporal window of spontaneous neuronal activity contributing the most to long-range connections, seed pixel correlation maps were generated for different pass band temporal filtering ranging from 0.005 to 5 Hz (Fig. 7D) and compared with sensory maps as a reference. This analysis showed highly reliable and representative correlation maps at 0.52 ± 0.08 Hz (n = 10) in a band of frequency varying between 0.14 ± 0.05 and 1.71 ± 0.33 Hz (for −3 dB, 0.33 ± 0.07 to 0.79 ± 0.11 Hz for −1 dB), well away from heartbeat-related changes in fluorescence components. Given that all versions of GCAMP, including previously used GCaMP2 (Díez-García et al., 2007) and new more sensitive variants of GCaMP (i.e., GCaMP5 and GCaMP6) (Akerboom et al., 2012; Chen et al., 2013b), are expected to have decay kinetics of >150 ms, we do not expect to observe major disparities in the frequency window with these alternative indicators when used for mesoscale cortical mapping. To map higher temporal resolution activity, some new ratiometric fluorescent voltage-sensing proteins (Akemann et al., 2012) will be an advantage voltage. Thus, these validations reveal the benefit of using Emx-GCaMP mice for the determination of functional connectivity using wide-field imaging of spontaneous activity over specific frequency bands.
Figure 7.
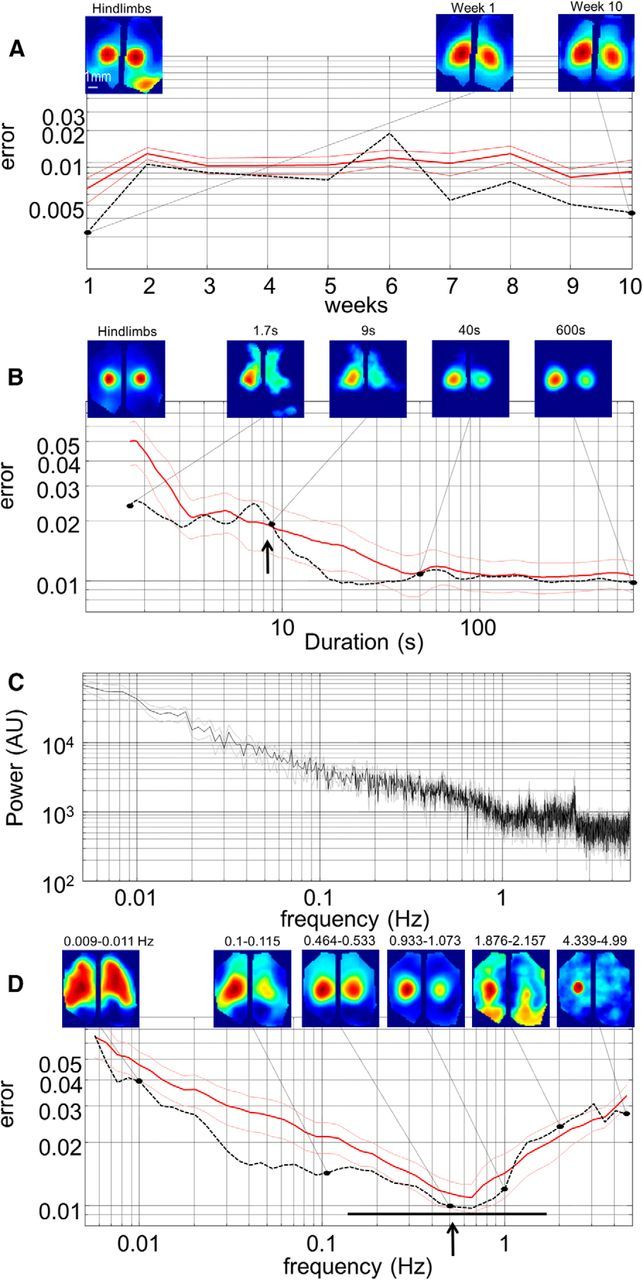
Consistency, duration, and frequency band of long-range correlated spontaneous activity mapping. A, Error (see Materials and Methods) between sensory map and seed pixel map recorded at different times ranging during 10 weeks (red curve, thin lines indicate SEM; n = 12). Dotted line indicates error observed in one animal with characteristic seed pixel correlation maps (for hindlimb location in area S1) for the first and last week presented above the graph with hindlimb sensory map used as a reference (left). B, Error between sensory map and seed pixel map for different recording durations ranging from 1.7 to 600 s (n = 10). Dotted line indicates error observed in one animal with characteristic seed pixel maps for 1.7, 9, 40, and 600 s recording durations presented above the graph with hindlimb sensory map used as a reference (left). Arrow indicates 9.1 s cutoff corresponding to −3 dB. C, Fourier transform of the calcium activity (gray lines indicate SEM; n = 10). D, Error between sensory map and seed pixel map for different frequency bands ranging from 0.005 to 5 Hz with characteristic seed pixel maps for 6 frequency bands indicated above the maps. Arrow indicates optimal frequency (n = 10); black horizontal bar represents −3 dB band cutoffs.
Specificity of GCaMP3 green fluorescence recordings
Despite its relatively high sensitivity, the recording of green epifluorescence associated with GCaMP3 is contaminated by intrinsic signals, such as changes in the flavoprotein autofluorescence (FAF) level and hemoglobin absorption. Flavoproteins are mitochondrial electron carriers that can fluoresce with single-photon excitation and emission wavelength bands that could significantly interfere with GCaMP. Furthermore, their fluorescence is elevated by the metabolism associated with neuronal activity (Masters, 1984; Chance, 1991; Masters and Chance, 1993; Shibuki et al., 2003; Murakami et al., 2004; Husson et al., 2007). Thus, FAF could vary in parallel to the GCaMP3 fluorescence and may be a potentially confounding signal source. To evaluate the contribution of FAF to the signal, green fluorescence recordings were performed on wild-type animals under similar experimental conditions. Consistent with previous studies, stimulation in wild-type mice (expressing only FAF de facto) generated responses approximately one order of magnitude weaker and noisier than calcium responses (Fig. 8A,B; Table 2) and were never associated with consistent remote cortical activity beyond area S1. Moreover, the temporal dynamics of FAF activation were also slower (Table 2). However, the absence of a high concentration of fluorescent protein in wild-type animals makes the cortex much less fluorescent, requiring more blue excitation light to generate the reliable responses due to FAF. In the absence of any other fluorophore and using relatively high excitation levels, FAF would be the dominant signal on a relative basis. Conversely, at the lower blue excitation light levels used for calcium recording within Emx-GCaMP mice (∼0.5 mW/mm2, n = 3 sessions, 2 mice), the intrinsic FAF contributed only 22% of the total fluorescence and 3% of the SD of fluctuations observed in Emx-GCAMP animals (n = 2 sessions, 1 mouse; Fig. 8D). Thus, although the basal FAF represents a significant part of fluorescence, its total contribution in green fluorescence responses should not exceed 3% (i.e., 22% of relative fluorescence × ratio of response measured with FAF and GCaMP: 0.23/1.64 for sensory stimulation). These relatively low levels of autofluorescence at the excitation light levels used for GCaMP3 imaging were not associated with consistent patterns of long-range correlated spontaneous activity (Fig. 8E). Thus, we argue, as first proposed by Díez-García et al. (2007), that although FAF was able to generate consistent sensory-evoked cortical responses, its contribution to the peak dF/Fo is expected to be <3% (see above) in the presence of the relatively strong GCaMP basal fluorescence when spontaneous activity was assessed. The smaller evoked responses observed with FAF as reported previously (Díez-García et al., 2007) could be due to a reduced sensitivity using this intrinsic chromophore, as well as a nonoptimal setup to perform this type of imaging. The goal of the present control was to evaluate the potential contribution of FAF changes to GCaMP fluorescent signals under the conditions we have used for imaging.
Figure 8.
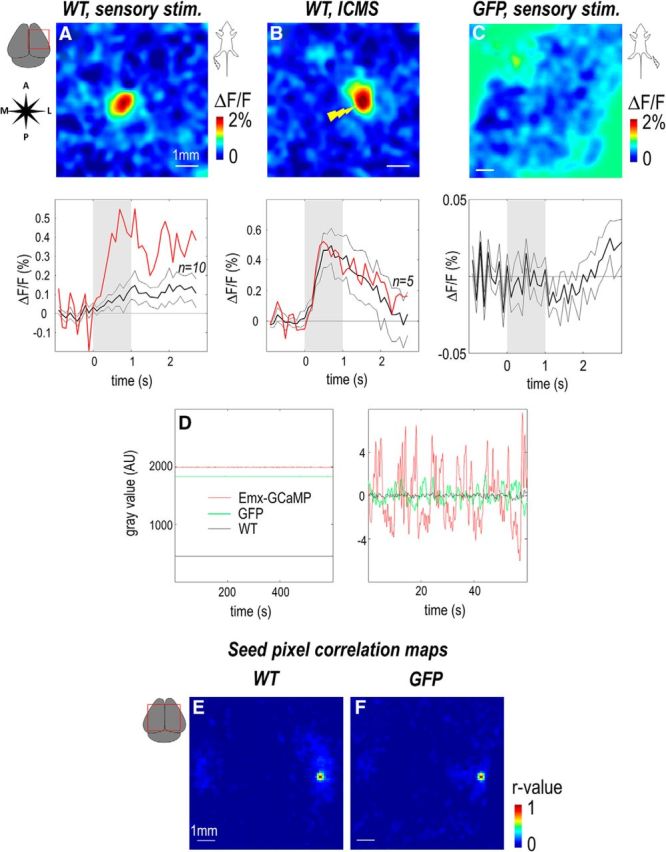
GCaMP Fluorescence is minimally affected by flavoprotein and blood volume artifact. A, B, Responses (maximum ΔF/F) and temporal profiles of green fluorescence for hindlimb stimulation (1 s train of 1 ms pulses, 100 Hz) and ICMS (1 s train of 0.1 ms × 100 μA electric pulses, 400 Hz) in a wild-type animal. Red curves represent profile of the example displayed. Black curves represent profile and SEM of the averaged response for all animals tested. C, Response and profile of green fluorescence for forelimb stimulation in a GFP mouse. D, Left, Spontaneous fluctuations of green fluorescence of Emx-GCaMP (red, n = 2), wild-type (black, n = 1), and GFP mice (green, n = 2). Right, Close-up of 60 s of recording after DC value subtracted. E, F, Seed pixel cross-correlation map calculated on wild-type and GFP mice.
Table 2.
Calcium and flavoprotein signal amplitudes, SNR, time to peak, and onsets for sensory and cortical stimulations (lower values)
| Calcium | Flavoproteins | t test (p) | |
|---|---|---|---|
| ΔF/F (%) | 1.64 ± 0.07 (n = 101) | 0.23 ± 0.07 (n = 10) | <0.001 |
| 8.9 ± 0.66 (n = 37) | 0.58 ± 0.1 (n = 5) | <0.001 | |
| SNR | 7.95 ± 0.51 (n = 101) | 2.75 ± 0.48 (n = 10) | 0.002 |
| 65.5 ± 7.38 (n = 37) | 7.19 ± 0.84 (n = 5) | 0.006 | |
| Time to peak (s) | 0.65 ± 0.03 (n = 101) | 1.11 ± 0.22 (n = 10) | <0.001 |
| 0.22 ± 0.02 (n = 37) | 1.04 ± 0.27 (n = 5) | <0.001 | |
| Onset (s) | 0.28 ± 0.02s (n = 99) | 0.62 ± 0.17 (n = 5) | 0.002 |
| 0.11 ± 0.01s (n = 37) | 0.26 ± 0.07 (n = 5) | <0.001 |
A second potential contaminating signal source could be the absorption of the blue excitation light and green emission fluorescence of GCaMP3 by the local hemoglobin concentration, which varies in part with neuronal activity because of the hemodynamic response (Frostig et al., 1990; Sirotin and Das, 2010). Because of the small difference of absorption existing between oxyhemoglobin and deoxyhemoglobin over green wavelengths, oxygenation is not expected to contribute as much to blood artifacts, compared with blood volume. Indeed, at green wavelengths, changes in hemoglobin concentration reflecting local neuronal activity is the origin of a darkening of neural tissue, and this signal would vary inversely with GCaMP3 fluorescence and could therefore be a source of inconsistency. To evaluate the contribution of hemoglobin to the green fluorescent protein signal, green fluorescence recordings were performed on mice expressing the activity-insensitive GFP (Feng et al., 2000). At similar blue excitation light levels used for calcium imaging, GFP mice generated a comparable level of fluorescence as GCaMP3 (96%, n = 2 mice). However, the resting state fluctuations were less pronounced (SD: 8% relative to Emx-GCaMP mice; Fig. 8D). GFP mice were not associated with a consistent spatial pattern of spontaneous activity or sensory responses (Fig. 8C,F). Thus, although FAF and hemoglobin absorption are also indirect reporters of neuronal activity, they are not a significant contributor to the wide-field signal recorded under the conditions used to evaluate GCaMP3 fluorescence. Together, these data show that in vivo wide-field functional imaging of genetically encoded calcium indicators is an efficient and selective method to produce regional cortical brain mapping when used and assessed under the conditions we describe.
In the future, a possible means of improving GCAMP3-specific signals would be to correct the green epifluorescence signal by a reflected light signal that was also sensitive to hemodynamic artifacts (Sirotin and Das, 2010). In work using ratiometric voltage-sensitive fluorescent proteins, such strategies lead to significant improvements (Akemann et al., 2012).
Long-range connectivity patterns revealed by spontaneous calcium activity are similar to microstimulation
In the present section, we take advantage of the widespread expression of the calcium indicator over the entire cortex and its ability to map long-range connections. Spontaneous activity was recorded in mice through a bilateral chronic window (presented in Figs. 1, 2, and 3) and 3 seed pixel cross-correlation maps (CM) were generated within area S1 (Fig. 9A). We show that different seed pixel locations within S1 are associated with distinct corresponding regions of area M1 and in the opposite hemisphere. When seed pixels were placed in border regions between area S1 and M1, the remotely connected region of area M1 merged with the local activity of area S1 (pixel 3). Using the same source of spontaneous activity, a reciprocal pattern of connectivity can be demonstrated, this time using seed pixels located in area M1 and examining correlation with corresponding, distinct areas within S1 and also the opposite hemisphere (Fig. 9B). Similarly, by using spontaneous activity recording of a mouse having a unilateral acute window, the functional connections between distinct regions of area S1 and S2 were clearly observed (Fig. 9C). Again, using the same source of spontaneous activity, CMs were also generated from pixels located within area S2 and suggesting a similar reciprocal pattern of connectivity (Fig. 9D). Similar pattern of connectivity has also been revealed in 8 additional animals (data not shown). By using short sequences of spontaneous calcium activity (10 min and less), these results revealed the precise spatial arrangement of the reciprocal functional connections between areas M1, S1, and S2 by determining which pairs of regions are coactivated. In all seed pixel correlation maps presented, local high r values were observed in surrounding region of the seed pixel [half-width at half-height: 0.43 ± 0.01 mm (n = 36), 0.48 ± 0.02 mm (n = 36), and 0.32 ± 0.01 mm (n = 36) for seed pixel in HLS1, FLS1, and BCS1, respectively]. These local correlations around the seed were narrower in size to the spread of signal observed with sensory stimulations [half-width at half-height: 0.48 ± 0.02 mm (p = 0.040, n = 51), 0.63 ± 0.04 mm (p = 0.008, n = 50), and 0.63 ± 0.06 mm (p < 0.001, n = 39) for HL, FL, and WS stimulation, respectively] but slightly broader than activations evoked by cortical electrical microstimulation (half-width at half-height of all seed pixel map grouped: 0.41 ± 0.01 mm, n = 108; ICMS grouped: 0.36 ± 0.01 mm, n = 54, p = 0.003). As mentioned in previous work (Mohajerani et al., 2013), these local correlation may reflect local connections and are not expected to be associated with poor sampling or optical properties.
Figure 9.

Spontaneous activity mapping of functional connections. A1, Seed pixel cross-correlation maps associated with 3 seed pixel locations (black crosses) within area S1 through a bilateral chronic window. A2, Location of the 3 cross-correlation thresholded activity (in red, green, and blue) overlaid on the basal GCaMP fluorescence. B, Same as A, but for seed pixel locations within area M1. C, D, Same as A, B but for unilateral acute craniotomy and seed pixel locations within areas S1 (C) or S2 (D).
To confirm the detailed connectivity relationships revealed by calcium imaging of spontaneous activity, long-range activation evoked by intracortical microstimulation was assessed in a preparation in which both hemispheres were exposed (Fig. 10A). Electrical stimulation in area S1 evoked strong local calcium responses as well as remote calcium responses associated with long-range connections to locations that presumably correspond to the ipsilateral area M1 (relative response to area S1: 16 ± 2%, n = 15 locations from 4 mice) and to contralateral area S1 (relative response to area S1: 20 ± 3%, n = 11 locations from 2 mice). Correspondingly, ICMS brain mapping of area M1 evoked robust local calcium responses (data not shown, ΔF/F = 7.5 ± 1.3%, n = 5 locations from 3 mice), as well as long-range activations in ipsilateral area S1 as well as contralateral areas M1 (relative response: 22 ± 3.5%, n = 5 locations from 3 mice). The connectivity patterns established from spontaneous activity between areas S1 and S2 were also confirmed by ICMS brain mapping through unilateral giant craniotomies (Fig. 10B). By stimulating different locations of area S1, it was possible to observe discrete long-range remote regions of activation in area S2 (relative response: 13 ± 2%, n = 21 locations from 8 mice). Likewise, by stimulating different locations of area S2 (data not shown, ΔF/F = 8.5 ± 0.5%, n = 2 mice), it was possible to observe an individual spot of activation in area S1 (relative response: 32.6 ± 4.9%, n = 2 mice) consistent with the areas being reciprocally connected. Together, these results confirmed that, by directly activating fibers and neurons through ICMS, a pattern of functional connections between areas M1, S1, and S2 can be revealed and that this pattern of functional connections is comparable with the mapping revealed with spontaneous activity.
Discussion
Bihemispheric chronic wide-field imaging of GECIs
By recording fluorescence signals from Emx-GCaMP mice, reliable cortical responses for sensory stimulation were evoked and revealed somatotopic maps within area S1 and long-range intracortical connections. Long-range connections were confirmed by intracortical electrical cortical stimulation and are consistent with previous reports (Ferezou et al., 2007; Lim et al., 2013; Mohajerani et al., 2013). Although this approach cannot easily discriminate the cellular nature of projecting neurons (Yamashita et al., 2013), a key aspect of our study is that GCaMP3 recordings of resting state spontaneous activity were able to reveal patterns of connectivity with a high spatial accuracy, comparable with acute VSD imaging (Mohajerani et al., 2010, 2013).
A missing link: chronic regional high temporal resolution imaging of mouse cortex
Functional imaging approaches represent a unique opportunity to establish functional connectivity relationships during behavior, learning, or reorganization after injury (Alivisatos et al., 2012). Two-photon microscopy permits locally measured neuronal and dendritic activity during awake recordings and longitudinal monitoring (Helmchen and Denk, 2005; Mrsic-Flogel et al., 2007; Yuste, 2011; Grienberger and Konnerth, 2012; Margolis et al., 2012; Chen et al., 2013a). However, the exploration of neuronal interactions over larger scales with two-photon microscopy is limited given the requirements of scanning (Grienberger and Konnerth, 2012). GCaMP3-mediated cortical spontaneous activity mapping offers significant benefits: (1) From a single sequence of spontaneous cortical activity virtually, the complete topology of connections between cortical areas imaged is obtained and these relations can be further mined post hoc without a priori intent. (2) In contrast to more interventional techniques, such as sensory or cortical stimulation, spontaneous activity mapping does not interfere with the ongoing neural networks and complements wide-scale anatomical atlases of mouse connectivity (Oh et al., 2014; Zingg et al., 2014). Moreover, the ability to bypass sensory stimulation reduces error caused by variability in the means of delivering stimulation. (3) To overcome the complexity added by delivering a sensory stimulation, an alternate method for producing evoked data is to stimulate cortex with ICMS (Logothetis et al., 2010; Brock et al., 2013), or optogenetic photostimulation by using red-shifted opsins (Lim et al., 2012, 2013; Guo et al., 2014). However, ICMS suffers a number of drawbacks: (1) a limited number of spots can be explored, (2) ICMS produces some degree of damage, (3) the strategy is difficult to combine with longitudinal studies, and (4) ICMS is expected to produce a combination of orthodromic and antidromic action potential propagation making long-range activation hard to interpret (Histed et al., 2009; Lim et al., 2013).
In the present study, the topologic mapping of the functional connections between areas of the somatomotor cortex was facilitated by the use of wide-field calcium imaging within Emx-GCaMP mice. These animals were created by crossing the Emx-cre line, expressing cre-recombinase in excitatory cells (Gorski et al., 2002) and the R26-GCaMP3 line (Ackman et al., 2012; Zariwala et al., 2012). In situ hybridization data from the Allen Institute are consistent with GCaMP3 being expressed within all cortical layers in adult animals. However, in contrast to depth-resolved patterned light illumination (Hillman et al., 2007), the wide-field imaging approach used here was not able to discriminate the specific contribution of different layers. Because intracellular calcium level has been reported to be related to the change of spiking activity at the cellular scale (Stosiek et al., 2003; Berger et al., 2007; Tian et al., 2009), measures of wide-field fluorescent response should represent a reliable indicator of neuronal activity. To perform wide-field imaging through chronic windows, previous groups expressed calcium indicators Yellow Chameleon YC360 and GCaMP3 by AAV-virus (Andermann et al., 2011; Minderer et al., 2012). Although this approach produced high expression, it was not necessarily stable over time (Zariwala et al., 2012). Moreover, the limited spread of expression (∼1 mm) over the injection location is a major obstacle for wide-field mapping. Therefore, the use of transgenic mice represents an opportunity to map neuronal activity over large regions that is compatible with longitudinal studies. More important, the stable and constant level of expression between animals makes experiments more reproducible. The parallel development of intact-bone chronic imaging or photostimulation windows that provide optical access to the majority of the dorsal cortical surface (Hira et al., 2009; Silasi et al., 2013; Guo et al., 2014) has made this a relatively simple and noninvasive procedure.
Contributions of endogenous fluorophores and blood volume to regional imaging signals
An important contribution of the current study was controls performed to confirm the origin of the green cortical fluorescence signal fluctuations in Emx-GCaMP mice. The signal is assumed to be related to intracellular calcium concentration levels and an indirect marker of spiking within excitatory cells (Stosiek et al., 2003; Berger et al., 2007; Tian et al., 2009; Zariwala et al., 2012). However, in the present experimental condition, two sources of intrinsic contamination (FAF and hemoglobin light absorption) will contribute to unintended signals. FAF changes as a function of oxidative metabolism associated with brain activity and can vary with a similar temporal profile as GCaMP3 fluorescence (Shibuki et al., 2003; Murakami et al., 2004; Husson et al., 2007). However, consistent with previous finding within cerebellum (Díez-García et al., 2007), wild-type animals, exhibiting only flavoproteins, produced a much lower basal fluorescence level and were associated with lower amplitude and slower kinetics of cortical fluctuations compared with Emx-GCaMP mice. This explained the absence of any observed long-range cortical connectivity based on spontaneous activity in WT mice and suggested that the contribution of FAF in GCaMP3 fluorescence was minimal. Neuro-hemodynamic responses produce variation of hemoglobin concentration, which will alter excitation and emission fluorescence of GCaMP3 and thus could produce spatiotemporal patterns of apparent neuronal activity independent of calcium fluorescence responses (Frostig et al., 1990; Sirotin and Das, 2010; White et al., 2011). Similarly to FAF, neuro-hemodynamic responses are not cell specific and are indirectly associated with oxidative metabolism and could reveal a combination of subthreshold and suprathreshold activity (Attwell and Laughlin, 2001; Zepeda et al., 2004; Vanzetta and Grinvald, 2008). However, recordings performed in GFP mice, expressing a protein of similar fluorescence to GCaMP3, but not sensitive to neuronal activity (Feng et al., 2000), were associated with weaker fluctuations and an absence of cortical mapping based on spontaneous activity. This observation is consistent with the more poorly spatially resolved spontaneous activity maps of remote activity using red IOS, a measure based on neuro-hemodynamic responses, in the present and previous reports (White et al., 2011; Guevara et al., 2013).
Toward cell specific maps and combined optical circuit control
Previously, wide-field VSD imaging was used for brain mapping (Chemla and Chavane, 2010). Functional connections between areas of the somatomotor cortex were revealed during spontaneous activity, optogenetic photostimulation, and sensory stimulation (Ferezou et al., 2007; Aronoff et al., 2010; Lim et al., 2012; Mohajerani et al., 2013). Although this approach aided brain mapping, it lacks cellular specificity and cannot be used for longitudinal studies within rodent models (requires removal of dura and labeling is transient). Moreover, VSD use was associated with side effects, such as enhancement of sensory responses (Grandy et al., 2012; Mohajerani et al., 2013). To overcome this limitation, genetically encoded voltage indicators are a promising advance (Akemann et al., 2012, 2013). Similarly to VSD, their signal should report a combination of subthreshold and spiking activity. In contrast, calcium imaging is expected to predominantly report spiking activity (Stosiek et al., 2003; Berger et al., 2007; Tian et al., 2009). However, no transgenic mouse line was widely characterized, and the extent of expression is still limited to that achieved by AAV-virus injection or electroporation. Recordings based on neuro-hemodynamic response, such as fMRI or IOS, are well established for brain mapping and, in contrast to VSD imaging, are compatible with longitudinal studies. fMRI on human was the initial approach for establishing connectivity based on resting state activity (Biswal et al., 1995; Fox and Raichle, 2007) and was successfully applied to small primates to map somatosensory cortex topology (Wang et al., 2013). Nevertheless, this approach can be difficult to translate with good sensitivity or resolution to mice (Sforazzini et al., 2013). We acknowledge the utility of label-free imaging using IOS and its successful application for brain mapping studies (Kalatsky and Stryker, 2003; Zepeda et al., 2004; Vanzetta and Grinvald, 2008; Vanni et al., 2010). Recently, IOS resting state activity was performed on mice to identify clusters of correlated activity (White et al., 2011; Guevara et al., 2013). While interhemispheric connections could be mapped with this approach, no long-range patterns with discrete islands of activation were observed between ipsilateral somatomotor areas (Kleinfeld and Delaney, 1996; Ferezou et al., 2007; Mohajerani et al., 2013).
In conclusion, wide-field calcium imaging using Emx-GCaMP is an innovative tool that represents a new step in the exploration of brain connectivity by specifically reporting neuronal activity with high sensitivity over the entire cortex. This opens new opportunities in the exploration of cortical topology and parcellation, as well as longitudinal studies involving plasticity after stroke or deprivation.
Footnotes
This work was supported by Canadian Institutes of Health Research Operating Grant MOP-12675 to T.H.M., Human Frontier Science Program grant to T.H.M., and Michael Smith Foundation for Health Research postdoctoral fellowships to M.P.V. We thank Pumin Wang and Cindy Jiang for surgical assistance and husbandry; Jeff LeDue for assistance with optics; Yujin Wu for help with immunochemistry; Greg Silasi and Allen Chan for helpful comments; Dr. Jane Roskams for a gift of S100β antibodies; and Kevin R. Jones (University of Colorado) and Hongkui Zeng (Allen Institute for Brain Science) who developed the mouse strains.
The authors declare no competing financial interests.
References
- ABI Mouse Connectivity. Emx1-IRES-Cre;Ai38. 2014. Available at: http://connectivity.brain-map.org/transgenic/experiment/100132540. Retrieved on October 27, 2014.
- Ackman JB, Burbridge TJ, Crair MC. Retinal waves coordinate patterned activity throughout the developing visual system. Nature. 2012;490:219–225. doi: 10.1038/nature11529. [DOI] [PMC free article] [PubMed] [Google Scholar]
- Akemann W, Mutoh H, Perron A, Park YK, Iwamoto Y, Knöpfel T. Imaging neural circuit dynamics with a voltage-sensitive fluorescent protein. J Neurophysiol. 2012;108:2323–2337. doi: 10.1152/jn.00452.2012. [DOI] [PubMed] [Google Scholar]
- Akemann W, Sasaki M, Mutoh H, Imamura T, Honkura N, Knöpfel T. Two-photon voltage imaging using a genetically encoded voltage indicator. Sci Rep. 2013;3:2231. doi: 10.1038/srep02231. [DOI] [PMC free article] [PubMed] [Google Scholar]
- Akerboom J, Chen TW, Wardill TJ, Tian L, Marvin JS, Mutlu S, Calderón NC, Esposti F, Borghuis BG, Sun XR, Gordus A, Orger MB, Portugues R, Engert F, Macklin JJ, Filosa A, Aggarwal A, Kerr RA, Takagi R, Kracun S, et al. Optimization of a GCaMP calcium indicator for neural activity imaging. J Neurosci. 2012;32:13819–13840. doi: 10.1523/JNEUROSCI.2601-12.2012. [DOI] [PMC free article] [PubMed] [Google Scholar]
- Alivisatos AP, Chun M, Church GM, Greenspan RJ, Roukes ML, Yuste R. The brain activity map project and the challenge of functional connectomics. Neuron. 2012;74:970–974. doi: 10.1016/j.neuron.2012.06.006. [DOI] [PMC free article] [PubMed] [Google Scholar]
- Andermann ML, Kerlin AM, Roumis DK, Glickfeld LL, Reid RC. Functional specialization of mouse higher visual cortical areas. Neuron. 2011;72:1025–1039. doi: 10.1016/j.neuron.2011.11.013. [DOI] [PMC free article] [PubMed] [Google Scholar]
- Aronoff R, Matyas F, Mateo C, Ciron C, Schneider B, Petersen CC. Long-range connectivity of mouse primary somatosensory barrel cortex. Eur J Neurosci. 2010;31:2221–2233. doi: 10.1111/j.1460-9568.2010.07264.x. [DOI] [PubMed] [Google Scholar]
- Attwell D, Laughlin SB. An energy budget for signaling in the grey matter of the brain. J Cereb Blood Flow Metab. 2001;21:1133–1145. doi: 10.1097/00004647-200110000-00001. [DOI] [PubMed] [Google Scholar]
- Berger T, Borgdorff A, Crochet S, Neubauer FB, Lefort S, Fauvet B, Ferezou I, Carleton A, Lüscher HR, Petersen CC. Combined voltage and calcium epifluorescence imaging in vitro and in vivo reveals subthreshold and suprathreshold dynamics of mouse barrel cortex. J Neurophysiol. 2007;97:3751–3762. doi: 10.1152/jn.01178.2006. [DOI] [PubMed] [Google Scholar]
- Biswal B, Yetkin FZ, Haughton VM, Hyde JS. Functional connectivity in the motor cortex of resting human brain using echo-planar MRI. Magn Reson Med. 1995;34:537–541. doi: 10.1002/mrm.1910340409. [DOI] [PubMed] [Google Scholar]
- Brock AA, Friedman RM, Fan RH, Roe AW. Optical imaging of cortical networks via intracortical microstimulation. J Neurophysiol. 2013;110:2670–2678. doi: 10.1152/jn.00879.2012. [DOI] [PMC free article] [PubMed] [Google Scholar]
- Brown CE, Aminoltejari K, Erb H, Winship IR, Murphy TH. In vivo voltage-sensitive dye imaging in adult mice reveals that somatosensory maps lost to stroke are replaced over weeks by new structural and functional circuits with prolonged modes of activation within both the peri-infarct zone and distant sites. J Neurosci. 2009;29:1719–1734. doi: 10.1523/JNEUROSCI.4249-08.2009. [DOI] [PMC free article] [PubMed] [Google Scholar]
- Chance B. Optical method. Annu Rev Biophys Biophys Chem. 1991;20:1–28. doi: 10.1146/annurev.bb.20.060191.000245. [DOI] [PubMed] [Google Scholar]
- Chemla S, Chavane F. Voltage-sensitive dye imaging: technique review and models. J Physiol Paris. 2010;104:40–50. doi: 10.1016/j.jphysparis.2009.11.009. [DOI] [PubMed] [Google Scholar]
- Chen JL, Carta S, Soldado-Magraner J, Schneider BL, Helmchen F. Behaviour-dependent recruitment of long-range projection neurons in somatosensory cortex. Nature. 2013a;499:336–340. doi: 10.1038/nature12236. [DOI] [PubMed] [Google Scholar]
- Chen TW, Wardill TJ, Sun Y, Pulver SR, Renninger SL, Baohan A, Schreiter ER, Kerr RA, Orger MB, Jayaraman V, Looger LL, Svoboda K, Kim DS. Ultrasensitive fluorescent proteins for imaging neuronal activity. Nature. 2013b;499:295–300. doi: 10.1038/nature12354. [DOI] [PMC free article] [PubMed] [Google Scholar]
- Coutinho V, Mutoh H, Knöpfel T. Functional topology of the mossy fibre-granule cell–Purkinje cell system revealed by imaging of intrinsic fluorescence in mouse cerebellum. Eur J Neurosci. 2004;20:740–748. doi: 10.1111/j.1460-9568.2004.03533.x. [DOI] [PubMed] [Google Scholar]
- Díez-García J, Akemann W, Knöpfel T. In vivo calcium imaging from genetically specified target cells in mouse cerebellum. Neuroimage. 2007;34:859–869. doi: 10.1016/j.neuroimage.2006.10.021. [DOI] [PubMed] [Google Scholar]
- Feng G, Mellor RH, Bernstein M, Keller-Peck C, Nguyen QT, Wallace M, Nerbonne JM, Lichtman JW, Sanes JR. Imaging neuronal subsets in transgenic mice expressing multiple spectral variants of GFP. Neuron. 2000;28:41–51. doi: 10.1016/S0896-6273(00)00084-2. [DOI] [PubMed] [Google Scholar]
- Ferezou I, Haiss F, Gentet LJ, Aronoff R, Weber B, Petersen CC. Spatiotemporal dynamics of cortical sensorimotor integration in behaving mice. Neuron. 2007;56:907–923. doi: 10.1016/j.neuron.2007.10.007. [DOI] [PubMed] [Google Scholar]
- Fox MD, Raichle ME. Spontaneous fluctuations in brain activity observed with functional magnetic resonance imaging. Nat Rev Neurosci. 2007;8:700–711. doi: 10.1038/nrn2201. [DOI] [PubMed] [Google Scholar]
- Frostig RD, Lieke EE, Ts'o DY, Grinvald A. Cortical functional architecture and local coupling between neuronal activity and the microcirculation revealed by in vivo high-resolution optical imaging of intrinsic signals. Proc Natl Acad Sci U S A. 1990;87:6082–6086. doi: 10.1073/pnas.87.16.6082. [DOI] [PMC free article] [PubMed] [Google Scholar]
- Gias C, Hewson-Stoate N, Jones M, Johnston D, Mayhew JE, Coffey PJ. Retinotopy within rat primary visual cortex using optical imaging. Neuroimage. 2005;24:200–206. doi: 10.1016/j.neuroimage.2004.08.015. [DOI] [PubMed] [Google Scholar]
- Gorski JA, Talley T, Qiu M, Puelles L, Rubenstein JL, Jones KR. Cortical excitatory neurons and glia, but not GABAergic neurons, are produced in the Emx1-expressing lineage. J Neurosci. 2002;22:6309–6314. doi: 10.1523/JNEUROSCI.22-15-06309.2002. [DOI] [PMC free article] [PubMed] [Google Scholar]
- Grandy TH, Greenfield SA, Devonshire IM. An evaluation of in vivo voltage-sensitive dyes: pharmacological side effects and signal-to-noise ratios after effective removal of brain-pulsation artifacts. J Neurophysiol. 2012;108:2931–2945. doi: 10.1152/jn.00512.2011. [DOI] [PubMed] [Google Scholar]
- Grienberger C, Konnerth A. Imaging calcium in neurons. Neuron. 2012;73:862–885. doi: 10.1016/j.neuron.2012.02.011. [DOI] [PubMed] [Google Scholar]
- Grinvald A, Hildesheim R. VSDI: a new era in functional imaging of cortical dynamics. Nat Rev Neurosci. 2004;5:874–885. doi: 10.1038/nrn1536. [DOI] [PubMed] [Google Scholar]
- Grosche A, Grosche J, Tackenberg M, Scheller D, Gerstner G, Gumprecht A, Pannicke T, Hirrlinger PG, Wilhelmsson U, Hüttmann K, Härtig W, Steinhäuser C, Pekny M, Reichenbach A. Versatile and simple approach to determine astrocyte territories in mouse neocortex and hippocampus. PLoS One. 2013;8:e69143. doi: 10.1371/journal.pone.0069143. [DOI] [PMC free article] [PubMed] [Google Scholar]
- Guevara E, Sadekova N, Girouard H, Lesage F. Optical imaging of resting-state functional connectivity in a novel arterial stiffness model. Biomed Opt Express. 2013;4:2332–2346. doi: 10.1364/BOE.4.002332. [DOI] [PMC free article] [PubMed] [Google Scholar]
- Guo ZV, Li N, Huber D, Ophir E, Gutnisky D, Ting JT, Feng G, Svoboda K. Flow of cortical activity underlying a tactile decision in mice. Neuron. 2014;81:179–194. doi: 10.1016/j.neuron.2013.10.020. [DOI] [PMC free article] [PubMed] [Google Scholar]
- Hachem S, Aguirre A, Vives V, Marks A, Gallo V, Legraverend C. Spatial and temporal expression of S100B in cells of oligodendrocyte lineage. Glia. 2005;51:81–97. doi: 10.1002/glia.20184. [DOI] [PubMed] [Google Scholar]
- Haider B, Häusser M, Carandini M. Inhibition dominates sensory responses in the awake cortex. Nature. 2013;493:97–100. doi: 10.1038/nature11665. [DOI] [PMC free article] [PubMed] [Google Scholar]
- Harrison TC, Sigler A, Murphy TH. Simple and cost-effective hardware and software for functional brain mapping using intrinsic optical signal imaging. J Neurosci Methods. 2009;182:211–218. doi: 10.1016/j.jneumeth.2009.06.021. [DOI] [PubMed] [Google Scholar]
- Helmchen F, Denk W. Deep tissue two-photon microscopy. Nat Rev Neurosci. 2005;2:932–940. doi: 10.1038/nmeth818. [DOI] [PubMed] [Google Scholar]
- Hillman EM, Devor A, Bouchard MB, Dunn AK, Krauss GW, Skoch J, Bacskai BJ, Dale AM, Boas DA. Depth-resolved optical imaging and microscopy of vascular compartment dynamics during somatosensory stimulation. Neuroimage. 2007;35:89–104. doi: 10.1016/j.neuroimage.2006.11.032. [DOI] [PMC free article] [PubMed] [Google Scholar]
- Hira R, Honkura N, Noguchi J, Maruyama Y, Augustine GJ, Kasai H, Matsuzaki M. Transcranial optogenetic stimulation for functional mapping of the motor cortex. J Neurosci Methods. 2009;179:258–263. doi: 10.1016/j.jneumeth.2009.02.001. [DOI] [PubMed] [Google Scholar]
- Histed MH, Bonin V, Reid RC. Direct activation of sparse, distributed populations of cortical neurons by electrical microstimulation. Neuron. 2009;63:508–522. doi: 10.1016/j.neuron.2009.07.016. [DOI] [PMC free article] [PubMed] [Google Scholar]
- Homma R, Baker BJ, Jin L, Garaschuk O, Konnerth A, Cohen LB, Zecevic D. Wide-field and two-photon imaging of brain activity with voltage- and calcium-sensitive dyes. Philos Trans R Soc Lond B Biol Sci. 2009;364:2453–2467. doi: 10.1098/rstb.2009.0084. [DOI] [PMC free article] [PubMed] [Google Scholar]
- Husson TR, Mallik AK, Zhang JX, Issa NP. Functional imaging of primary visual cortex using flavoprotein autofluorescence. J Neurosci. 2007;27:8665–8675. doi: 10.1523/JNEUROSCI.2156-07.2007. [DOI] [PMC free article] [PubMed] [Google Scholar]
- Kalatsky VA, Stryker MP. New paradigm for optical imaging: temporally encoded maps of intrinsic signal. Neuron. 2003;38:529–545. doi: 10.1016/S0896-6273(03)00286-1. [DOI] [PubMed] [Google Scholar]
- Kleinfeld D, Delaney KR. Distributed representation of vibrissa movement in the upper layers of somatosensory cortex revealed with voltage-sensitive dyes. J Comp Neurol. 1996;375:89–108. doi: 10.1002/(SICI)1096-9861(19961104)375:1<89::AID-CNE6>3.0.CO;2-K. [DOI] [PubMed] [Google Scholar]
- Knöpfel T. Genetically encoded optical indicators for the analysis of neuronal circuits. Nat Rev Neurosci. 2012;13:687–700. doi: 10.1038/nrn3293. [DOI] [PubMed] [Google Scholar]
- Kummer M, Kirmse K, Witte OW, Holthoff K. Reliable in vivo identification of both GABAergic and glutamatergic neurons using Emx1-Cre driven fluorescent reporter expression. Cell Calcium. 2012;52:182–189. doi: 10.1016/j.ceca.2012.05.004. [DOI] [PubMed] [Google Scholar]
- Lim DH, Mohajerani MH, Ledue J, Boyd J, Chen S, Murphy TH. In vivo large-scale cortical mapping using channelrhodopsin-2 stimulation in transgenic mice reveals asymmetric and reciprocal relationships between cortical areas. Front Neural Circuits. 2012;6:11. doi: 10.3389/fncir.2012.00011. [DOI] [PMC free article] [PubMed] [Google Scholar]
- Lim DH, Ledue J, Mohajerani MH, Vanni MP, Murphy TH. Optogenetic approaches for functional mouse brain mapping. Front Neurosci. 2013;7:54. doi: 10.3389/fnins.2013.00054. [DOI] [PMC free article] [PubMed] [Google Scholar]
- Logothetis NK, Augath M, Murayama Y, Rauch A, Sultan F, Goense J, Oeltermann A, Merkle H. The effects of electrical microstimulation on cortical signal propagation. Nat Neurosci. 2010;13:1283–1291. doi: 10.1038/nn.2631. [DOI] [PubMed] [Google Scholar]
- Madisen L, Zwingman TA, Sunkin SM, Oh SW, Zariwala HA, Gu H, Ng LL, Palmiter RD, Hawrylycz MJ, Jones AR, Lein ES, Zeng H. A robust and high-throughput Cre reporting and characterization system for the whole mouse brain. Nat Neurosci. 2010;13:133–140. doi: 10.1038/nn.2467. [DOI] [PMC free article] [PubMed] [Google Scholar]
- Margolis DJ, Lütcke H, Schulz K, Haiss F, Weber B, Kügler S, Hasan MT, Helmchen F. Reorganization of cortical population activity imaged throughout long-term sensory deprivation. Nat Neurosci. 2012;15:1539–1546. doi: 10.1038/nn.3240. [DOI] [PubMed] [Google Scholar]
- Masters B, Chance B. Redox confocal imaging: intrinsic fluorescent probes of cellular metabolism. In: Mason WT, editor. Luminescent probes for biological activity. San Diego: Academic; 1993. [Google Scholar]
- Masters BR. Noninvasive redox fluorometry: how light can be used to monitor alterations of corneal mitochondrial function. Curr Eye Res. 1984;3:23–26. doi: 10.3109/02713688408997184. [DOI] [PubMed] [Google Scholar]
- Minderer M, Liu W, Sumanovski LT, Kügler S, Helmchen F, Margolis DJ. Chronic imaging of cortical sensory map dynamics using a genetically encoded calcium indicator. J Physiol. 2012;590:99–107. doi: 10.1113/jphysiol.2011.219014. [DOI] [PMC free article] [PubMed] [Google Scholar]
- Mohajerani MH, McVea DA, Fingas M, Murphy TH. Mirrored bilateral slow-wave cortical activity within local circuits revealed by fast bihemispheric voltage-sensitive dye imaging in anesthetized and awake mice. J Neurosci. 2010;30:3745–3751. doi: 10.1523/JNEUROSCI.6437-09.2010. [DOI] [PMC free article] [PubMed] [Google Scholar]
- Mohajerani MH, Aminoltejari K, Murphy TH. Targeted mini-strokes produce changes in interhemispheric sensory signal processing that are indicative of disinhibition within minutes. Proc Natl Acad Sci U S A. 2011;108:E183–E191. doi: 10.1073/pnas.1101914108. [DOI] [PMC free article] [PubMed] [Google Scholar]
- Mohajerani MH, Chan AW, Mohsenvand M, LeDue J, Liu R, McVea DA, Boyd JD, Wang YT, Reimers M, Murphy TH. Spontaneous cortical activity alternates between motifs defined by regional axonal projections. Nat Neurosci. 2013;16:1426–1435. doi: 10.1038/nn.3499. [DOI] [PMC free article] [PubMed] [Google Scholar]
- Mrsic-Flogel TD, Hofer SB, Ohki K, Reid RC, Bonhoeffer T, Hübener M. Homeostatic regulation of eye-specific responses in visual cortex during ocular dominance plasticity. Neuron. 2007;54:961–972. doi: 10.1016/j.neuron.2007.05.028. [DOI] [PubMed] [Google Scholar]
- Murakami H, Kamatani D, Hishida R, Takao T, Kudoh M, Kawaguchi T, Tanaka R, Shibuki K. Short-term plasticity visualized with flavoprotein autofluorescence in the somatosensory cortex of anaesthetized rats. Eur J Neurosci. 2004;19:1352–1360. doi: 10.1111/j.1460-9568.2004.03237.x. [DOI] [PubMed] [Google Scholar]
- Nimmerjahn A, Kirchhoff F, Kerr JN, Helmchen F. Sulforhodamine 101 as a specific marker of astroglia in the neocortex in vivo. Nat Methods. 2004;1:31–37. doi: 10.1038/nmeth706. [DOI] [PubMed] [Google Scholar]
- Oh SW, Harris JA, Ng L, Winslow B, Cain N, Mihalas S, Wang Q, Lau C, Kuan L, Henry AM, Mortrud MT, Ouellette B, Nguyen TN, Sorensen SA, Slaughterbeck CR, Wakeman W, Li Y, Feng D, Ho A, Nicholas E, et al. A mesoscale connectome of the mouse brain. Nature. 2014;508:207–214. doi: 10.1038/nature13186. [DOI] [PMC free article] [PubMed] [Google Scholar]
- Perron A, Akemann W, Mutoh H, Knöpfel T. Genetically encoded probes for optical imaging of brain electrical activity. Prog Brain Res. 2012;196:63–77. doi: 10.1016/B978-0-444-59426-6.00004-5. [DOI] [PubMed] [Google Scholar]
- Schummers J, Yu H, Sur M. Tuned responses of astrocytes and their influence on hemodynamic signals in the visual cortex. Science. 2008;320:1638–1643. doi: 10.1126/science.1156120. [DOI] [PubMed] [Google Scholar]
- Sforazzini F, Schwarz AJ, Galbusera A, Bifone A, Gozzi A. Distributed BOLD and CBV-weighted resting-state networks in the mouse brain. Neuroimage. 2013;87C:403–415. doi: 10.1016/j.neuroimage.2013.09.050. [DOI] [PubMed] [Google Scholar]
- Shibuki K, Hishida R, Murakami H, Kudoh M, Kawaguchi T, Watanabe M, Watanabe S, Kouuchi T, Tanaka R. Dynamic imaging of somatosensory cortical activity in the rat visualized by flavoprotein autofluorescence. J Physiol. 2003;549:919–927. doi: 10.1113/jphysiol.2003.040709. [DOI] [PMC free article] [PubMed] [Google Scholar]
- Shmuel A, Grinvald A. Functional organization for direction of motion and its relationship to orientation maps in cat area 18. J Neurosci. 1996;16:6945–6964. doi: 10.1523/JNEUROSCI.16-21-06945.1996. [DOI] [PMC free article] [PubMed] [Google Scholar]
- Shoham D, Glaser DE, Arieli A, Kenet T, Wijnbergen C, Toledo Y, Hildesheim R, Grinvald A. Imaging cortical dynamics at high spatial and temporal resolution with novel blue voltage-sensitive dyes. Neuron. 1999;24:791–802. doi: 10.1016/S0896-6273(00)81027-2. [DOI] [PubMed] [Google Scholar]
- Silasi G, Boyd JD, Ledue J, Murphy TH. Improved methods for chronic light-based motor mapping in mice: automated movement tracking with accelerometers, and chronic EEG recording in a bilateral thin-skull preparation. Front Neural Circuits. 2013;7:123. doi: 10.3389/fncir.2013.00123. [DOI] [PMC free article] [PubMed] [Google Scholar]
- Sirotin YB, Das A. Spatial relationship between flavoprotein fluorescence and the hemodynamic response in the primary visual cortex of alert Macaque monkeys. Front Neuroenergetics. 2010;2:6. doi: 10.3389/fnene.2010.00006. [DOI] [PMC free article] [PubMed] [Google Scholar]
- Stosiek C, Garaschuk O, Holthoff K, Konnerth A. In vivo two-photon calcium imaging of neuronal networks. Proc Natl Acad Sci U S A. 2003;100:7319–7324. doi: 10.1073/pnas.1232232100. [DOI] [PMC free article] [PubMed] [Google Scholar]
- Stroh A, Adelsberger H, Groh A, Ruhlmann C, Fischer S, Schierloh A, Deisseroth K, Konnerth A. Making waves: initiation and propagation of corticothalamic Ca2+ waves in vivo. Neuron. 2012;77:1136–1150. doi: 10.1016/j.neuron.2013.01.031. [DOI] [PubMed] [Google Scholar]
- Theyel BB, Llano DA, Sherman SM. The corticothalamocortical circuit drives higher-order cortex in the mouse. Nat Neurosci. 2010;13:84–88. doi: 10.1038/nn.2449. [DOI] [PMC free article] [PubMed] [Google Scholar]
- Tian L, Hires SA, Mao T, Huber D, Chiappe ME, Chalasani SH, Petreanu L, Akerboom J, McKinney SA, Schreiter ER, Bargmann CI, Jayaraman V, Svoboda K, Looger LL. Imaging neural activity in worms, flies and mice with improved GCaMP calcium indicators. Nat Methods. 2009;6:875–881. doi: 10.1038/nmeth.1398. [DOI] [PMC free article] [PubMed] [Google Scholar]
- Vanni MP, Provost J, Casanova C, Lesage F. Bimodal modulation and continuous stimulation in optical imaging to map direction selectivity. Neuroimage. 2010;49:1416–1431. doi: 10.1016/j.neuroimage.2009.09.044. [DOI] [PMC free article] [PubMed] [Google Scholar]
- Vanzetta I, Grinvald A. Coupling between neuronal activity and microcirculation: implications for functional brain imaging. HFSP J. 2008;2:79–98. doi: 10.2976/1.2889618. [DOI] [PMC free article] [PubMed] [Google Scholar]
- Wang Z, Chen LM, Négyessy L, Friedman RM, Mishra A, Gore JC, Roe AW. The relationship of anatomical and functional connectivity to resting-state connectivity in primate somatosensory cortex. Neuron. 2013;78:1116–1126. doi: 10.1016/j.neuron.2013.04.023. [DOI] [PMC free article] [PubMed] [Google Scholar]
- White BR, Bauer AQ, Snyder AZ, Schlaggar BL, Lee JM, Culver JP. Imaging of functional connectivity in the mouse brain. PLoS One. 2011;6:e16322. doi: 10.1371/journal.pone.0016322. [DOI] [PMC free article] [PubMed] [Google Scholar]
- Winship IR, Plaa N, Murphy TH. Rapid astrocyte calcium signals correlate with neuronal activity and onset of the hemodynamic response in vivo. J Neurosci. 2007;27:6268–6272. doi: 10.1523/JNEUROSCI.4801-06.2007. [DOI] [PMC free article] [PubMed] [Google Scholar]
- Yamashita T, Pala A, Pedrido L, Kremer Y, Welker E, Petersen CC. Membrane potential dynamics of neocortical projection neurons driving target-specific signals. Neuron. 2013;80:1477–1490. doi: 10.1016/j.neuron.2013.10.059. [DOI] [PubMed] [Google Scholar]
- Yuste R. Dendritic spines and distributed circuits. Neuron. 2011;71:772–781. doi: 10.1016/j.neuron.2011.07.024. [DOI] [PMC free article] [PubMed] [Google Scholar]
- Zariwala HA, Borghuis BG, Hoogland TM, Madisen L, Tian L, De Zeeuw CI, Zeng H, Looger LL, Svoboda K, Chen TW. A Cre-dependent GCaMP3 reporter mouse for neuronal imaging in vivo. J Neurosci. 2012;32:3131–3141. doi: 10.1523/JNEUROSCI.4469-11.2012. [DOI] [PMC free article] [PubMed] [Google Scholar]
- Zepeda A, Arias C, Sengpiel F. Optical imaging of intrinsic signals: recent developments in the methodology and its applications. J Neurosci Methods. 2004;136:1–21. doi: 10.1016/j.jneumeth.2004.02.025. [DOI] [PubMed] [Google Scholar]
- Zingg B, Hintiryan H, Gou L, Song MY, Bay M, Bienkowski MS, Foster NN, Yamashita S, Bowman I, Toga AW, Dong HW. Neural networks of the mouse neocortex. Cell. 2014;156:1096–1111. doi: 10.1016/j.cell.2014.02.023. [DOI] [PMC free article] [PubMed] [Google Scholar]