

Abstract
Animals need to discriminate differences in spatiotemporally distributed sensory signals in terms of quality as well as quantity for generating adaptive behavior. Olfactory signals characterized by odor identity and concentration are intermittently distributed in the environment. From these intervals of stimulation, animals process odorant concentration to localize partners or food sources. Although concentration–response characteristics in olfactory neurons have traditionally been investigated using single stimulus pulses, their behavior under intermittent stimulus regimens remains largely elusive. Using the silkmoth (Bombyx mori) pheromone processing system, a simple and behaviorally well-defined model for olfaction, we investigated the neuronal representation of odorant concentration upon intermittent stimulation in the naturally occurring range. To the first stimulus in a series, the responses of antennal lobe (AL) projection neurons (PNs) showed a concentration dependence as previously shown in many olfactory systems. However, PN response amplitudes dynamically changed upon exposure to intermittent stimuli of the same odorant concentration and settled to a constant, largely concentration-independent level. As a result, PN responses emphasized odorant concentration changes rather than encoding absolute concentration in pulse trains of stimuli. Olfactory receptor neurons did not contribute to this response transformation which was due to long-lasting inhibition affecting PNs in the AL. Simulations confirmed that inhibition also provides advantages when stimuli have naturalistic properties. The primary olfactory center thus functions as an odorant concentration differentiator to efficiently detect concentration changes, thereby improving odorant source orientation over a wide concentration range.
Keywords: adaptation, insect, olfaction, sensory intensity
Introduction
Animals use concentration information to approach attractive odorant sources (Baker and Roelofs, 1981; Gomez-Marin et al., 2011; Khan et al., 2012; Takasaki et al., 2012). To reveal how olfactory neurons encode intensity information, concentration–response characteristics of a wide variety of neuron–odor combinations have been studied in different animals (Boeckh and Boeckh, 1979; Kanzaki and Shibuya, 1986; Friedrich and Korsching, 1997; Wang et al., 2003; Hallem and Carlson, 2006; Meeks et al., 2010; Fujiwara et al., 2014). Neuronal responses generally show a concentration-dependent increase for well-separated single stimulus odorant pulses. In natural environments, however, olfactory signals are discontinuously distributed in space and time, resulting in short intervals between stimuli (Justus et al., 2002). The dynamics of concentration–response characteristics of neurons under these relevant conditions are largely unknown. Male moth pheromone processing systems have been investigated as convenient models of odorant source orientation due to the well-defined behaviors they generate and the quantitative simplicity of the neuronal circuits (Hildebrand, 1996). In male silkmoths, (E,Z)-10,12-hexadecadienol (bombykol), the major female sex pheromone component, is sufficient to trigger male orientation behavior (Butenandt et al., 1959). Olfactory receptor neurons (ORNs) expressing BmOR1, the bombykol receptor, deliver bombykol information to the toroid, a large glomerulus of the macroglomerular complex (MGC) in the antennal lobe (AL), the primary olfactory center (Sakurai et al., 2004, 2011). In the toroid, information is processed by projection neurons (PNs) (Kanzaki and Shibuya, 1983; Kanzaki et al., 2003) and inhibitory local interneurons (LNs) (Iwano and Kanzaki, 2005; Seki and Kanzaki, 2008).
To understand how it is possible that moths discriminate concentrations of stimuli that are received sequentially, we investigated the dynamics of concentration–response characteristics of ORNs and AL PNs innervating the toroid using intermittent bombykol stimuli. The responses of ORNs were measured in the axonal arborizations directly presynaptic to the PNs taking advantage of the accessibility of transgenesis in silkmoths by expressing GCaMP, a genetically encoded calcium indicator, exclusively in the bombykol responsive ORNs. The difference in response characteristics between first- and second-order neurons revealed a novel transformation of odorant concentration coding downstream of the ORN-PN synapses in the AL, which was due to inhibitory circuitry in the AL. These inhibitory mechanisms in the AL are involved in transforming the encoding of absolute odorant concentration in ORNs into an encoding of relative concentrations in PNs to allow efficient detection of concentration differences upon exposure to intermittent stimuli. To test the significance of inhibition for concentration discrimination in the presence of naturalistic stimuli composed of fluctuating odorant concentrations and interstimulus intervals, we implemented a model of AL reflecting the inhibitory properties we identified in physiological experiments. Using dynamic stimulus inputs inferred from electroantennogram (EAG) responses to a female releasing pheromone, we show that inhibition within the AL improves odorant concentration discrimination in PN responses under natural stimulus conditions.
Materials and Methods
Animals.
Male and female silkmoth larvae (Bombyx mori L.) were reared on an artificial diet (Silk Mate 1–3S; Nosan Bio Department) at 26°C and 60% relative humidity under a 16:8 h (light/dark) light cycle or bought at pupal stage (Nikko Marketing). The imagines were used 1–6 d after eclosion.
Vector construction and generation of a transgenic moth line.
Plasmid DNA containing GCaMP2 (pN1-GCaMP2) (Tallini et al., 2006) was kindly provided by Dr. J. Nakai of Saitama University. The HindIII-EcoRI fragment of pUAST (Brand and Perrimon, 1993) containing the upstream activation sequence (UAS) and TATA element of the Drosophila melanogaster was inserted into corresponding sites of pEGFP-N1 (Clontech) to create pUAS-EGFP-N1. The BglII-NotI fragment of pN1-GCaMP2 that contains GCaMP2 and SV40 polyadenylation signal sequence was inserted into BamHI-NotI sites of pUAS-EGFP-N1. The resulting vector was named pUAS-GCaMP2-N1, obtained by replacing EGFP in pUAS-EGFP-N1 by GCaMP2. pUAS-GCaMP2-N1 was digested with BglII and AflII, and the AflII restriction end was ligated with adapter DNA (TTAATAGATCTA) that contained a BglII site. Then, the ligated DNA was digested with BglII and subcloned into the BgllII site of pBacMCS2 containing additional PmeI and FseI restriction sites immediately upstream of the ClaI site of pBacMCS (Uchino et al., 2006) to create pBacUAS-GCaMP2. The DNA fragment for a screening marker that consists of fibroin light-chain (FibL) promoter, DsRed monomer, and 3′UTR of fibL gene (FibL-DsRed) was amplified using PrimeStar DNA polymerase (Takara), pBacUAS-PxOR1 (Sakurai et al., 2011) as template and the primers 5′-TGCTAGCCACTAAAGGGAACAAAAGCTGG-3′ and 5′-TGCTAGCCACTATAGGGCGAATTGGGTACC-3′. The DNA fragment was inserted into the BamHI site of pBacUAS-GCaMP2 after the site was blunted with T4 DNA polymerase (Takara). The resultant vector was named pBacUAS-GCaMP2-FibLDsRed (see Fig. 4A).
Figure 4.
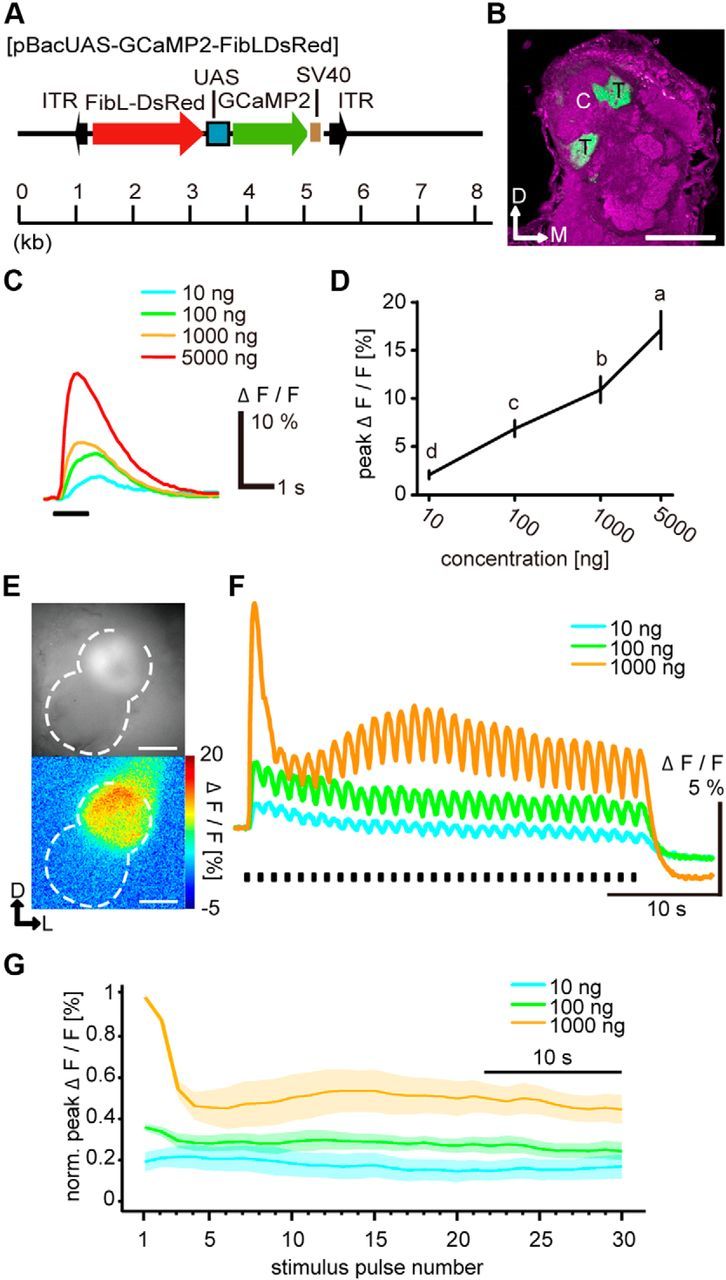
ORN responses to intermittent bombykol stimuli. A, Schematic diagrams of the piggyBac vector, pBacUAS-GCaMP2, used to generate UAS-GCaMP2. FibL-DsRed indicates a screening marker that drives DsRed expression in silk glands. ITR, Inverted terminal repeats of the piggyBac transposon; SV40, SV40 polyadenylation signal. B, Representative confocal image of the AL of a BmOR1-GAL4/UAS-GCaMP2 male moth. The axon terminals of bombykol receptor neurons expressing GCaMP (green) were localized in the toroid. Background staining was performed with an anti-synaptotagmin antibody to visualize neuropil structures (magenta). Representative confocal sections are shown. C, Cumulus; T, toroid; D, dorsal; M, medial. Scale bar, 100 μm. C, Representative GCaMP-expressing neuronal responses to single-pulse bombykol stimulus. Stimulus duration was 1 s. D, Concentration–response characteristics of GCaMP-expressing neurons to single-pulse bombykol stimulus (one-way repeated-measures ANOVA, F(3,5) = 48.33, p < 0.001) followed by Tukey–Kramer test (p < 0.05 for significant differences indicated by different letters associated with the data groups. Data are means. Error bars indicate SEM; n = 6. E, Fluorescence images of the terminal axonal arborization of GCaMP-expressing ORNs (top, averaged for 10 baseline frames) and their responses to 1000 ng bombykol in false colors (bottom). Dashed line indicates the outline of the AL. D, Dorsal; L, lateral. Scale bar, 100 μm. F, Representative time courses of ORN responses to intermittent bombykol stimuli. The stimulus duration of bombykol pulses was 200 ms at 1.2 s period. G, Dynamics of average normalized peak amplitudes of ORN responses (n = 6). Shaded areas represent SEM of the peak amplitudes.
Transgenic silkmoths were generated using the piggyBac-mediated germline transformation method, as described previously (Tamura et al., 2000, 2007). To direct the expression of GCaMP2 in bombykol receptor neurons, UAS-GCaMP2 moths were crossed with BmOR1-GAL4 moths that express GAL4 in bombykol receptor neurons (Sakurai et al., 2011). Progeny carrying both UAS-GCaMP2 and BmOR1-GAL4 transgenes was used for calcium imaging experiments.
The brains of the BmOR1-GAL4/UAS-GCaMP2 male moths were fixated overnight at 4°C in 4% depolymerized PFA in PBS, rinsed in several changes of PBS containing 0.2% Triton X-100 (PBTX) and preincubated with 5% normal donkey serum and 5% normal goat serum in PBTX (PBTX-NDS-NGS) for 3 h at room temperature. Then, they were incubated with mouse anti-synaptotagmin monoclonal antibody (1:100) in PBTX-NDS-NGS at 4°C for 3 d. The mouse anti-synaptotagmin monoclonal antibody (3H2 2D7) developed by K. Zinn was obtained from the Developmental Studies Hybridoma Bank developed under the auspices of the National Institute of Child Health and Human Development and maintained by the University of Iowa, Department of Biology (Iowa City, Iowa). Next, the brains were rinsed in PBTX and incubated with Cy3-conjugated anti-mouse IgG antibodies (1:200; Jackson ImmunoResearch Laboratories) in PBTX-NDS-NGS at 4°C overnight. The labeled brains were viewed under a confocal laser scanning microscope (LSM510; Carl Zeiss). GCaMP2 was excited with an argon laser at 488 nm, and fluorescence was recorded with a 505–550 nm bandpass filter. Cy3 was excited with a HeNe laser at 543 nm, and fluorescence was recorded with a 560 nm long-pass filter. Serial optical sections were acquired in 0.8 μm intervals and at a size of 512 × 512 pixels. Confocal images were adjusted for contrast and brightness using Adobe Photoshop CS (Adobe Systems).
Animal preparation.
The abdomen, legs, and dorsal side of the thorax were removed, and the moths were mounted in a plastic holder. The brain was exposed and superfused with saline solution (140 mm NaCl, 5 mm KCl, 7 mm CaCl2, 1 mm MgCl2, 4 mm NaHCO3, 5 mm trehalose, 5 mm N-tris [hydroxymethyl] methyl-2-aminoethanesulfonic acid, and 100 mm sucrose, pH 7.0). The intracranial muscles, parts of the compound eyes, and the tracheae around the AL were removed, and the AL was surgically desheathed.
EAG recording.
Glass micropipettes with silver chloride wire were filled with Ringer's solution and inserted into the distal and proximal ends of a male antenna mounted in a portable chamber. To protect them from drying, the cut ends of the antenna were covered by gel (SPECTRA 360; Parker Laboratories). At first, we positioned the portable chamber in front of our odor delivery system, which was used in other physiological experiments, and measured EAG responses to synthetic bombykol. The EAG responses were amplified (MEZ-8300; Nihon Kohden), low-pass filtered at 5 kHz, and digitized at 10 kHz (USB-6009; National Instruments). Then, we moved the portable chamber to a wind tunnel and positioned it 10 cm downwind from a female to measure EAG responses to female-emitted pheromones. The wind tunnel was made of Styrofoam boards (Dow Chemical, W 840 mm × H 300 mm × L 1800 mm) and connected to an exhaust duct to produce a constant air flow of 0.5 m/s average speed. Voltage was amplified and low-pass filtered at 5 kHz by a custom made amplifier (S.S.H.) and digitized at 10 kHz (USB-6215, National Instruments). After the recording in the wind tunnel, we measured the responses to synthetic bombykol again and discarded samples in which the response amplitude to the strongest bombykol stimulus was decreased by >40% compared with the first measurement.
Physiology.
Imaging was performed with a CCD camera (iXonEM+ EMCCD DU-897E; Andor Technology) using a 20× (XLUMPFLN 20XW, NA 1.0) water-immersion lens on a fluorescence microscope (BX51WI; Olympus) with U-MWIBA3 filter set (Olympus). The exposure time was 100 ms. The interval between trials was at least 1 min. For loose-patch recording, the preparation was treated with enzymes (Kloppenburg et al., 1999) (collagenase, 038–10531; Wako, 0.5 mg/ml, dispase, D4693; Sigma, 2 mg/ml) at room temperature for 5–10 min. The recording of PNs was performed using micropipettes (3–5 mΩ) filled with AlexaFluor-568 (A-10441; Invitrogen, 0.1 mm in saline) to visualize the tip. Voltage was amplified, filtered, and digitized in the same way as EAG responses.
Stimulation.
Synthetic bombykol, the principal pheromone component of B. mori, was dissolved in n-hexane. A glass cartridge (5 mm inner diameter) was prepared for stimulation by inserting a piece of filter paper (1 × 2 cm) containing 5 μl of solution of the dissolved odorant or n-hexane as control. The odorant was delivered by switching a 3/2 solenoid valve (YDV-3-1/8; Takasago Electric) with constant air flow (1 l/min) from control cartridge to pheromone cartridge.
Pharmacology.
Picrotoxin (PTX, 168-17961; Wako) was prepared as a 250 mm stock in DMSO and used at a final concentration of 50 μm in silkmoth ringer. Neuronal responses were measured after 10 min bath application of the drug. Recovery was not tested because of the considerable amount of time required to wash out drugs (Waldrop et al., 1987), in particular hydrophobic compounds, such as PTX, applied at elevated concentrations to block an appreciable fraction of inhibition.
Data analysis.
Data were processed using MATLAB (MathWorks) and Excel (Microsoft). For imaging, per-pixel baseline fluorescence was determined as an average over 10 frames (1 s) before stimulation, and relative fluorescence changes (ΔF/F) with respect to the baseline fluorescence were calculated. Data were spatially averaged in ROIs defined as the pixels 2 SD brighter than the average of all pixels. The exponential decay due to bleaching was removed by subtracting time courses recorded using the control stimulus. ORNs did not respond to the control stimulus. A Gaussian filter was applied to the color-coded images with a five pixel kernel (σ = 1). Values were normalized on the maximum response within each preparation. Loose-patch recording data of PNs were high-pass filtered at 100 Hz and smoothed (5 point moving average). The responses to bombykol were always phasic, and spontaneous spikes were exceptional; therefore, we could simply calculate the peak instantaneous spike frequency and spike counts for each stimulus. Spike response duration was defined as the duration between the time of first and last spikes to an odorant stimulus. The data from EAG recordings were bandpass filtered (0.03–10 Hz) and smoothed (moving average for 0.1 s). To extract single-response events putatively induced by single odorant filaments from the EAG responses measured in the wind tunnel, the data were additionally low-pass filtered (2 Hz) and local minima were defined as peaks of each response event by thresholding based on the slope of the rising and falling phases. A time interval of 200 ms before a peak was defined as the rising phase; the first 500 ms after a peak was defined as the falling phase. The average value of data points preceding rising phases around a peak by >200 ms and >500 ms after falling phases around a peak was defined as baseline. The amplitude of each response event was calculated by subtracting the baseline voltage from the peak voltage. The rising slope of each response event was calculated by fitting the points in the rising phase to a linear function. For analyzing the EAG responses to synthetic bombykol pulses, the mean voltage over 1 s before the stimulus onset was defined as baseline. The amplitude and the rising slope were calculated as described above. For the responses to synthetic bombykol, we averaged the values of the trials before and after the recording in the wind tunnel. All values were normalized on the highest response to synthetic bombykol within each preparation. Normalized responses to synthetic bombykol and single-response events to pheromone released by a female were compared.
For comparing ORN- and PN-evoked response levels between stimulus concentrations in the settled state occurring at the end of stimulus pulse trains, we defined “average settled response level” as the average of responses to the last 10 stimuli in the pulse train, calculated for each individual experiment. For comparing concentration–response relations, we defined “concentration dependence” as the slope of individual concentration–response curves. These curves consist of 3 points (odorant concentrations) for intermittent stimuli.
Simulation.
In the model, a PN has an excitatory conductance (ge) activated by odorant-induced ORN activity and an inhibitory conductance (gi) activated by LN input. The summation of the two conductances is transformed into PN peak firing rate (RPN) (see Fig. 7A) by the transfer function F as follows:
 |
Excitatory and inhibitory conductances were described as convolutions of stimulus-induced response amplitudes of ORNs (RORN) or LNs (RLN) with exponential functions:
 |
 |
where t is time (in 10 ms bins), τe is the time constant of ge (200 ms), tdelay and τi are the onset delay (100 ms) and the time constant of gi (1200 ms, except for Fig. 7I, where the time constant was varied in the range of 0.1–2 s).
Figure 7.
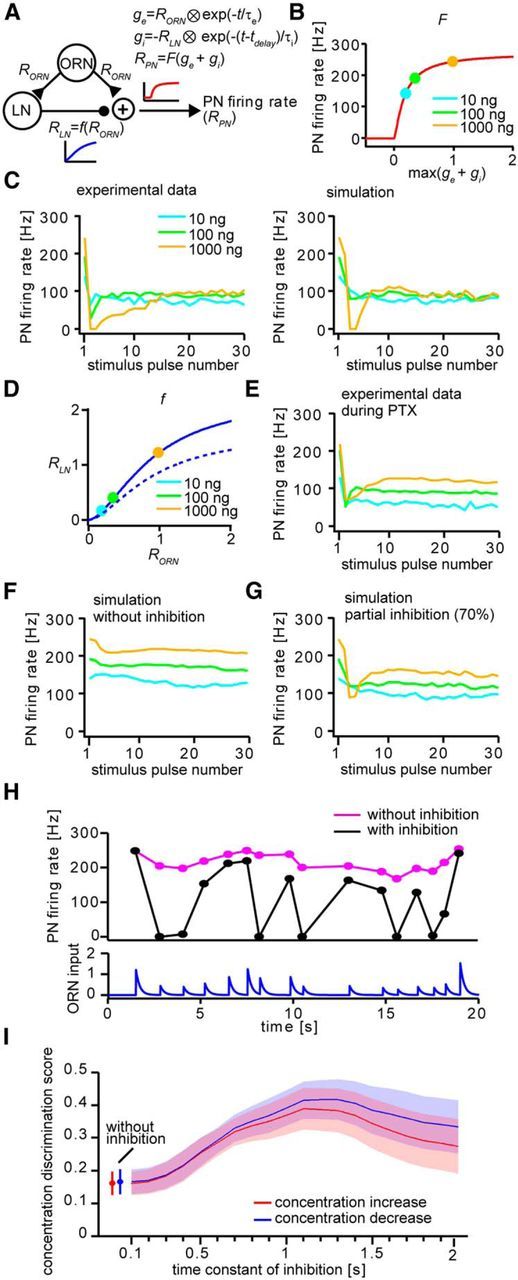
Simulation of PN responses. A, Schematic diagram of the model. RORN, RLN, and RPN, Response amplitudes of ORN, LN, and PN, respectively; ge, excitatory synaptic conductance of LN and PN activated by ORN input; gi, inhibitory synaptic conductance of PN activated by LN; τe and τi, time constants of excitatory and inhibitory conductances; tdelay, onset delay of inhibitory conductance; t, time; F, transfer function of PN from synaptic conductance to firing rate (shown in B); f, transfer function to determine LN response amplitude (shown in D). B, Transfer function of PN from synaptic conductance to firing rate. Markers indicate the corresponding odorant concentrations used in the actual experiments at gi = 0. max(ge + gi), the local maximum of ge + gi for a stimulus. C, PN responses in the actual experiment (left, same as Fig. 2D) and fitted PN responses in the simulation (right) to intermittent odorant stimuli. D, Transfer function to determine LN response amplitude (solid curve). Markers indicate the corresponding odorant concentrations used in the actual experiments. The transfer function for partial inhibition (dashed curve, corresponding to the result shown in G) was generated by decreasing the maximum amplitude (RLNmax) by 30%. E, Electrophysiologically recorded PN responses to intermittent odorant stimuli during application of PTX in the actual experiment to intermittent odorant stimuli (same as Fig. 5B). F, Simulated PN responses in the simulation to intermittent odorant stimuli without inhibition. G, Simulated PN responses in the simulation to intermittent odorant stimuli with partial inhibition (70%). H, Representative simulated PN responses to naturalistic odorant stimuli with (black) and without (magenta) inhibition. Traces below the figures show the time course of ORN input to the PN and LN. I, Effect of inhibition time constant on odorant discrimination performance. Shown are average odorant concentration discrimination scores (error bars or shaded areas represent SEM; n = 8) for concentration increase (red) and decrease (blue) for inhibition time constants in the range of 0.1–2 s.
The transfer function F was described as a Hill equation (see Fig. 7B) as follows:
 |
where max(x) is the local maximum of x between the onset of a stimulus and the onset of the following stimulus. PN maximum firing rate (RPNmax) was set to 270 Hz based on published data (Fujiwara et al., 2014). The Hill coefficient (nPN = 1.27) and the half-maximal effective concentration (EC50PN = 0.178) were determined by fitting (using the MATLAB nlinfit function, R2 = 0.9993) the dataset of the average ORN response amplitudes to the first stimulus shown in Figure 4 (for x) and average PN peak firing rates to the first stimulus shown in Figure 2 (for F(x)) to the function F based on the assumption that PN peak firing rates to the first stimulus are exclusively resulting from activation by the excitatory conductance component.
Figure 2.
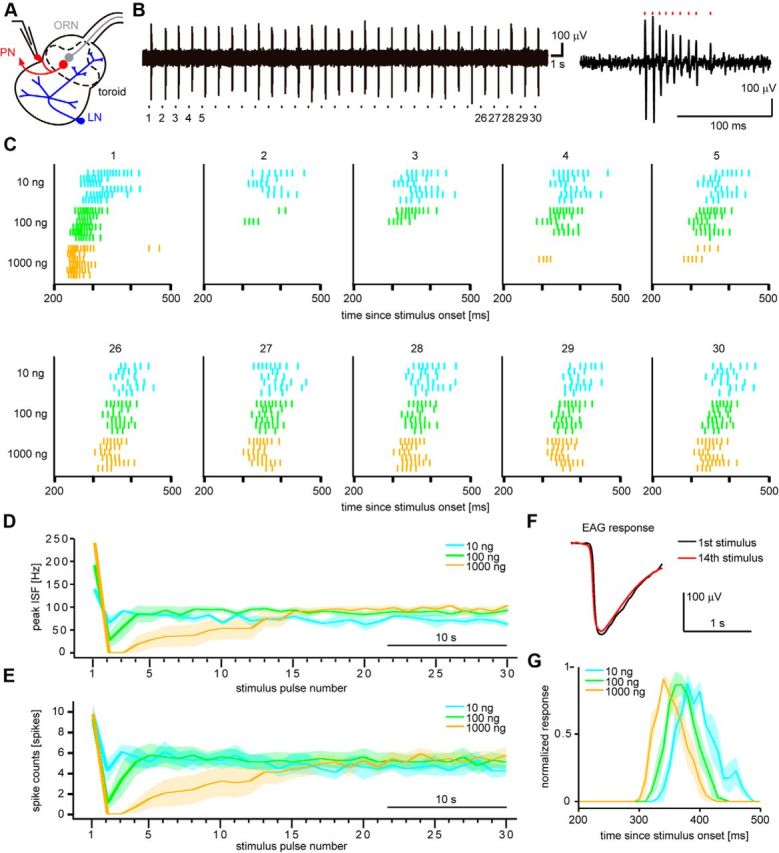
PN responses to intermittent bombykol stimuli. A, Schematic diagram of the antennal lobe of the male silkmoth showing bombykol-responsive ORNs (gray), bombykol-responsive PNs (red), and local interneurons (LNs, blue). Dashed line indicates the toroid glomerulus processing bombykol information. Loose-patch recording was performed at PN somata. B, Representative example of PN responses to 10 ng bombykol intermittent stimuli (left). Stimulus pulse numbers corresponding to the raster plots in C are indicated under the recording trace. The response to the first stimulus pulse is shown in the rightmost panel. Red markers indicate the occurrences of spikes. The stimulus duration of the pheromone pulses was 200 ms at 1.2 s period. C, Raster plots of PN responses to the first to fifth stimulus pulses (top) and to the 26th to 30th pulses (bottom) (n = 6). D, E, Dynamics of average peak ISF (D) and average spike counts (E) of PN responses (n = 6). F, Representative example of EAG responses to the first stimulus pulse (black) and to the 14th stimulus pulse (red) of a series of 1000 ng bombykol pulses. To prevent adaptation, antennae were covered by a slide glass between the two recordings while stimuli were continuously delivered at 1.2 s interval. G, Peristimulus time histograms (10 ms bins) of PN responses in the settled state (n = 6). Responses to last 10 stimuli were averaged and normalized for each concentration within preparations. Shaded areas represent SEM.
RLN was also defined as a Hill equation (see Fig. 7D) as follows:
 |
The values of LN maximum response amplitude (RLNmax = 2.3), Hill coefficient (nLN = 1.7), and half-maximal effective concentration (EC50LN = 0.9) were determined by minimizing that the difference of simulated PN peak firing rates (using ORN response amplitudes from Fig. 4 as input) and actual PN peak firing rates (see Fig. 2) to intermittent stimuli summing over all stimulus pluses and concentrations (see Fig. 7C,D).
Using these parameters, we simulated PN responses to naturalistic odorant inputs that contain fluctuations in stimulus concentration and interval (see Fig. 7H). EAG responses to females emitting pheromones from 8 datasets were used as inputs (see Fig. 1). Response amplitudes of single EAG components were linearly transformed into RORN by scaling such that RORN to an odorant stimulus of a concentration produced by 1000 ng bombykol corresponded to the mean response amplitude of single EAG components. An odorant concentration discrimination score was defined as the average PN peak firing rate increase (decrease) for odorant concentration increase (decrease) events in the time sequence of EAG responses. These scores were normalized by RPNmax. In the model without inhibition, PN peak firing rates were calculated exclusively based on the excitatory conductance component.
Figure 1.

EAG responses to synthetic bombykol and females emitting pheromones. A, EAG responses to synthetic bombykol pulses of different odorant concentrations and 200 ms duration. B, EAG response from the same antenna as in A to pheromones emitted by a female in a wind tunnel. C, D, Normalized EAG amplitudes (C) and rising slopes (D) of responses to synthetic bombykol and pheromones emitted by females. For pheromones emitted by females, maximum and mean responses of the single EAG components are shown (one-way repeated-measures ANOVA): for amplitudes, F(7,7) = 170.28, p < 0.001; for rising slopes, F(7,7) = 119.00, p < 0.001. p < 0.05, significant differences indicated by different letters associated with the data groups (Tukey–Kramer test). Data are means; error bars indicate SEM; n = 8.
Unless otherwise noted, a one-way repeated-measures ANOVA followed by the Tukey–Kramer test was used to compare among multiple groups, and the Wilcoxon signed-rank test was used to compare between two groups. Data are shown as mean ± SEM, unless indicated otherwise.
Results
Estimating the concentration range of female-emitted bombykol
To use behaviorally relevant stimuli for characterizing neurons, we investigated the concentration range of bombykol that male silkmoths encounter under natural circumstances. Using EAGs from male antennae, we compared synthetic bombykol concentrations delivered by our stimulator system to the amount of female-emitted pheromone. The EAG amplitude monotonically increased with increasing concentration of synthetic bombykol (Fig. 1A). Using the same antennae, we also recorded EAG responses to pheromone emitted by females (Fig. 1B). We detected individual response events from the EAG, each of which is supposed to be induced by a single odorant filament. The maximum amplitudes for single events corresponded to responses elicited by 1000–5000 ng synthetic bombykol in our stimulator system (Fig. 1C). The mean amplitudes of single-response events were comparable with the responses to stimulation with 1000 ng bombykol (Fig. 1C). Results were similar when using EAG response rising slopes for the analysis (Fig. 1D). Although female-emitted pheromones contain a second component, bombykal, it can be omitted in EAG responses because of its small fraction (Kaissling and Kasang, 1978). According to these results, we defined 1000–2000 ng as “high” stimulus concentration in the following experiments. For convenience, we defined 10 ng as the “low” concentration and 100 ng as a “medium” concentration. The frequency of the EAG individual events was 0.79 ± 0.05 Hz (n = 8, mean ± SEM), and we therefore used a comparable stimulus interval (1200 ms, corresponding to 0.83 Hz) in the following experiments.
Dynamic representation of odorant concentration in AL PNs
We investigated how bombykol concentration is represented upon exposure to intermittent stimuli at the output of the AL (Fig. 2A). We recorded spike responses of PNs innervating the toroid (henceforth just PNs) to bombykol pulse trains of three concentrations by loose-patch voltage recording (Fig. 2A). PNs showed phasic spike trains to each stimulus pulse (Fig. 2B). In response to the first stimulus, the peak instantaneous frequency (peak ISF) increased as the concentration increased (Fig. 2C,D; F(2,5) = 43.24, Tukey–Kramer test: p < 0.05 among all concentrations, n = 6). For spike counts, there were no significant differences among the concentrations (Fig. 2C,E; F(2,5) = 0.59, p = 0.57, n = 6). Responses showed dynamic transitions for subsequent stimuli (Fig. 2C–E). At low concentration, the peak ISF and the spike counts decreased upon the second stimulus and settled to a relatively constant level for subsequent stimuli. At medium and high concentrations, once PNs received a bombykol stimulus, the responses to the subsequent stimuli were largely suppressed. The responses gradually recovered over the following stimulus pulses and settled to a stable level. Once settled, responses were concentration-independent for medium and high concentrations (Fig. 2C–E; F(2,5) = 13.39, Tukey–Kramer test: p > 0.05 for average settled response levels to 100 and 1000 ng for both peak ISF and spike counts, n = 6). This can be likened to the action of a differentiator. Early response suppression was not due to concentration decrease related to cartridge stimulation because EAG response amplitudes did not significantly change over stimulus pulses with our odorant delivery system (Fig. 2F; peak EAG responses were 82.1 ± 14.7 μV for first stimulus pulse and 90.2 ± 16.1 μV for 14th stimulus pulse, p = 0.20, n = 9; antenna was covered by a glass deflector between the two measurements).
For single odorant stimulus pulses, ORNs show concentration-independent response dynamics while representing concentration information in their response amplitudes (Martelli et al., 2013), suggesting the possibility of different concentration representations in response dynamics and response amplitudes. We also investigated PN response dynamics in the settled state (Fig. 2G). Response duration was shorter at higher compared with lower stimulus concentrations (64.2 ± 11.0, 54.9 ± 7.0, and 50.1 ± 7.0 ms at 10, 100, and 1000 ng, respectively; F(2,5) = 0.59, Tukey–Kramer test: p < 0.05 between 10 and 1000 ng, n = 6) and response latency decreased in a concentration-dependent manner (360.9 ± 3.7, 339.2 ± 4.1, and 322.4 ± 4.4 ms at 10, 100, and 1000 ng, respectively; F(2,5) = 57.80, Tukey–Kramer test: p < 0.05 among all concentrations, n = 6). Therefore, absolute concentration information could be still relayed to downstream circuitry via response latency.
Functional role of the transformation of odorant concentration representation
After the transformation of concentration representation under intermittent stimulation, PN responses do not seem to represent absolute bombykol concentration as response levels in the settled state are largely independent of concentration. Then, what is represented after the transformation? One possibility is that the parameter odorant concentration is differentiated in PN responses, maintained at a concentration-independent level, whereas pulse stimulus concentration remains constant among pulses but changing dramatically upon concentration changes. This could maximize the capability to detect small concentration changes in intermittently occurring odor stimuli. To test this idea, we changed the bombykol stimulus concentration after PN responses reached the settled state in response to intermittent stimuli. In this experimental paradigm, we either increased the concentration to a twofold higher level (from 1000 to 2000 ng) or decreased the concentration by a factor of 10 (from 1000 to 100 ng) based on the amplitudes of EAG responses (corresponding to the input of the system) that change approximately threefold in either direction. Just after increasing the concentration, peak ISF and spike counts increased significantly (Fig. 3A,B; p < 0.05 between the responses to the 30th and 31st stimuli for both peak ISF and spike counts, n = 7). To the subsequent stimuli of the higher concentration, PN responses were suppressed again and finally settled at a constant level comparable with the amplitude before increasing stimulus concentration (Fig. 3A,B; p > 0.05 between average settled response levels in response to the lower and higher concentrations for both peak ISF and spike counts, n = 7). When we decreased the stimulus concentration instead, the responses were completely suppressed at first (Fig. 3C,D; p < 0.05 between the responses to the 30th and 31st stimuli in both peak ISF and spike counts, n = 6) and then gradually recovered (Fig. 3C,D; p > 0.05 between average settled response levels in response to the higher and lower concentrations for both peak ISF and spike counts, n = 6). These results support the idea that PNs function as odorant concentration differentiators and encode concentration changes rather than absolute concentrations under intermittent stimulus conditions.
Figure 3.
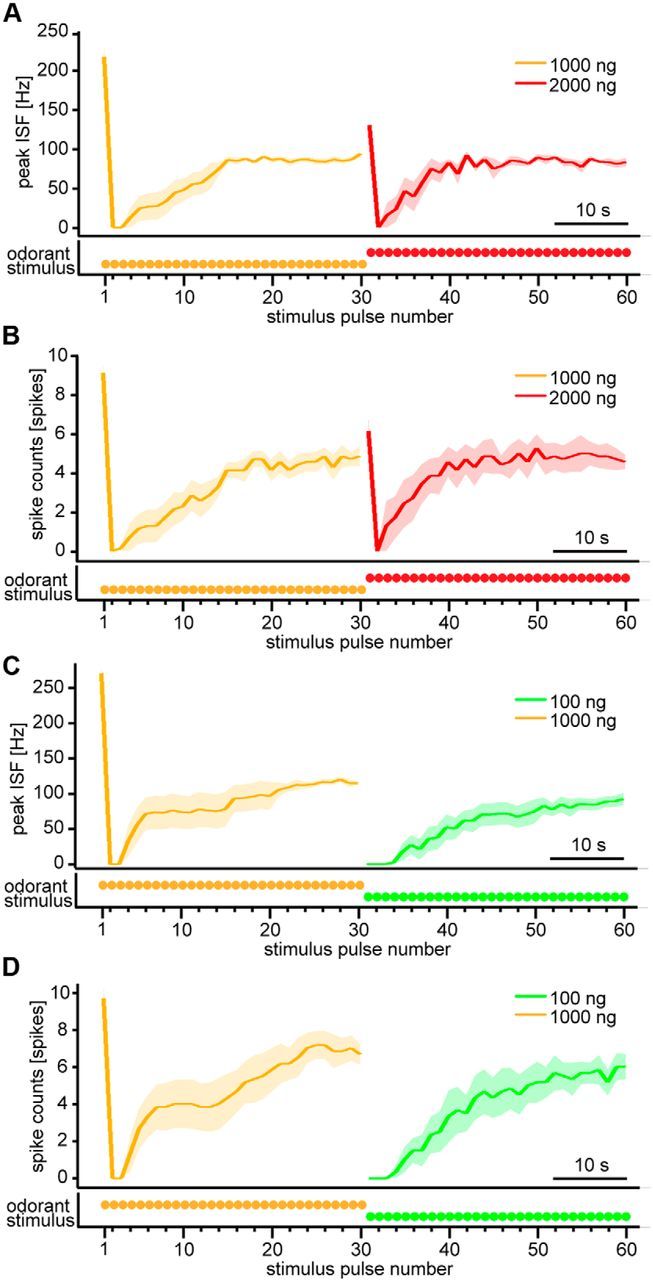
PN responses to intermittent bombykol stimuli upon odorant concentration changes in pulse trains. A, B, Dynamics of average peak ISF (A) and average spike counts (B) of PN responses with odorant concentration increase (n = 7). Odorant concentration was increased from 1000 to 2000 ng after the 30th stimulus pulse. C, D, Dynamics of peak ISF (C) and spike counts (D) of PN responses with odorant concentration decrease (n = 6). Odorant concentration was decreased from 1000 to 100 ng after the 30th stimulus pulse. The stimulus duration of the pheromone pulses was 200 ms at 1.2 s period. Traces below the figures represent stimulus timing and odorant concentration schematically. Shaded areas represent SEM of the responses.
Origin of the transformation of odorant concentration representation
Where is pheromone response differentiation occurring? To investigate the responses of ORNs to bombykol stimuli, we generated a transgenic moth line expressing GCaMP exclusively in BmOR1-expressing neurons, the bombykol-responsive ORNs (henceforth just ORNs) (Fig. 4A,B). The calcium responses in the terminal arborizations of ORN axons to single bombykol pulses increased in a concentration-dependent manner (Fig. 4C,D). When using intermittent stimuli, ORN responses were highest to the first stimulus and reduced for subsequent stimuli of high concentration (Fig. 4E–G). Although response levels changed upon intermittent stimulation and settled to a stable level over the course of a number of stimuli of the same concentration, there was a clear difference of response amplitudes to stimuli of different concentrations even in the settled state (Fig. 4F,G; F(2,5) = 51.95, Tukey–Kramer test: p < 0.05 among average settled response levels of all concentrations, n = 6). This indicates that the lack of concentration dependence of PN responses after settling to a stable level under intermittent stimulation is neither the result of presynaptic mechanisms acting on ORN axon terminals nor a property of ORN responses themselves.
The relative lack of concentration dependence of PN responses is therefore likely to be generated by other inputs the PNs receive. Previous research in the pheromone-processing circuit of sphinx moth, Manduca sexta, demonstrated that inhibition relayed via γ-aminobutyric acid type A receptors (GABAARs) in the AL affects the temporal pattern of PN responses (Waldrop et al., 1987; Christensen and Hildebrand, 1988; Christensen et al., 1998; Lei et al., 2009). Therefore, we investigated PN responses during application of PTX, a GABAAR antagonist. To the first stimulus, the spike counts were elevated under PTX at medium and high concentrations (Figs. 2C,E and 5A,C; p < 0.05 PTX against control at both 100 and 1000 ng, n = 6), whereas the peak ISF did not increase (Figs. 2C,D and 5A,B; p > 0.05 PTX against control, at all concentrations, n = 6). Comparing the raster plots before and during application of PTX shows that inhibition controls the spike counts of responses by shortening the response duration (Figs. 2C and 5A; response durations were 84.9 ± 12.7, 58.0 ± 7.0, and 80.8 ± 30.6 ms at 10, 100, and 1000 ng bombykol, respectively, under control conditions vs 104.3 ± 10.4, 127.7 ± 17.4, and 487.2 ± 137.4 ms at 10, 100, and 1000 ng bombykol, respectively, under PTX, p < 0.05 comparing PTX with control conditions at both 100 and 1000 ng bombykol, n = 6). The latency of the last spike after stimulus onset was longer under PTX than under control conditions (Figs. 2C and 5A; 369.0 ± 18.5, 311.5 ± 6.7, and 317.7 ± 30.8 ms, at 10, 100, and 1000 ng bombykol, respectively, under control conditions vs 407.4 ± 14.2, 392.7 ± 18.4, and 737.2 ± 135.2 ms at 10, 100, and 1000 ng, respectively, under PTX, p < 0.05 at all concentrations, n = 6). To the subsequent stimuli, response suppression at medium and high concentrations was reduced under PTX, and the peak ISF and the spike counts became concentration-dependent even after settling to a stable level (Fig. 5A–C, for peak ISF, F(2,5) = 30.47, Tukey–Kramer test: p < 0.05 among average settled response levels for all concentrations; for spike counts, F(2,5) = 33.79, Tukey–Kramer test: p < 0.05 among average settled response levels for all concentrations, n = 6). The concentration dependence of PN responses in the settled state during application of PTX was comparable with that of ORN responses (Fig. 5D,E; p > 0.05, n = 6), although it was significantly lower under control conditions (Fig. 5D,E; one-way ANOVA, F(4,5) = 22.05, Tukey–Kramer test: p < 0.05, n = 6). Together with the ORN responses, these results imply that postsynaptic inhibition clamps PN response levels in the settled state.
Figure 5.
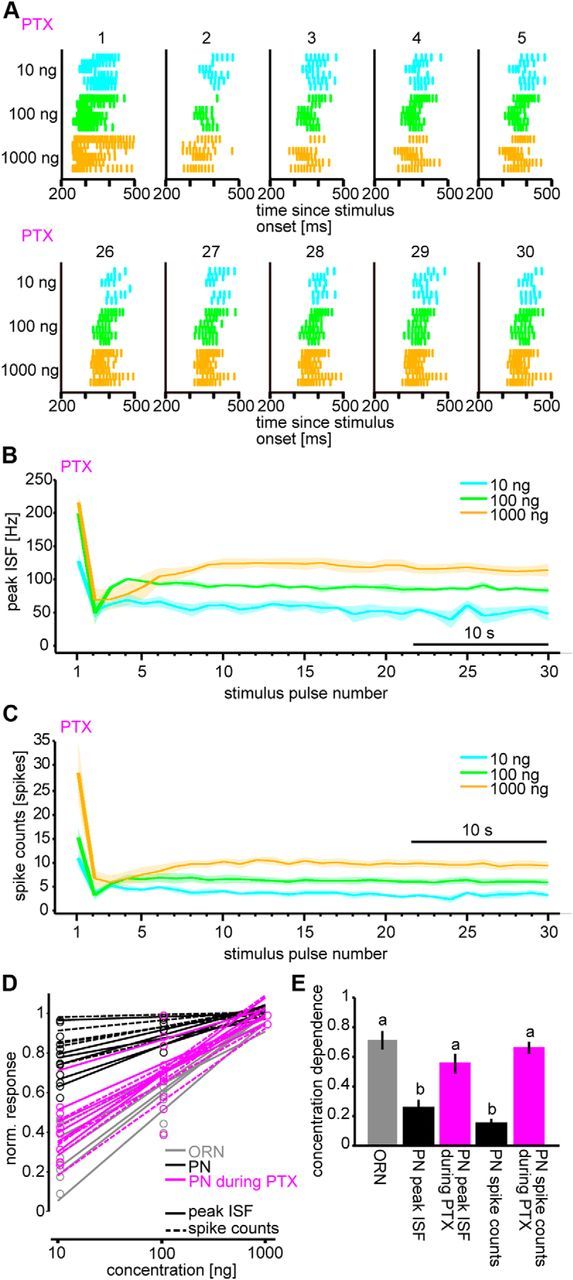
Responses of PNs to intermittent bombykol stimuli under GABAA receptor blockage with PTX. A, Raster plots of PN responses to the first through fifth stimulus pulses (top) and to the 26th through 30th pulses (bottom) during application of PTX (n = 6). B, C, Dynamics of average peak ISF (B) and average spike counts (C) in PN responses during application of PTX (n = 6; shaded areas represent SEM). D, Linear fits of normalized ORN responses from imaging data (gray) and normalized PN responses described by peak ISF (solid line) and spike counts (dashed line) before (black) and during application of PTX (magenta). The normalized responses calculated from average settled response levels to last 10 stimulus pulses at each odorant concentration are shown as circles. Values were normalized within each set of odorant concentrations for each parameter and pharmacological condition. E, Odorant concentration dependencies corresponding to the slopes of fitted curves in D. p < 0.05, significant differences indicated by different letters associated with the data groups (one-way ANOVA followed by Tukey–Kramer test). n = 6; data are mean ± SEM.
During application of PTX, the sensitivity of PN responses to concentration changes was partially lost in the paradigm with odorant concentration increase (Fig. 6A,B). The increase of peak ISF upon concentration increase (calculated as the ratio of the responses to 30th and 31st stimulus pulses) was significantly smaller under PTX than under control conditions (Fig. 6A; p < 0.05, n = 8). Although the increase of spike counts upon concentration increase was comparable between pharmacological conditions (Fig. 6B; p = 0.95, n = 8), the average settled level of spike counts at the higher concentration was significantly higher under PTX than in the controls (Fig. 6B; p < 0.01, n = 8) and became comparable with the counts just after increasing concentration (Fig. 6B; p = 0.84, n = 8), although there was a significant difference under control conditions (Fig. 6B; p < 0.01, n = 8). These results imply that an inhibitory mechanism sensitive to PTX is involved in clamping PN response levels in the settled state and thereby enhancing the responses upon odorant concentration increase in relative terms. Response suppression in PNs after decreasing the odorant concentration was not abolished under PTX (Fig. 6C,D; no spike responses in all PNs just after decreasing concentration in both pharmacological conditions, n = 6), suggesting that a PTX-independent mechanism is responsible for response suppression upon decrease of odorant concentration.
Figure 6.
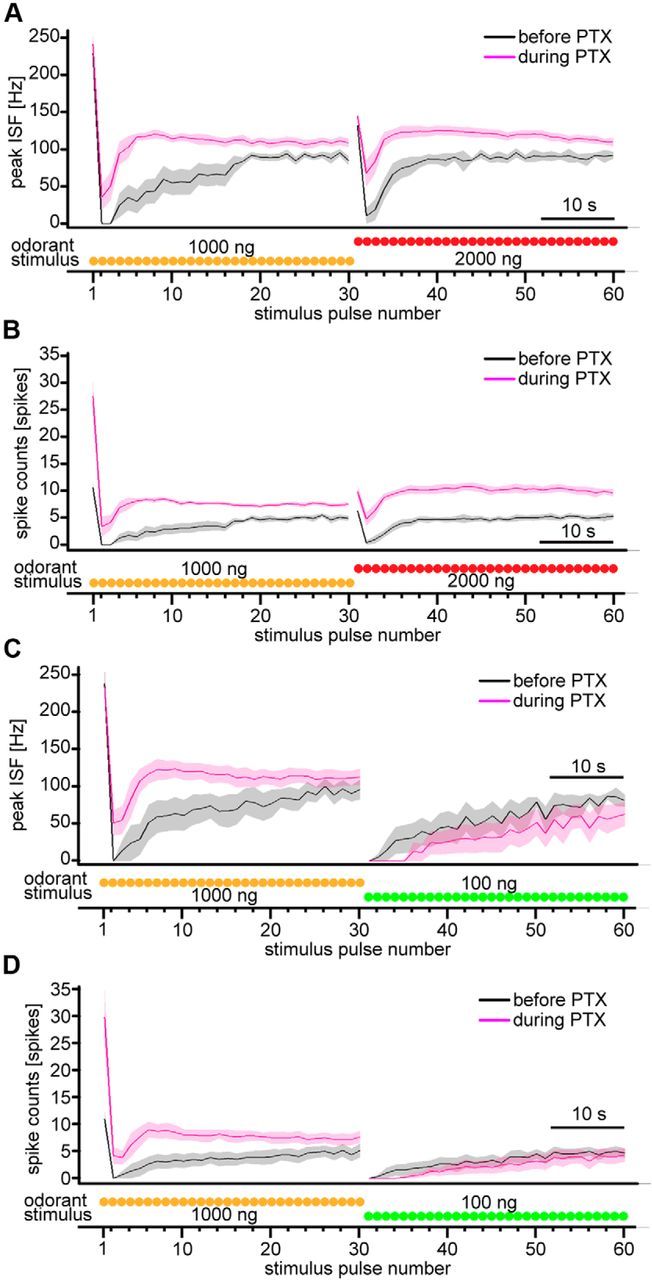
PN responses to intermittent bombykol stimuli upon odorant concentration change in pulse trains and the effect of GABAAR blockade with PTX. A, B, Dynamics of average peak ISF (A) and average spike counts (B) of PN responses with odorant concentration increase before (black) and during (magenta) application of PTX (n = 8; shaded areas represent SEM). Odorant concentration was increased from 1000 to 2000 ng after the 30th stimulus pulse. C, D, Dynamics of average peak ISF (C) and average spike counts (D) of PN responses with odorant concentration decrease before (black) and during (magenta) application of PTX (n = 6; shaded areas represent SEM). Odorant concentration was decreased from 1000 to 100 ng after the 30th stimulus pulse. Traces below the figures represent stimulus timing and odorant concentration schematically.
Simulation of PN responses to naturalistic stimuli
How does inhibition control the transformation of the odorant concentration representation? In response to the first stimulus of a series, inhibition via GABAAR decreases the spike counts rather than the peak ISF at medium and high concentration by complete suppression of the late phase of spike trains (Fujiwara et al., 2014) (Figs. 2C and 5A), implying the existence of an inhibitory mechanism with delayed onset, slow offset kinetics, and with activation proportional to AL input activity originating from the ORNs. This is plausible because strong evoked responses in ORNs and PNs to the first stimulus or a stimulus just after increasing odorant concentration were followed by large response suppressions (Figs. 2C–E and 3A,B). Strong response suppression could result from superposition of direct stimulus-induced inhibition and residual inhibition elicited by previous stimuli at the stimulus interval used. This idea was tested by constructing a model considering an inhibitory mechanism with delayed onset (100 ms delay with respect to the excitatory input to PNs) and slow offset (1200 ms time constant) kinetics (Fig. 7A,B). The model successfully replicated the dynamics of PN responses to intermittent stimuli (Fig. 7C) when inhibition was especially recruited at high odorant concentrations (Fig. 7D). During application of PTX in physiological experiments, complete suppression of PN responses recovered partially and the responses became concentration dependent in the settled state (Figs. 5 and 7E). These phenomena were reproducible in the model by removing the inhibitory component (Fig. 7F). The overall response dynamics of the model resembled our physiological results most closely when inhibition was partially removed (Fig. 7D,G), which is consistent with an incomplete block of inhibition by PTX, as usually achieved by bath application (Fig. 6). Using this model, we investigated whether inhibition would also improve odorant concentration discrimination for naturalistic odorant stimuli as reflected by the dynamics of EAG responses to females emitting pheromones (Fig. 1). With inhibition, PNs showed highly dynamic changes in their firing rates to concentration changes (Fig. 7H) and became more sensitive to both concentration increases and decreases compared with PNs in a model without inhibition (odorant concentration discrimination scores for concentration increase were 0.39 ± 0.07 with inhibition vs 0.16 ± 0.04 without inhibition, p < 0.01; and scores for concentration decrease were 0.42 ± 0.06 with inhibition vs 0.17 ± 0.04 without inhibition, p < 0.01, n = 8). Simulation results also imply that this system is matched to the temporal properties of naturally occurring stimuli as concentration discrimination was best when inhibition time constant corresponded to the average interstimulus interval encountered in female-emitted pheromone plumes (1.2 s) (Fig. 7I; optimal time constants of inhibition were 1.1 s for concentration increase and 1.2 s for concentration decrease).
Discussion
In moth pheromone processing systems, dynamic sensory representations have been investigated to characterize the temporal resolution of neuronal responses (Baker et al., 1985; Kaissling, 1986; Christensen and Hildebrand, 1988; Rumbo and Kaissling, 1989; Christensen et al., 1998; Lei and Hansson, 1999; Vickers et al., 2001; Bau et al., 2002; Lei et al., 2009). In this study, we focused on the representation of odorant concentration rather than on the limits of temporal resolution. Previously, Vickers et al. (2001) showed that EAG amplitude is tightly correlated with both peak ISF and spike counts by simultaneous recording in the tobacco budworm moth, Heliothis virescens, presumably under conditions that correspond to the approach to a female at a larger distance. We estimated the range of pheromone concentrations to which males are exposed in the presence of female-emitted pheromones and used maximum stimulus concentrations in the range of the average concentration received by male antennae. This corresponds to the ”high” concentration range we defined in which the concentration–response curve of ORNs is steepest for single stimuli, but in which PNs fail to encode absolute concentration by simply increasing the peak ISF or spike counts upon intermittent stimulation (Figs. 1, 2, and 3). Therefore, the response clamping we observed comes into play in the higher concentration range that corresponds to spatial proximity to a female, and this is also supported by the results of the simulations (Fig. 7D).
Inhibition exclusively comes from LNs, the only GABAergic neurons known to innervate the AL (Iwano and Kanzaki, 2005; Seki and Kanzaki, 2008). Several previous reports have shown that inhibitory neurons (LNs in our system) in primary olfactory centers are increasingly recruited at high odorant concentrations to reduce the activities of principal neurons (PNs in our system) for preserving odorant tuning (Olsen et al., 2010; Tan et al., 2010) and preference at behavioral level (Asahina et al., 2009). Interglomerular inhibition in the Drosophila AL scales with total ORN activity and spatially normalizes PN responses to odorants (Olsen et al., 2010). Our study shows that a somewhat comparable normalization occurs in the time domain, relying on intraglomerular inhibition. The dynamics of neuronal representations have also been investigated in the mouse olfactory bulb and the locust AL (Brown et al., 2005; Spors et al., 2006; Bathellier et al., 2008; Geffen et al., 2009). These studies focused mainly on odorant discrimination across glomeruli in the primary olfactory areas. We have shown here that a different type of response dynamics exists for encoding odorant concentration in a single glomerulus.
The moth pheromone system is anatomically well separated from the general odorant system at the level of the antennal lobe, comprising a set of neighboring glomeruli, the MGC (Hildebrand, 1996; Kanzaki et al., 2003). Although inhibitory LNs link both systems, we have recently shown that pheromone stimulation induces responses localized to the MGC in these interneurons, implying a role in pheromone concentration discrimination rather than in interaction with the general odorant system (Fujiwara et al., 2014). In the sphinx moth M. sexta, the balance of excitation and inhibition in the AL affects the performance of navigation toward pheromone sources (Lei et al., 2009) and flowers (Riffel et al., 2014) by influencing the ability of AL neurons to track the odorant frequency. Interestingly, intraglomerular inhibition in our study restricts PN response duration (Figs. 2 and 5), thereby appears also involved in the tracking ability of PNs. Although intraglomerular inhibition has been identified in a general odorant system (Root et al., 2008), its involvement in concentration discrimination remains to be investigated. The mechanism we describe in this study has a function analogous to adaptive processes in other sensory modalities (Kohn, 2007; Wark et al., 2007; Rieke and Rudd, 2009; Barbour, 2011). However, in contrast to these previous studies, the adaptive process in the pheromone system works on intermittent input of a relatively low frequency. Although dynamic changes in ORN concentration–response characteristics have also been shown here for the first time (Fig. 4), processes in ORNs always preserve concentration–response relationships even when adapted by a pulse train of stimuli. Central processes, whose effect we observe in PN responses, introduce two additional properties to the responses to dynamic pheromone stimuli: complete response suppression and concentration-independent responses, both of which depend on prior history. Because of the large stimulus-induced response suppression, we propose that a form of short-term memory of previously encountered stimulus magnitude exists and corresponds to the amplitude of long-lasting inhibition. The concentration-independent response level of PNs in the settled state would then represent the balance of the inhibition and the excitation corresponding to the current stimulus amplitude. Simulations showed that PN response dynamics to intermittent stimuli can be replicated using this simple scheme, and odorant concentration discrimination is improved by long-lasting inhibition even for highly dynamic inputs as observed under natural conditions (Fig. 7H,I). Interestingly, discrimination performance in our model depended on the time constant of the inhibition and displayed an optimum when the time constant was close to the average interstimulus interval of the natural stimuli (Fig. 7I). In visual processing, afterhyperpolarization due to a presynaptic mechanism plays a crucial role in the induction of contrast adaptation (Carandini and Ferster, 1997; Manookin and Demb, 2006). In moth AL PNs, this type of afterhyperpolarization has not been identified but long-lasting hyperpolarizations following pheromone triggered spike trains in moth AL PNs (Christensen and Hildebrand, 1987; Kanzaki et al., 1989; Christensen et al., 1993, 1998; Hansson et al., 1994; Jarriault et al., 2009) are likely to reflect the inhibitory processes that are also involved in dynamically controlling PN response level. We recently reported that PTX-sensitive inhibition directly modulates PN responses in a concentration-dependent manner (Fujiwara et al., 2014), which is consistent with our observation in this study that PN responses became concentration-independent in the settled state but ORN responses did not. Here, we directly show that postsynaptic odorant concentration-dependent inhibition is involved in controlling the response dynamics of PNs in intermittent stimulus regimens. Complete PN spike suppression following odorant concentration decrease was not abolished by PTX. This implies that an additional inhibitory mechanism, which could not be blocked under our experimental conditions, could play a role in modulating the representation of odorant concentration information. For intermittent stimulus conditions, absolute concentration information can still be relayed to downstream circuitry through PN response latency (Fig. 2G). However, this would require a mechanism that identifies stimulus timing to extract latency information.
In conclusion, we show that inhibition in the male silkmoth AL dynamically modifies the odorant concentration representation of pheromone-responsive PNs during intermittent stimulation, resulting in an efficient representation of odorant concentration change. This transformation in the olfactory circuit is likely to be important to support efficient adaptive odorant source orientation under dynamically changing natural stimulus conditions.
Footnotes
This work was supported by Research and Development of the Next-Generation Integrated Simulation of Living Matter (part of the Development and Use of the Next-Generation Supercomputer Project), a Grant-in-Aid for Scientific Research (B) (21370029 and 24370031), a Japan Society for the Promotion of Science postdoctoral scholarship (P07144), and a Grant-in-Aid for Japan Society for the Promotion of Science fellows (22·6410) from the Ministry of Education, Culture, Sports, Science and Technology. We thank Professor Shigeru Matsuyama (University of Tsukuba) for providing purified bombykol; Dr. Junichi Nakai (Saitama University Brain Science Institute) for plasmid DNA containing GCaMP2; Dr. Toshiki Tamura (National Institute of Agrobiological Sciences) and Dr. Hideki Sezutsu (National Institute of Agrobiological Sciences) for generation of UAS-GCaMP2 moths; and Dr. Eugenia Chiappe for helpful comments on the manuscript.
The authors declare no competing financial interests.
References
- Asahina K, Louis M, Piccinotti S, Vosshall LB. A circuit supporting concentration-invariant odor perception in Drosophila. J Biol. 2009;8:9. doi: 10.1186/jbiol108. [DOI] [PMC free article] [PubMed] [Google Scholar]
- Baker TC, Roelofs WL. Initiation and termination of oriental fruit moth male response to pheromone concentrations in the field. Environ Entomol. 1981;10:211–218. [Google Scholar]
- Baker TC, Willis MA, Haynes KF, Phelan PL. A pulsed cloud of sex-pheromone elicits upwind flight in male moths. Physiol Entomol. 1985;10:257–265. doi: 10.1111/j.1365-3032.1985.tb00045.x. [DOI] [Google Scholar]
- Barbour DL. Intensity-invariant coding in the auditory system. Neurosci Biobehav Rev. 2011;35:2064–2072. doi: 10.1016/j.neubiorev.2011.04.009. [DOI] [PMC free article] [PubMed] [Google Scholar]
- Bathellier B, Buhl DL, Accolla R, Carleton A. Dynamic ensemble odor coding in the mammalian olfactory bulb: sensory information at different timescales. Neuron. 2008;57:586–598. doi: 10.1016/j.neuron.2008.02.011. [DOI] [PubMed] [Google Scholar]
- Bau J, Justus KA, Cardé RT. Antennal resolution of pulsed pheromone plumes in three moth species. J Insect Physiol. 2002;48:433–442. doi: 10.1016/S0022-1910(02)00062-8. [DOI] [PubMed] [Google Scholar]
- Boeckh J, Boeckh V. Threshold and odor specificity of pheromone-sensitive neurons in the deutocerebrum of Antheraea pernyi and Antheraea polyphemus (Saturnidae) J Comp Physiol. 1979;132:235–242. doi: 10.1007/BF00614495. [DOI] [Google Scholar]
- Brand AH, Perrimon N. Targeted gene expression as a means of altering cell fates and generating dominant phenotypes. Development. 1993;118:401–415. doi: 10.1242/dev.118.2.401. [DOI] [PubMed] [Google Scholar]
- Brown SL, Joseph J, Stopfer M. Encoding a temporally structured stimulus with a temporally structured neural representation. Nat Neurosci. 2005;8:1568–1576. doi: 10.1038/nn1559. [DOI] [PubMed] [Google Scholar]
- Butenandt A, Beckmann R, Stamm D, Hecker E. Über den Sexuallockstoff des Seidenspinners Bombyx mori. Reindarstellung und Konstitution. Z Naturforsch. 1959;14b:283–284. [Google Scholar]
- Carandini M, Ferster D. A tonic hyperpolarization underlying contrast adaptation in cat visual cortex. Science. 1997;276:949–952. doi: 10.1126/science.276.5314.949. [DOI] [PubMed] [Google Scholar]
- Christensen TA, Hildebrand JG. Male-specific, sex pheromone-selective projection neurons in the antennal lobes of the moth Manduca sexta. J Comp Physiol A Neuroethol Sens Neural Behav Physiol. 1987;160:553–569. doi: 10.1007/BF00611929. [DOI] [PubMed] [Google Scholar]
- Christensen TA, Hildebrand JG. Frequency coding by central olfactory neurons in the sphinx moth Manduca sexta. Chem Senses. 1988;13:123–130. doi: 10.1093/chemse/13.1.123. [DOI] [Google Scholar]
- Christensen TA, Waldrop BR, Harrow ID, Hildebrand JG. Local interneurons and information-processing in the olfactory glomeruli of the moth Manduca sexta. J Comp Physiol A Neuroethol Sens Neural Behav Physiol. 1993;173:385–399. doi: 10.1007/BF00193512. [DOI] [PubMed] [Google Scholar]
- Christensen TA, Waldrop BR, Hildebrand JG. Multitasking in the olfactory system: context-dependent responses to odors reveal dual GABA-regulated coding mechanisms in single olfactory projection neurons. J Neurosci. 1998;18:5999–6008. doi: 10.1523/JNEUROSCI.18-15-05999.1998. [DOI] [PMC free article] [PubMed] [Google Scholar]
- Friedrich RW, Korsching SI. Combinatorial and chemotopic odorant coding in the zebrafish olfactory bulb visualized by optical imaging. Neuron. 1997;18:737–752. doi: 10.1016/S0896-6273(00)80314-1. [DOI] [PubMed] [Google Scholar]
- Fujiwara T, Kazawa T, Haupt SS, Kanzaki R. Postsynaptic odorant concentration dependent inhibition controls temporal properties of spike responses of projection neurons in the moth antennal lobe. PLoS One. 2014;9:e89132. doi: 10.1371/journal.pone.0089132. [DOI] [PMC free article] [PubMed] [Google Scholar]
- Geffen MN, Broome BM, Laurent G, Meister M. Neural encoding of rapidly fluctuating odors. Neuron. 2009;61:570–586. doi: 10.1016/j.neuron.2009.01.021. [DOI] [PubMed] [Google Scholar]
- Gomez-Marin A, Stephens GJ, Louis M. Active sampling and decision making in Drosophila chemotaxis. Nat Commun. 2011;2:441. doi: 10.1038/ncomms1455. [DOI] [PMC free article] [PubMed] [Google Scholar]
- Hallem EA, Carlson JR. Coding of odors by a receptor repertoire. Cell. 2006;125:143–160. doi: 10.1016/j.cell.2006.01.050. [DOI] [PubMed] [Google Scholar]
- Hansson BS, Anton S, Christensen TA. Structure and function of antennal lobe neurons in the male turnip moth, Agrotis segetum (Lepidoptera, Noctuidae) J Comp Physiol A Neuroethol Sens Neural Behav Physiol. 1994;175:547–562. [Google Scholar]
- Hildebrand JG. Olfactory control of behavior in moths: central processing of odor information and the functional significance of olfactory glomeruli. J Comp Physiol A Neuroethol Sens Neural Behav Physiol. 1996;178:5–19. doi: 10.1007/BF00189586. [DOI] [PubMed] [Google Scholar]
- Iwano M, Kanzaki R. Immunocytochemical identification of neuroactive substances in the antennal lobe of the male silkworm moth Bombyx mori. Zoolog Sci. 2005;22:199–211. doi: 10.2108/zsj.22.199. [DOI] [PubMed] [Google Scholar]
- Jarriault D, Gadenne C, Rospars JP, Anton S. Quantitative analysis of sex-pheromone coding in the antennal lobe of the moth Agrotis ipsilon: a tool to study network plasticity. J Exp Biol. 2009;212:1191–1201. doi: 10.1242/jeb.024166. [DOI] [PubMed] [Google Scholar]
- Justus KA, Murlis J, Jones C, Cardé RT. Measurement of odor-plume structure in a wind tunnel using a photoionization detector and a tracer gas. Environ Fluid Mech. 2002;2:115–142. doi: 10.1023/A:1016227601019. [DOI] [Google Scholar]
- Kaissling KE. Chemo-electrical transduction in insect olfactory receptors. Annu Rev Neurosci. 1986;9:121–145. doi: 10.1146/annurev.ne.09.030186.001005. [DOI] [PubMed] [Google Scholar]
- Kaissling KE, Kasang G. A new pheromone of silkworm moth Bombyx mori. Naturwissenschaften. 1978;65:382–384. doi: 10.1007/BF00439702. [DOI] [Google Scholar]
- Kanzaki R, Shibuya T. Olfactory neural pathway and sexual pheromone responses in the deutocerebrum of the male silkworm moth, Bombyx mori (Lepidoptera: Bombycidae) Appl Entomol Zool. 1983;18:131–133. [Google Scholar]
- Kanzaki R, Shibuya T. Identification of the deutocerebral neurons responding to the sexual pheromone in the male silkworm moth brain. Zool Sci. 1986;3:409–418. [Google Scholar]
- Kanzaki R, Arbas EA, Strausfeld NJ, Hildebrand JG. Physiology and morphology of projection neurons in the antennal lobe of the male moth Manduca sexta. J Comp Physiol A Neuroethol Sens Neural Behav Physiol. 1989;165:427–453. doi: 10.1007/BF00611233. [DOI] [PubMed] [Google Scholar]
- Kanzaki R, Soo K, Seki Y, Wada S. Projections to higher olfactory centers from subdivisions of the antennal lobe macroglomerular complex of the male silkmoth. Chem Senses. 2003;28:113–130. doi: 10.1093/chemse/28.2.113. [DOI] [PubMed] [Google Scholar]
- Khan AG, Sarangi M, Bhalla US. Rats track odour trails accurately using multi-layered strategy with near-optimal sampling. Nat Commun. 2012;3:703. doi: 10.1038/ncomms1712. [DOI] [PubMed] [Google Scholar]
- Kloppenburg P, Ferns D, Mercer AR. Serotonin enhances central olfactory neuron responses to female sex pheromone in the male sphinx moth Manduca sexta. J Neurosci. 1999;19:8172–8181. doi: 10.1523/JNEUROSCI.19-19-08172.1999. [DOI] [PMC free article] [PubMed] [Google Scholar]
- Kohn A. Visual adaptation: physiology, mechanisms, and functional benefits. J Neurophysiol. 2007;97:3155–3164. doi: 10.1152/jn.00086.2007. [DOI] [PubMed] [Google Scholar]
- Lei H, Hansson BS. Central processing of pulsed pheromone signals by antennal lobe neurons in the male moth Agrotis segetum. J Neurophysiol. 1999;81:1113–1122. doi: 10.1152/jn.1999.81.3.1113. [DOI] [PubMed] [Google Scholar]
- Lei H, Riffell JA, Gage SL, Hildebrand JG. Contrast enhancement of stimulus intermittency in a primary olfactory network and its behavioral significance. J Biol. 2009;8:21. doi: 10.1186/jbiol120. [DOI] [PMC free article] [PubMed] [Google Scholar]
- Manookin MB, Demb JB. Presynaptic mechanism for slow contrast adaptation in mammalian retinal ganglion cells. Neuron. 2006;50:453–464. doi: 10.1016/j.neuron.2006.03.039. [DOI] [PubMed] [Google Scholar]
- Martelli C, Carlson JR, Emonet T. Intensity invariant dynamics and odor specific latencies in olfactory receptor neuron response. J Neurosci. 2013;33:6285–6297. doi: 10.1523/JNEUROSCI.0426-12.2013. [DOI] [PMC free article] [PubMed] [Google Scholar]
- Meeks JP, Arnson HA, Holy TE. Representation and transformation of sensory information in the mouse accessory olfactory system. Nat Neurosci. 2010;13:723–730. doi: 10.1038/nn.2546. [DOI] [PMC free article] [PubMed] [Google Scholar]
- Olsen SR, Bhandawat V, Wilson RI. Divisive normalization in olfactory population codes. Neuron. 2010;66:287–299. doi: 10.1016/j.neuron.2010.04.009. [DOI] [PMC free article] [PubMed] [Google Scholar]
- Rieke F, Rudd ME. The challenges natural images pose for visual adaptation. Neuron. 2009;64:605–616. doi: 10.1016/j.neuron.2009.11.028. [DOI] [PubMed] [Google Scholar]
- Riffell JA, Shlizerman E, Sanders E, Abrell L, Medina B, Hinterwirth AJ, Kutz JN. Flower discrimination by pollinators in a dynamic chemical environment. Science. 2014;344:1515–1518. doi: 10.1126/science.1251041. [DOI] [PubMed] [Google Scholar]
- Root CM, Masuyama K, Green DS, Enell LE, Nässel DR, Lee CH, Wang JW. A presynaptic gain control mechanism fine tunes olfactory behavior. Neuron. 2008;59:311–321. doi: 10.1016/j.neuron.2008.07.003. [DOI] [PMC free article] [PubMed] [Google Scholar]
- Rumbo ER, Kaissling KE. Temporal resolution of odor pulses by 3 types of pheromone receptor-cells in Antheraea polyphemus. J Comp Physiol A Neuroethol Sens Neural Behav Physiol. 1989;165:281–291. doi: 10.1007/BF00619348. [DOI] [Google Scholar]
- Sakurai T, Mitsuno H, Haupt SS, Uchino K, Yokohari F, Nishioka T, Kobayashi I, Sezutsu H, Tamura T, Kanzaki R. A single sex pheromone receptor determines chemical response specificity of sexual behavior in the silkmoth Bombyx mori. PLoS Genet. 2011;7:e1002115. doi: 10.1371/journal.pgen.1002115. [DOI] [PMC free article] [PubMed] [Google Scholar]
- Sakurai T, Nakagawa T, Mitsuno H, Mori H, Endo Y, Tanoue S, Yasukochi Y, Touhara K, Nishioka T. Identification and functional characterization of a sex pheromone receptor in the silkmoth Bombyx mori. Proc Natl Acad Sci U S A. 2004;101:16653–16658. doi: 10.1073/pnas.0407596101. [DOI] [PMC free article] [PubMed] [Google Scholar]
- Seki Y, Kanzaki R. Comprehensive morphological identification and GABA immunocytochemistry of antennal lobe local interneurons in Bombyx mori. J Comp Neurol. 2008;506:93–107. doi: 10.1002/cne.21528. [DOI] [PubMed] [Google Scholar]
- Spors H, Wachowiak M, Cohen LB, Friedrich RW. Temporal dynamics and latency patterns of receptor neuron input to the olfactory bulb. J Neurosci. 2006;26:1247–1259. doi: 10.1523/JNEUROSCI.3100-05.2006. [DOI] [PMC free article] [PubMed] [Google Scholar]
- Takasaki T, Namiki S, Kanzaki R. Use of bilateral information to determine the walking direction during orientation to a pheromone source in the silkmoth Bombyx mori. J Comp Physiol A Neuroethol Sens Neural Behav Physiol. 2012;198:295–307. doi: 10.1007/s00359-011-0708-8. [DOI] [PubMed] [Google Scholar]
- Tallini YN, Ohkura M, Choi BR, Ji G, Imoto K, Doran R, Lee J, Plan P, Wilson J, Xin HB, Sanbe A, Gulick J, Mathai J, Robbins J, Salama G, Nakai J, Kotlikoff MI. Imaging cellular signals in the heart in vivo: cardiac expression of the high-signal Ca2+ indicator GCaMP2. Proc Natl Acad Sci U S A. 2006;103:4753–4758. doi: 10.1073/pnas.0509378103. [DOI] [PMC free article] [PubMed] [Google Scholar]
- Tamura T, Thibert C, Royer C, Kanda T, Abraham E, Kamba M, Komoto N, Thomas JL, Mauchamp B, Chavancy G, Shirk P, Fraser M, Prudhomme JC, Couble P, Toshiki T, Chantal T, Corinne R, Toshio K, Eappen A, Mari K, et al. Germline transformation of the silkworm Bombyx mori L. using a piggyBac transposon-derived vector. Nat Biotechnol. 2000;18:81–84. doi: 10.1038/71978. [DOI] [PubMed] [Google Scholar]
- Tamura T, Kuwabara N, Uchino K, Kobayashi I, Kanda T. An improved DNA injection method for silkworm eggs drastically increases the efficiency of producing transgenic silkworms. J Insect Biotechnol Sericol. 2007;76:155–159. [Google Scholar]
- Tan J, Savigner A, Ma M, Luo M. Odor information processing by the olfactory bulb analyzed in gene-targeted mice. Neuron. 2010;65:912–926. doi: 10.1016/j.neuron.2010.02.011. [DOI] [PMC free article] [PubMed] [Google Scholar]
- Uchino K, Imamura M, Sezutsu H, Kobayashi I, Kojima K, Kanda T, Tamura T. Evaluating promoter sequences for trapping an enhancer activity in the silkworm Bombyx mori. J Insect Biotechnol Sericol. 2006;75:89–97. [Google Scholar]
- Vickers NJ, Christensen TA, Baker TC, Hildebrand JG. Odour-plume dynamics influence the brain's olfactory code. Nature. 2001;410:466–470. doi: 10.1038/35068559. [DOI] [PubMed] [Google Scholar]
- Waldrop B, Christensen TA, Hildebrand JG. GABA-mediated synaptic inhibition of projection neurons in the antennal lobes of the sphinx moth, Manduca sexta. J Comp Physiol A Neuroethol Sens Neural Behav Physiol. 1987;161:23–32. doi: 10.1007/BF00609452. [DOI] [PubMed] [Google Scholar]
- Wang JW, Wong AM, Flores J, Vosshall LB, Axel R. Two-photon calcium imaging reveals an odor-evoked map of activity in the fly brain. Cell. 2003;112:271–282. doi: 10.1016/S0092-8674(03)00004-7. [DOI] [PubMed] [Google Scholar]
- Wark B, Lundstrom BN, Fairhall A. Sensory adaptation. Curr Opin Neurobiol. 2007;17:423–429. doi: 10.1016/j.conb.2007.07.001. [DOI] [PMC free article] [PubMed] [Google Scholar]