

Abstract
Neuroinflammation plays a key role in secondary brain damage after stroke. Although deleterious effects of proinflammatory cytokines are well characterized, direct cytotoxic effects of invading immune cells on the ischemic brain and the importance of their antigen-dependent activation are essentially unknown. Here we examined the effects of adaptive and innate immune cells—cytotoxic T lymphocytes (CTLs) and natural killer (NK) cells—that share the direct perforin-mediated cytotoxic pathway on outcome after cerebral ischemia in mice. Although CTLs and NK cells both invaded the ischemic brain, only brain-infiltrating CTLs but not NK cells were more activated than their splenic counterparts. Depletion of CTLs decreased infarct volumes and behavioral deficit in two ischemia models, whereas NK cell depletion had no effect. Correspondingly, adoptive CTL transfer from wild-type into Rag1 knock-out mice increased infarct size. Adoptive CTL transfer from perforin knock-out or interferon-γ knock-out mice into Rag1 knock-out mice revealed that CTL neurotoxicity was mediated by perforin. Accordingly, CTLs isolated from wild-type or interferon-γ knock-out but not from perforin knock-out mice induced neuronal cell death in vitro. CTLs derived from ovalbumin-specific T-cell receptor transgenic mice were not activated and infiltrated less into the ischemic brain compared with wild-type CTLs. Their transfer did not increase the infarct size of Rag1 knock-out mice, indicating antigen-dependent activation as an essential component of CTL neurotoxicity. Our findings underscore the importance of antigen-dependent, direct cytotoxic immune responses in stroke and suggest modulation of CTLs and their effector pathways as a potential new strategy for stroke therapy.
Keywords: cytotoxic T lymphocytes, ischemic stroke, NK cells, perforin
Introduction
Ischemic cardiovascular disorders, including stroke, are the leading cause of death worldwide (Donnan et al., 2008). Beyond early vascular recanalization (Donnan et al., 2008), neuroinflammatory mechanisms are increasingly recognized as promising therapeutic targets in acute stroke (Iadecola and Anrather, 2011; Macrez et al., 2011; Chamorro et al., 2012). However, the contribution of brain-invading innate and adaptive immune cell populations and their complex interplay with resident brain cells is only beginning to be understood. Recent studies suggested an important pathophysiological role of T cells in ischemia-induced secondary tissue damage of various organs, including the brain (Liesz et al., 2011; Chamorro et al., 2012). Previous research on the mechanisms underlying neurotoxicity induced by T cells focused on the role of proinflammatory cytokines (Vila et al., 2000; Lambertsen et al., 2004; Schroeter and Jander, 2005; Yilmaz et al., 2006; Welsh et al., 2008). In contrast, direct cell–cell interaction-dependent cytolytic pathways, including the perforin-granzyme effector mechanism that plays an important role in microbial defense (Stenger et al., 1998) and primary autoimmune disorders (Kägi et al., 1997; Rieux-Laucat et al., 2005), have received only little attention in the setting of ischemic diseases (Varda-Bloom et al., 2000; Zhang et al., 2008). Cells of both the innate and the adaptive immune system—natural killer (NK) cells and cytotoxic CD8+ T lymphocytes (CTLs), respectively—share these direct cytotoxic effector mechanisms (Sun and Lanier, 2011; Chamorro et al., 2012). Although NK cells may participate in the pathogenesis of brain inflammation in multiple sclerosis (Kaur et al., 2013), their role in post-ischemic neuroinflammation after stroke has barely been examined. NK cells are activated in an antigen-unspecific mode (Biron et al., 1999), which makes them an ideal candidate for rapid cytotoxicity after stroke. In contrast, the canonical pathway of CTL activation and clonal expansion requires complex and time-consuming antigen-specific activation and the presence of costimulatory factors. Indeed, the mode of T-cell activation in the context of ischemia is currently viewed as a key enigma in the neuroimmunology of stroke (Iadecola and Anrather, 2011).
Here we characterize the different effects of CTLs and NK cells on the outcome after experimental murine stroke and reveal that differential activation of brain-invading immune cells determines their neurotoxic effect.
Materials and Methods
Mice.
The study was conducted in accordance with national guidelines for the use of experimental animals. All experimental procedures were approved by the governmental committees (Animal Care Committee, Karlsruhe, Protocol 35, Germany) and were performed in accordance with the ARRIVE (Animal Research: Reporting of In Vivo Experiments) guidelines (Drummond et al., 2010). Age-matched (10–12 weeks old) mature male mice (C57BL/6J) were used for the experiments. Rag1 knock-out (Rag1−/−; The Jackson Laboratory) mice served as recipients for transfer experiments. As T-cell donors, we used wild-type (WT), perforin-1 knock-out (Prf1−/−; The Jackson Laboratory), interferon-γ knock-out (IFN-γ−/−; The Jackson Laboratory), or Rag1 knock-out/ovalbumin-specific T-cell receptor transgenic (OT-I; Taconic) mice. For two-photon microscopy experiments, we used neuronal yellow fluorescent protein-expressing mice (YFP-16; The Jackson Laboratory). All knock-out and transgenic animals were age-matched mature male mice on a C57BL/6 background. All mice were kept on a standard 12 h light/dark cycle and had access to food and water ad libitum.
In vivo depletion of CTLs and NK cells.
We injected 300 μg of cluster of differentiation 8α (CD8α)-specific (clone 53-6.72; BioXCell) or 300 μg of NK1.1-specific monoclonal antibody (clone PK136; BioXCell) or isotype antibody (IgG2, clone 2A3; BioXCell) diluted in sterile PBS intraperitoneally 24 h before, 5 h after, or 12 h after ischemia induction. We confirmed the depletion by flow cytometric analysis of leukocyte subpopulations isolated from blood and spleen. Animals were randomly allocated to treatment groups (isotype, anti-CD8, or anti-NK1.1 antibodies). Depletion was confirmed by the presence of <5% CD8+ T cells in the CD3+ cell population and <2% NKp46+ cells among all leukocytes in blood 24 h to 7 d after ischemia.
Ischemia models.
We induced permanent focal cerebral ischemia by transtemporal coagulation of the left middle cerebral artery (MCA) distal from the lenticulostriatal arteries as described previously (Zhou et al., 2013). We used permanent MCA occlusion (pMCAO) model for all experiments unless stated otherwise. We induced transient focal ischemia by advancing a nylon monofilament to the left MCA for 30 min (tMCAO) as described previously (Zhou et al., 2013). Experimental group sizes were determined based on a priori power analysis (G-power). We excluded animals in which surgery lasted for >25 min or that lost > 25% of their body weight during the 7 d observation period. Allocation of animals to treatment groups was randomized. Surgeons were blinded to treatment assignment.
Assessment of infarct volume.
We determined the infarct volume on cresyl violet-stained cryosections. In brief, mice were deeply anesthetized with an intraperitoneal injection of ketamine/xylazine (100 and 10 mg/kg, respectively) and transcardially perfused with cold saline. Brains were removed and immediately frozen, and 20-μm-thick coronal cryosections were cut every 400 μm and stained with cresyl violet. We scanned the stained sections at 600 dpi and measured the infarct areas using a public domain image analysis program (NIH ImageJ). The total infarct volume was obtained by integrating measured infarct areas and distance between sections. Correction for brain edema was applied by subtraction of the ipsilateral minus contralateral hemisphere volume from the directly measured infarct volume. Evaluators were blinded to treatment assignment.
Functional outcome tests.
We performed the corner test (Zhang et al., 2002) 24 h before and 24 h, 3 d, and 7 d after pMCAO. The corner was formed by two boards each with a dimension of 30 × 20 × 1 cm attached at a 30° angle with a small opening along the joint to encourage the mouse entering the corner. After entering deep into the corner, the mouse rears forward and upward and then turns back to face the open end. We scored 12 turns for each test and calculated the percentage ratio of right turns of all turns and normalized on the performance before surgery of each individual mouse.
To assess neurological dysfunction in the tMCAO model, we evaluated the forelimb use asymmetry in the cylinder test (Li et al., 2004). Briefly, mice were placed in a transparent glass cylinder (8 cm in diameter) and videotaped for 10 min. Contacts with the cylinder wall and landing with only one forelimb at the cylinder bottom as part of a full rear were scored using frame-by-frame playback (VLC Media Player). Ten independent forelimb contacts with the wall and 10 with the bottom of the cylinder were counted, and forelimb use asymmetry was expressed as a ratio of left-sided/all independent forelimb use. Evaluators were blinded to treatment assignment.
Immunohistochemistry.
Neuronal loss was assessed by terminal deoxynucleotidyl transferase-mediated dUTP nick-end labeling (TUNEL) method using a TUNEL apoptosis detection kit (Merck Millipore). Coronal cryostat sections (12 μm) at the anterior commissure position were fixed in −20°C acetone for 5 min and then washed in PBS. Sections were then incubated with 10 mm sodium citrate buffer at 95–100°C for 10 min, followed by a TUNEL mixture for 60 min at 37°C. After washing and blocking, sections were incubated with avidin–FITC for 30 min at 37°C. For NeuN costaining, the sections were then blocked with 10% goat serum and incubated with rabbit polyclonal anti-NeuN (Abcam) overnight at 4°C. Cy3-conjugated goat anti-rabbit antibodies (Jackson ImmunoResearch) were applied on the sections for 1 h at room temperature. For analysis of cell numbers, we scanned the sections at 20× magnification on a Leica TCS SP5 confocal microscope. We chose six regions with a size of 300 × 300 μm: two regions at the dorsal edge, two at the ventral edge of the infarcted [TUNEL-positive (TUNEL+)] area, and 2 between at half distance. TUNEL+ and TUNEL-negative (TUNEL−) neurons (NeuN+ cells) were counted. Nonspecifically stained structures were defined based on DAPI counterstaining and excluded from the analysis.
Preparation of cell suspensions.
Mice were anesthetized and blood was drawn from the periorbital sinus into heparinized tubes. Leukocytes were isolated using a Ficoll-Hypaque gradient. We collected spleens after transcardial perfusion with saline. After homogenization and hypotonic lysis of red blood cells, we used the cell suspension for flow cytometric staining. For comparison of splenic and brain-invading leukocytes, spleens and the infarcted brain hemispheres were mechanically homogenized, and cell suspensions were incubated in dissociation buffer (10 ml of RPMI-1640, 180 U of collagenase IV, and 250 U DNase) for 20 min and overlaid on discontinuous Percoll gradients of 1.03 and 1.088 g/ml density. After gradient centrifugation, the collected mononuclear cells were used for flow cytometry or plated on 96-well plates.
In vitro restimulation.
For investigation of in vitro function of CTLs and NK cells, we plated single-cell suspensions of 3 × 10⁵ mononuclear cells on 96-well plates (RPMI-1640 plus 10% FCS plus 2 mm glutamine plus 25 mm HEPES plus 1% penicillin/streptomycin plus 50 μm β-mercaptoethanol). We processed each sample in duplicate. Cells were primed for 24 h with either plate-bound anti-mouse CD3ε (BD Biosciences) to stimulate CTLs or plate-bound polyclonal goat anti-mouse NKp46 (R & D Systems) to stimulate NK cells or ovalbumin (Sigma-Aldrich) to stimulate CTLs from OT-I mice. Cells (except for the ovalbumin stimulation) were then restimulated for 5 h with ionomycin (BD Bioscience) and phorbol myristate acetate (Sigma-Aldrich) in the presence of protein transport inhibitor (BD Golgi Plug; BD Biosciences), followed by intracellular staining for IFN-γ.
Flow cytometric analysis.
We stained the respective single-cell suspensions for anti-mouse CD3ε (clone 17A2), CD4 (clone RM 4-5), CD8α (clone 3.155), B220 (RA3-6B2), NKp46 (clone 29A1.4), NK1.1 (PK136), Gr-1 (RB6-8C5), CD11b (clone M1/70), CD69 (clone H1.2F3), CD44 (IM7), CD62L (MEL-14), CD27 (clone LG.3A10), CD11c (clone HL3), Tbet (clone 4B10), Eomes (clone Dan11mag), IFN-γ (clone XMG1.2), and the appropriate isotype control by following the protocols of the manufacturers (BD Biosciences, eBioscience). We performed flow cytometry on a BD Biosciences FACS Calibur, FACS Canto, and LSR II and analyzed the data by CellQuest Pro, FlowJo, and FACS Diva software, respectively. Gates were set according to unstained samples and isotype controls (BD Biosciences).
Real-time PCR.
Ischemic and non-ischemic hemispheres were separately homogenized, and RNA was isolated with RNApure following the protocol of the manufacturer (Peqlab). We performed reverse transcription using the High Capacity cDNA Archive Kit (Applied Biosystems) and real-time PCR with SYBR-Green assays (Applied Biosystems) on a GeneAmp 5700 SDS from Applied Biosystems. All assays were run in duplicates. Primers for IFN-γ and tumor necrosis factor-α (TNF-α) were purchased as ready-to-use primer sets (Super Array). Results were normalized for each individual gene to the level of the housekeeping gene encoding peptidylprolyl isomerase A (cyclophilin), according to the relative standard curve method.
Cell sorting and adoptive cell transfer.
We purified CD8+ T cells by magnetic cell sorting (Miltenyi Biotec) from the spleens of WT, Prf1−/−, IFN-γ−/−, or OT-I mice. We injected intraperitoneally 6 × 10⁶ CD8+ T cells into Rag1−/− recipients. Rag1−/− mice were randomly allocated to cell transfer groups (WT, Prf1−/−, IFN-γ−/−, or OT-I). The purity of the CTLs used for cell transfer and the ratio of CTLs within the CD3+ population of blood 2 weeks after cell transfer in Rag1−/− mice were above 90% as analyzed by flow cytometry (data not shown).
In vitro coculture of neurons with CTLs.
To investigate the neurotoxic effects of CTLs in vitro, the cortex was dissected from the brains of E16.5 mouse embryos, treated with 0.05% trypsin, and triturated with a fire-polished glass pipette. Cells were then counted and resuspended in 10% serum-supplemented medium, and 2 × 10⁵ cells per well were plated on poly-l-lysine-coated coverslips on 24-well plates. Medium was replaced 24 h later with medium supplemented with N-2 and B-27 (Invitrogen), and neuronal culture was maintained for 7 d. The differentiated neurons were then incubated with 100 U/ml IFN-γ overnight to upregulate their MHC class I expression (Neumann et al., 1995). After washing steps, neurons were cocultured with CD8+ T cells in a ratio of neurons to CD8+ T cells of 2:1 or 10:1.
We plated 2 × 10⁶ purified CD8+ T cells isolated from the spleens of WT, Prf1−/−, or IFN-γ−/− mice on 24-well plates (RPMI-1640 plus 10% FCS plus 2 mm glutamine plus 25 mm HEPES plus 1% penicillin/streptomycin plus 50 μm β-mercaptoethanol). Cells were primed for 48 h with plate-bound anti-mouse CD3ε (BD Biosciences), 5 μg/ml soluble CD28 (BD Biosciences), and 200 U/ml IL-2 (BD Biosciences). Activated CD8+ T cells were then cocultured with neurons for 5 h, followed by immunofluorescent staining for neuronal apoptosis. Non-activated CD8+ T cells isolated from WT mice were used as control for the coculture with neurons.
Immunocytochemistry.
Adherent neurons on coverslips were fixed with 4% paraformaldehyde for 30 min and permeabilized with 0.5% Triton X-100 for 10 min, followed by blocking with 10% goat serum for 1 h. After incubation with mouse anti-microtubule-associated protein 2 (Map2; Sigma-Aldrich) and rabbit anti-caspase-3 (R & D Systems) in blocking buffer overnight at 4°C, cells were incubated with the appropriate fluorochrome-conjugated secondary antibodies: Cy2-conjugated goat anti-mouse (Jackson ImmunoResearch) and Cy3-conjugated goat anti-rabbit (Jackson ImmunoResearch) antibodies, respectively, for 1 h at room temperature. For analysis of neuronal apoptosis, 100 Map2+ neurons were captured with 20× magnification and classified as caspase-3+ or caspase-3− by two independent investigators from biological replicates. Nonspecifically stained structures were defined based on DAPI counterstaining and excluded from the analysis.
In vivo two-photon microscopy.
We implanted a cranial window into 12- to 14-week-old YFP-16 mice. Mice were anesthetized with an intraperitoneal injection of ketamine/xylazine (100 and 10 mg/kg, respectively). We performed a craniectomy with subsequent removal of the dura mater. We covered the brain surface with physiologic sodium chloride solution and glued a round cover glass (6 mm diameter) to the skull with dental acrylic glue. Three weeks later, we induced pMCAO by transtemporal coagulation of the left MCA lateral from the cranial window. For fluorescent labeling, 2 × 10⁶/ml CD8+ T cells purified by magnetic cell sorting were incubated with 25 μg/ml CMTPX (red fluorescent dye) for 30 min at 37°C. Immediately after MCAO, we injected 6 × 10⁶ CMTPX-labeled CD8+ T cells intravenously. We used a Coherent Chameleon Ultra II Laser (690–1064 nm; Coherent) equipped with a two-photon microscope (LSM 7 MP; Zeiss) for in vivo multiphoton laser scanning microscopy. A custom-made microscopy stage was used for fixation of the cranium. We used a mixture of O2 and 1–2% isoflurane for anesthesia and kept the body temperature of mice constant by using a heating pad. Images were acquired at an excitation wavelength of 850 nm. Laser power was limited to a minimum, not exceeding 5–7% of total power at the surface, and 50% in 350 mm depth. At this power, no phototoxic damage to brain tissue was detectable over the time course of investigations. Pictures and videos were taken daily from day 3 until day 7 after MCAO through the cranial window above the ischemic hemisphere.
Statistical analysis.
All values are expressed as mean ± SD. Student's t test was used for comparison between two groups and ANOVA for multiple comparisons with post hoc Tukey's test after validating the normal distribution of these datasets (Kolmogorov–Smirnov test). We analyzed the results of the corner test with two-tailed Wilcoxon's rank-sum test. Percentage values of TUNEL− neurons were analyzed by Mann–Whitney test (two groups) and by Kruskal–Wallis test with Dunn's test for multiple comparisons (three groups). For the analysis of immunocytochemistry results, we performed χ2 test for multiple comparisons. The accepted significance level was p < 0.05. The Statistical Package for Social Sciences (SPSS) software was used for statistical analysis.
Results
CD8+ T cells but not NK1.1+ cells worsen outcome after stroke
We investigated the effect of CTLs and NK1.1+ cells on neurological outcome after focal brain ischemia in mice by in vivo depletion of the respective cell populations using monoclonal antibodies against CD8α (Ly-2) or NK1.1 (PK136). Antibody administration resulted in 85% depletion of CD8+ cells and 90% depletion of NK cells in blood (Fig. 1A,B). Both cell populations were diminished during the 7 d observation period, whereas other leukocyte populations were not affected by the treatment (data not shown). For the evaluation of the effect of CTLs on infarct size 14 d after pMCAO, CD8+ T-cell depletion was also verified at this later time point.
Figure 1.

CD8+ T cell but not NK1.1+-cell depletion reduces infarct size and improves sensorimotor function. A, Representative plots from blood of isotype control (IgG), CD8+ cell-depleted (anti-CD8), and NK1.1+ cell-depleted (anti-NK1.1) mice. B, FACS analysis of the kinetics of CD8+ T-cell and NK1.1+-cell depletion in blood and spleen 6 h, 24 h, 3 d, 7 d, and 14 d after antibody injection. CD8+ T cells are shown as ratio within the CD3+ T cell population. NK cells are shown as percentage of whole leukocytes. Whiskers show the 10th to 90th percentiles. C, Representative cresyl violet-stained coronal sections after pMCAO with cortical infarcts and 30 min tMCAO with striatal lesions from IgG, anti-CD8, and anti-NK1.1 mice. D, Infarct volume of IgG and anti-CD8-treated mice 12 h, 24 h, 3 d, 7 d, and 14 d after pMCAO (on the left) (n = 10 per group, *p < 0.05). Right, Infarct volume of IgG and anti-CD8 mice at 7 d after pMCAO when antibody was injected 5 or 12 h after ischemia induction (n = 9 per group, *p < 0.05). Whiskers show 5th to 95th percentiles. E, Sensorimotor asymmetry of IgG- and anti-CD8-treated mice was assessed as right/left turn ratio in the corner test at the indicated time points after pMCAO (n = 10 per group, *p < 0.05). F, Left, Infarct volume of IgG- and anti-CD8-treated mice 24 h and 7 d after 30 min tMCAO (n = 10 per group, *p < 0.05). Right, Fine motor skills of IgG- and anti-CD8-treated mice were measured in the cylinder test at the indicated time points after tMCAO. Motor asymmetry was assessed as left/all forepaw use and was normalized on performance before tMCAO (n = 12 per group, *p < 0.05). G, Infarct volume of IgG and anti-NK1.1 mice 7 d after pMCAO and 30 min tMCAO (n = 10 per group). Whiskers show the 5th to 95th percentiles. H, Sensorimotor asymmetry of IgG and anti-NK1.1 mice assessed in the corner test at the indicated time points after pMCAO (n = 10 per group). Data of functional tests are expressed as mean ± SD.
We used two experimental paradigms of brain ischemia to test the effect of selective cell depletion: transcranial pMCAO inducing cortical infarcts and 30 min tMCAO resulting in striatal lesions (Fig. 1C). Between 12 h and 3 d after pMCAO, infarct sizes of control and anti-CD8α-treated animals did not differ significantly (Fig. 1D), whereas at days 7 and 14, CTL depletion significantly reduced infarct volumes compared with isotype-treated controls (p = 0.012 and p = 0.009, respectively). Moreover, injection of CD8α-specific antibodies also reduced infarct size when administered 5 h after MCAO induction and tended to reduce infarct volume when given 12 h after stroke onset (Fig. 1D), underlining the therapeutic potential. To assess the functional neurological deficit resulting from pMCAO, we performed the corner test 24 h, 3 d, 7 d, and 14 d after ischemia onset (Fig. 1E). In both control and anti-CD8α-treated groups, MCAO induced an increase in right turns at day 3, indicating behavioral asymmetry. By 7 d after pMCAO, this asymmetry was significantly improved in the anti-CD8α-treated mice compared with controls. By day 14, we observed an improvement of neurologic function in both control and anti-CD8α-treated groups. Similarly to the pMCAO model, CTL depletion significantly reduced infarct volumes 7 d after tMCAO (p = 0.041). This effect was accompanied by improvement in motor function assessed in the cylinder test (Fig. 1F). Consistent with the effect of antibody-mediated depletion, adoptively transferred CD8+ T cells increased the infarct volume of lymphocyte-deficient Rag1−/− mice compared with Rag1−/− mice without cell transfer (see also below).
We then investigated the effect of NK1.1-specific depleting antibody on stroke outcome also in both experimental paradigms. In contrast to anti-CD8α-treated animals, we detected no difference in infarct size between anti-NK1.1-treated and control animals 7 d after ischemia in either the pMCAO or tMCAO model (Fig. 1G). Moreover, sensorimotor dysfunction was not improved by treatment with NK1.1-specific antibodies (Fig. 1H).
The reduction of infarct size in CTL-depleted animals is a result of neuroprotection
The early edema formation and the following shrinkage of the infarct size are well known phenomena of rodent stroke models (Henrich-Noack et al., 2008), complicating the interpretation of results with neuroprotective agents (Dirnagl, 2006). We observed an effect of CTL depletion on infarct size first at 7 d after MCAO in which infarcts were already compacted compared with earlier time points. This raises the question of whether CTL depletion resulted in infarct size reduction as a result of neuroprotection or accelerated removal of the infarcted tissue. To answer this question, we performed NeuN–TUNEL costaining 1, 3, and 7 d after pMCAO (Fig. 2A) and analyzed the ratio of intact neurons among all neurons (NeuN+TUNEL−/NeuN+) in six regions of the infarcted area (Fig. 2B). After the initial neuronal death resulting from cerebral ischemia, we found additional intense neuronal loss between days 1 and 7 that was most prominent in the dorsal regions of the infarct (Fig. 2B). In this area, CTL depletion prevented neuronal loss 7 d after MCAO and resulted in similar ratios of TUNEL− neurons as seen 1 d after stroke (Fig. 2C,D). Our findings suggest that the reduced infarct size observed in CTL-depleted mice resulted from neuroprotection. However, an influence of CTLs on removal of the infarcted brain tissue cannot be ruled out.
Figure 2.

CD8+ T-cell depletion decreases neuronal loss. A, Representative images of NeuN–TUNEL costaining of the infarcted area 3 d after pMCAO. Scale bar, 500 μm. B, Left, Analysis strategy for neuronal death: 300 × 300 μm regions (R1–R6) were chosen in the infarcted area as indicated. Right, In each region, the numbers of intact neurons (NeuN+ TUNEL−) were expressed as percentage value of all neurons (NeuN+). Data indicate the mean value of stainings from five IgG-treated mice (*p < 0.05 for day 1 vs day 7). C, Representative images of NeuN–TUNEL costaining of R1 1 and 7 days after pMCAO in IgG-treated mice and 7 d after pMCAO from CD8+ T-cell-depleted (anti-CD8) mouse. Scale bar, 50 μm. D, Intact (NeuN+ TUNEL−) and apoptotic (NeuN+ TUNEL+) neurons in R1 were counted 1, 3, and 7 d after pMCAO in IgG-treated mice and 7 d after pMCAO from anti-CD8 mice. Alive (white bar) and apoptotic (gray bar) cell numbers are shown as percentage of all neurons (n = 5 per group, *p < 0.05, #p < 0.05 for 7 d IgG vs 7 d anti-CD8). Data are expressed as mean ± SD.
NK cells are more abundant than CTLs in the brain after stroke
We isolated brain-invading leukocytes from the ischemic hemispheres of isotype antibody-, anti-CD8α-, and anti-NK1.1-treated mice 3 and 7 d after pMCAO and analyzed leukocyte subsets by flow cytometry (Fig. 3A). The majority of leukocytes in the brain homogenates were microglia/monocytes and granulocytes 7 d after pMCAO (Fig. 3B). Their number and B-cell counts were altered by neither of the antibody treatments (data not shown). In isotype-treated mice, the number of both CTLs and NK cells increased between 3 and 7 d after MCAO. Approximately threefold higher cell counts of NK cells than CTLs (n = 5, p = 0.0013) were detected in the ischemic hemisphere 7 d after MCAO (Fig. 3C,D). CD8+ and NK1.1+ cell depletion resulted in significantly reduced numbers of the respective cell population at both time points. Interestingly, NK1.1+ cell depletion resulted in an increased number of brain-invading CTLs compared with control animals 7 d after ischemia onset.
Figure 3.

Differential brain infiltration pattern of leukocyte subpopulations. A, Gating strategy for flow cytometric analysis of brain-invading leukocyte subsets. Viable leukocytes were gated on scatter gram followed by gating for CD45+ leukocytes and additional analysis of subpopulations as indicated: CD3+, NKp46+, B220+, Gr-1+, and CD11b+ cells. SCC, Side scatter channel; FSC, forward scatter channel. B, Flow cytometric analysis of absolute cell counts of brain-invading CD3+, NKp46+, B220+, Gr-1+, and CD11b+ cells 7 d after MCAO in IgG-treated animals. C, Representative flow cytometry dot plots and analysis of absolute cell counts of CD8+ cells from isotype control (IgG), anti-CD8α-treated (anti-CD8), and anti-NK1.1-treated (anti-NK1.1) animals 3 and 7 d after MCAO. D, Representative dot plots and analysis of absolute cell counts of NKp46+ cells from IgG, anti-CD8, and anti-NK1.1 animals 3 and 7 d after MCAO (5 individual experiments with 5 pooled animals per group in each experiment; *p < 0.05). E, Representative flow cytometric plots and quantitative analysis of brain-invading CD8+ T cells 12 h, 24 h, 3 d, and 7 d after pMCAO (5 individual experiments with 2 pooled animals per group in each experiment; *p < 0.05). SSC, Side scatter channel. Data in B–E are expressed as mean ± SD.
For a better understanding of the delayed effect on infarct volume and relative long therapeutic time window of CTL depletion, we characterized the kinetics of CTL invasion into the brain by flow cytometry (Fig. 3E). No significant CTL infiltration was detectable 12 h after stroke, the number of CTLs increased between days 1 and 3, whereas the majority of CTLs invaded between days 3 and 7 (Fig. 3E).
Brain-invading CTLs but not NK cells are activated
To investigate the cause of their different effects in the ischemic brain, we examined the activation state of splenic and brain-invading CTLs and NK cells 7 d after MCAO (Fig. 4A,B). Activation of CTLs was determined by the surface expression of CD69, CD44, and CD62L molecules. Brain-invading CTLs were more activated compared to splenic CTLs from either sham-operated or ischemic mice (Fig. 4A,C). In contrast, there was no difference between splenic and brain-invading NK cells in the expression of surface markers B220, NKp46, or CD11c (Fig. 4B,D). Correspondingly, expression of effector function-associated transcription factors, such as Tbet and Eomes (Fig. 4E), did not differ between splenic and brain-invading NK cells. We further investigated the functional activation state of splenic and brain-derived CTL and NK cells isolated 7 d after MCAO by in vitro stimulation and subsequent analysis of IFN-γ expression. Both splenic and brain-invading CTLs responded with IFN-γ production during in vitro stimulation (Fig. 4F). In contrast, only splenic NK cells showed IFN-γ production, suggesting an inactive functional status of brain-invading NK cells.
Figure 4.

CTLs but not NK cells are activated after brain invasion. A, Gating strategy for analysis of CD69 expression in CTLs. The dot plots on top indicate gating of CD8+ cells, and bottom plots show the assessment of CD69-expressing CD8+ cells. B, Gating strategy for analysis of B220 expression on NK1.1+ cells. The dot plots on top indicate gating of NK cells, and bottom plots show the assessment of B220-expressing NK cells. C, CD69, CD44, and CD62L mean fluorescence intensity (MFI, arbitrary units) of splenic and cerebral CTLs isolated 7 d after MCAO or sham operation (5 individual experiments with 5 pooled animals per group in each experiment; *p < 0.05). B220, NKp46, and CD11c (D) and Tbet and Eomes (E) MFI of splenic and brain-invading NK cells isolated 7 d after MCAO or sham operation (5 individual experiments with 5 pooled animals per group in each experiment). F, Ratio of in vitro IFN-γ-producing CTLs and NK cells isolated from spleen and brain 7 d after MCAO (4 individual experiments with 5 pooled animals per group in each experiment; *p < 0.05). Data in C–F are expressed as mean ± SD.
The deleterious effect of CTL is mediated via perforin
In subsequent experiments, we focused on the role of CTLs in cerebral ischemia. To investigate perforin secretion as the potential effector mechanism responsible for the deleterious effect of CTLs, we performed adoptive CTL transfer from WT or Prf1−/− mice into lymphocyte-deficient Rag1−/− mice. IFN-γ production of CTLs isolated from Prf1−/− mice was fully intact as shown by in vitro stimulation assays (data not shown). Seven days after MCAO, the mean infarct size of untreated Rag1−/− mice was ∼50% smaller compared with WT animals. Adoptive transfer of 6 × 10⁶ CTLs from WT mice significantly increased infarct volume (Fig. 5A). In contrast, the infarct size of mice receiving CD8+ T cells from Prf1−/− mice did not differ from untreated Rag1−/− animals.
Figure 5.

Perforin is needed for the deleterious effect of CTL. A, Infarct volume of lymphocyte-deficient Rag1−/− mice receiving 6 × 10⁶ CD8+ T cells from WT or Prf1−/− mice (n = 9 per group; *p < 0.05). Whiskers show the 5th to 95th percentiles. B, Relative expression (RE) of TNF-α and IFN-γ mRNA in the ischemic and non-ischemic hemispheres of Rag1−/− mice with or without cell transfer from WT or Prf1−/− donors 7 d after MCAO (n = 5 per group; *p < 0.05). Data are expressed as mean ± SD. C, Infarct volume of Rag1−/− mice receiving 6 × 10⁶ CD8+ T cells from IFN-γ−/− mice (n = 9 per group; *p < 0.05). Whiskers show the 5th to 95th percentiles. D, Representative image of Map2–CD8 costaining of embryonic cortical neuronal culture 7 d after dissection from E16.5 mouse embryos. Scale bar, 20 μm. E, Representative images of Map2–caspase-3 (Casp-3) costaining of cocultures of neurons with non-activated (Nonact CTL) or activated CD8+ T cells isolated from WT mice (WT aCTL) or activated CD8+ T cells isolated from perforin knock-out (Prf1−/− aCTL) or from IFN-γ knock-out (INF-γ−/− aCTL) mice in a ratio of neurons to CTL 2:1. Scale bar, 20 μm. F, Semiquantitative analysis of Casp-3+ neurons in coculture with non-activated or activated CTLs isolated from WT mice or with activated CTLs isolated from Prf1−/− or INF-γ−/− mice in a ratio of neurons to CTL 2:1 (top) or 10:1 (bottom).
Proinflammatory cytokines, such as INF-γ, are crucial effector molecules in CTL-induced cytotoxicity in models of infectious diseases (Slifka and Whitton, 2000). Therefore, we explored the potential role of proinflammatory cytokines in CTL-induced neurotoxicity. Cerebral expression of TNF-α and IFN-γ in ischemic and non-ischemic hemispheres of Rag1−/− mice receiving adoptive CTL cell transfer from WT or Prf1−/− mice did not differ significantly 7 d after pMCAO (Fig. 5B). Moreover, adoptive transfer of CTL transfer from IFN-γ−/− into Rag1−/− mice significantly increased the infarct size of Rag1−/− mice (Fig. 5C). This suggested rather a minor role of proinflammatory cytokines compared with the perforin pathway in CTL-induced neuronal death after stroke.
We further investigated CTL-mediated neurotoxicity in vitro using coculture of embryonic cortical neurons and CTLs (Fig. 5D). To simulate post-stroke upregulation of cerebral IFN-γ expression (Yilmaz et al., 2006; Liesz et al., 2011), differentiated neurons were incubated with IFN-γ. This increases MHC class I expression on neurons (Neumann et al., 1995) and makes them a potential target for CTLs (Chevalier et al., 2011). Coculture of neurons with non-activated CTLs did not increase neuronal death as measured by caspase-3 staining (Fig. 5E,F). In contrast, activated CTL induced apoptosis in 75.2 and 37.8% of neuronal cells when cocultured in ratios of neurons to CTL of 2:1 and 10:1, respectively. Coculture with activated CTL derived from IFN-γ-deficient mice led to a similar proportion of neuronal cell death as from WT mice. In contrast, activated CD8+ T cells from Prf1−/− mice did not increase the ratio of apoptotic neurons (Fig. 5E,F). Altogether, these in vitro observations further support our in vivo findings regarding the importance of the perforin pathway in CTL-induced neurotoxicity.
To illustrate the interaction between neurons and CTLs suggested by the perforin dependency of CTL-induced neuronal death, we performed in vivo brain imaging by two-photon microscopy after pMCAO (Fig. 6A) focusing on the peri-infarct area. We observed CTLs that appeared to be attached to the vessel wall 3 d after ischemia onset (Fig. 6B). Later, an increasing number of CTLs infiltrated into the brain parenchyma (Fig. 6C). On day 5, some CTLs were in close proximity to neurons, which were no longer detectable on day 7 (Fig. 6D).
Figure 6.

Interaction of CTL with neurons in vivo. A, Representative image of the cranial window (on the left) and two-photon microscopy image of the intact (1), penumbral (2), and infarcted (3) brain area (on the right) of YFP-16 mice expressing YFP in motor and sensory neurons. B, A CMPTX-labeled CTL (red) can be seen in a nonlabeled blood vessel in close proximity to the YFP-16 mouse brain parenchyma 3 d after stroke. Scale bar, 10 μm. C, CMTPX-labeled CD8+ T cells (red) were found in the brain parenchyma 6 d after stroke. Neurons (YFP, yellow) and blood vessels (FITC, miscolored in turquoise) can be seen. Scale bar, 10 μm. D, CMTPX-labeled CD8+ T cells (red, arrow) were in close proximity to neurons (yellow, dashed line) at 5 d after MCAO. These neurons were no longer detectable by YFP signal on day 7. Scale bars, 10 μm.
CTLs require antigen-dependent activation
To analyze whether antigen recognition is required for the activation and the neurotoxic effect of CTLs, we used Rag1 knock-out/OT-I transgenic mice that express exclusively a T-cell receptor (TCR) directed against chicken ovalbumin, an antigen not present in mice. CTLs derived from these mice were functionally competent according to their response to in vitro stimulation with anti-CD3 and ovalbumin (data not shown). Consistent with the previous transfer experiment (Fig. 5A), adoptive transfer of CTLs from WT mice into Rag1−/− mice significantly increased infarct volume 7 d after pMCAO. In contrast, CTL transfer from OT-I animals did not alter stroke outcome (Fig. 7A), indicating the need for antigen-dependent TCR activation for the neurotoxic effector function of CTL.
Figure 7.
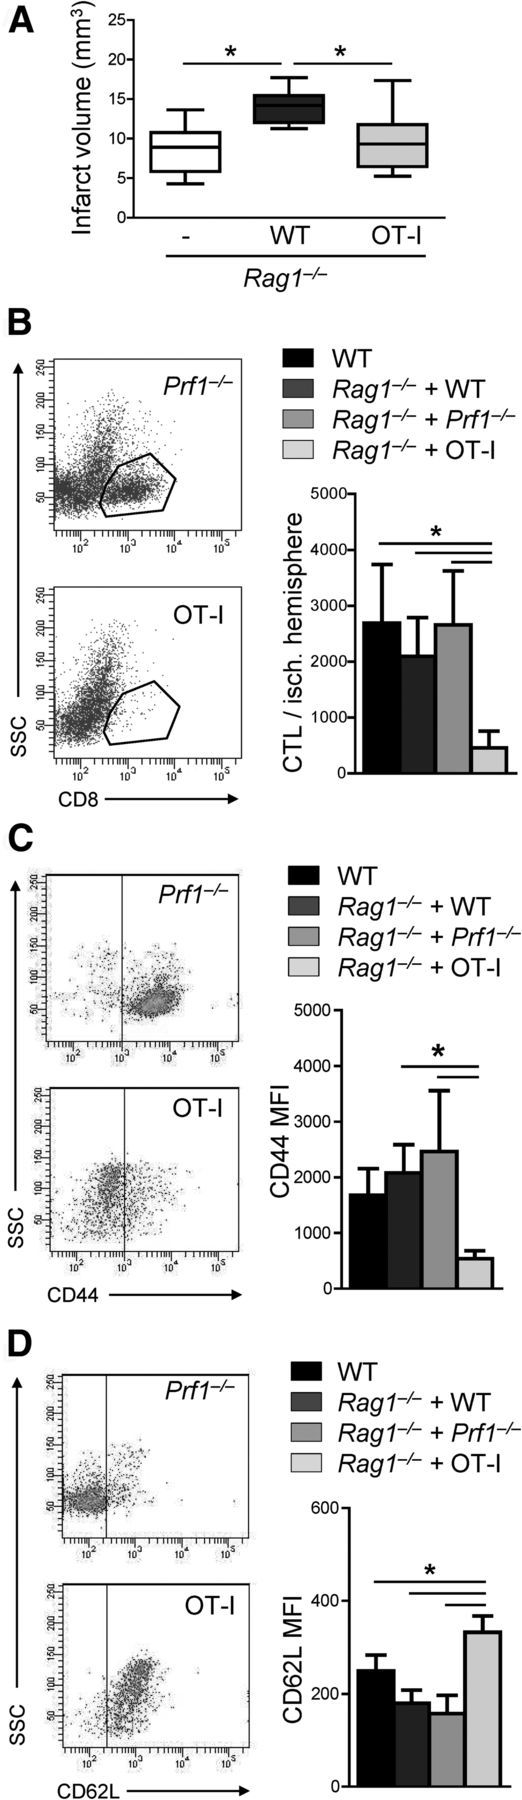
CTLs require antigen-dependent activation for neurotoxicity. A, Infarct volume of lymphocyte-deficient Rag1−/− mice receiving 6 × 10⁶ CD8+ T cells from WT or from Rag1 knock-out/OT-I mice (n = 10 per group; *p < 0.05). Whiskers show the 5th to 95th percentiles. Same data are expressed left to the respective whisker in scatter dot plots with mean. B, Flow cytometric representative dot plots (on the left) and quantitative analysis of absolute cell counts of brain-invading CTLs 7 d after MCAO in WT mice and in Rag1−/− mice receiving 6 × 10⁶ CD8+ T cells from WT, Prf1−/−, or OT-I donor animals (n = 5 per group; *p < 0.05). C, D, Flow cytometric representative dot plots (on the left) and quantitative analysis of CD44 (C) and CD62L (D) expression (MFI, mean fluorescent intensity) of brain-invading CD8+ T cells 7 d after MCAO in WT mice and Rag1−/− mice receiving 6 × 10⁶ CD8+ T cells from WT, Prf1−/−, or OT-I donor animals (n = 5 per group; *p < 0.05).
We further investigated antigen-dependent recruitment of CTLs to the ischemic brain and the activation status of brain-invading CTLs using the adoptive cell-transfer paradigm. CTLs isolated from WT, Prf1−/−, or OT-I donor animals were transferred into Rag1−/− mice. Post-ischemic CTL cell number and activation state of cells from brain were compared with WT animals. The number of brain-invading CTLs in Rag1−/− animals receiving cell transfer from WT and Prf1−/− animals was similar to WT mice. In contrast, significantly less ovalbumin-specific CTLs entered the ischemic brain (Fig. 7B).
We analyzed the activation state of brain-invading CD8+ T cells by CD44 and CD69L expression. The activation state of brain-invading CTLs in WT mice and in Rag1−/− mice receiving cell transfer from WT or Prf1−/− animals was similar, whereas brain-invading ovalbumin-specific CTLs were significantly less activated (Fig. 7C,D). Together, these results suggest an important role of TCR-dependent mechanisms for CTL activation and migration into the ischemic brain.
Discussion
The major findings of our study are that (1) CTLs have delayed deleterious effects after acute cerebral ischemia, (2) they require antigen-dependent activation, and (3) perforin secretion is their main effector mechanism. (4) Despite the similar effector repertoire of NK cells, their depletion did not affect neurological outcome after murine stroke.
The effect of CTLs and the lacking effect of NK cells on stroke outcome was shown in two experimental models (pMCAO vs tMCAO), and neurological deficit paralleled histological outcome. Furthermore, we used two experimental paradigms of CTL elimination (antibody-mediated depletion and selective adoptive cell transfer into lymphocyte-deficient mice) that consistently suggested a deleterious effect of CTLs. Thus, our findings unequivocally support the concept of perforin-mediated neurotoxicity of CTLs after brain ischemia, and a therapeutic window of at least 5 h after ischemia onset suggests potential clinical relevance.
NK cells belong to the “first line of defense” (Lodoen and Lanier, 2006), which can be activated by danger-associated molecules (Elsner et al., 2010). Thus, in theory, NK cells appeared as better candidates for post-ischemic inflammatory brain damage than CTLs. Compared with other immune cells that migrate to the brain within hours after ischemic damage, the post-ischemic brain invasion of T cells occurred with a considerable delay in the present and previous studies (Gelderblom et al., 2009; Liesz et al., 2011; Zhou et al., 2013). Indeed, NK cells outnumbered CTLs approximately threefold in the ischemic brain. However, the activation and functional state of both leukocyte subpopulations differed substantially. We discovered enhanced activation of brain-infiltrating CTLs as revealed by upregulation of CD69 and CD44 and downregulation of CD62L (Caruso et al., 1997; Chao et al., 1997; DeGrendele et al., 1997). In contrast, no difference was found between the activation state of splenic and brain-invading NK cells based on the cell surface expression of B220, CD11c (Vosshenrich et al., 2007), and NKp46 (Sivori et al., 1997). Similarly, transcription factors, such as Tbet and Eomes, that regulate NK cell effector functions (Gordon et al., 2012) did not differ between brain-invading and splenic NK cells. Moreover, CTLs but not NK cells derived from the ischemic brain responded with IFN-γ production to in vitro stimulation. Together, CTLs but not NK cells are activated and only CTLs harm the ischemic brain. The absence of an effect of NK cells on stroke outcome in our experiments contrasts a recent report suggesting a deleterious role of NK cells in ischemia (Gan et al., 2014). This study used an ischemia model that causes large brain infarcts, a wasting syndrome, severe systemic immune depression (Liesz et al., 2009; Meisel and Meisel, 2011), and less inflammatory brain invasion (Zhou et al., 2013) than the models used in our study. Nevertheless, this discrepancy may potentially point to heterogeneous—beneficial and deleterious—roles of different NK cell subpopulations. Despite increasing the number of infiltrating CTLs in our study, depletion of NK1.1+ cells did not worsen neurological outcome. NK cell-mediated suppressor effects were described in experimental allergic encephalomyelitis (Zhang et al., 1997; Xu et al., 2005). Therefore, the effect of distinct subpopulations of NK cells in different forms of cerebral ischemia deserves additional attention.
CD8+ T cells may play deleterious roles either through contact-dependent direct cytotoxicity or via humoral pathways, including the release of IFN-γ (Harty et al., 2000). Neither the transfer of purified CD8+ T cells into Rag1−/− mice affected cerebral expression of proinflammatory cytokines such as IFN-γ, nor did the lack of IFN-γ attenuated CTL-induced neurotoxicity in vivo or in vitro. This suggested a more important role of direct cytotoxicity in ischemia for CTL-mediated neuronal damage. The direct cytotoxic effect of CTL can be mediated via two independent pathways: (1) the release of cytotoxic granules containing perforin and granzymes; or (2) via receptor/ligand interaction between Fas receptor on the target cell and Fas ligand (FasL) on CTLs (Kägi et al., 1996). We focused on the perforin pathway because our previous experiments in perforin-deficient mouse strains supported the importance of perforin-mediated cytotoxicity in post-ischemic brain damage (Liesz et al., 2011). Moreover, murine neurons are resistant to FasL-mediated killing but are highly sensitive to cytotoxic granules in vitro (Rensing-Ehl et al., 1996). Although Prf1−/− CD8+ T cells were activated and infiltrated the ischemic brain, they failed to increase infarct volume. Moreover, CD8+ T cells isolated from Prf1−/− mice did not show neurotoxic effects in vitro, consistent with a crucial role of the perforin-dependent neurotoxic effect of CTLs. We found CTLs in close vicinity to some of the degenerating neurons using in vivo two-photon microscopy compatible with a cell–cell contact-dependent cytolytic activity. However, the exact mechanisms of cellular interaction have to be elucidated further.
The involvement of antigen-dependent activation and clonal expansion of T cells in post-ischemic neuroinflammation is an important unresolved issue of stroke immunology (Iadecola and Anrather, 2011). In the present study, adoptive transfer of CTLs expressing ovalbumin-specific TCR resulted in impaired cell activation, reduced CTL brain invasion, and smaller infarct volumes 7 d after stroke. Early detrimental effects of T cells appeared to be independent of antigen recognition (Kleinschnitz et al., 2010). Our results indicate the requirement of antigen-dependent CTL activation for their delayed neurotoxic effects. Additional studies will be needed to address the distinct pathways and involved antigens for CTL activation.
In conclusion, our study provides important new insights into the mechanisms of direct cytotoxicity in immune-mediated ischemic brain damage. Only antigen dependently activated CTLs exert a profound delayed neurotoxic effect via the perforin pathway, whereas NK cells do not affect outcome. CTL depletion by specific antibodies or neutralization of their effector mechanism are potential targets for stroke therapy.
Footnotes
This study was supported by German Research Foundation Grant VE 196/3-1.
The authors declare no competing financial interests.
References
- Biron CA, Nguyen KB, Pien GC, Cousens LP, Salazar-Mather TP. Natural killer cells in antiviral defense: function and regulation by innate cytokines. Annu Rev Immunol. 1999;17:189–220. doi: 10.1146/annurev.immunol.17.1.189. [DOI] [PubMed] [Google Scholar]
- Caruso A, Licenziati S, Corulli M, Canaris AD, De Francesco MA, Fiorentini S, Peroni L, Fallacara F, Dima F, Balsari A, Turano A. Flow cytometric analysis of activation markers on stimulated T cells and their correlation with cell proliferation. Cytometry. 1997;27:71–76. doi: 10.1002/(SICI)1097-0320(19970101)27:1<71::AID-CYTO9>3.0.CO;2-O. [DOI] [PubMed] [Google Scholar]
- Chamorro Á, Meisel A, Planas AM, Urra X, van de Beek D, Veltkamp R. The immunology of acute stroke. Nat Rev Neurol. 2012;8:401–410. doi: 10.1038/nrneurol.2012.98. [DOI] [PubMed] [Google Scholar]
- Chao CC, Jensen R, Dailey MO. Mechanisms of L-selectin regulation by activated T cells. J Immunol. 1997;159:1686–1694. [PubMed] [Google Scholar]
- Chevalier G, Suberbielle E, Monnet C, Duplan V, Martin-Blondel G, Farrugia F, Le Masson G, Liblau R, Gonzalez-Dunia D. Neurons are MHC class I-dependent targets for CD8 T cells upon neurotropic viral infection. PLoS Pathog. 2011;7:e1002393. doi: 10.1371/journal.ppat.1002393. [DOI] [PMC free article] [PubMed] [Google Scholar]
- DeGrendele HC, Estess P, Siegelman MH. Requirement for CD44 in activated T cell extravasation into an inflammatory site. Science. 1997;278:672–675. doi: 10.1126/science.278.5338.672. [DOI] [PubMed] [Google Scholar]
- Dirnagl U. Bench to bedside: the quest for quality in experimental stroke research. J Cereb Blood Flow Metab. 2006;26:1465–1478. doi: 10.1038/sj.jcbfm.9600298. [DOI] [PubMed] [Google Scholar]
- Donnan GA, Fisher M, Macleod M, Davis SM. Stroke. Lancet. 2008;371:1612–1623. doi: 10.1016/S0140-6736(08)60694-7. [DOI] [PubMed] [Google Scholar]
- Drummond GB, Paterson DJ, McGrath JC. ARRIVE: new guidelines for reporting animal research. Exp Physiol. 2010;95:841. doi: 10.1113/expphysiol.2010.053785. [DOI] [PubMed] [Google Scholar]
- Elsner L, Flügge PF, Lozano J, Muppala V, Eiz-Vesper B, Demiroglu SY, Malzahn D, Herrmann T, Brunner E, Bickeböller H, Multhoff G, Walter L, Dressel R. The endogenous danger signals HSP70 and MICA cooperate in the activation of cytotoxic effector functions of NK cells. J Cell Mol Med. 2010;14:992–1002. doi: 10.1111/j.1582-4934.2008.00677.x. [DOI] [PMC free article] [PubMed] [Google Scholar]
- Gan Y, Liu Q, Wu W, Yin JX, Bai XF, Shen R, Wang Y, Chen J, La Cava A, Poursine-Laurent J, Yokoyama W, Shi FD. Ischemic neurons recruit natural killer cells that accelerate brain infarction. Proc Natl Acad Sci U S A. 2014;111:2704–2709. doi: 10.1073/pnas.1315943111. [DOI] [PMC free article] [PubMed] [Google Scholar]
- Gelderblom M, Leypoldt F, Steinbach K, Behrens D, Choe CU, Siler DA, Arumugam TV, Orthey E, Gerloff C, Tolosa E, Magnus T. Temporal and spatial dynamics of cerebral immune cell accumulation in stroke. Stroke. 2009;40:1849–1857. doi: 10.1161/STROKEAHA.108.534503. [DOI] [PubMed] [Google Scholar]
- Gordon SM, Chaix J, Rupp LJ, Wu J, Madera S, Sun JC, Lindsten T, Reiner SL. The transcription factors T-bet and Eomes control key checkpoints of natural killer cell maturation. Immunity. 2012;36:55–67. doi: 10.1016/j.immuni.2011.11.016. [DOI] [PMC free article] [PubMed] [Google Scholar]
- Harty JT, Tvinnereim AR, White DW. CD8+ T cell effector mechanisms in resistance to infection. Annu Rev Immunol. 2000;18:275–308. doi: 10.1146/annurev.immunol.18.1.275. [DOI] [PubMed] [Google Scholar]
- Henrich-Noack P, Baldauf K, Reiser G, Reymann KG. Pattern of time-dependent reduction of histologically determined infarct volume after focal ischaemia in mice. Neurosci Lett. 2008;432:141–145. doi: 10.1016/j.neulet.2007.12.029. [DOI] [PubMed] [Google Scholar]
- Iadecola C, Anrather J. The immunology of stroke: from mechanisms to translation. Nat Med. 2011;17:796–808. doi: 10.1038/nm.2399. [DOI] [PMC free article] [PubMed] [Google Scholar]
- Kägi D, Ledermann B, Bürki K, Zinkernagel RM, Hengartner H. Molecular mechanisms of lymphocyte-mediated cytotoxicity and their role in immunological protection and pathogenesis in vivo. Annu Rev Immunol. 1996;14:207–232. doi: 10.1146/annurev.immunol.14.1.207. [DOI] [PubMed] [Google Scholar]
- Kägi D, Odermatt B, Seiler P, Zinkernagel RM, Mak TW, Hengartner H. Reduced incidence and delayed onset of diabetes in perforin-deficient nonobese diabetic mice. J Exp Med. 1997;186:989–997. doi: 10.1084/jem.186.7.989. [DOI] [PMC free article] [PubMed] [Google Scholar]
- Kaur G, Trowsdale J, Fugger L. Natural killer cells and their receptors in multiple sclerosis. Brain. 2013;136:2657–2676. doi: 10.1093/brain/aws159. [DOI] [PMC free article] [PubMed] [Google Scholar]
- Kleinschnitz C, Schwab N, Kraft P, Hagedorn I, Dreykluft A, Schwarz T, Austinat M, Nieswandt B, Wiendl H, Stoll G. Early detrimental T-cell effects in experimental cerebral ischemia are neither related to adaptive immunity nor thrombus formation. Blood. 2010;115:3835–3842. doi: 10.1182/blood-2009-10-249078. [DOI] [PubMed] [Google Scholar]
- Lambertsen KL, Gregersen R, Meldgaard M, Clausen BH, Heibøl EK, Ladeby R, Knudsen J, Frandsen A, Owens T, Finsen B. A role for interferon-gamma in focal cerebral ischemia in mice. J Neuropathol Exp Neurol. 2004;63:942–955. doi: 10.1093/jnen/63.9.942. [DOI] [PubMed] [Google Scholar]
- Li X, Blizzard KK, Zeng Z, DeVries AC, Hurn PD, McCullough LD. Chronic behavioral testing after focal ischemia in the mouse: functional recovery and the effects of gender. Exp Neurol. 2004;187:94–104. doi: 10.1016/j.expneurol.2004.01.004. [DOI] [PubMed] [Google Scholar]
- Liesz A, Hagmann S, Zschoche C, Adamek J, Zhou W, Sun L, Hug A, Zorn M, Dalpke A, Nawroth P, Veltkamp R. The spectrum of systemic immune alterations after murine focal ischemia: immunodepression versus immunomodulation. Stroke. 2009;40:2849–2858. doi: 10.1161/STROKEAHA.109.549618. [DOI] [PubMed] [Google Scholar]
- Liesz A, Zhou W, Mracskó E, Karcher S, Bauer H, Schwarting S, Sun L, Bruder D, Stegemann S, Cerwenka A, Sommer C, Dalpke AH, Veltkamp R. Inhibition of lymphocyte trafficking shields the brain against deleterious neuroinflammation after stroke. Brain. 2011;134:704–720. doi: 10.1093/brain/awr008. [DOI] [PubMed] [Google Scholar]
- Lodoen MB, Lanier LL. Natural killer cells as an initial defense against pathogens. Curr Opin Immunol. 2006;18:391–398. doi: 10.1016/j.coi.2006.05.002. [DOI] [PMC free article] [PubMed] [Google Scholar]
- Macrez R, Ali C, Toutirais O, Le Mauff B, Defer G, Dirnagl U, Vivien D. Stroke and the immune system: from pathophysiology to new therapeutic strategies. Lancet Neurol. 2011;10:471–480. doi: 10.1016/S1474-4422(11)70066-7. [DOI] [PubMed] [Google Scholar]
- Meisel C, Meisel A. Suppressing immunosuppression after stroke. N Engl J Med. 2011;365:2134–2136. doi: 10.1056/NEJMcibr1112454. [DOI] [PubMed] [Google Scholar]
- Neumann H, Cavaliée A, Jenne DE, Wekerle H. Induction of MHC class I genes in neurons. Science. 1995;269:549–552. doi: 10.1126/science.7624779. [DOI] [PubMed] [Google Scholar]
- Rensing-Ehl A, Malipiero U, Irmler M, Tschopp J, Constam D, Fontana A. Neurons induced to express major histocompatibility complex class I antigen are killed via the perforin and not the Fas (APO-1/CD95) pathway. Eur J Immunol. 1996;26:2271–2274. doi: 10.1002/eji.1830260945. [DOI] [PubMed] [Google Scholar]
- Rieux-Laucat F, Le Deist F, De Saint Basile G. Autoimmune lymphoproliferative syndrome and perforin. N Engl J Med. 2005;352:306–307. doi: 10.1056/NEJM200501203520319. author reply 306–307. [DOI] [PubMed] [Google Scholar]
- Schroeter M, Jander S. T-cell cytokines in injury-induced neural damage and repair. Neuromolecular Med. 2005;7:183–195. doi: 10.1385/NMM:7:3:183. [DOI] [PubMed] [Google Scholar]
- Sivori S, Vitale M, Morelli L, Sanseverino L, Augugliaro R, Bottino C, Moretta L, Moretta A. p46, a novel natural killer cell-specific surface molecule that mediates cell activation. J Exp Med. 1997;186:1129–1136. doi: 10.1084/jem.186.7.1129. [DOI] [PMC free article] [PubMed] [Google Scholar]
- Slifka MK, Whitton JL. Antigen-specific regulation of T cell-mediated cytokine production. Immunity. 2000;12:451–457. doi: 10.1016/S1074-7613(00)80197-1. [DOI] [PubMed] [Google Scholar]
- Stenger S, Hanson DA, Teitelbaum R, Dewan P, Niazi KR, Froelich CJ, Ganz T, Thoma-Uszynski S, Melián A, Bogdan C, Porcelli SA, Bloom BR, Krensky AM, Modlin RL. An antimicrobial activity of cytolytic T cells mediated by granulysin. Science. 1998;282:121–125. doi: 10.1126/science.282.5386.121. [DOI] [PubMed] [Google Scholar]
- Sun JC, Lanier LL. NK cell development, homeostasis and function: parallels with CD8(+) T cells. Nat Rev Immunol. 2011;11:645–657. doi: 10.1038/nri3044. [DOI] [PMC free article] [PubMed] [Google Scholar]
- Varda-Bloom N, Leor J, Ohad DG, Hasin Y, Amar M, Fixler R, Battler A, Eldar M, Hasin D. Cytotoxic T lymphocytes are activated following myocardial infarction and can recognize and kill healthy myocytes in vitro. J Mol Cell Cardiol. 2000;32:2141–2149. doi: 10.1006/jmcc.2000.1261. [DOI] [PubMed] [Google Scholar]
- Vila N, Castillo J, Dávalos A, Chamorro A. Proinflammatory cytokines and early neurological worsening in ischemic stroke. Stroke. 2000;31:2325–2329. doi: 10.1161/01.STR.31.10.2325. [DOI] [PubMed] [Google Scholar]
- Vosshenrich CA, Lesjean-Pottier S, Hasan M, Richard-Le Goff O, Corcuff E, Mandelboim O, Di Santo JP. CD11cloB220+ interferon-producing killer dendritic cells are activated natural killer cells. J Exp Med. 2007;204:2569–2578. doi: 10.1084/jem.20071451. [DOI] [PMC free article] [PubMed] [Google Scholar]
- Welsh P, Lowe GD, Chalmers J, Campbell DJ, Rumley A, Neal BC, MacMahon SW, Woodward M. Associations of proinflammatory cytokines with the risk of recurrent stroke. Stroke. 2008;39:2226–2230. doi: 10.1161/STROKEAHA.107.504498. [DOI] [PubMed] [Google Scholar]
- Xu W, Fazekas G, Hara H, Tabira T. Mechanism of natural killer (NK) cell regulatory role in experimental autoimmune encephalomyelitis. J Neuroimmunol. 2005;163:24–30. doi: 10.1016/j.jneuroim.2005.02.011. [DOI] [PubMed] [Google Scholar]
- Yilmaz G, Arumugam TV, Stokes KY, Granger DN. Role of T lymphocytes and interferon-gamma in ischemic stroke. Circulation. 2006;113:2105–2112. doi: 10.1161/CIRCULATIONAHA.105.593046. [DOI] [PubMed] [Google Scholar]
- Zhang B, Yamamura T, Kondo T, Fujiwara M, Tabira T. Regulation of experimental autoimmune encephalomyelitis by natural killer (NK) cells. J Exp Med. 1997;186:1677–1687. doi: 10.1084/jem.186.10.1677. [DOI] [PMC free article] [PubMed] [Google Scholar]
- Zhang L, Schallert T, Zhang ZG, Jiang Q, Arniego P, Li Q, Lu M, Chopp M. A test for detecting long-term sensorimotor dysfunction in the mouse after focal cerebral ischemia. J Neurosci Methods. 2002;117:207–214. doi: 10.1016/S0165-0270(02)00114-0. [DOI] [PubMed] [Google Scholar]
- Zhang ZX, Wang S, Huang X, Min WP, Sun H, Liu W, Garcia B, Jevnikar AM. NK cells induce apoptosis in tubular epithelial cells and contribute to renal ischemia-reperfusion injury. J Immunol. 2008;181:7489–7498. doi: 10.4049/jimmunol.181.11.7489. [DOI] [PubMed] [Google Scholar]
- Zhou W, Liesz A, Bauer H, Sommer C, Lahrmann B, Valous N, Grabe N, Veltkamp R. Postischemic brain infiltration of leukocyte subpopulations differs among murine permanent and transient focal cerebral ischemia models. Brain Pathol. 2013;23:34–44. doi: 10.1111/j.1750-3639.2012.00614.x. [DOI] [PMC free article] [PubMed] [Google Scholar]