

Abstract
A hallmark of Alzheimer's disease (AD) brain is the amyloid β (Aβ) plaque, which is comprised of Aβ peptides. Multiple lines of evidence suggest that Aβ oligomers are more toxic than other peptide forms. We sought to develop a robust assay to quantify oligomers from CSF. Antibody 19.3 was compared in one-site and competitive ELISAs for oligomer binding specificity. A two-site ELISA for oligomers was developed using 19.3 coupled to a sensitive, bead-based fluorescent platform able to detect single photons of emitted light. The two-site ELISA was >2500× selective for Aβ oligomers over Aβ monomers with a limit of detection ∼0.09 pg/ml in human CSF. The lower limit of reliable quantification of the assay was 0.18 pg/ml and the antibody pairs recognized Aβ multimers comprised of either synthetic standards, or endogenous oligomers isolated from confirmed human AD and healthy control brain. Using the assay, a significant 3- to 5-fold increase in Aβ oligomers in human AD CSF compared with comparably aged controls was demonstrated. The increase was seen in three separate human cohorts, totaling 63 AD and 54 controls. CSF oligomers ranged between 0.1 and 10 pg/ml. Aβ oligomer levels did not strongly associate with age or gender, but had an inverse correlation with MMSE score. The C statistic for the Aβ oligomer ROC curve was 0.86, with 80% sensitivity and 88% specificity to detect AD, suggesting reasonable discriminatory power for the AD state and the potential for utility as a diagnostic marker.
Keywords: Abeta oligomer, Alzheimer
Introduction
Alzheimer's disease (AD) is defined by brain neurofibrillary tangles and senile plaques. A major plaque component, β amyloid peptide (Aβ), derives from the amyloid precursor protein (APP). Human genetics supports the disease relevance of Aβ including familial mutations in the APP gene and in genes linked to Aβ production (Zetzsche et al., 2010).
Aβ appears to exist in dynamic equilibrium including monomers, oligomers, and fibrils (McLean et al., 1999; Mc Donald et al., 2010; Benilova et al., 2012; Klein, 2013). Oligomeric Aβ seems to be the most toxic form and has been isolated from AD brain (Kuo et al., 1996; Gong, et al., 2003; Shankar et al., 2008; Tomic et al., 2009; Koffie et al., 2012). In model systems, oligomers are more toxic and correlate with cognitive impairments in AD mouse models (Lesné et al., 2006; Cheng et al., 2007; Hernandez et al., 2010), and humans (Tomic et al., 2009; Mc Donald et al., 2010). Therapies targeting Aβ oligomers directly, or targeting post-translational modifications that predispose toward oligomer formation, have been advanced (Gong et al., 2003; Lesné et al., 2006; McLaurin et al., 2006; Townsend et al., 2006; Schilling et al., 2008; Lambert et al., 2009; Demattos et al., 2012; Nussbaum et al., 2012).
A major challenge to assessing the role of Aβ oligomers in AD is the lack of qualified assays. Published approaches include (1) seeded polymerization with fluorescence correlation spectroscopy (Pitschke et al., 1998); (2) Aβ ELISA detection following oligomer enrichment, including size-exclusion chromatography (SEC; Fukumoto et al., 2010) or matrices enriching aggregated proteins (Gao et al., 2010); (3) flow cytometry using fluorescent resonance energy transfer (Sancesario et al., 2012; Santos et al., 2012); (4) conformation-specific oligomeric Aβ antibodies in a nanoparticle assay (Georganopoulou et al., 2005); and (5) using the same antibody to both capture and detect oligomers, in an ELISA format (Howlett et al., 1999; Bruggink et al., 2013; Hölttä et al., 2013; Herskovits et al., 2013). Full validation of the above assays, including intra-assay/inter-assay variability, spike recovery, dilution linearity, and limit of detection, is not usually reported. While these groups overall found higher oligomer signals in AD CSF versus control, there is little agreement in reported levels. Aβ oligomer estimates range between single digit femtomoles to double digit picomoles within human CSF (Georganopoulou et al., 2005, Bruggink et al., 2013), with many assays only reporting relative relationships. Recent data suggest a CSF range between <0.2 pg/ml through 10 pg/ml (Hölttä et al., 2013). Other assays have not detected oligomers in body fluids, though the same or similar approaches detect brain oligomers (Barghorn et al., 2005; Schupf et al., 2008; Xia et al., 2009; Esparza et al., 2013; Yang et al., 2013). These data suggest that if CSF Aβ oligomers are present, they are at the lower end of published values. We sought to establish a robust, quantitative and selective assay to determine whether Aβ oligomers are enriched in AD CSF and if so, their relationship to some clinical parameters.
Materials and Methods
Aβ oligomer preparations and Aβ monomer.
Aβ1–40 and Aβl-42 (Aβ40 and Aβ42) were obtained from American Peptide. Monomer solutions were prepared as described previously (Sankaranarayanan et al., 2009). Aβ oligomer preparations have also been previously described (amyloid-derived diffusible ligands, ADDLs; Lambert et al., 1998; Chromy et al., 2003 Gong et al., 2003; Lacor et al., 2004; Hepler et al., 2006; Freir et al., 2011). The oligomer supernatants were subsequently filtered through a 0.5 ml column YM-50 filter tube (Millipore; catalog #UFC505096, 0.5 ml) via spin at 4000 rpm for 15 min at 4°C. Retentate, which was used as the enriched oligomer standard, was collected by reversing the filter insert, replaced into a new collection tube, and then centrifuged at 4000 rpm for 5 min at 4°C. Protein concentration was measured by Bradford Assay (Bio-Rad; catalog #23236) and reported as micrograms per milliliter. Oligomer and monomer aliquots were stored at −80°C.
19.3 oligomer-selective antibody.
Human IgG2 antibody 19.3 was modified from a mouse monoclonal (3B3) and demonstrated selectivity for oligomers versus either monomeric or fibrillar Aβ (U.S. Pat. Nos.7,811,563 and 7,780,963). Mouse monoclonal antibody, 3B3 (also known as ACU-921), was generated by immunizing mice with Aβ1–42 ADDL oligomers mixed 1:1 with either Freund's (first and second vaccine, subcutaneously) or incomplete Freund's adjuvant (all subsequent vaccinations, intraperitoneal). Each injection consisted of oligomers equivalent to 194 ± 25 μg of total protein. Subsequently, the mouse clone 3B3 was converted to a human IgG2 antibody. Variable heavy and light chain domain regions of 3B3, encoding the Aβ oligomer binding domain, were sequenced and cDNA encoding these complementarity-determining regions were introduced in a human IgG2 context. An affinity maturation library was generated with variable heavy and light chain domains of 3B3 introduced within the pFab3D phage display vector. Ligation products were transfected into Escherichia coli TG1 cells, phage culture supernatants were concentrated, and aliquots were made for phage library panning, conducted using biotinylated Aβ42 ADDL oligomers. Phages bound to biotinylated ADDLs were eluted and added again to E. coli TG1 cells. Biotinylated ADDLs were prepared using methods noted above (Shughrue et al., 2010), but starting with N-terminal biotinylated Aβ42 peptide (American Peptide). Phage supernatants (100 μl) were used for analysis in one-site ELISAs using either Aβ monomers, oligomers, or fibrils (data not shown), and 19.3 was selective for oligomers.
ELISA methods.
Three types of ELISA methods were used in this study. One-site ELISA used a well surface coated with the analyte (i.e., Aβ monomer), followed by an antibody binding step and an antibody detection system to quantify the amount of analyte. Two-site ELISA used a well surface coated with an antibody to the analyte of interest, followed by addition/binding of the analyte, addition of a second antibody that also binds the analyte, and a detection system to quantify the amount of analyte. The third type of ELISA, competitive, binds an analyte (i.e., Aβ monomer) to the plate, then binds antibody at subsaturating concentration (i.e., EC50) in the presence of varying concentrations of a second analyte (i.e., Aβ oligomer) in solution. An antibody detection system is used to quantify the amount of antibody, which remained bound to the first analyte, hence the relative binding affinity of the antibody for each analyte.
Determination of 19.3 antibody EC50 binding to Aβ oligomers and monomers.
Employing a one-site ELISA method, high protein binding plates were coated at 430 ng/well with Aβ40 or at 215 ng/well with Aβ oligomers in PBS, overnight at 4°C. The next day, plates were washed five times with PBS + 0.05% Tween 20 (PBS-T) and blocked overnight with casein blocking buffer (Thermo Scientific) containing 0.05% Tween 20. The 19.3 antibody was tested from 0 to 15 μg/ml in a 12-point, threefold dilution series, solubilized in casein blocking buffer. After incubation for 2 h at room temperature, plates were washed and alkaline phosphatase-conjugated anti-human IgG (Thermo Scientific) was added at 0.08 μg/ml for 45 min at room temperature. Plates were then washed and Tropix CDP-Star substrate (Applied Biosystems) was added. Luminescence was detected after 30 min on an Envision plate reader (PerkinElmer). Curve fits were completed using GraphPad Prism software (GraphPad Software).
Competitive binding ELISAs with Aβ oligomers and monomer.
Plates coated with oligomers or monomers were prepared as above. Antibody 19.3 was applied at the respective EC50 concentrations derived from the one-site ELISAs in casein buffer to each well and allowed to bind Aβ oligomers or Aβ40 monomer for 30 min at room temperature with shaking. A 12-point, threefold concentration curve, starting at 45 μg/ml for either oligomers or monomer, was applied to the antibody-containing wells. For oligomer/19.3 plates, Aβ40 was added to the wells; for monomer/19.3 plates, oligomers were added to the wells. Plates were incubated 1.5 h at room temperature and EC50 calculations were determined as above.
Aβ40 and Aβ42 monomer or total Aβ two-site ELISA.
Aβ monomer ELISAs were previously reported (Sankaranarayanan et al., 2009) using commercially available antibodies: 6E10 (Aβ3-8), 12F4 (Aβ42-selective), and G210 (Aβ40-selective) (Covance). Total Aβ ELISA used comparable methods including capture with antibody 6E10, except the detecting antibody was 4G8 (Aβ17-24; Covance; Wu et al., 2013).
Aβ oligomers two-site ELISA using Envision platform.
A 96-well, plate-based oligomer ELISA was used to evaluate oligomer standards, human brain extracts, or CSF. Antibody 19.3 was coated at 0.5 μg per well in sodium bicarbonate buffer (ThermoFisher #28382) overnight at 4°C. Wells were washed with PBS-T and blocked overnight at 4°C with 200 μl/well casein buffer in PBS-T (ThermoFisher #37528). Oligomer standards, Aβ monomer standards, or SEC fractions of Aβ preps or human brain were diluted in casein buffer and added at 100 μl/well. Next day, plates were washed five times with PBS-T, and Biotin-82E1 (IBL; catalog #10326) was added at 100 μl/well in casein buffer for 1 h at room temperature. Plates were washed with PBS-T and NeutrAvidin-alkaline phosphatase (ThermoFisher #31002) was added for 30 min at room temperature. After additional PBS-T washes, Tropix CDP-Star chemiluminescent substrate (Life Technologies) was added for 30 min. Luminescence was quantified on an Envision plate reader. Dilutions providing signal in the linear range of the standard curves were used for calculation of sample concentration.
In addition to the 19.3 and 82E1 antibody pair described above, additional pairs were compared for the ability to selectively detect oligomers, including 6E10 as both capture and detect (homotypic), and 19.3 homotypic ELISAs. In each case, the detecting antibody was conjugated to biotin using established procedures, and the use of NeutrAvidin-alkaline phosphatase and CDP-star chemiluminescent substrate was identical as described above.
SEC and multi-angle laser light scattering.
SEC was performed on an Agilent 1100 series HPLC equipped with a Wyatt Technology Optilab rEX refractive index detector and a Wyatt DAWN HELEOS-II multi-angle laser light scattering (MALLS) detector. Light scattering data were processed using Wyatt Astra software. All chromatographic separations were completed under isocratic conditions in 25 mm sodium phosphate buffer, pH 7.3, using a GE Healthcare Life Sciences Superdex 75 10/300GL Column (10 × 300 mm) that was kept at ambient temperature. Parameters of this column included an exclusion limit of 100 kDa and an optimal fractionation range of globular proteins between 3 and 70 kDa. Ultraviolet (UV) detection was monitored at 280 and 210 nm. The flow rate was maintained at 0.5 ml/min during a complete run time of 60 min. Synthetic Aβ42 oligomers, HFIP-treated Aβ40, or Aβ42 monomer preparations, injected at equal concentrations and volumes, were analyzed for absolute mass determination using in-line MALLS. Molecular weight calibrations were conducted using Bio-Rad globular protein standards. Globular protein size standards were run on the same column under the same conditions, including (1) thyroglobulin (670 kDa), (2) gamma globulin (158 kDa), (3) ovalbumin (44 kDa), (4) myoglobin (17 kDa), and 5) vitamin B12 (1.35 kDa). The standards serve as calibration controls and estimation of the low molecular weight (LMW) peaks rather than to accurately predict high molecular weight (HMW) fraction sizes. Sample fractionations were performed using a Dionex 2D UHPLC (Thermo Fisher Scientific). Data analysis was performed using Chromeleon 6.8 Chromatography Data System software. Fractions were collected every 1 min at 4°C into 0.05% Tween 20-preloaded Eppendorf low-binding 96 deep-well plates that were subsequently used in Aβ monomer and Aβ oligomer assays.
Aβ oligomer two-site ELISA using Erenna platform.
The flow-based, Aβ oligomer sandwich ELISA was constructed using a paramagnetic microparticle, immunoassay platform (Erenna immunoassay system; Singulex; Todd et al., 2007). Microparticles (MPs) to capture Aβ oligomers were prepared by binding 12.5 μg of biotinylated 19.3 per milligram of streptavidin-coated MPs. Monoclonal antibody 19.3 is a humanized version of a mouse monoclonal antibody 3B3, generated using Aβ1-42 ADDL oligomers as immunogen (see above). 19.3-bound MPs were diluted to 100 μg/ml in assay buffer (Tris buffer; 50 mm Tris, 150 mm NaCl, pH 7.6), with 1% Triton X-100, d-desthiobiotin, 0.1% bovine serum albumin (BSA) and added at 100 μl to 100 μl of neat CSF sample, brain supernatant, or standards (diluted from 42 to 0.04 pg/ml in Tris buffer and 3% BSA with protease and phosphatase inhibitor cocktail; Sigma), followed by incubation for 2 h at 25°C. The 19.3-MPs were retained via a magnetic bed, and unbound material was removed in a single wash step with assay diluent using the HydroFlex plate washer (Tecan). Fluorescent-labeled detection antibody 82E1 (IBL) was diluted to a final concentration of 500 pg/ml and filtered through a 0.2 μm filter (Pall 4187) and the antibody was added at 20 μl/well. The 96-well plates containing the MP-coupled antibody/antigen sandwiches were incubated for 1 h at 25°C, while shaking (Jitterbug; Boekel). MP complexes were washed four times with assay buffer to remove unbound detection reagent. MP/19.3/Aβ oligomer/82E1 complexes were transferred to a new plate, buffer was aspirated, and 10 μl/well of elution buffer was added, followed by 5 min incubation at 25°C while shaking in the Jitterbug. Eluted, fluor-labeled 82E1 was transferred to a 384-plate containing 10 μl/well neutralization buffer and read on the Erenna instrument at 60 s per well read time. Three signal outputs were obtained: detected events (low end signal), event photons (low end and higher end signal), and total photons (high end signal). Singulex Sgx link and Microsoft Excel were used for statistical analysis and a standard 4-parameter curve fit of the data was used to generate the calibration curve and interpolation of data. Limit of detection (LOD) is defined as 2 × SD Bkg/slope and the lower limit of reliable quantification (LLORQ) is defined as the lowest back interpolated standard that provides signal 2× over background with percentage coefficient of variance (CV) ≤20%.
Human CSF and pre-analytical considerations.
Individual human aged control or AD CSF of either sex were obtained from Bioreclamation (Cohort 1, Table 2) or Precision Med (Cohorts 2 and 3, Tables 2, 3). Diagnostic criteria for the AD population include: National Institute of Neurological and Communicative Disorders and Stroke-Alzheimer's Disease and Related Disorders Association criteria (McKhann et al., 1984), Mini Mental State Examination (MMSE) 14–26, deficits in two or more areas of cognition, progressive worsening of memory, onset between 40 and 90 years (usually >65), no disturbance of consciousness, CT or MRI consistent with AD, and other systemic or cerebral disease excluded. Other non-AD neurologic or psychiatric controls included patients diagnosed with schizophrenia, amyotrophic lateral sclerosis (ALS), or Parkinson's disease (PD). Diagnostic criteria for schizophrenic patients followed DSM-IV diagnostic criteria for schizophrenia and schizoaffective disorder as defined in the DSM-IV (295.10, 295.20, 295.30, 295.60, 295.90, and 295.70), and was confirmed by a psychiatrist. Subjects with evidence or current history of substance abuse were excluded. ALS donors diagnosed by physician had evidence at CSF donation visit of upper motor neuron or lower motor neuron signs, as measured using the ALS functional rating scale-revised. PD subjects had stable diagnosis by a neurologist for at least 1 year and were responsive to a stable dose of dopamine therapy for at least 6 months. Additional diagnostic and exclusion criteria are available upon request from Precision Med. CSF was received in 1.0 ml aliquots and stored at −70°C. Immediately before running either the Aβ oligomer assay or the monomer assays, each sample was thawed at room temperature and Tween 20 detergent was added to a final concentration of 0.05%. In the absence of Tween 20, amyloid peptides bind to polypropylene storage tubes (Lewczuk et al., 2006; Pica-Mendez et al., 2010; Perret-Liaudet et al., 2012); Aβ oligomers bind as well (data not shown). Other publications also support the use of mild, low concentration detergent to preserve Aβ42 and oligomer signals (LeVine, 2004; Bjerke et al., 2010). T test comparisons of oligomer differences across diagnostic and gender groups used Mann–Whitney analysis with Gaussian approximation of the p values and data are expressed as geomean with 95% confidence intervals (CI).
Table 2.
Demographic information of Control and AD CSF samples
| Controls | AD | |
|---|---|---|
| Cohort 1: sample number | 11 | 12 |
| Gender | ||
| Female | 6 (40%) | 9 (60%) |
| Male | 5 (63%) | 3 (37%) |
| Age (years, median, and range) | 64 (60–77) | 78 (56–89) |
| MMSE score (median and range) | 30 (26–30) | 16 (14–24) |
| Cohort 2: sample number | 32 | 40 |
| Gender | ||
| Female | 17 (53%) | 17 (42%) |
| Male | 15 (47%) | 23 (58%) |
| Age (years, median, and range) | 64 (51–77) | 70 (50–83) |
| MMSE score (median and range) | 30 (27–30) | 19 (14–26) |
Gender, age, and MMSE of the CSF donors are indicated, with percentages or ranges in parentheses. The median MMSE scores for the AD groups are significantly lower than the control group (p < 0.0001; Mann–Whitney).
Table 3.
Demographic information of Control, AD, PD, ALS, and Schizophrenia CSF samples
| Cohort 3 | Controls | AD | PD | ALS | Schizo |
|---|---|---|---|---|---|
| Sample number | 11 | 11 | 11 | 11 | 11 |
| Gender | |||||
| Female | 5 (45%) | 5 (45%) | 5 (45%) | 9 (82%) | 5 (45%) |
| Male | 6 (55%) | 6 (55%) | 6 (55%) | 2 (18%) | 6 (55%) |
| Age (years, median/ranges) | 63 (60–77) | 70 (50–83) | 73 (58–80) | 61 (50–91) | 54 (42–63) |
| MMSE (median/ranges) | 30 (27–30) | 16 (14–20) | 30 (29–30) | 30 (27–30) | ND |
Gender, age, and MMSE (where available) of the CSF donors are indicated, with percentages or ranges in parentheses.
Human brain homogenate preparation.
Frozen human cortex was obtained from Analytical Biological Services. Control brain was from a 46-year-old female at 7 h postmortem, where the cause of death was liver cancer. AD brain was from an 87-year-old male at 4 h postmortem and was confirmed to have significant amyloid plaque pathology using antibody 6E10 (data not shown). Formic acid soluble Aβ was measured from both brains using 6E10/4G8 and supported the relative clinical diagnosis of these samples (data not shown). Frozen tissues were weighed and homogenized immediately using a Brinkmann Polytron with 88/Polytron PTA 10S probe in ice-cold PBS (Gibco, #70011) at 30:1 volume:tissue weight ratio using two intervals of 15 s each. The resulting homogenate was centrifuged in a Beckman Coulter Optima TLX ultracentrifuge equipped with a TLA-55 rotor at 100,000 × g for 40 min to remove insoluble fibrils. Protein concentration of spun supernatants was determined using a Coomassie Plus Protein assay (Thermo Fisher Scientific), and 0.07 mg of AD (N = 1) or non-AD (N = 1) brain was subsequently injected and fractionated using SEC.
To immunoclear amyloid peptides from brain supernatant, 1 ml of paramagnetic beads precoated with sheep anti-mouse IgG (Dynabeads M-280; Life Technologies) were washed with 1 ml of wash buffer (Dynabeads Protein G Immunoprecipitation kit) and incubated overnight with either 80 μl of 4G8 antibody (raised against synthetic Aβ1–40) or 80 μl of wash buffer at 4°C. Beads were subsequently washed 3× with wash buffer and resuspended in sterile PBS before use. Three hundred microliters of human AD SEC fractions (18, 20, 22, and 24), diluted 1:5 with PBS supplemented with 0.05% Tween 20 were allowed to react with 50 μl of 4G8-bound or control Dynabeads at 4°C overnight. To remove bead-bound materials, mixtures were immobilized on a magnet for 1 min. Resultant supernatants from 4G8-bound or control suspensions (100 μl each in duplicate) were subsequently tested in oligomer (19.3/82E1) assay.
Results
Aβ oligomer selectivity of antibody 19.3
To confirm binding potency of 19.3 for Aβ oligomers compared with Aβ40 monomer, one-site ELISAs used a common titration curve of the antibody and separate Aβ oligomer- or Aβ40 monomer-coated plates (Fig. 1A). Aβ40 represented Aβ monomers rather than Aβ42 as the 40 species has a lower aggregation threshold, reported by several groups (Bitan et al., 2003; Bernstein et al., 2005; Bernstein et al., 2009). The EC50, a measure of half-maximal total 19.3 binding was 0.25 pg/ml and 0.64 pg/ml for Aβ oligomers and Aβ40, respectively. The maximal binding of 19.3 antibody was ∼3-fold greater for Aβ oligomers as for Aβ40 monomer. To more accurately represent an environment where both Aβ oligomers and Aβ monomers would be present, such as CSF, we tested the antibodies in competitive ELISAs (Fig. 1B). As in the one-site ELISA above, a plate was prepared by coating with Aβ oligomers at 215 ng/well and then adding the 19.3 antibody at its Aβ oligomers binding EC50, as determined in the one-site ELISA (0.25 pg/ml; Fig. 1A). 19.3 was competed off by adding increasing concentrations of Aβ40 monomer, resulting in 50% competition at 24.8 μg/ml of monomer. In contrast, when 430 ng/well Aβ40 monomer coated the ELISA plate and Aβ oligomers competed for 19.3 binding (at 0.64 pg/ml antibody), 50% of 19.3 was competed off monomer at 39 ng/ml of oligomers. The 650-fold difference in the competitive response is consistent with 19.3 having a much higher solution phase binding for oligomers than Aβ40 monomers. Thus 19.3 advanced to evaluation in a two-site ELISA format.
Figure 1.
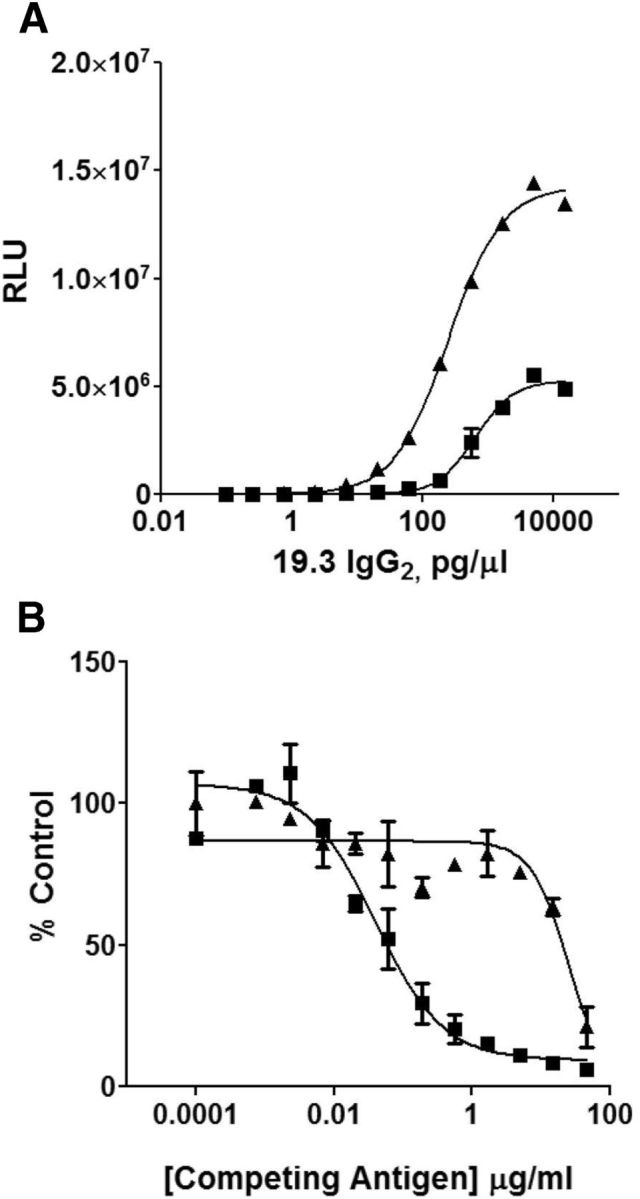
The 19.3 antibody selectively binds to oligomeric Aβ. The differential binding of the 19.3 antibody to Aβ monomer and oligomers was quantified in (A) a one-site ELISA and in (B) a competitive binding ELISA. In the one-site ELISA, 19.3 showed only a modestly different EC50 for monomer (0.64 pg/ml, ■) and Aβ oligomers (0.25 pg/ml, ▴). The maximal binding was greater for Aβ oligomers. In the competitive binding ELISA, 39 ng/ml of Aβ oligomers was sufficient to displace 50% binding to coated Aβ40 monomers (■), whereas 24.8 μg/ml Aβ monomer was needed to displace 50% of the Aβ oligomer (▴) binding. RLU, relative luminescence units.
Preferred antibody pair for Aβ oligomer two-site ELISA
A screen of capture and detecting antibodies in two-site ELISA format was completed to identify an oligomer-preferring assay. In the absence of oligomer-preferring antibodies, the same anti-Aβ antibody used as both capture and detection reagents has been reported as an Aβ oligomer assay by several groups (Howlett et al., 1999; Schupf et al., 2008; Xia et al., 2009; Fukumoto et al., 2010; Gandy et al., 2010; Esparza et al., 2013; Yang et al., 2013). Most of these homotypic assays have demonstrated insufficient sensitivity for reliable measurement of Aβ oligomers in human CSF, if oligomers are truly present at the lower range of published values (Georganopoulou et al., 2005). Using this approach, two-site ELISAs with capture/detection antibody pairs 19.3/19.3 (data not shown), 6E10/6E10 (Fig. 2C), or 19.3/82E1 (Fig. 2A) were compared for sensitivity of Aβ oligomers compared with monomer using the Envision chemiluminescent platform. 19.3/19.3 and 6E10/6E10 both demonstrated ∼350-fold reduced sensitivity for oligomers versus 19.3/82E1. The 19.3/82E1 ELISA generated a limit of Aβ oligomer detection (LOD) of 1.3 pg/ml, and LLORQ of 4.2 pg/ml (with coefficients of variance <20% at this lowest measure). The assay was ∼1000-fold selective for Aβ oligomer signal compared with either Aβ40 or Aβ42 monomers (Aβ40 not shown) using comparable absolute concentrations of Aβ protein (Fig. 2B). As the oligomer preparation is a dynamic mixture of oligomers and monomers (ranging from ∼70–90% HMW Aβ species; Fig. 3A), the sensitivity and selectivity of the 19.3/82E1 ELISA for oligomers may be underestimated. While this assay could evaluate synthetic Aβ and human brain (see below) oligomers, it was not sensitive enough to reliably detect oligomers in human CSF (data not shown), which is consistent with previous estimates (Georganopoulou et al., 2005).
Figure 2.

19.3/82E1 ELISA shows differential sensitivity toward Aβ oligomers compared with Aβ monomer and a larger dynamic range compared with the homotypic 6E10/6E10 ELISA. A, Plates coated with 19.3 were exposed to increasing concentrations of Aβ oligomers (▴) or Aβ42 monomer (♦). Binding was detected with the 82E1 antibody. Cross-reactivity with the monomer preparations was limited, with 1000-fold difference in sensitivity. B, C, Plates coated with 6E10 were exposed to increasing concentrations of Aβ oligomers (▴) or Aβ42 monomer (♦) with binding detected using 12F4 Aβ42-specific antibody (B) or 6E10 (C) antibodies. Equivalent signals were observed in the Aβ42-specific ELISA assay, while 350-fold lower oligomer sensitivity was seen in the 6E10/6E10 homotypic ELISA compared with 19.3/82E1. RLU, relative luminescence units.
Figure 3.

The Aβ oligomer preparation is enriched for HMW Aβ species. A, Aβ oligomers were fractionated by SEC-MALLS and monitored by absorbance at 280 nm. A primary broad HMW peak was detected at minutes 16.5 through 20.5. MALLS analysis indicated that the peak was a polydisperse mixture of oligomers ranging in size from 310 to 7700 kDa, with a mean molecular weight of ∼1117 kDa. A minor LMW peak was detected at minute 28–32. Five additional peaks, corresponding to potentially LMW species, were detected at minutes 34 through 45. B, SEC profile of F12 media alone is shown. F12 media is used in the preparation of Aβ oligomers. The peaks at minutes 34 through 45 are present in F12, indicating these are likely not Aβ related and that the peak at 28–32 min corresponds to the smallest Aβ species. C, HFIP-treated Aβ42 monomer was separated by SEC and had a prominent peak at minute 28–32, suggesting this is an accurate size for monomers. MALLS analysis confirmed Aβ monomeric peak molecular weight at 4.8 kDa (actual weight is 4.514 kDa). Globular protein size standards were run on the same column under the same conditions and their peak elutions are indicated at the top of each chromatogram: (1) thyroglobulin (670 kDa), (2) gamma globulin (158 kDa), (3) ovalbumin (44 kDa), (4) myoglobin (17 kDa), and (5) vitamin B12 (1.35 kDa). The standards serve as calibration controls and estimation of the LMW peaks rather than to accurately predict HMW fraction sizes.
SEC to resolve Aβ species in oligomer standards and human brain extracts
To better understand the oligomer species, synthetic Aβ oligomers were resolved using SEC and the fractions were tested by ELISA. Aβ42 monomers or LMW species were detectable at 280 nm absorption at ∼30 min in both the Aβ42 oligomer (Fig. 3A) and Aβ42 monomer prep (Fig. 3C) as were HMW species, which likely correspond to Aβ oligomers only present within the Aβ42 oligomer prep (Fig. 3A). No relevant Aβ species were detected in UV peak fractions > 35 min, corresponding instead to components of F12 medium used to prepare the oligomers (Fig. 3B). For ELISA measurements (Fig. 4), fractions of oligomer preps were added immediately to the ELISA wells, to minimize postfractionation state changes. Three ELISAs were tested on oligomer prep fractions: 6E10/12F4, 6E10/6E10, and 19.3/82E1. The 6E10/12F4 Aβ42 assay detected signals in both oligomeric/HMW and monomeric/LMW species (Fig. 4A), whereas 6E10/6E10 detected only HMW/oligomeric species (Fig. 4B, fractions 18–20). Using MALLS coupled in-line with SEC, the oligomer-related HMW standard peak has predicted molecular mass range of 310–7700 kDa (mean = 1117 kDa). The signal of the LMW peak was too weak to accurately predict its molecular mass; however, it coeluted in the same fractions (see below) as the monomer Aβ42. In fact, when monomer preps were fractionated, the entire signal for 6E10/12F4 was in fractions at 28–32 min, with the molecular mass estimated by MALLS to be 4.8 kDa (data not shown). Essentially no detectable signal was present in these fractions using the two oligomer ELISAs (data not shown). The 19.3/82E1 assay detected oligomers in fractions 17–22 min, at a broader range and magnitude of putative oligomers fractions compared with the 6E10/6E10 ELISA (fractions 18–20), but was largely insensitive to fractions expected to contain primarily monomers (Fig. 4C). The restricted oligomer detection range of the 6E10/6E10 assay relative to the 19.3/82E1 assay may reflect steric hindrance as both capture and detect antibodies attempt to bind to the same epitope, leading to greater sensitivity of the 19.3/82E1 ELISA.
Figure 4.

Comparison of the SEC fractionated synthetic Aβ oligomers by ELISA shows 19.3/82E1 ELISA detects HMW Aβ species. Aβ oligomer preps were fractionated by SEC and the fractions tested in a 6E10/12F4, 6E10/6E10, or 19.3/82E1 ELISA. A, The 6E10/12F4 Aβ42 ELISA shows binding to LMW (fractions 28–32) and HMW (fractions 16.5–20.5) Aβ species. B, The 6E10/6E10 ELISA recognized HMW Aβ (fractions 17–21) with no reactivity to LMW Aβ. C, The 19.3/82E1 ELISA also shows selectivity toward HMW Aβ, but recognizes a broader range and higher concentration of Aβ species than 6E10/6E10.
Results using synthetic Aβ species in SEC further confirmed that the 19.3/82E1 assay was oligomer selective. Next, assay performance was studied using brain supernatant Aβ species extracted by homogenization in PBS and ultracentrifugation from AD or healthy control brain. Fractions were analyzed using either the 19.3/82E1 Aβ oligomer ELISA (Fig. 5A) or 6E10/4G8 total Aβ ELISA (Fig. 5B). Figure 5B demonstrates Aβ signals most prominently in LMW fractions 29–36, from AD (left) and age-matched control (right), respectively. Average levels of Aβ species in the LMW PBS fractions were comparable across the two groups (AD = 378 pg/ml; non-AD = 538 pg/ml), and resolve over fractions comparable to the Aβ monomer standard (Fig. 3C), ∼4.8 kDa. The LMW species derived from the human brain homogenates and detected by the 6E10/4G8 total Aβ ELISA elute over a wider molecular weight range compared with the Aβ1–42 monomer standard. Endogenous Aβ species, immunocaptured with 6E10 vary in length as analyzed by mass spectrometry (Portelius et al., 2011), with species ending at residue 40 the most abundant and including a plethora of N- and C-terminal truncations. This heterogeneity most likely accounts for additional Aβ species detected between fractions 32–36 present in the brain homogenates (Fig. 5B) and absent from the Aβ1–42 monomer prep (Fig. 3C). Figure 5A demonstrates increased oligomer signals in the PBS fraction from the AD brain (left) compared with control (right). Interestingly, ADDL HMW oligomer standard ELISA signals were detected in fractions 17–22 (Fig. 4C), 310–7700 kDa range, with the highest signal in fraction 18, while the endogenous oligomers from the AD brain demonstrated the highest signal in fraction 19, shifting its most abundant conformer to a slightly smaller molecular weight. Also, unlike the oligomer standards, there was a longer train of smaller oligomeric species, which tailed into the monomer fractions. Control brain oligomer signals from 19.3/82E1 were significantly reduced ∼3-fold compared with the AD signal; the mean concentration of oligomers across fractions 18–28 was 252 pg/ml in AD and 87 pg/ml in control. Overall, these human brain oligomer fractions span between very large, mega dalton sizes to just below the globular standard of 17 kDa. As the unfractionated concentration of total Aβ, including monomer, would overwhelm the 1000-fold selectivity of the oligomer ELISA (Envision platform), the SEC size resolution allows for greater selectivity; in fact, mean total Aβ in the AD extract was 378 pg/ml over fractions 16–28 (under the oligomer assay detection range for monomer species; Fig. 2A) versus oligomer signals of 252 pg/ml. To confirm the specificity of the oligomer signals across fractions, immunoprecipitation was performed with antibody 4G8 on a subset of fractions, to clear Aβ species before testing in the 19.3/82E1 oligomer assay. A significant reduction in oligomer signal to background levels was found in fractions 18, 20, 22, and 24 with prior immunoclearing (data not shown), confirming the signal specificity. With additional confirmation on 19.3/82E1 ELISA selectivity using endogenous brain Aβ species extracted and fractionated using SEC, the assay was advanced into the Erenna immunoassay platform, reported to have greater sensitivity to detect analytes in human body fluids.
Figure 5.

SEC fractions of human cortex aqueous supernatants revealed more HMW Aβ oligomers in AD compared with non-AD cortex, while similar total Aβ levels were found. A, 19.3/82E1 ELISA assay on SEC fractions of 0.07 mg of AD (left) and non-AD (right) cortex shows ∼3-fold elevation in the mean concentration of HMW fractions in AD compared with non-AD samples. B, Similar levels of LMW fractions were observed between AD and non-AD PBS extracts when examined using the 6E10/4G8 ELISA of total Aβ signal. Globular protein size standards were run as noted in Figure 3 legend.
Aβ oligomer-selective ELISA with improved sensitivity
Optimal antibody capture and detecting ratios determined
The 19.3/82E1 antibody pair was evaluated on the Erenna platform to determine whether assay sensitivity could improve further to detect Aβ oligomers in human CSF. An antibody testing matrix of 16 different combinations was designed to compare assay performance under a variety of conditions using a two point analyte curve consisting of 0 and 4.5 pg/ml in standards diluent. The parameters evaluated included micrograms of biotinylated 19.3 per milligram MP, micrograms of 19.3-MP per well, and detection antibody concentration. The best performance, choosing lowest signal background with the greatest slope (detected photon events/pg/ml) between 0 and 4.5 pg/ml, was found using 12.5 μg of biotinylated 19.3/mg MP, 10 μg 19.3-MP per well, and 500 ng/ml of 82E1. These conditions were moved forward for further assay development.
Assay sensitivity
Using assay conditions chosen above, assay sensitivity was evaluated using a 12 point, twofold serial dilution of Aβ oligomer concentrations in standard diluent run in triplicate from 42 to 0.04 pg/ml (Fig. 6A). The lowest concentration that could be quantified with a CV <20% on the standard curve was 0.18 pg/ml (LLORQ) with an LOD of 0.09 pg/ml. The upper limit of the linear range was not rigorously determined.
Figure 6.
Use of Erenna flow-based detection provides increased sensitivity while preserving selectivity with Aβ monomers. A, The MP-based 19.3/82E1 assay shows dilution linearity from 0.04 to 0.72 pg/ml. Variability in the lower part of the curve constrains the LLORQ to 0.18 pg/ml and higher. B, Aβ monomers show limited cross-reactivity with the 19.3/82E1 assay, 2500-fold lower signal compared with oligomers.
Selectivity versus Aβ monomer
The Aβ oligomer assay cross-reactivity to Aβ monomer was determined by preparing a 12 point, twofold serial dilution of the HFIP monomer into standard diluent. Dilutions were run in triplicate ranging from 226 ng/ml to 221 pg/ml. Cross-reactivity was calculated by dividing the interpolated values by the expected values based on an oligomer standard curve at comparable protein concentration. The calculated cross-reactivity ranged between 0.03 and 0.05%. In a representative graph of signal from Aβ oligomers compared with Aβ40 monomer (Fig. 6B), cross-reactivity was <0.1%.
Spike recovery determination in human CSF
Recovery of Aβ oligomer spiked into 12 unique CSF samples was analyzed. Four samples from a mixture of aged control and AD were spiked with 1.7 pg/ml oligomers and eight were spiked with 3.4 pg/ml. Each sample was also run without additional oligomers to determine endogenous levels. Spike recovery ranged from 37 to 149%, with mean recovery of 89%. The lowest recovery value, 37%, corresponded to an endogenous, unspiked sample with the highest percentage CV (48%). If this single sample pair is excluded from the 23 remaining values, the mean spike recovery is 94%, with a range of 66 to 149%.
Dilution linearity of oligomer signal in either spiked or unspiked CSF
A subset of the normal human CSF samples, spiked with 0.82 pg/ml oligomers, were serially diluted to evaluate assay linearity. The interpolated value was multiplied by the dilution factor to obtain the initial Aβ oligomer concentration. Average linearity of the recovered Aβ oligomer signals was 96%, with a range of 69 to 117%. A parallel analysis with unspiked neat CSF was also run. The lower starting concentration of oligomers meant fewer dilution steps. The calculated average linearity of the endogenous Aβ oligomer signal was 95%, with a range of 88 to 103%, showing better response of the endogenous oligomers to serial dilution.
Intra- and inter-assay precision
To examine intra-assay precision, five samples of 100 μl human CSF were each spiked at two levels of Aβ oligomer (0.81 and 2.7 pg/ml) and run in replicates of six. Intra-assay precision calculated by averaging results of the six replicates and calculating the CV%, was 17%, and ranged between 5 and 31 CV%. Using CV percentage values from unspiked human CSF run in replicates of three, the intra-assay mean was 14%, the median was 10%, and ranged between 3 and 28%.
Inter-assay precision was studied in six samples spiked at two oligomer levels (0.81 and 2.7 pg/ml), run in replicates of three, and run on three different plates. Inter-assay precision calculated by averaging results of the three experiments and resultant CV percentage, was 13% and ranged between 6 and 38% CV%. Inter-assay precision was also determined in two unique unspiked CSF samples, and was ∼18%, run over 2 d.
In summary, the Aβ oligomer-selective ELISA generated an LOD of oligomer standards at 0.09 pg/ml, an LLORQ at 0.18 pg/ml, and 2500-fold selectivity of the assay for Aβ oligomer over Aβ40 monomer (Table 1). Inter-and intra-assay precision, spike recovery, and dilution linearity were all consistent with a robust and sensitive assay. The assay was used to evaluate levels of Aβ oligomers in human CSF.
Table 1.
Summary of assay properties of the Aβ oligomer assay
| Assay parameter | Aβ oligomer/monomer standards added | Endogenous CSF Aβ species |
|---|---|---|
| LOD | 0.09 pg/ml | N/A |
| LLORQ | 0.18 pg/ml | N/A |
| Inter-assay precision | 13% (6–38) | 18% (17–18) |
| Intra-assay precision | 17% (5–31) | 14% (3–28) |
| CSF spike recovery | 89% (37–149) | N/A |
| Avg dilution linearity | 96% (69–117) | 95% (88–103) |
| Fold selectivity for oligomer versus monomer | 2500 (2000–3000) | N/A |
LOD is 2 × SD Bkgd/slope. LLORQ is the lowest back interpolated standard that provides signal 2× over background with percent CV <20%. For other measures, mean %CV is shown; ranges in parenthesis. “Dilutional linearity samples” were serially diluted to 1:8 (with exogenous oligomers added) or 1:4 (endogenous signals). Fold selectivity refers to observed signal from Aβ oligomer compared to an equivalent protein concentration of Aβ monomer.
Aβ oligomers detected in human CSF
The 19.3/82E1 ELISA on the Erenna platform was used to measure endogenous Aβ oligomers in human CSF. In two commercially available cohorts assessed independently (patient demographics in Table 2), Aβ oligomers were significantly elevated in AD CSF compared with aged controls (p < 0.008). AD patients were diagnosed using MMSE as well as other criteria (see Materials and Methods). The absolute levels of oligomers observed in Cohort 1 (Fig. 7A) were 2.6 (0.75–3.3) pg/ml in AD (N = 12) and 0.28 (0.18–0.34) pg/ml in aged controls (N = 11), 9.2-fold elevated in AD. Oligomer levels in three healthy aged samples were between the LOD and LLORQ (0.09–0.18 pg/ml, respectively), so overall geometric means should be considered estimates since these samples represent 13% of the total Cohort 1 sample number. Dotted line on Figure 7A indicates the LLORQ. Samples from Cohort 1 were analyzed on two separate occasions from fresh aliquots; 1 month apart; run 1 was unblinded and run 2 was blinded and the correlation between the two runs revealed an r value of 0.93. All additional CSF samples were run blinded. While these data support an association of increased Aβ oligomers in AD, Cohort 1 was limited by small group sizes and overlapping, but non-matched group ages. A second cohort of CSF samples was obtained and analyzed. The second cohort was larger and there was no significant difference in the ages of the cases and controls (Table 2).
Figure 7.

Aβ oligomer levels in the CSF discriminate between AD patients and controls and correlate with MMSE values. A, Aβ oligomer levels were significantly higher in the AD CSF samples than in aged control samples from Cohort 1 (geometric mean with 95% CI, p < 0.008). Dotted lines in A and B indicate the lower limit of reliable quantification of the assay. B, Aβ oligomers in Cohort 2 are significantly elevated in the AD CSF compared with age-matched healthy controls (geometric mean with 95% CI; p < 0.0001). C, Aβ oligomer concentrations in Cohort 2 were used to generate a ROC curve to assess the predictive validity of the assay. The area under the curve of the ROC curve is 0.86. D, There is a significant correlation between MMSE and Aβ oligomers when all samples from Cohorts 1 and 2 are analyzed either by pooling healthy controls and AD samples (r = 0.67, p < 0.0001) or within AD samples alone (r = 0.28, p < 0.05). There is no correlation for the control samples. AD Cohort 1 (●), Control Cohort 1 (○), AD Cohort 2 (■), Control Cohort 2 (□), Total AD only correlation (- - -), total control correlation (···), Combined correlation (——).
Absolute levels of CSF Aβ oligomers observed in Cohort 2 were 1.52 (1.19–1.94) pg/ml in AD (N = 40) and 0.52 (0.41–0.66) pg/ml in aged control (N = 32), ∼3-fold higher in AD compared with control CSF. In this cohort, differences were significant at p < 0.0001 (Fig. 7B); three individuals in the aged control group had oligomers between the LOD and LLORQ, while all AD values were above the LLORQ (indicated by dotted line). Comparing cohorts, all AD signals were above the LLORQ of 0.18 pg/ml while only 90% of Cohort 2 controls or 73% of the Cohort 1 controls were above this limit. All values were above the LOD of 0.09 pg/ml. Receiver–operator curve analysis (ROC; Fig. 7C) performed on oligomer data from Cohort 2 demonstrated an area under the curve of 0.86 (0.75–0.94 CI, p ≤ 0.001) with a sensitivity of 80% and a specificity of 88% to distinguish the AD from the aged controls.
Aβ40 and Aβ42 monomer levels were also measured in the Cohort 1 CSF samples, and a portion of Cohort 2, where there was sufficient CSF available. Aβ40 levels were comparable between the AD and controls in Cohort 1 (1935 and 2088 pg/ml, respectively; Fig. 8A), while Aβ42 levels were significantly reduced by 2.4-fold in the AD samples compared with control (44 and 108 pg/ml, respectively, Fig. 8B). In Cohort 2, the AD and control Aβ40 levels were 1996 and 2249 pg/ml (Fig. 8C), while Aβ42 levels were 114 and 216 pg/ml (Fig. 8D), respectively. This finding is consistent with previous reports, showing a reduction of Aβ42 in AD CSF by approximately twofold (De Meyer et al., 2010, Jack et al., 2010) and, with the other diagnostic criteria, supports a correct diagnosis. When oligomer levels were compared with either Aβ40 or Aβ42 monomer levels within a given sample, a significant correlation was observed only within the AD population when comparing levels of oligomer and Aβ40 (Fig. 8E; r = 0.49, p = 0.03), but not Aβ42 (Fig. 8F; r = 0.33, p = 0.16). There was no correlation found between oligomer and monomer species either within the healthy normal samples alone, or within the combined AD and healthy normal samples (Cohorts 1 and 2). This suggests the Aβ oligomer values are not substantially derived from cross-reactivity with Aβ monomers.
Figure 8.

Aβ40 monomer concentration is unchanged between the AD and aged controls in Cohort 1 and 2 (A and C, respectively) while Aβ42 values are reduced by twofold in the AD samples (B, Cohort 1, p < 0.002; D, Cohort 2, p < 0.001; geometric mean and 95% CI). A Cohort 2 subset was analyzed because of limited CSF volumes available. The correlation between Aβ40 and oligomers was significant for the AD CSF (r = 0.49, p = 0.03; ■), but not aged control CSF (E; □). Correlation between Aβ42 and oligomers was not significant for either group (F; AD, ♦; control, ◊).
ROC analysis was performed comparing curves generated using oligomer data with those using Aβ42 monomer data on the sample subset for which both measures were available (Fig. 9). For the oligomer measures the area under the curve was 0.86 (0.73–0.99 CI, p ≤ 0.0001) with a sensitivity of 80% and a specificity of 90% to distinguish the AD from the aged controls. For the Aβ42 monomer data, the area under the curve was 0.76 (0.60–0.92 CI, p < 0.006) with a sensitivity of 70% and specificity of 90%. The oligomer measures were the more sensitive measure to detect AD CSF compared with Aβ42 monomer.
Figure 9.

ROCs using either Aβ42 (A) or oligomer (B) values from AD or control CSF. The oligomer values provided improved sensitivity compared with Aβ42 to detect disease.
Additional control and AD CSF samples were obtained (Cohort 3), including patients diagnosed with PD, ALS, and Schizophrenia (patient demographics in Table 3) and Aβ oligomers were measured using the 19.3/82E1 ELISA. There were no differences detected in CSF oligomers (Fig. 10A) or Aβ42 monomer levels (Fig. 10B) between N = 11 each of control, ALS, PD, and Schizophrenia samples, while AD samples remained significantly higher for oligomers, and lower for Aβ42 monomers (p < 0.01).
Figure 10.

AD CSF samples contain significantly higher oligomers and lower Aβ42 monomers compared with other diagnostic groups. A, Aβ oligomer levels were significantly higher (p < 0.01) and (B) Aβ42 levels were significantly lower (p < 0.01) in AD CSF samples when compared with aged control or ALS, PD, or Schizophrenia samples from Cohort 3. C, Aβ40 levels were unchanged among all tested CSF groups of Cohort 3.
Association of Aβ oligomers with age, sex, and MMSE score
As age and gender are risk factors for AD, we analyzed the Aβ oligomer levels with respect to these factors. There was no correlation between age and Aβ oligomer level in either the AD or control samples of either Cohort 1 or 2 (data not shown). When Cohort 2 was segregated by gender and disease state, samples from both male and female AD samples had greater Aβ oligomer levels than their gender-matched controls (Fig. 11). Across both cohorts, there were no significant effects specific to gender, whether assessed separately by diagnostic group or combine together (Cohorts 1 and 3 not shown).
Figure 11.

AD CSF samples across both genders contained more Aβ oligomers than control. No differences were detected when males were compared with females, in AD, controls, or pooled (one-way ANOVA, Bonferroni correction).
Comparing oligomer levels with MMSE score indicated a significant, negative correlation with either the combined Cohorts 1 and 2 AD group (r = −0.28, p < 0.05) or AD and control samples (r = −0.67, p < 0.0001; Fig. 7D). Within Cohorts 1 and 2 analyzed separately (data not shown), the significant relationship between MMSE and oligomers was preserved when AD and controls were analyzed in aggregate (r = −0.74, p < 0.0001 or −0.64, p < 0.0001), respectively), but only within Cohort 1 was the correlation significant just within the AD samples (r = −0.68; p < 0.05), excluding controls.
Discussion
Using oligomer-detecting antibodies a quantitative, sensitive and selective Aβ oligomer ELISA was developed. With this novel assay, oligomers in human CSF were measured, distinguishing AD from control in three cohorts, while patients with other neurologic or psychiatric disease were comparable to aged controls. Antibody pairs were chosen for oligomer selectivity and sensitivity using a chemiluminescent ELISA. This assay distinguished HMW Aβ oligomers in human brain from monomers, and was transferred to the Erenna ELISA platform providing increased sensitivity to detect CSF oligomers. While the human cohorts were relatively small, this study provides rationale to analyze longitudinal CSF collections in which additional genetic, biochemical, imaging, and cognitive measures have been completed.
The Erenna platform was used (Esparza et al., 2013) to develop an ELISA using Aβ N-terminal antibody HJ3.4 as both capture and detecting pair, achieving LOD of 1.56 pg/ml and LLORQ of 6.25 pg/ml; oligomers were detected in brain, but not CSF. As the capture antibody was immobilized on a plate surface, versus magnetic bead as in the 19.3/82E1 assay, signal-to-noise may have improved with a bead-based version. Use of the same antibody for capture and detection (Xia et al., 2009; Fukumoto et al., 2010; Esparza et al., 2013; Yang et al., 2013) provided oligomer selectivity, but, in general, was not highly sensitive. Homotypic ELISAs using 6E10 and 19.3 were also not as sensitive as 19.3/82E1, and detected a smaller fraction of HMW oligomers revealed after SEC fractionation. In addition, the 19.3/82E1 Envision chemiluminescent ELISA (LOD 1.3 pg/ml, LLORQ 4.2 pg/ml) was also unable to detect CSF oligomers. When migrated to the Erenna platform, 19.3/82E1 achieved 23-fold increased sensitivity and the ability to detect CSF oligomers.
In contrast, Hölttä et al. (2013) reported a homotypic ELISA using 82E1 with sufficient sensitivity to detect CSF oligomers from a subset of control, mild cognitive impairment, and AD patients. This assay used Aβ1–11 dimer standards, demonstrated a limit of quantification of 0.2 pg/ml, and 25,000-fold selectivity versus Aβ40 monomer. Despite comparable sensitivity and improved selectivity versus the 19.3/82E1 ELISA, a large fraction of samples demonstrated oligomer measures below the limit of quantification in a clinic-dependent manner, suggesting site-specific CSF sampling or handling may have played a role in the detection variability. While another homotypic ELISA using BAN50 antibody on a Luminex platform demonstrated higher relative signals in AD CSF versus control (Herskovits et al., 2013), sAPPα oligomers were detected and parameters such as sensitivity, intra-assay variability, and matrix effects were not reported. While assays noted above used different oligomer standards, a trend has emerged suggesting sub-pg/ml or sub-picomole sensitivity is required to detect CSF oligomers (Georganopoulou et al., 2005; Hölttä et al., 2013; 19.3/82E1 ELISA).
As CSF oligomer levels are low, we examined whether endogenous human IgG interfered with the 19.3/82E1 ELISA. IgG was depleted from human CSF using a protein G column (confirmed using SDS-PAGE and protein staining, data not shown). Oligomer signals were identical in neat and IgG-depleted CSF, suggesting human antibodies were not interfering with the ELISA signal.
The ability of any ELISA to distinguish monomer from oligomer is critical, but challenging to assess. Aβ appears to exist in a dynamic equilibrium between monomeric and oligomeric states (Bitan and Teplow, 2004). Here assay selectivity was quantified using defined biochemical preparations and SEC to fractionate by size. The 19.3/82E1 Erenna ELISA demonstrated ∼2500-fold oligomer selectivity versus Aβ40 monomer. CSF monomer concentrations were in the low ng/ml range (mean values 2.5 ng/ml; Fig. 8) in our assays, while measures between 5 and 10 ng/ml have been reported (Oe et al., 2006; Bateman et al., 2007; Li et al., 2012; Slemmon et al., 2012). The average Aβ oligomers concentration in AD CSF, ∼2 pg/ml, are detectable with this level of discrimination however levels of oligomers in some healthy controls may be overestimated. Across CSF samples in aggregate there was no correlation between monomer and oligomer levels. Indeed, as Aβ42 decreases and Aβ40 levels are unchanged, Aβ oligomers increase. This inverse concentration relationship between Aβ42 and Aβ oligomers may, in part, explain the apparent loss of Aβ42 in the CSF, although Hölttä et al. also found no ‘within sample’ correlation between oligomer and other AD CSF biomarkers (Hölttä et al., 2013).
The relative selectivity of 19.3 for oligomeric Aβ compared with fibrillar forms was assessed in vivo (data not shown) using 19.3 delivered intravenously at 50 mg/kg into Tg2576 at plaque-bearing age of 18 months (Lesné et al., 2006). Twenty-four hours after dosing, paraformaldehyde-fixed frozen serial sections were stained histologically using either anti-human antibody detection (specific for 19.3 human Ab) or Thioflavin S, specific for fibrillar amyloid. Antibody 19.3 bound Thioflavin S-negative, diffuse clusters of cortical material (Sarsoza et al., 2009; Mc Donald et al., 2010; structures described in literature as oligomeric), while Thioflavin S-positive plaque in parenchyma or blood vessels was not detected.
Quantitative assay development requires a standard that is reproducible, stable, and reflective of endogenous species. The standard used here, ADDLs, was previously described (Lambert et al., 1998; Chromy et al., 2003; Gong et al., 2003; Lacor et al., 2004; Hepler et al., 2006; Freir et al., 2011), with addition of a YM-50 column to concentrate oligomers. To assess standard quality, we performed lot-to-lot stability by SEC in-line with MALLS analysis and binding to primary neurons in culture (Hepler et al., 2006; Shughrue et al., 2010). Oligomer standard stability was also evaluated, showing no significant change after prolonged storage at −80°C (data not shown). Such properties are essential to reliably test clinical samples.
In addition to oligomer standard reproducibility, we demonstrated relevance to endogenous oligomers. Like other published Aβ oligomer preparations, a single molecular weight species is unlikely to exist in solution; when resolved by SEC, there existed a species consistent with monomer, and an HMW peak comprised of oligomers (Chromy et al., 2003; Hepler et al., 2006), recognized with the oligomer assay in both synthetic and endogenous samples. This SEC pattern was reported in several laboratories, with ADDLs (Freir et al., 2011), other synthetic oligomer preparations (Bitan and Teplow, 2005; Yamamoto et al., 2007; Fukumoto et al., 2010), and also with human brain Aβ isolates (Esparza et al., 2013; Yang et al., 2013).
Detection of human CSF Aβ oligomers facilitates a test of the relationship between oligomers and cognition. It is notable that oligomers consistently increase in AD (Pitschke et al., 1998; Georganopoulou et al., 2005; Fukumoto et al., 2010; Gao et al., 2010; Sancesario et al., 2012; Santos et al., 2012; Hölttä et al., 2013; Herskovits et al., 2013), unlike Aβ42 monomer (Jack et al., 2010). Further, oligomer levels increase as MMSE score drops (consistent with finding by Herskovits et al., 2013). The correlation between oligomers and cognitive impairment is more robust when both aged normal and AD samples are used. This is expected, given the magnitude of change between the disease states. The remaining AD MMSE/oligomer correlation in this study implies that oligomers reflect a different pathological process than monomers.
In the two cohorts, age and gender differences did not correlate with oligomer levels. A recent report using immunoprecipitation and Western blot demonstrated a correlation between age and the oligomers *56 and trimers (Handoko et al., 2013), although Hölttä et al., (2013) also found no oligomer/age correlation. The greatest consistent influence on oligomer signal was diagnosis into either the AD or control group, defined here by MMSE score cutoff of ∼26 (Mungas, 1991; O'Bryant et al., 2008) and other criteria. To evaluate oligomers as a diagnostic marker, we completed ROC analysis using oligomer measures from Cohort 2. Aβ oligomers provide sensitivity and specificity comparable to those reported for CSF Aβ42 or tau (Lewczuk et al., 2004; Shaw et al., 2009); here, oligomers provided greater sensitivity (80%) versus Aβ42 (70%), with equivalent specificity (90%).
While additional studies are required, a significant step has been made toward robust and reproducible measurement of Aβ oligomers in human CSF and brain extracts. The Erenna platform is used in clinical settings (Tarawneh et al., 2012; Wang et al., 2012) to measure low abundance analytes in blood and CSF. Ongoing studies evaluating CSF from individuals sampled longitudinally will confirm whether oligomers correlate with cross-sectional and progressing disease, as well as with variables such as age, sex, apoE genotype, and other demographic, biochemical, and cognitive measures. Some CSF samples will have Tween 20 added at collection, which may preserve signals up to twofold, if consistent with the behavior of the synthetic oligomers and Aβ monomer standards used here. Other oligomer standards will be examined including commercially available Aβ dimers, and other oligomers (α-synuclein, prion, islet amyloid polypeptide, or polyglutamine). While ADDL antibodies like 19.3 are selective against oligomers arising from other peptides (Lambert et al., 2009), the 19.3/82E1 ELISA has not been examined against these species. Finally, in addition to the potential role of Aβ oligomers to diagnose AD, their response to therapeutic agents targeting Aβ, like anti-Aβ antibodies or β-secretase inhibitors, is of interest. If oligomers are the most relevant AD target, it will be critical to assess their pharmacodynamic behavior in clinical trials.
Footnotes
All authors were employees of Merck & Company, Inc. at the time the work was conducted, and the work was funded by Merck. We thank Eric Kemp, Joseph A. Schariter, Andrew H. Latham, and Jeffrey S. Smith for the help with SEC-MALLS analyses, and Zhizhen Zeng for supplying human brain extracts. The scientific collaboration with Lynn Zieske, Joel Estis, and Robert Goodson from Singulex, Inc. is acknowledged.
References
- Barghorn S, Nimmrich V, Striebinger A, Krantz C, Keller P, Janson B, Bahr M, Schmidt M, Bitner RS, Harlan J, Barlow E, Ebert U, Hillen H. Globular amyloid beta-peptide oligomer - a homogenous and stable neuropathological protein in Alzheimer's disease. J Neurochem. 2005;95:834–847. doi: 10.1111/j.1471-4159.2005.03407.x. [DOI] [PubMed] [Google Scholar]
- Bateman RJ, Wen G, Morris JC, Holtzman DM. Fluctuations of CSF amyloid-beta levels: implications for a diagnostic and therapeutic biomarker. Neurology. 2007;68:666–669. doi: 10.1212/01.wnl.0000256043.50901.e3. [DOI] [PubMed] [Google Scholar]
- Benilova I, Karran E, De Strooper B. The toxic Aβ oligomer and Alzheimer's disease: an emperor in need of clothes. Nat Neurosci. 2012;15:349–357. doi: 10.1038/nn.3028. [DOI] [PubMed] [Google Scholar]
- Bernstein SL, Wyttenbach T, Baumketner A, Shea JE, Bitan G, Teplow DB, Bowers MT. Amyloid beta-protein: monomer structure and early aggregation states of Abeta42 and its Pro19 alloform. J Am Chem Soc. 2005;127:2075–2084. doi: 10.1021/ja044531p. [DOI] [PubMed] [Google Scholar]
- Bernstein SL, Dupuis NF, Lazo ND, Wyttenbach T, Condron MM, Bitan G, Teplow DB, Shea JE, Ruotolo BT, Robinson CV, Bowers MT. Amyloid-β protein oligomerization and the importance of tetramers and dodecamers in the aetiology of Alzheimer's disease. Nat Chem. 2009;1:326–331. doi: 10.1038/nchem.247. [DOI] [PMC free article] [PubMed] [Google Scholar]
- Bitan G, Teplow DB. Rapid photochemical cross-linking–a new tool for studies of metastable, amyloidogenic protein assemblies. Acc Chem Res. 2004;37:357–364. doi: 10.1021/ar000214l. [DOI] [PubMed] [Google Scholar]
- Bitan G, Teplow DB. Preparation of aggregate-free, low molecular weight amyloid-beta for assembly and toxicity assays. Methods Mol Biol. 2005;299:3–9. doi: 10.1385/1-59259-874-9:003. [DOI] [PubMed] [Google Scholar]
- Bitan G, Kirkitadze MD, Lomakin A, Vollers SS, Benedek GB, Teplow DB. Amyloid beta-protein (Abeta) assembly: Abeta 40 and Abeta 42 oligomerize through distinct pathways. Proc Natl Acad Sci U S A. 2003;100:330–335. doi: 10.1073/pnas.222681699. [DOI] [PMC free article] [PubMed] [Google Scholar]
- Bjerke M, Portelius E, Minthon L, Wallin A, Anckarsater H, Anckarsater R, Andreasen N, Zetterberg H, Andreasson U, Blennow K. Confounding factors influencing amyloid Beta concentration in cerebrospinal fluid. Int J Alzheimers Dis. 2010;pii:986310. doi: 10.4061/2010/986310. [DOI] [PMC free article] [PubMed] [Google Scholar]
- Bruggink KA, Jongbloed W, Biemans EA, Veerhuis R, Claassen JA, Kuiperij HB, Verbeek MM. Amyloid-β oligomer detection by ELISA in cerebrospinal fluid and brain tissue. Anal Biochem. 2013;433:112–120. doi: 10.1016/j.ab.2012.09.014. [DOI] [PubMed] [Google Scholar]
- Cheng IH, Scearce-Levie K, Legleiter J, Palop JJ, Gerstein H, Bien-Ly N, Puoliväli J, Lesné S, Ashe KH, Muchowski PJ, Mucke L. Accelerating amyloid-beta fibrillization reduces oligomer levels and functional deficits in Alzheimer disease mouse models. J Biol Chem. 2007;282:23818–23828. doi: 10.1074/jbc.M701078200. [DOI] [PubMed] [Google Scholar]
- Chromy BA, Nowak RJ, Lambert MP, Viola KL, Chang L, Velasco PT, Jones BW, Fernandez SJ, Lacor PN, Horowitz P, Finch CE, Krafft GA, Klein WL. Self-assembly of Abeta(1-42) into globular neurotoxins. Biochemistry. 2003;42:12749–12760. doi: 10.1021/bi030029q. [DOI] [PubMed] [Google Scholar]
- Demattos RB, Lu J, Tang Y, Racke MM, Delong CA, Tzaferis JA, Hole JT, Forster BM, McDonnell PC, Liu F, Kinley RD, Jordan WH, Hutton ML. A plaque-specific antibody clears existing beta-amyloid plaques in Alzheimer's disease mice. Neuron. 2012;76:908–920. doi: 10.1016/j.neuron.2012.10.029. [DOI] [PubMed] [Google Scholar]
- De Meyer G, Shapiro F, Vanderstichele H, Vanmechelen E, Engelborghs S, De Deyn PP, Coart E, Hansson O, Minthon L, Zetterberg H, Blennow K, Shaw L, Trojanowski JQ Alzheimer's Disease Neuroimaging Initiative. Diagnosis-independent Alzheimer disease biomarker signature in cognitively normal elderly people. Arch Neurol. 2010;67:949–956. doi: 10.1001/archneurol.2010.179. [DOI] [PMC free article] [PubMed] [Google Scholar]
- Esparza TJ, Zhao H, Cirrito JR, Cairns NJ, Bateman RJ, Holtzman DM, Brody DL. Amyloid-beta oligomerization in Alzheimer dementia versus high-pathology controls. Ann Neurol. 2013;73:104–119. doi: 10.1002/ana.23748. [DOI] [PMC free article] [PubMed] [Google Scholar]
- Freir DB, Nicoll AJ, Klyubin I, Panico S, Mc Donald JM, Risse E, Asante EA, Farrow MA, Sessions RB, Saibil HR, Clarke AR, Rowan MJ, Walsh DM, Collinge J. Interaction between prion protein and toxic amyloid beta assemblies can be therapeutically targeted at multiple sites. Nat Commun. 2011;2:336. doi: 10.1038/ncomms1341. [DOI] [PMC free article] [PubMed] [Google Scholar]
- Fukumoto H, Tokuda T, Kasai T, Ishigami N, Hidaka H, Kondo M, Allsop D, Nakagawa M. High-molecular-weight beta-amyloid oligomers are elevated in cerebrospinal fluid of Alzheimer patients. FASEB J. 2010;24:2716–2726. doi: 10.1096/fj.09-150359. [DOI] [PubMed] [Google Scholar]
- Gandy S, Simon AJ, Steele JW, Lublin AL, Lah JJ, Walker LC, Levey AI, Krafft GA, Levy E, Checler F, Glabe C, Bilker WB, Abel T, Schmeidler J, Ehrlich ME. Days to criterion as an indicator of toxicity associated with human Alzheimer amyloid-beta oligomers. Ann Neurol. 2010;68:220–230. doi: 10.1002/ana.22052. [DOI] [PMC free article] [PubMed] [Google Scholar]
- Gao CM, Yam AY, Wang X, Magdangal E, Salisbury C, Peretz D, Zuckermann RN, Connolly MD, Hansson O, Minthon L, Zetterberg H, Blennow K, Fedynyshyn JP, Allauzen S. Abeta40 oligomers identified as a potential biomarker for the diagnosis of Alzheimer's disease. PLoS One. 2010;5:e15725. doi: 10.1371/journal.pone.0015725. [DOI] [PMC free article] [PubMed] [Google Scholar]
- Georganopoulou DG, Chang L, Nam JM, Thaxton CS, Mufson EJ, Klein WL, Mirkin CA. Nanoparticle-based detection in cerebral spinal fluid of a soluble pathogenic biomarker for Alzheimer's disease. Proc Natl Acad Sci U S A. 2005;102:2273–2276. doi: 10.1073/pnas.0409336102. [DOI] [PMC free article] [PubMed] [Google Scholar]
- Gong Y, Chang L, Viola KL, Lacor PN, Lambert MP, Finch CE, Krafft GA, Klein WL. Alzheimer's disease-affected brain: presence of oligomeric A beta ligands (ADDLs) suggests a molecular basis for reversible memory loss. Proc Natl Acad Sci U S A. 2003;100:10417–10422. doi: 10.1073/pnas.1834302100. [DOI] [PMC free article] [PubMed] [Google Scholar]
- Handoko M, Grant M, Kuskowski M, Zahs KR, Wallin A, Blennow K, Ashe KH. Correlation of specific amyloid-β oligomers with tau in cerebrospinal fluid from cognitively normal older adults. JAMA Neurol. 2013;70:594–599. doi: 10.1001/jamaneurol.2013.48. [DOI] [PMC free article] [PubMed] [Google Scholar]
- Hepler RW, Grimm KM, Nahas DD, Breese R, Dodson EC, Acton P, Keller PM, Yeager M, Wang H, Shughrue P, Kinney G, Joyce JG. Solution state characterization of amyloid beta-derived diffusible ligands. Biochemistry. 2006;45:15157–15167. doi: 10.1021/bi061850f. [DOI] [PubMed] [Google Scholar]
- Hernandez CM, Kayed R, Zheng H, Sweatt JD, Dineley KT. Loss of alpha7 nicotinic receptors enhances beta-amyloid oligomer accumulation, exacerbating early-stage cognitive decline and septohippocampal pathology in a mouse model of Alzheimer's disease. J Neurosci. 2010;30:2442–2453. doi: 10.1523/JNEUROSCI.5038-09.2010. [DOI] [PMC free article] [PubMed] [Google Scholar]
- Herskovits AZ, Locascio JJ, Peskind ER, Li G, Hyman BT. A Luminex assay detects amyloid β oligomers in Alzheimer's disease cerebrospinal fluid. PLoS One. 2013;8:e67898. doi: 10.1371/journal.pone.0067898. [DOI] [PMC free article] [PubMed] [Google Scholar]
- Hölttä M, Hansson O, Andreasson U, Hertze J, Minthon L, Nägga K, Andreasen N, Zetterberg H, Blennow K. Evaluating amyloid-β oligomers in cerebrospinal fluid as a biomarker for Alzheimer's disease. PLoS One. 2013;8:e66381. doi: 10.1371/journal.pone.0066381. [DOI] [PMC free article] [PubMed] [Google Scholar]
- Howlett DR, George AR, Owen DE, Ward RV, Markwell RE. Common structural features determine the effectiveness of carvedilol, daunomycin and rolitetracycline as inhibitors of Alzheimer beta-amyloid fibril formation. Biochem J. 1999;343:419–423. doi: 10.1042/0264-6021:3430419. [DOI] [PMC free article] [PubMed] [Google Scholar]
- Jack CR, Jr, Knopman DS, Jagust WJ, Shaw LM, Aisen PS, Weiner MW, Petersen RC, Trojanowski JQ. Hypothetical model of dynamic biomarkers of the Alzheimer's pathological cascade. Lancet Neurol. 2010;9:119–128. doi: 10.1016/S1474-4422(09)70299-6. [DOI] [PMC free article] [PubMed] [Google Scholar]
- Klein WL. Synaptotoxic amyloid-beta oligomers: a molecular basis for the cause, diagnosis, and treatment of Alzheimer's disease? J Alzheimers Dis. 2013;33:S49–65. doi: 10.3233/JAD-2012-129039. [DOI] [PubMed] [Google Scholar]
- Koffie RM, Hashimoto T, Tai HC, Kay KR, Serrano-Pozo A, Joyner D, Hou S, Kopeikina KJ, Frosch MP, Lee VM, Holtzman DM, Hyman BT, Spires-Jones TL. Apolipoprotein E4 effects in Alzheimer's disease are mediated by synaptotoxic oligomeric amyloid-beta. Brain. 2012;135:2155–2168. doi: 10.1093/brain/aws127. [DOI] [PMC free article] [PubMed] [Google Scholar]
- Kuo YM, Emmerling MR, Vigo-Pelfrey C, Kasunic TC, Kirkpatrick JB, Murdoch GH, Ball MJ, Roher AE. Water-soluble Abeta (N-40, N-42) oligomers in normal and Alzheimer disease brains. J Biol Chem. 1996;271:4077–4081. doi: 10.1074/jbc.271.8.4077. [DOI] [PubMed] [Google Scholar]
- Lacor PN, Buniel MC, Chang L, Fernandez SJ, Gong Y, Viola KL, Lambert MP, Velasco PT, Bigio EH, Finch CE, Krafft GA, Klein WL. Synaptic targeting by Alzheimer's-related amyloid beta oligomers. J Neurosci. 2004;24:10191–10200. doi: 10.1523/JNEUROSCI.3432-04.2004. [DOI] [PMC free article] [PubMed] [Google Scholar]
- Lambert MP, Barlow AK, Chromy BA, Edwards C, Freed R, Liosatos M, Morgan TE, Rozovsky I, Trommer B, Viola KL, Wals P, Zhang C, Finch CE, Krafft GA, Klein WL. Diffusible, nonfibrillar ligands derived from Abeta1–42 are potent central nervous system neurotoxins. Proc Natl Acad Sci U S A. 1998;95:6448–6453. doi: 10.1073/pnas.95.11.6448. [DOI] [PMC free article] [PubMed] [Google Scholar]
- Lambert MP, Velasco PT, Viola KL, Klein WL. Targeting generation of antibodies specific to conformational epitopes of amyloid beta-derived neurotoxins. CNS Neurol Disord Drug Targets. 2009;8:65–81. doi: 10.2174/187152709787601876. [DOI] [PubMed] [Google Scholar]
- Lesné S, Koh MT, Kotilinek L, Kayed R, Glabe CG, Yang A, Gallagher M, Ashe KH. A specific amyloid-beta protein assembly in the brain impairs memory. Nature. 2006;440:352–357. doi: 10.1038/nature04533. [DOI] [PubMed] [Google Scholar]
- LeVine H., 3rd Alzheimer's beta-peptide oligomer formation at physiologic concentrations. Anal Biochem. 2004;335:81–90. doi: 10.1016/j.ab.2004.08.014. [DOI] [PubMed] [Google Scholar]
- Lewczuk P, Esselmann H, Otto M, Maler JM, Henkel AW, Henkel MK, Eikenberg O, Antz C, Krause WR, Reulbach U, Kornhuber J, Wiltfang J. Neurochemical diagnosis of Alzheimer's dementia by CSF Aβ42, Aβ42/Aβ40 ratio and total tau. Neurobiol Aging. 2004;25:273–281. doi: 10.1016/S0197-4580(03)00086-1. [DOI] [PubMed] [Google Scholar]
- Lewczuk P, Beck G, Esselmann H, Bruckmoser R, Zimmermann R, Fiszer M, Bibl M, Maler JM, Kornhuber J, Wiltfang J. Effect of sample collection tubes on cerebrospinal fluid concentrations of tau proteins and amyloid beta peptides. Clin Chem. 2006;52:332–334. doi: 10.1373/clinchem.2005.058776. [DOI] [PubMed] [Google Scholar]
- Li J, Llano DA, Ellis T, LeBlond D, Bhathena A, Jhee SS, Ereshefsky L, Lenz R, Waring JF. Effect of human cerebrospinal fluid sampling frequency on amyloid-beta levels. Alzheimers Dement. 2012;8:295–303. doi: 10.1016/j.jalz.2011.05.900. [DOI] [PubMed] [Google Scholar]
- Mc Donald JM, Savva GM, Brayne C, Welzel AT, Forster G, Shankar GM, Selkoe DJ, Ince PG, Walsh DM Medical Research Council Cognitive Function and Ageing Study. The presence of sodium dodecyl sulphate-stable Abeta dimers is strongly associated with Alzheimer-type dementia. Brain. 2010;133:1328–1341. doi: 10.1093/brain/awq065. [DOI] [PMC free article] [PubMed] [Google Scholar]
- McKhann G, Drachman D, Folstein M, Katzman R, Price D, Stadlan EM. Clinical diagnosis of Alzheimer's disease: report of the NINCDS-ADRDA Work Group under the auspices of Department of Health and Human Services Task Force on Alzheimer's Disease. Neurology. 1984;34:939–944. doi: 10.1212/WNL.34.7.939. [DOI] [PubMed] [Google Scholar]
- McLaurin J, Kierstead ME, Brown ME, Hawkes CA, Lambermon MH, Phinney AL, Darabie AA, Cousins JE, French JE, Lan MF, Chen F, Wong SS, Mount HT, Fraser PE, Westaway D, St George-Hyslop P. Cyclohexanehexol inhibitors of Abeta aggregation prevent and reverse Alzheimer phenotype in a mouse model. Nat Med. 2006;12:801–808. doi: 10.1038/nm1423. [DOI] [PubMed] [Google Scholar]
- McLean CA, Cherny RA, Fraser FW, Fuller SJ, Smith MJ, Beyreuther K, Bush AI, Masters CL. Soluble pool of Abeta amyloid as a determinant of severity of neurodegeneration in Alzheimer's disease. Ann Neurol. 1999;46:860–866. doi: 10.1002/1531-8249(199912)46:6<860::AID-ANA8>3.0.CO;2-M. [DOI] [PubMed] [Google Scholar]
- Mungas D. In-office mental status testing: a practical guide. Geriatrics. 1991;46:54–58. [PubMed] [Google Scholar]
- Nussbaum JM, Schilling S, Cynis H, Silva A, Swanson E, Wangsanut T, Tayler K, Wiltgen B, Hatami A, Rönicke R, Reymann K, Hutter-Paier B, Alexandru A, Jagla W, Graubner S, Glabe CG, Demuth HU, Bloom GS. Prion-like behaviour and tau-dependent cytotoxicity of pyroglutamylated amyloid-beta. Nature. 2012;485:651–655. doi: 10.1038/nature11060. [DOI] [PMC free article] [PubMed] [Google Scholar]
- O'Bryant SE, Humphreys JD, Smith GE, Ivnik RJ, Graff-Radford NR, Petersen RC, Lucas JA. Detecting dementia with the mini-mental state examination in highly educated individuals. Arch Neurol. 2008;65:963–967. doi: 10.1001/archneur.65.7.963. [DOI] [PMC free article] [PubMed] [Google Scholar]
- Oe T, Ackermann BL, Inoue K, Berna MJ, Garner CO, Gelfanova V, Dean RA, Siemers ER, Holtzman DM, Farlow MR, Blair IA. Quantitative analysis of amyloid beta peptides in cerebrospinal fluid of Alzheimer's disease patients by immunoaffinity purification and stable isotope dilution liquid chromatography/negative electrospray ionization tandem mass spectrometry. Rapid Commun Mass Spectrom. 2006;20:3723–3735. doi: 10.1002/rcm.2787. [DOI] [PubMed] [Google Scholar]
- Perret-Liaudet A, Pelpel M, Tholance Y, Dumont B, Vanderstichele H, Zorzi W, Elmoualij B, Schraen S, Moreaud O, Gabelle A, Thouvenot E, Thomas-Anterion C, Touchon J, Krolak-Salmon P, Kovacs GG, Coudreuse A, Quadrio I, Lehmann S. Risk of Alzheimer's disease biological misdiagnosis linked to cerebrospinal collection tubes. J Alzheimers Dis. 2012;31:13–20. doi: 10.3233/JAD-2012-120361. [DOI] [PubMed] [Google Scholar]
- Pica-Mendez AM, Tanen M, Dallob A, Tanaka W, Laterza OF. Nonspecific binding of Abeta42 to polypropylene tubes and the effect of Tween-20. Clin Chim Acta. 2010;411:1833. doi: 10.1016/j.cca.2010.07.019. [DOI] [PubMed] [Google Scholar]
- Pitschke M, Prior R, Haupt M, Riesner D. Detection of single amyloid beta-protein aggregates in the cerebrospinal fluid of Alzheimer's patients by fluorescence correlation spectroscopy. Nat Med. 1998;4:832–834. doi: 10.1038/nm0798-832. [DOI] [PubMed] [Google Scholar]
- Portelius E, Mattsson N, Andreasson U, Blennow K, Zetterberg H. Novel aβ isoforms in Alzheimer's disease-their role in diagnosis and treatment. Curr Pharm Des. 2011;17:2594–2602. doi: 10.2174/138161211797416039. [DOI] [PubMed] [Google Scholar]
- Sancesario GM, Cencioni MT, Esposito Z, Borsellino G, Nuccetelli M, Martorana A, Battistini L, Sorge R, Spalletta G, Ferrazzoli D, Bernardi G, Bernardini S, Sancesario G. The load of amyloid-β oligomers is decreased in the cerebrospinal fluid of Alzheimer's disease patients. J Alzheimers Dis. 2012;31:865–878. doi: 10.3233/JAD-2012-120211. [DOI] [PubMed] [Google Scholar]
- Sankaranarayanan S, Holahan MA, Colussi D, Crouthamel MC, Devanarayan V, Ellis J, Espeseth A, Gates AT, Graham SL, Gregro AR, Hazuda D, Hochman JH, Holloway K, Jin L, Kahana J, Lai MT, Lineberger J, McGaughey G, Moore KP, Nantermet P, et al. First demonstration of cerebrospinal fluid and plasma A beta lowering with oral administration of a beta-site amyloid precursor protein-cleaving enzyme 1 inhibitor in nonhuman primates. J Pharmacol Exp Ther. 2009;328:131–140. doi: 10.1124/jpet.108.143628. [DOI] [PubMed] [Google Scholar]
- Santos AN, Ewers M, Minthon L, Simm A, Silber RE, Blennow K, Prvulovic D, Hansson O, Hampel H. Amyloid-β oligomers in cerebrospinal fluid are associated with cognitive decline in patients with Alzheimer's disease. J Alzheimers Dis. 2012;29:171–176. doi: 10.3233/JAD-2012-111361. [DOI] [PubMed] [Google Scholar]
- Sarsoza F, Saing T, Kayed R, Dahlin R, Dick M, Broadwater-Hollifield C, Mobley S, Lott I, Doran E, Gillen D, Anderson-Bergman C, Cribbs DH, Glabe C, Head E. A fibril-specific, conformation-dependent antibody recognizes a subset of Ab plaques in Alzheimer disease, Down syndrome and Tg2576 transgenic mouse brain. Acta Neuropathol. 2009;118:505–517. doi: 10.1007/s00401-009-0530-3. [DOI] [PMC free article] [PubMed] [Google Scholar]
- Schilling S, Zeitschel U, Hoffmann T, Heiser U, Francke M, Kehlen A, Holzer M, Hutter-Paier B, Prokesch M, Windisch M, Jagla W, Schlenzig D, Lindner C, Rudolph T, Reuter G, Cynis H, Montag D, Demuth HU, Rossner S. Glutaminyl cyclase inhibition attenuates pyroglutamate Abeta and Alzheimer's disease-like pathology. Nat Med. 2008;14:1106–1111. doi: 10.1038/nm.1872. [DOI] [PubMed] [Google Scholar]
- Schupf N, Tang MX, Fukuyama H, Manly J, Andrews H, Mehta P, Ravetch J, Mayeux R. Peripheral Abeta subspecies as risk biomarkers of Alzheimer's disease. Proc Natl Acad Sci U S A. 2008;105:14052–14057. doi: 10.1073/pnas.0805902105. [DOI] [PMC free article] [PubMed] [Google Scholar]
- Shankar GM, Li S, Mehta TH, Garcia-Munoz A, Shepardson NE, Smith I, Brett FM, Farrell MA, Rowan MJ, Lemere CA, Regan CM, Walsh DM, Sabatini BL, Selkoe DJ. Amyloid-beta protein dimers isolated directly from Alzheimer's brains impair synaptic plasticity and memory. Nat Med. 2008;14:837–842. doi: 10.1038/nm1782. [DOI] [PMC free article] [PubMed] [Google Scholar]
- Shaw LM, Vanderstichele H, Knapik-Czajka M, Clark CM, Aisen PS, Petersen RC, Blennow K, Soares H, Simon A, Lewczuk P, Dean R, Siemers E, Potter W, Lee VM, Trojanowski JQ Alzheimer's Disease Neuroimaging Initiative. Cerebrospinal fluid biomarker signature in Alzheimer's disease neuroimaging initiative subjects. Ann Neurol. 2009;65:403–413. doi: 10.1002/ana.21610. [DOI] [PMC free article] [PubMed] [Google Scholar]
- Shughrue PJ, Acton PJ, Breese RS, Zhao WQ, Chen-Dodson E, Hepler RW, Wolfe AL, Matthews M, Heidecker GJ, Joyce JG, Villarreal SA, Kinney GG. Anti-ADDL antibodies differentially block oligomer binding to hippocampal neurons. Neurobiol Aging. 2010;31:189–202. doi: 10.1016/j.neurobiolaging.2008.04.003. [DOI] [PubMed] [Google Scholar]
- Slemmon JR, Meredith J, Guss V, Andreasson U, Andreasen N, Zetterberg H, Blennow K. Measurement of Abeta1–42 in cerebrospinal fluid is influenced by matrix effects. J Neurochem. 2012;120:325–333. doi: 10.1111/j.1471-4159.2011.07553.x. [DOI] [PubMed] [Google Scholar]
- Tarawneh R, Lee JM, Ladenson JH, Morris JC, Holtzman DM. CSF VILIP-1 predicts rates of cognitive decline in early Alzheimer disease. Neurology. 2012;78:709–719. doi: 10.1212/WNL.0b013e318248e568. [DOI] [PMC free article] [PubMed] [Google Scholar]
- Todd J, Freese B, Lu A, Held D, Morey J, Livingston R, Goix P. Ultrasensitive flow-based immunoassays using single-molecule counting. Clin Chem. 2007;53:1990–1995. doi: 10.1373/clinchem.2007.091181. [DOI] [PubMed] [Google Scholar]
- Tomic JL, Pensalfini A, Head E, Glabe CG. Soluble fibrillar oligomer levels are elevated in Alzheimer's disease brain and correlate with cognitive dysfunction. Neurobiol Dis. 2009;35:352–358. doi: 10.1016/j.nbd.2009.05.024. [DOI] [PMC free article] [PubMed] [Google Scholar]
- Townsend M, Cleary JP, Mehta T, Hofmeister J, Lesne S, O'Hare E, Walsh DM, Selkoe DJ. Orally available compound prevents deficits in memory caused by the Alzheimer amyloid-beta oligomers. Ann Neurol. 2006;60:668–676. doi: 10.1002/ana.21051. [DOI] [PubMed] [Google Scholar]
- Wang TJ, Wollert KC, Larson MG, Coglianese E, McCabe EL, Cheng S, Ho JE, Fradley MG, Ghorbani A, Xanthakis V, Kempf T, Benjamin EJ, Levy D, Vasan RS, Januzzi JL. Prognostic utility of novel biomarkers of cardiovascular stress: the Framingham Heart Study. Circulation. 2012;126:1596–1604. doi: 10.1161/CIRCULATIONAHA.112.129437. [DOI] [PMC free article] [PubMed] [Google Scholar]
- Wu G, Miller RA, Connolly B, Marcus J, Renger J, Savage MJ. Pyroglutamate-modified amyloid-β protein demonstrates similar properties in an Alzheimer's disease familial mutant knock-in mouse and Alzheimer's disease brain. Neurodegener Dis. 2013 doi: 10.1159/000353634. doi: 10.1159/000353634. Advance online publication. [DOI] [PubMed] [Google Scholar]
- Xia W, Yang T, Shankar G, Smith I, Shen Y, Walsh DM, Selkoe DJ. A specific enzyme-linked immunosorbent assay for measuring beta-amyloid protein oligomers in human plasma and brain tissue of patients with Alzheimer disease. Arch Neurol. 2009;66:190–199. doi: 10.1001/archneurol.2008.565. [DOI] [PMC free article] [PubMed] [Google Scholar]
- Yamamoto N, Matsubara E, Maeda S, Minagawa H, Takashima A, Maruyama W, Michikawa M, Yanagisawa K. A ganglioside-induced toxic soluble Abeta assembly. Its enhanced formation from Abeta bearing the Arctic mutation. J Biol Chem. 2007;282:2646–2655. doi: 10.1074/jbc.M606202200. [DOI] [PubMed] [Google Scholar]
- Yang T, Hong S, O'Malley T, Sperling RA, Walsh DM, Selkoe DJ. New ELISAs with high specificity for soluble oligomers of amyloid beta-protein detect natural Abeta oligomers in human brain but not CSF. Alzheimers Dement. 2013;9:99–112. doi: 10.1016/j.jalz.2012.11.005. [DOI] [PMC free article] [PubMed] [Google Scholar]
- Zetzsche T, Rujescu D, Hardy J, Hampel H. Advances and perspectives from genetic research: development of biological markers in Alzheimer's disease. Expert Rev Mol Diagn. 2010;10:667–690. doi: 10.1586/erm.10.48. [DOI] [PubMed] [Google Scholar]