

Abstract
Contextual learning involves associating cues with an environment and relating them to past experience. Previous data indicate functional specialization within the hippocampal circuit: the dentate gyrus (DG) is crucial for discriminating similar contexts, whereas CA3 is required for associative encoding and recall. Here, we used Arc/H1a catFISH imaging to address the contribution of the largely overlooked CA2 region to contextual learning by comparing ensemble codes across CA3, CA2, and CA1 in mice exposed to familiar, altered, and novel contexts. Further, to manipulate the quality of information arriving in CA2 we used two hippocampal mutant mouse lines, CA3-NR1 KOs and DG-NR1 KOs, that result in hippocampal CA3 neuronal activity that is uncoupled from the animal's sensory environment. Our data reveal largely coherent responses across the CA axis in control mice in purely novel or familiar contexts; however, in the mutant mice subject to these protocols the CA2 response becomes uncoupled from CA1 and CA3. Moreover, we show in wild-type mice that the CA2 ensemble is more sensitive than CA1 and CA3 to small changes in overall context. Our data suggest that CA2 may be tuned to remap in response to any conflict between stored and current experience.
Keywords: Arc, CA2, context learning, H1a, hippocampus, IEG
Introduction
Different aspects of contextual memory are assigned to specific hippocampal subfields; the dentate gyrus (DG) is implicated in distinguishing contexts via synaptic plasticity, sparse activity, high cell number, and adult-born neurons, whereas recurrent connections in CA3 handle rapid storage of information, ensuring accurate retrieval when recall cues are incomplete (McNaughton and Nadel, 1990; O'Reilly and McClelland, 1994; Nakazawa et al., 2002; Gold and Kesner, 2005; McHugh et al., 2007; Clelland et al., 2009; Nakashiba et al., 2012). CA2 function, however, has largely been ignored. The classical definition of CA2 was based on the presence of supramammilary nucleus fibers (Haglund et al., 1984) and lack of mossy fiber inputs (Lorente de No, 1934); however, the modern definition of the region indicates CA2 may be larger and more complex (Lein et al., 2005; Kohara et al., 2014). Accumulating evidence documenting its convergent inputs, synaptic properties, and role in disease suggest a unique role in hippocampal function (Sekino et al., 1997; Benes et al., 1998; Bartesaghi and Gessi, 2004; Mercer et al., 2007; Zhao et al., 2007; Chevaleyre and Siegelbaum, 2010; Jones and McHugh, 2011; Simons et al., 2012; Rowland et al., 2013). In vitro physiological studies highlight CA2 responses inconsistent with sequential activation as part of the CA3/CA1/EC loop (Sekino et al., 1997; Chevaleyre and Seigelbaum, 2010). Furthermore, CA3 inputs onto CA2 pyramidal neurons do not exhibit experimentally induced plasticity as readily as in CA1, whereas direct inputs from the entorhinal cortex (EC) are strong and plastic. Whole-cell recordings demonstrated that CA2 pyramidal cells are distinct from CA1 in their dendritic morphology, connectivity, and basal membrane properties. Finally, CA2 stimulation resulted in robust excitation of CA1 pyramidal cells, completing a new and potent route for information flow from the EC to CA1 (Chevaleyre and Siegelbaum, 2010).
Given the spatially receptive fields of hippocampal pyramidal cells (“place cells”; O'Keefe and Dostrovsky, 1971), contextual learning and discrimination is often studied by recording these neurons and observing the similarity of the active population across environments. A complementary approach, Arc/H1a catFISH, allows the in situ signal of the immediate early genes Arc and H1a to act both as a readout of neuronal activity and as a temporal metric for when a neuron was active. This permits the simultaneous examination of large populations of cells and the assessment of contextual memory by observing ensemble changes in response to environmental manipulations (Vazdarjanova et al., 2002; Vazdarjanova and Guzowski, 2004). Here we use catFISH to track ensembles activated during contextual learning across CA3/CA2/CA1, providing the first characterization of CA2 activity in vivo. We find exposure of mice to a completely novel context has a similar effect on neuronal ensemble activity across all CA fields (Vazdarjanova and Guzowski, 2004); however, we can uncouple the CA2 response from its neighbors with genetic intervention or modified behavioral protocols. Our data reveals the CA2 ensemble is extremely sensitive to conflicts in input and may serve to detect differences between memory driven and sensory information converging on the hippocampus.
Materials and Methods
Mice
For seizure-induced Arc/H1a expression C57BL/6J mice, bred in-house, were used (age 14–20 weeks, n = 8). In the behavioral and Arc/H1a catFISH protocols in the first experiment adult male mice of three genotypes were used: DG-NR1 KO (McHugh et al., 2007; n = 16 for behavior, n = 11 for Arc/H1a catfish; age 16–26 weeks), CA3-NR1 KO (Nakazawa et al., 2002; n = 22 for behavior, n = 13 for Arc/H1a catfish; age 18–26 weeks) and their control flNR1 homozygous littermates (n = 23 for behavior, n = 15 for Arc/H1a catfish; age 16–26 weeks). Additionally two mice of each genotype were immediately killed from the home cage and used as caged controls for Arc/H1a catFISH. All animals were housed in groups of 2–5, and provided with food and water ad libitum. For the AA/AA′/AB′/AB experiments C57BL/6J mice, bred in-house, were used (age 14–20 weeks, AA n = 8, AA′ n = 9, AB′ = 8, AB = 7). Mice were maintained in a temperature- and humidity-controlled room with a 12 h light/dark cycle (lights on from 08:00 A.M. to 8:00 P.M.). Experiments were all conducted during the animals' light cycle. All experimental protocols were approved by the RIKEN Institutional Animal Care and Use Committee.
Seizure induction
Naive mice were transported in their home cages to an adjacent experimental room. Seizure was induced via intraperitoneal injection of NMDA (Tocris Bioscience; 10 mg/ml in 0.9% NaCl, dose of 100 mg/kg) and mice were placed back into their home cage. At each of four time points: 0′, 10′, 30′, and 60′ following injection two mice were removed from the home cage and killed. Brains were rapidly removed, embedded in optimal cutting temperature compound (OCT; Tissue-Tek), frozen on dry ice, and stored at −80°C until further processing. Coronal sections (20 μm) were prepared using a Microm HM560-S cryostat and collected on Matsunami Superfrost slides.
Behavioral handling procedures and tissue preparation
NR mutant experiments.
The mice were habituated to handling and transport and allowed to explore box A for 5 min daily over 4 d by an experimenter blind to genotype. Box A is a round arena, 45 cm in diameter, with 45-cm-high white walls, a green textured floor, 0.1% isoamyl alcohol (banana) scent, and contains three small metallic objects in fixed locations (see Fig. 2E). Box B, located in a different part of the same large room, is a square arena (40 cm sides) with black walls, a black and white polka dotted floor lined with bubble wrap, 0.1% benzaldehyde (almond) scent, and three plastic fixed objects, distinct from those in box A. On the day of the experiment (day 5), mice explored box A for 5 min, were returned to their home cage, located in the same room for 20 min, and then placed in either the familiar Box A again or the new Box B for 5 min. Immediately following the second experience mice were decapitated. Naive caged control mice were removed directly from the home cage and killed. Brains were rapidly removed, embedded in OCT compound (Tissue-Tek), frozen on dry ice and stored at −80°C until further processing. Coronal sections (20 μm) were prepared using a Microm HM560-S cryostat and collected on Matsunami Superfrost slides.
Figure 2.
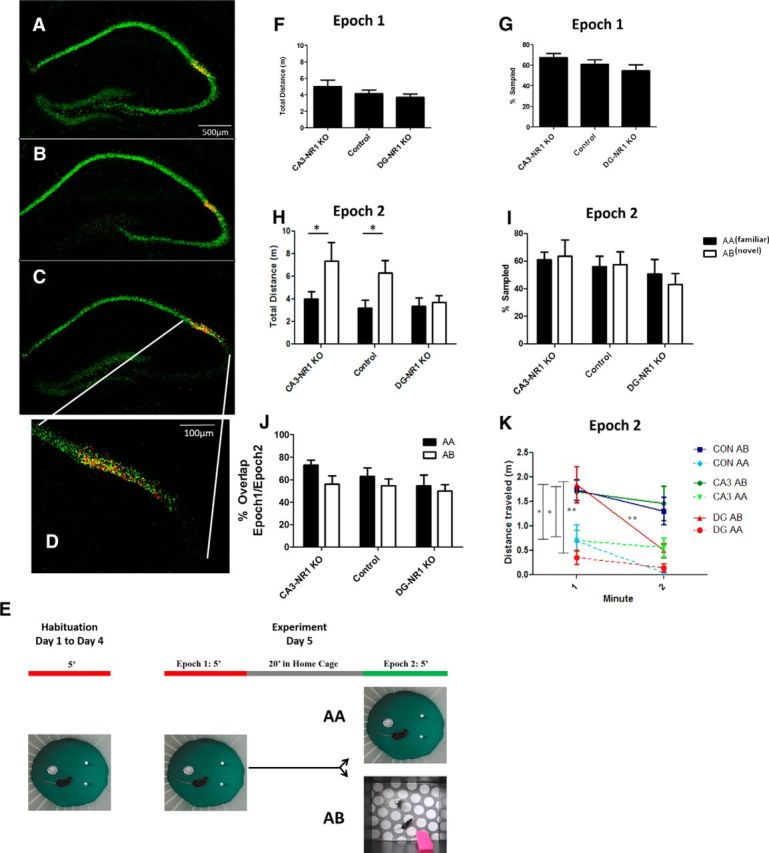
Exploratory behavior is altered in NR1-KO mice. A–D, We performed double FISH with a probe for NR1 (green) and CACNG5 (red). A, The 5× epifluorescent image of a coronal section of the dorsal hippocampus of the flNR1/flNR1 control mouse. B, The DG-NR1 KO mouse and the CA3-NR1 KO mouse (C). D, A high-magnification (20×) view of the CA3/CA2 border in the CA3-KO mouse. The loss of NR1 mRNA does not extend into the CA2 pyramidal cell layer. E, Protocol used for behavior and IEG expression experiments. F, Total distance traveled and percentage of the context sampled (G) during Epoch 1 finds no difference between genotypes.(CA3-NR1 KO n = 22; control, n = 23; DG-NR1 KO, n = 16; distance ANOVA; F(2,60) = 1.75, p = 0.1824; percentage coverage ANOVA; F(2,60) = 1.73, p = 0.1919). H, During Epoch2 the CA3-NR1 KO and control mice exposed to Box B (open bars; AB: CA3-NR1 KO, n = 10; control, n = 13; DG-NR1 KO, n = 8) explored significantly more than mice of the same genotype exposed to Box A (closed bars; AA: CA3-NR1 KO, n = 12; control, n = 10; DG-NR1 KO, n = 8), whereas DG-NR1 KO mice show no difference between protocols (two-way ANOVA F(1,32): protocol × genotype = 0.87, p = 0.43; F(1,2): protocol = 14.5, p = 0.0004; F(1,2): genotype = 4.4, p = 0.017; Bonferroni post-test CA3-KO AA × AB, p < 0.05, control AA × AB, p < 0.05; DG-KO AA × AB, p > 0.05). I, There was no difference across genotypes or protocols in the percentage of box sampled during Epoch2 (two-way ANOVA F(1,32): protocol × genotype = 0.18, p = 0.83; F(1,2): protocol = 0.03, p = 0.87; F(1,2): genotype = 1.5, p = 0.24) or (J) in the amount of overlap between the area explored across Epoch1 and Epoch2 (two-way ANOVA F(1,32): protocol × genotype = 0.41, p = 0.67; F(1,2): protocol = 3.2, p = 0.09; F(1,2): genotype = 1.5, p = 0.24). K, On a finer timescale all genotypes show significantly elevated exploration during the first minute in Box B, only the DG-NR1 KO mice show a significant decrease in exploration in the novel context between first and second minute in the context (two-way ANOVA F(1,2): protocol × genotype = 0.46, p = 0.63; F(1,2): protocol = 30.5, p < 0.0001; F(1,2): genotype = 0.9, p = 0.91; Bonferroni post-test minute 1 in AA vs minutes 1 in AB: CA3-KO AA × AB, p < 0.05, control AA × AB, p < 0.05, DG-KO AA × AB p < 0.01; minute 1 vs minute 2; CA3-KO, p > 0.05; control, p > 0.05; DG-NR1 KO, p < 0.01; *p < 0.05; **p < 0.01).
AA/AA′/AB′/AB experiments.
All habituation procedures were identical to the experiment above. On day 5, all mice explored box A for 5 min and were returned to their home cage, located in the same room, for 20 min. During Epoch2 the AA and AB conditions were as above, AA′ mice were placed in Box A along with the objects from Box B and in the AB′ condition mice were placed in Box B along with the objects from Box A. In both cases, the orientation and relative positioning of all objects, to both each other and the room was preserved.
Behavioral analysis
During behavioral testing on day 5, the animal's position was tracked with an overhead camera connected to a computer running ANY-maze software (Stoelting). Analysis of the distance traveled in 60 s bins for each animal was conducted using ANY-maze and averaged across each genotype and protocol. To calculate the percentage of each context sampled, as well as the percentage overlap between the paths of individual mice across run1 and run2, the x/y values of each mouse's path was imported into MATLAB v7.9 (MathWorks), converted into actual distance, and analyzed with custom scripts. Percentage overlap was calculated by binning each box into 1cm2 bins, calculating the number of common occupied bins between the contexts and normalizing via the formula [2 × (no. of common bins)]/(total bins visited in epoch1+ total bins visited in epoch2).
In situ hybridization
Double-label fluorescence in situ hybridization (FISH) for the IEGs Arc and H1a (Arc/H1a catFISH) was performed according to a previously described protocol (Guzowski et al., 1999; Vazdarjanova et al., 2002) with a few modifications. Digoxigenin- or fluorescein-labeled riboprobes were generated using commercially available transcription kits (MaxiScript SP6/T7 Kit; Ambion) and RNA labeling mixes (Roche). Sections were hybridized at 56°C with antisense probes overnight. The fluorescein-labeled H1a riboprobe was detected with anti-fluorescein HRP conjugate (PerkinElmer) and revealed with a cyanine-3 substrate kit (Cy3 TSA Plus; PerkinElmer). After quenching with H2O2, the digoxigenin-labeled Arc probe was detected with anti-digoxigenin-POD, Fab fragments (Roche) and a cyanine-5 substrate kit (Cy5 TSA Plus, PerkinElmer). Slides were coverslipped with Vectashield mounting medium containing DAPI (Vector Laboratories) for nuclear counterstaining.
For identification of the CA2 subfield, a 783bp RNA probe was derived from the mouse CACNG5 sequence according to the Allen Brain Atlas (Riboprobe ID: RP_050331_01_E08; Carninci et al., 2005). In situ hybridization was performed as described above, with H1a probe labeled with Fluorescein, Arc, and CACNG5 probes both labeled with digoxigenin, with the exception of Figure 1C in which Arc was labeled with digoxigenin and H1a and CACNG5 were labeled with fluorescein. For the final amplification step, H1a signal was revealed with Cy3- Tyramide Signal Amplification (TSA), whereas Arc and CACNG5 were detected with fluorescein-TSA. The diffuse cytoplasmic signal from the CACNG5 probe allowed clear identification of the CA2 area without masking the intranuclear Arc signal.
Figure 1.
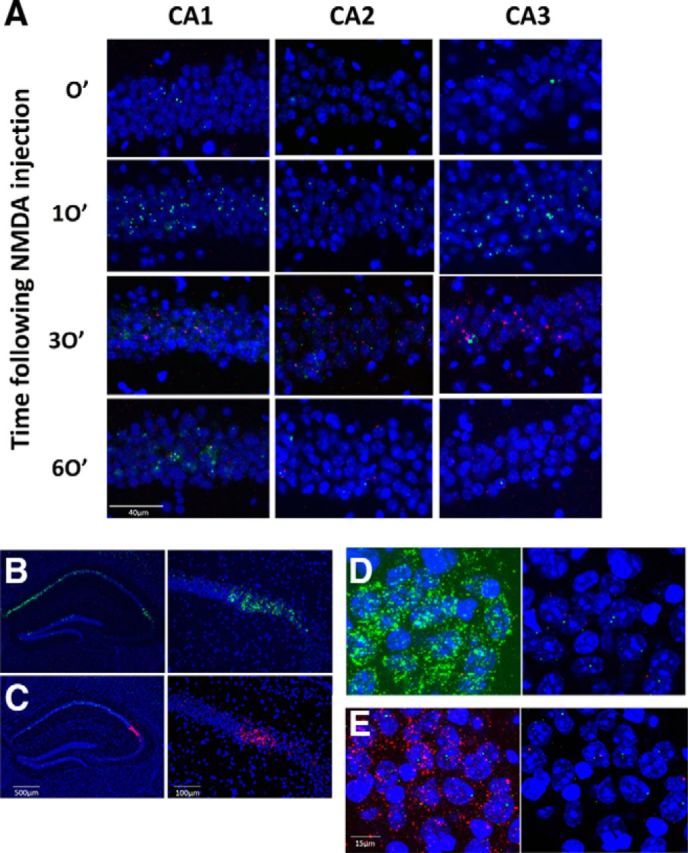
Kinetics of Arc/H1a expression in CA2 are similar to CA1/CA3. A, We performed Arc/H1a in situ in wild-type mice at four time points (top to bottom rows: 0, 10, 30, and 60 min) following NMDA-induced seizure. High-magnification epifluorescent images (20×) were acquired from each of the three CA subfields; CA2 was identified by CACNG5 in situ of adjacent sections (left, CA1; center, CA2; right, CA3). Nuclear expression of Arc (green) was very low at the time of injection, but clearly peaks in all three regions 10 min later. H1a (red) also has low background expression, but peaks at the 30 min time point in all three regions. B, C, Triple in situ with probes for H1a, Arc, and CACNG5. B, Triple in situ with the H1a probe labeled with Fluorescein and the Arc and CACNG5 probes both labeled with digoxigenin (left, 5×; right, 20×). C, H1a and CACNG5 probes are labeled with fluorescein and the Arc probe is labeled with digoxigenin. D, E, Confocal z-stacks (60×, 7 μm thick) of CA2 in the triple-labeled sections; left image was acquired with high laser power to visualize the weak CACNG5 signal, the right image with the laser settings used for all quantification experiment. D, H1a probe labeled with fluorescein and the Arc and CACNG5 probes both labeled with digoxigenin, under the standardized settings used for quantification (right), the CACNG5 probe does not prevent clear visualization of the INFs. E, Same as in D, except now the H1a and CACNG5 probes are labeled with fluorescein and the Arc probe is labeled with digoxigenin.
To verify the restriction of the NR1 gene deletion in the CA3-NR1 KO and DG-NR1 KO mice we conducted in situ hybridization as described above, with NR1 probe (FANTOM clone 4732488C07; Carninci et al., 2005) labeled with fluorescein and CACNG5 probe labeled with digoxigenin.
Image acquisition and analysis
For all quantification the images were acquired using an Olympus Fluoview FV10i confocal microscope with a 60× objective. Confocal z-stacks composed of 1-μm-thick optical sections were collected in regions CA1, CA2, and CA3 of the dorsal hippocampus (bregma −1.9 to −2.3) across all 20 μm of the section. Regions were sampled equally across the proximal/distal axis of CA1 and along the CA3c to CA3a axis in CA3; from each CA1 we acquired z-stacks from three regions: proximal, central, and distal CA1 and from each CA3 we acquired z-stacks from two regions, one proximal to CA2 and one closer to the hilus. A single CA2 stack was acquired from each hemisphere of the section, always from the center of the region defined by the CACNG5 probe. For all Arc/H1a+ intranuclear foci (INF) acquisition identical confocal laser and photomultiplier tube settings were applied to all regions, genotypes, and protocols. This resulted in a very low background signal in the caged control animals and overall lower Arc+ neurons in CA1 and CA3 than had been previously reported in the rat. In addition, under these imaging conditions the diffuse CACNG5 signal in CA2 was no longer visible, but the intense punctuate INF staining was, as evidenced by the lack of CACNG5 background in the CA2 of the caged control group. Stacks were analyzed with Olympus Fluoview ASW Ver.2.1.a software (average of 7 z-stacks per animal per region; average of 279.2 ± 8.9 neurons for CA1, 183 ± 3.4 neurons for CA2, 184.7 ± 5.4 neurons in CA3). To ensure that no transcriptional foci would lie outside the boundaries of the section an experimenter blind to the relationship between the image stacks, the genotype and the behavioral condition they represented first stepped through the entire z-stack, one section at a time with only the DAPI channel illuminated. This allowed the identification and marking of all nuclei that had a clearly defined complete 3D volume; the vast majority of these nuclei fall in the median 20% of the 20 μm section. Next, the green and red channels were revealed and once more the experimenter stepped through the entire z-stack, classifying these complete neuronal nuclei as follows: negative (containing no transcription foci), H1a+ (containing only H1a transcription foci), Arc+ (containing only Arc transcription foci), or Arc/H1a+ (containing foci for both H1a and Arc). Any nuclei with more than two foci of a single color were excluded, as were nuclear foci present in a single z-section. We did not use a hard threshold for foci size; however, to be considered a foci signal must be discernibly larger than the single or dual pixel extranuclear background fluorescence.
Comparison of active ensembles
The similarity score was calculated as previously described (Vazdarjanova and Guzowski, 2004). It takes the four measured cell-staining values (negative, H1a+, Arc+, and H1a/Arc+) and converts them to a single value. With this method, a value near 1 represents a single neuronal population faithfully activated in both epochs (a perfect A/A). A value near 0 indicates that two statistically independent cell populations were activated during the two epochs (a perfect A/B). The similarity score is derived as follows: (1) Epoch 1 active cells = fraction of total H1a-positive cells [(H1a+ plus Arc/H1a+)/total cells]. (2) Epoch 2 active cells = fraction of total Arc-positive cells [(Arc+ plus Arc/H1a+)/total cells]. (3) p(E1E2) = Epoch 1 active cell fraction × Epoch 2 active cell fraction. This is the probability of cells being active in both epochs (Arc/H1a+ cells), assuming the two epochs activated statistically independent neuronal ensembles. (4) diff(E1E2) = (Arc/H1a+) − p(E1E2). This is a measure of deviation from the independence hypothesis. (5) Least Epoch = the smaller of the ensembles activated by Epoch 1 or Epoch 2. (6) Similarity score = diff(E1E2)/(least epoch − p(E1E2).
Statistical analyses
Genotype and protocol differences for behavioral measures, Arc/H1a expression, and similarity scores were analyzed with one-way or two-way ANOVA, followed by Bonferroni post hoc tests corrected for multiple comparisons. For all tests, the null hypotheses were rejected at the 0.05 level of significance. Analysis was performed with GraphPad Prism (v5.04 for Windows) and Microsoft Excel.
Results
Using arc/H1a fluorescent in situ hybridization to study CA2
The Arc/H1a catFISH technique allows the assessment of neuronal activity across multiple regions and large populations of cells, permitting us to examine Arc and H1a expression in all the CA subfields of individual mice. The power of the technique lies in the inherent low background activity and the temporal specificity of the gene expression. Previous work has shown that following neuronal activation the pyramidal cells in CA1 and CA3 quickly transcribe Arc mRNA (∼2–10 min following activation), whereas neurons activated ∼25–40 min earlier contain robust H1a -INF (Vazdarjanova et al., 2002). To ensure that CA2 pyramidal cells expressed Arc/H1a with similar kinetics, we compared expression of the genes in all three regions 0, 10, 30, and 60 min following NDMA-induced seizure and found a uniform and robust expression pattern of both genes across the CA1/2/3 axis, with arc INFs peaking 10 min after NMDA injection and H1a peaking 30 min following injection (Fig. 1A). Next, to identify the boundaries of the CA2 region we repeated the Arc/H1a in situ along with a third in situ probe, α-CACNG5, to label CA2 (Fig. 1B,C; Fukaya et al., 2005; Shinohara et al., 2012). The weak, diffuse staining provided by the CACNG5 probe clearly defined CA2 under standard epifluorescent microscopy (Fig. 1B,C), however under the standardized laser and photomultiplier tube settings we used for confocal imaging across all subregions and mice this probe did not interfere with the INF detection when labeled with the same hapten as either H1a or Arc (Fig. 1D,E). For all subsequent experiments, we used triple in situ hybridization with the H1a probe labeled with fluorescein and the Arc and CACNG5 probes both labeled with digoxigenin.
Hippocampal circuit mutations alter behavior
Behavioral and physiological data demonstrate that the loss of NMDA receptors (NRs) at the CA3 recurrent synapses (CA3-NR1 KO mice) leads to deficits in rapid encoding of information and associative memory storage (Nakazawa et al., 2002; McHugh and Tonegawa, 2009), essentially a CA3 representation that is more novel than it should be. In contrast, the loss of NRs at the perforant path inputs from the EC to the DG (DG-NR1 KO mice) results in deficits in context discrimination both behaviorally and electrophysiologically (McHugh et al., 2007); novel contexts appear more familiar than in control mice. Thus, previous data suggest that plasticity in CA3 and the DG may make competing contributions to the encoding of new memories in CA3 and allow us to compare how these disparate deficits are manifest in CA2. We conducted dual in situ hybridization with an α-NR1 probe to detect the loss of NRs and an α-CACNG5 probe to label CA2 (Fukaya et al., 2005; Shinohara et al., 2012) to verify the restriction of our gene deletion to the DG and CA3 respectively and to demonstrate that CA2 NR1 expression was not altered (Fig. 2A–D).
The mutants and their control littermates were habituated to a single context, Box A, over 4 d. On day 5 all mice were allowed to explore Box A for 5 min (Epoch1), returned to their home cage for 20 min, then either returned to Box A (AA Protocol) or placed in a novel context, Box B (AB Protocol), for 5 min (Epoch2; Fig. 2E). The activity of the mice was monitored and following Epoch2 the mice were immediately killed and a random subset of the brains was subject to the Arc/H1a catFISH labeling and counting (Vazdarjanova et al., 2002), along with the CACNG5 in situ probe to define the boundaries of the CA subfields (Fig. 1B,C; Fukaya et al., 2005; Shinohara et al., 2012).
A simple behavioral indication of the familiarity of a context is the amount of exploration the mouse conducts during the trial. In the familiar box during Epoch1 there was a trend for the CA3-NR1 KO mice to explore more, however we found no significant difference among the genotypes in the percentage of the box explored or in the total distance traveled, suggesting the 4 d habituation protocol was effective in all three (Fig. 2F,G). During Epoch2, both control and CA3-NR1 KO mice exposed to the novel box (Box B) traveled significantly farther than those of identical genotype returned to the familiar; however, this response was muted in the DG-NR1 KO mice (Fig. 2H). Once again, we found no significant difference among the genotypes in the percentage of the box explored in either protocol, or in the overlap between the area explored in Epoch1 and Epoch2. (Fig. 2I,J). Interestingly, when we examined the behavior of the mice during Epoch2 on a finer time scale we observed that in Box B there was a novelty induced increase in exploration during the initial minute of the epoch compared with Box A in all three genotypes (Fig. 2K). However, only the DG-NR1 KO mice demonstrated a significant decrease in exploration during minute 2 in the novel context (Fig. 2K). Thus, the DG-NR1 KOs may recognize the presence of novel cues in Box B and demonstrate an initial behavioral response; however, the sustained exploration observed in controls is absent.
Differential context encoding across the CA subfields
Arc/H1a imaging permits the identification of neurons that were activated only in Epoch1 (H1a+), only during Epoch2 (Arc+), or in both epochs (H1a+/Arc+; Fig. 3A–E). For each region the observed classes of labeled neurons (Arc+, H1a+, and Arc/H1a double+) can be converted into a single “similarity score” which normalizes for overall activity levels in a given mouse and takes into account the observed and expected number of double-labeled neurons. This score indicates the difference between the cell populations activated during the two epochs. A value of 1 indicates that a single population of neurons was activated during both epochs, whereas a value near 0 indicates that two nonoverlapping populations were activated (Vazdarjanova and Guzowski, 2004).
Figure 3.

The loss of plasticity in DG and CA3 alters ensemble similarity across the CA subfields. A–C, Confocal stacks (60×) of CA2 (A, B) or the CA2/CA3 border (C). The diffuse green signal seen in (A1–C1) is the signal from the CACNG5 probe. In the stacks used for counting positive nuclei (A2–C2) the laser and PMT settings were adjusted to exclude this weaker diffuse signal while leaving the strong Arc INF signal intact; each panel includes a digitally zoomed image on single-positive cell. Identical settings were also used for CA1 (D) and CA3 (E) image collection to assure equal detection across subregions. Each panel contains a z-stack of seven 1 μm optical sections. DAPI signal visualized in blue, H1a probe in red, Arc probe in green and CACNG5 probe in green. Red arrows indicate example H1a+ nuclei, green arrows example Arc+ nuclei and yellow arrows example double-positive nuclei. F–H, Averaged group similarity data organized by genotype, subregion and protocol (mean ± SEM; blue bars AA protocols, red bars AB protocol). F, In the CA3-NR1 KO mice there was only a significant similarity difference in CA1 (AA: CA1, n = 5; CA2, n = 7; CA3, n = 5; AB: CA1, n = 8; CA2, n = 7; CA3, n = 9; two-way ANOVA F(1,2): protocol × subregion = 5.69, p = 0.0073; Bonferroni post-test CA3 AA × AB, p > 0.05; CA2 AA × AB, p > 0.05; CA1 AA × AB p < 0.001). G, In control mice there is a significant difference between protocols in all three CA regions (AA: CA1 n = 6; CA2, n = 7; CA3, n = 6; AB: CA1, n = 9; CA2, n = 7; CA3, n = 9; two-way ANOVA F(1,2): protocol × subregion = 2.05, p = 0.14; F(1,2): protocol = 38.6, p < 0.0001; F(1,2): subregion = 2.75, p = 0.08; Bonferroni post-test CA3 AA × AB, p < 0.0001; CA2 AA × AB, p < 0.05; CA1 AA × AB, p < 0.05). H, Whereas in the DG-NR1 KO mice there is a difference in CA1 and CA2, but not CA3 (AA: CA1, n = 5; CA2, n = 6; CA3, n = 5; AB: CA1, n = 6; CA2, n = 5; CA3, n = 6; two-way ANOVA F(1,2): protocol × subregion = 1.99, p = 0.16; F(1,2): protocol = 36.9, p < 0.0001; F(1,2): subregion = 33.9, p < 0.0001; Bonferroni post-test CA3 AA × AB, p > 0.05; CA2 AA × AB, p < 0.0001; CA1 AA × AB p < 0.05).
When we quantified Arc and H1a expression in CA1 we observed a significant decrease in ensemble similarity in mice exposed to the novel context compared with those repeatedly exposed to a familiar context (Fig. 3F–H). Although the values in AB mice were, on average, >0, this novelty dependent shift in the active ensemble parallels remapping seen in place cell recordings (Muller and Kubie, 1987), whereas the AA scores are in agreement with recent imaging work that allows tracking of thousands of CA1 pyramidal cells across days (Ziv et al., 2013). Although Arc/H1a imaging does not return reactivation values identical to those observed with place cell recordings, it is nonetheless sensitive enough to distinguish ensemble responses to changes in the context. Moreover, this novelty induced decrease in similarity was present and identical in all three genotypes (Fig. 3F–H). In addition, mice of all genotypes placed in Box B had significantly more Arc+ neurons in CA1 compared with mice placed back in Box A (Table 1). We believe this is not solely due to the increased locomotion in the novel chamber, as the increase was present in the DG-NR1 KO mice that did not demonstrate increased exploration (Fig. 2H) and mice of all genotypes sampled equivalent portions of both chambers (Fig. 2I). Further, this increase parallels an increase in active neurons in a novel context previously observed with physiology (Karlsson and Frank, 2008). Despite this increase in ensemble size during Epoch2, the number of double-positive cells remained constant across protocols, thus underlying the significantly higher similarity scores in AA mice. The absence of a genotypic effect suggests the CA1 response to novelty is independent of NRs in the DG and CA3 and does not require the sustained novelty induced locomotion, which was absent in the DG-NR1 KOs.
Table 1.
Size of the active neuronal ensembles in control and mutant mice
| Control (%) |
CA3-NR1 KO (%) |
DG-NR1 KO (%) |
|||||||
|---|---|---|---|---|---|---|---|---|---|
| CA3 | CA2 | CA1 | CA3 | CA2 | CA1 | CA3 | CA2 | CA1 | |
| cc | |||||||||
| arc | 0.0 ± 0 | 0.0 ± 0 | 0.0 ± 0 | 0.0 ± 0 | 3.0 ± 4.0 | 0.5 ± 0 | 0.0 ± 0 | 0.0 ± 0 | 0.3 ± 0.4 |
| H1a | 4.8 ± 0.5 | 3.7 ± 0.5 | 4.5 ± 1.1 | 5.5 ± 1.2 | 3.9 ± 2.1 | 5.4 ± 0.1 | 3.2 ± 0.9 | 3.9 ± 0.1 | 4.5 ± 1.9 |
| AA | |||||||||
| arc | 12.7 ± 2.3 | 11.5 ± 1.0 | 15.9 ± 2.8 | 10.0 ± 0.8 | 12.8 ± 1.9 | 16.5 ± 1.1 | 11.7 ± 1.3 | 14.5 ± 1.9 | 14.0 ± 4.4 |
| H1a | 21.5 ± 2.5 | 13.5 ± 1.2 | 18.6 ± 1.6 | 17.1 ± 1.9 | 13.1 ± 1.3 | 19.4 ± 1.2 | 22.0 ± 1.0 | 15.1 ± 1.7 | 17.5 ± 2.4 |
| AB | |||||||||
| arc | 10.7 ± 1.9 | 12.2 ± 1.9 | 22.6 ± 3.7* | 10.1 ± 1.3 | 14.1 ± 1.8 | 27.6 ± 4.4** | 10.5 ± 1.5 | 14.4 ± 2.3 | 22.3 ± 1.2* |
| H1a | 17.7 ± 1.9 | 13.5 ± 2.3 | 19.3 ± 2.5 | 16.2 ± 1.0 | 12.8 ± 1.4 | 22.6 ± 1.2 | 19.4 ± 4.1 | 12.7 ± 1.8 | 20.6 ± 1.2 |
Control AA Arc+ × AB Arc+, p < 0.05; CA3-KO AA Arc+ × AB Arc+, p < 0.01; DG-NR1 KO AA Arc+ × AB Arc+, p < 0.05; **p < 0.01, *p < 0.05 compared with AA condition for the same gene, region, and genotype.
Percentage (mean ± SEM) of total neurons scored Arc+ or H1a+ in CA1, CA2, and CA3 of each of the genotypes in (top row) the caged control condition (cc, n = 2 of each genotype) and the AA (center row) and AB (bottom row)protocols.. The presence of Arc reflects recent neuronal activity (Epoch2 under the AA and AB protocols), whereas the presence of H1a reflects activity 20–30 min prior (Epoch 1 under the AA and AB protocols). All mice that underwent behavior expressed significantly more Arc and H1a than caged controls. Across all subregions and genotypes, we find a significant interaction between protocol and IEG (Arc/H1a; two-way ANOVA F(1,1): protocol × IEG =5.13, p = 0.026; Bonferroni post-test AA × AB: Arc+, p < 0.0001; H1a+, p > 0.05). This difference was driven by an increase in Arc expression in the CA1 of control, CA3-NR1 KO and DG-NR1 KO mice in the AB protocol (CA1 only: two-way ANOVA F(1,2): protocol × genotype = 0.30, p = 0.74; F(1,2): protocol = 27.6, p < 0.0001; F(1,2): genotype = 0.85, p = 0.44; Bonferroni post-test CA3-KO AA Arc+ × AB Arc+, p < 0.01; control AA Arc+ × AB Arc, p < 0.05; DG-KO AA Arc+ × AB Arc, p < 0.05; **p < 0.01, *p < 0.05 compared with the AA condition for the same gene, region, and genotype).
One major anatomical distinction between CA3 and CA1 are the presence of recurrent collateral connections in CA3. These synapses have been suggested to be crucial for rapid memory formation and stability (Ishizuka et al., 1990; Rolls and Kesner, 2006). In control mice we observed a significant decrease in CA3 ensemble similarity in mice exposed to the novel context during Epoch2 (Fig. 3G). Although the overall size of the active ensemble did not change between protocols, this drop in similarity paralleled a decrease in the number of double-positive cells, indicating a different population of neurons was recruited. In CA3-NR1 KO mice, the CA3 similarity scores were uniformly low regardless of whether the context presented in Epoch2 was novel or familiar. On the contrary, in the DG-NR1 KO mice the similarity score of the CA3 ensemble was comparably high in both contextual conditions, suggesting a failure to differentially encode the novel box (Fig. 3F,H). Thus, our data are in agreement with the relative importance of the DG and DG plasticity in context discrimination, and CA3 and CA3 plasticity in memory storage.
Next, we turned to CA2 and asked how the shifts in CA3 ensemble activity in the NR1-KO mice altered CA2 activity. CA2 pyramidal cells receive afferent inputs unique from neighboring CA fields, convergent projections from both the medial and lateral EC, as well as input from CA3 via the Schaffer collaterals (Bartesaghi and Gessi, 2004; Chevaleyre and Siegelbaum, 2010) and the DG via the mossy fibers (Gaarskjaer, 1986; Lein et al., 2005; Kohara et al., 2014). Further, it has been reported that in contrast to CA1, activation of the CA3 inputs to CA2 results in net inhibition, whereas the EC inputs are strong and plastic (Chevaleyre and Siegelbaum, 2010). We found that overall ensemble size in CA2 was smaller than in CA1, but comparable to that observed in CA3 (Table 1). When we examined similarity scores we observed a significant difference in CA2 between protocols in control and DG-NR1 KO mice, but not in CA3-NR1 KOs (Fig. 3F–H). In the CA3-NR1 KO mice CA2 similarity was significantly lower than controls under the AA protocol, paralleling the CA3 phenotype in these mutants (Fig. 3F). Strikingly however, the DG-NR1 KO mice displayed a significant decrease in CA2 similarity under the AB protocol despite the fact that the CA3 similarity remained high in these mice following exposure to the novel context (Fig. 3H).
CA2 independently remaps following subtle changes in context
If the loss of NRs in CA3 or the DG decoupled the CA2 response by creating conflict between memory driven information arriving via CA3 and sensory information arriving via the EC, might it be possible to alter the behavioral protocol to create a similar effect in wild-type mice? To explore this further we used the same experimental design as in Figure 2E, but in addition to the AA/AB protocols we subjected additional groups of mice to more subtle contextual changes: the AA′ protocol, in which the box was fixed but the objects were changed during Epoch 2, and the AB′ protocol, in which the box was changed to Box B, but the objects from Box A remained (Fig. 4A). As in the previous experiment, we observed a significant increase in distance traveled, but not percentage of the context sampled, between epochs in mice placed in the novel box (AB′ and AB protocol), however not in the mice presented with novel objects (AA′; Fig. 4B). We examined Arc and H1a expression to quantify the ensemble changes in these mice across the CA1/CA2/CA3 axis. Once again we observed a larger active ensemble in CA1 in the novel conditions (AA′, AB′, and AB protocols). Further, overall Arc and H1a expression in CA1 was greater than that in CA3 and CA2, which were similar (Table 2).
Figure 4.

Subtle contextual changes lead to remapping specifically in CA2. A, The protocol used for the AA′ and AB′ experiments. B, Comparing exploration between Epoch 1 and Epoch 2 across all four protocols finds a significant interaction between epoch and protocol (AA, n = 7; AA′, n = 9; AB′, n = 8; AB, n = 10; two-way ANOVA F(1,3): protocol × epoch = 12.52, p < 0.0001; Bonferroni post-test Epoch1 × Epoch2: AA, p > 0.05; AA′, p > 0.05; AB′, p < 0.0001; AB, p < 0.0001). The wild-type mice exposed to Box B (AB′, AB) explored significantly more during Epoch 2. C, Comparison of similarity scores by subregion across all four protocols used, varying in degree of contextual change from left to right (AA, blue bars; AA′, light blue bars; AB′, light red bars; AB, red bars; AA, n = 7; AA′, n = 9; AB′, n = 8; AB, n = 10; two-way ANOVA F(1,6): protocol × region = 1.65, p = 0.143; F(1,3): protocol = 17.9, p < 0.0001; F(1,2): subregion = 7.06, p = 0.0015; CA1 Bonferroni's multiple-comparison post-test; AA vs AA′, p > 0.05; AA vs AB′, p > 0.05; AA vs AB, p < 0.005; AA′ vs AB′, p > 0.05; AA′ vs AB, p > 0.05; AB′ vs AB p > 0.05; CA2 Bonferroni's multiple-comparison post-test; AA vs AA′, p < 0.05; AA vs AB′, p < 0.005; AA vs AB, p < 0.001; AA′ vs AB′, p > 0.05; AA′ vs AB′, p > 0.05; AB′ vs AB, p > 0.05; CA3 Bonferroni's multiple-comparison post-test; AA vs AA′, p < 0.0001; AA vs AB′, p < 0.001; AA vs AB, p < 0.0001; AA′ vs AB′, p > 0.05; AA′ vs AB′, p > 0.05; AB′ vs AB, p < 0.05; ****p < 0.0001, ***p < 0.001, **p < 0.01, *p < 0.05). D–F, Scatter plots of similarity scores of individual mice across pairs of regions. Thick line is the 45° line representing the x = y condition (AA, n = 7; AA′, n = 9; AB′, n = 8; AB, n = 10; blue circles, AA; light blue square, AA′; light red triangle, AB′; red triangle, AB). D, CA1 versus CA3, many points cluster around the 45° line, indicating coherent changes across these regions. E, CA1 versus CA2 and (F) CA2 versus CA3 condition most points from the AA′ and AB′ are below the 45° line, suggesting relatively greater remapping in CA2 than CA3 and CA1.
Table 2.
Size of the active neuronal ensembles under the AA/AA′/AB′/AB protocols
| CA3 (%) | CA2 (%) | CA1 (%) | |
|---|---|---|---|
| AA | |||
| arc | 6.4 ± 0.9ΔΔ | 5.3 ± 0.8ΔΔ | 13.8 ± 2.0 |
| H1a | 9.5 ± 1.3 | 7.3 ± 0.7### | 13.8 ± 1.1 |
| AA′ | |||
| arc | 8.5 ± 0.5ΔΔΔ | 4.7 ± 0.8ΔΔΔ | 19.9 ± 1.1* |
| H1a | 9.5 ± 0.8 | 6.3 ± 1.2## | 12.0 ± 0.8 |
| AB′ | |||
| arc | 6.6 ± 0.7ΔΔΔ | 5.9 ± 1.7ΔΔΔ | 23.4 ± 1.7*** |
| H1a | 9.7 ± 1.0 | 5.1 ± 1.0### | 13.2 ± 1.7 |
| AB | |||
| arc | 7.2 ± 0.8ΔΔΔ | 11.0 ± 2.0ΔΔΔ | 23.6 ± 3.2*** |
| H1a | 9.8 ± 0.8 | 5.6 ± 0.9## | 12.1 ± 1.5 |
*CA1 arc in AA′, AB′, and AB mice is elevated compared to AA mice; *p < 0.05, ***p < 0.001.
Δarc expression is significantly lower in CA2 and CA3 compared with CA1; ΔΔp < 0.01, ΔΔΔp < 0.0001.
#H1a expression is significantly lower in CA2 compared with CA1; ##p < 0.01, ###p < 0.0001.
Percentage (mean ± SEM) of neurons scored Arc+ or H1a+ in CA1, CA2, and CA3 of C57BL/6 wild-type mice subject to the AA/AA′/AB′/AB protocols. For Arc expression we found a significant interaction between protocol and subregion with significantly more Arc in the CA1 of AA′, AB′, and AB mice compared with AA mice (two-way ANOVA, F(1,6): protocol × subregion = 3.44, p = 0.0044; Bonferroni post-test AA × AA′: CA1, p < 0.05; CA2 and CA3, p > 0.05; AA × AB′: CA1, p < 0.0001; CA2 and CA3, p > 0.05; AA × AB: CA1, p < 0.0001; CA2 and CA3, p > 0.05). When we compared Arc expression across subregions within protocols we find that levels in CA2 and CA3 are similar and both are significantly lower than levels in CA1 (Bonferroni post-test CA1 × CA2: AA, p < 0.01; AA′, p < 0.0001; AB′, p < 0.0001; AB, p < 0.001; CA1 × CA3: AA, p < 0.01; AA′, p < 0.0001; AB′, p < 0.0001; AB, p < 0.001) . For H1a expression we found no interaction or protocol effect, but observed a significant effect of subregion (two-way ANOVA, F(1,6): protocol × subregion = 0.41, p = 0.868; F(1,3): protocol = 0.56, p = 0.644; F(1,2): subregion = 36.8, p < 0.0001; Bonferroni post-test CA1 × CA2: AA, p < 0.001; AA′, p < 0.01; AB′, p < 0.0001; AB, p < 0.001), with overall levels significantly lower in CA2 compared with CA1.
When we compared the similarity scores across protocols and subregions we found a significant interaction, suggesting regional difference in processing these intermediate contexts (Fig. 4C). Within CA1 and CA3 the patterns were similar to what had been reported in the rat (Vazdarjanova and Guzowski, 2004), with CA1 showing a graded response to the degree of change across the protocols and CA3 showing a more abrupt change. In CA2 however, the pattern of responses we observed was distinct from both CA3 and CA1. CA2 similarity in both the intermediate conditions (AA′ and AB′) was significantly lower than observed in AA mice and indistinguishable from that observed under the AB protocol (Fig. 4C). This suggests any change in the context, even replacing the objects the mouse had been habituated to, leads to complete remapping in CA2, independently of what is observed both upstream (CA3) and downstream (CA1).
This subregion distinction could also be seen in the relationship between the similarity scores in individual mice. When we plotted the CA1 similarity scores against the CA3 similarity scores across all four protocols, the points fell close to the 45° line (Fig. 4D), suggesting a coordinated change. However, when we plotted the CA1/CA2 (Fig. 4E) and CA3/CA2 scores (Fig. 4F) the points were shifted below the line, indicating a lower similarity score in CA2 than in the other regions across the AA′ and AB′ conditions.
Discussion
Almost since its definition by Lorente de No (1934), CA2 has been largely ignored and is typically absent from the standard hippocampal circuit diagram. However, recent work which has redefined its anatomy, connectivity, and physiology suggests CA2 is not merely a transition zone between CA3 and CA1 (Sekino et al., 1997; Bartesaghi and Gessi, 2004; Lein et al., 2005; Mercer et al., 2007; Zhao et al., 2007; Chevaleyre and Siegelbaum, 2010; Simons et al., 2012; Rowland et al., 2013; Kohara et al., 2014). Here, we investigated CA2 activity in vivo by comparing and contrasting its role in context encoding with its better-understood neighbors, CA1 and CA3, via Arc/H1a catFISH. Using synaptic plasticity knock-outs in the DG or CA3, as well as behavioral protocols in wild-type mice, we showed that the CA2 response becomes uncoupled from CA1 and CA3 when the degree of contextual familiarity or novelty represented in CA3 differs from current experience. More specifically, the CA2 response may be dictated by the similarity, or the dissimilarity, between the current sensory information, presumably conveyed directly from the cortex, and the representation of previous experience arriving from CA3.
In mice placed in a highly familiar environment we assume the “sensory” information from the cortex and the “memory” information from the CA3 would largely agree, explaining why activity in CA2 of control mice paralleled that of CA1 and CA3. However, in the CA3-NR1 KOs the lower ensemble similarity observed in CA3 under the AA protocol (Fig. 3F) may result in a less reproducible, and thus more novel, input when contrasted to the invariant cue driven EC information. As a result of this conflict, CA2 remaps in the familiar context. In contrast, DG-NR1 KOs were indistinguishable from controls in the familiar box; however, when placed in the novel box the high similarity of the CA3 ensemble in these mice conflicts with the novel spatial and object information arriving from the EC, again resulting in CA2 remapping. Although low CA2 similarity in the novel box was observed in control mice as well, in the DG-NR1 KOs it occurred in the absence of remapping in CA3. In our final experiment (AA′/AB′), we demonstrated that partial changes to a familiar context could also be used to distinguish CA2 from CA1 and CA3. In the AA′ condition, in which we replaced the objects in the familiar box, the similarity scores in CA1 remained high and decreased slightly in CA3; however, CA2 completely remaps, perhaps due to conflict between the invariant CA3 projection and the projection from the lateral EC, an area sensitive to changes in object information (Hargreaves et al., 2005).
As a whole, our data support a model in which new contextual cues trigger an increase in initial exploration and an increase in the size of the CA1 ensemble, presumably due to EC-mediated inputs (Fig. 2H,K; Tables 1, 2). The exploration exhibited by the DG-NR1 KO mice in the novel box reinforces the existence of a biphasic response to being placed in a new context. Previous work established that in the absence of prior behavioral habituation, these mice do not exhibit decreased activity in a novel open field (McHugh et al., 2007). With the current protocol exploration during the first minute in Box B was identical in the DG mutants and controls; however, following this initial burst of activity the DG-NR1 KOs quickly habituate (Fig. 2H,K), as their previous experience in Box A has limited their ability to detect the novelty of the conjunction of these cues in Box B. In CA2, this EC-driven sensory information may be contrasted with memory driven information arriving from CA3 and if sufficiently different, a new ensemble is activated. This function of CA2 may rely on the integration of strong excitatory input from the EC, and possibly the DG, with powerful feedforward inhibition from CA3 (Chevaleyre and Siegelbaum, 2010) and future work will examine this. If during initial exploration a novel context is identified, it is followed by sustained exploration that supports the encoding of a new CA3 representation in an NMDA receptor dependent manner (Figs. 2H,3F). Although CA2 can detect and encode contextual change, we still do not know how this impacts the animal's behavior. Moreover, although our results suggest these processes can proceed independently they do not permit us to determine whether the CA3 response must be preceded by an intact novelty response in CA1 or how CA2 may be influencing the rest of the circuit. Interestingly however, recent anatomical data indicates CA2 has direct outputs to medial and lateral septum, the diagonal band of Broca, and supramammillary nuclei, all areas which may allow it to influence behavior and the function of other parts of the hippocampal circuit (Cui et al., 2013).
Although we have highlighted the uniqueness of CA2 in the hippocampus, in both anatomy and function it shares more than a superficial resemblance to the DG. Our data suggest that like the DG (Leutgeb et al., 2007; McHugh et al., 2007), CA2 is tuned to detect and encode changes in patterns of inputs. Further, both regions share a pronounced degree of inhibitory tone (Mercer et al., 2007) and receive extrahippocampal input from the supramammillary nucleus (Wyss et al., 1979; Ochiishi et al., 1999), a region known to be activated by novelty (Ito et al., 2009). It is tempting to speculate that CA2 and the DG may share common roles, both in controlling hippocampal excitation and separating the novel from the familiar (Schmidt et al., 2012). Given that CA2 receives direct projections from the DG (Lein et al., 2005; Kohara et al., 2014) it will be interesting in future work to examine the relationship between these two structures.
Previous work in the rat has suggested there may be a direct correlation between the place cells of the hippocampus and the Arc/H1a-positive cells observed with in situ hybridization (Guzowski et al., 2004). Although our data also reflects this relationship qualitatively, when we consider the percentage of cells labeled, as well as the number of neurons reactivated across familiar contexts, we observe much fewer in CA1 and CA3 than we would predict based on place cell recordings and previous Arc/H1a labeling (Vazdarjanova and Guzowski, 2004). Nonetheless, we found a consistent pattern, with the largest active ensemble found in CA1, and sparser coding in CA2 and CA3, which were highly similar (Tables 1, 2). Although our in situ probes were identical to those previously used, our imaging protocol was optimized to minimize background, thus resulting in a higher threshold for detection of positive nuclei and overall lower activity scores than had been previously reported. Further, mechanistically it still remains unknown exactly what patterns of neuronal activity is required to trigger Arc/H1a transcription; perhaps a threshold or specific pattern of inputs and outputs are required to initiate the genetic response. Surprisingly, we observed no impact of the loss of NRs in CA3 or DG on the percentage of cells expressing Arc and H1a INFs in CA3 or CA1. Earlier studies have reported pharmacological blockade of NRs inhibits or severely decreases Arc expression and translocation following electrical stimulation or behavioral exploration (Link et al., 1995; Lyford et al., 1995; Steward and Worley, 2001). Moreover, recent characterization of the Arc promoter suggested that expression of the locus resulting from chemically induced excitation of cultured hippocampal neurons is decreased by 80% in the presence of NR antagonist (Kawashima et al., 2009). However, it is clear that multiple signaling pathways triggered by synaptic activity can converge to facilitate Arc transcription (Ying et al., 2002; Teber et al., 2004; Waung et al., 2008; Pintchovski et al., 2009), thus in vivo the situation may be more complex. Regardless, the intact Arc expression we observed in the CA3 pyramidal cells of the CA3-NR1 KO mouse demonstrates the initial transcriptional response that gives rise to the INFs does not require NMDA receptors (Table 1). The most parsimonious explanation for our data in light of the earlier experiments is that there exist multiple NR-mediated levels of Arc expression regulation between the appearance of INFs and the detection of mRNA outside the nucleus or the presence of the fully translated Arc protein product. Further examination of these pathways may lead to interesting points of intersection between the activity and plasticity pathways.
In conclusion, it is clear that the view of the hippocampus as a serial or sequential processor, with information unidirectionally flowing around the DG-CA3-CA2-CA1 loop is not sufficient to explain a gathering amount of experimental observations. We have used genetics to effectively create loss-of-function allelic variations of the hippocampal circuit, allowing us to gain insight to the independence and interactions of the subregions during contextual learning. Further, we have tested these ideas using behavioral protocols that uncoupled CA2 from CA3 and CA1. Finally, we have used the catFISH technique to provide an initial characterization of CA2 ensemble behavior and find it may serve as the hippocampal “comparator”, playing an important role in detecting conflicts between what the hippocampus recalls and what the animal is experiencing.
Footnotes
This work was supported by the RIKEN Brain Science Institute and the RIKEN Rijicho Fund. We thank members of the Laboratory for Circuit and Behavioral Physiology, Drs Yasunori Hayashi and Shigeyoshi Itohara for discussions and suggestions on the experiments and paper, Dr Toshiaki Nakashiba for providing plasmids containing the Arc and H1a in situ probes, the Genome Exploration Research Group, Genomic Sciences Center of RIKEN, for providing the CACNG5 cDNA, Dr Magdalena Sauvage for the αNR1 FISH protocol, and Arthur Huang for subcloning the CACNG5 plasmid.
The authors declare no competing financial interests.
References
- Bartesaghi R, Gessi T. Parallel activation of field CA2 and dentate gyrus by synaptically elicited perforant path volleys. Hippocampus. 2004;14:948–963. doi: 10.1002/hipo.20011. [DOI] [PubMed] [Google Scholar]
- Benes FM, Kwok EW, Vincent SL, Todtenkopf MS. A reduction of nonpyramidal cells in sector CA2 of schizophrenics and manic depressives. Biol Psychiatry. 1998;44:88–97. doi: 10.1016/S0006-3223(98)00138-3. [DOI] [PubMed] [Google Scholar]
- Carninci P, Carninci P, Kasukawa T, Katayama S, Gough J, Frith MC, Maeda N, Oyama R, Ravasi T, Lenhard B, Wells C, Kodzius R, Shimokawa K, Bajic VB, Brenner SE, Batalov S, Forrest AR, Zavolan M, Davis MJ, Wilming LG, et al. The transcriptional landscape of the mammalian genome. Science. 2005;309:1559–1563. doi: 10.1126/science.1112014. [DOI] [PubMed] [Google Scholar]
- Chevaleyre V, Siegelbaum SA. Strong CA2 pyramidal neuron synapses define a powerful disynaptic cortico-hippocampal loop. Neuron. 2010;66:560–572. doi: 10.1016/j.neuron.2010.04.013. [DOI] [PMC free article] [PubMed] [Google Scholar]
- Clelland CD, Choi M, Romberg C, Clemenson GD, Jr, Fragniere A, Tyers P, Jessberger S, Saksida LM, Barker RA, Gage FH, Bussey TJ. A functional role for adult hippocampal neurogenesis in spatial pattern separation. Science. 2009;325:210–213. doi: 10.1126/science.1173215. [DOI] [PMC free article] [PubMed] [Google Scholar]
- Cui Z, Gerfen CR, Young WS., 3rd Hypothalamic and other connections with dorsal CA2 area of the mouse hippocampus. J Comp Neurol. 2013;521:1844–1866. doi: 10.1002/cne.23263. [DOI] [PMC free article] [PubMed] [Google Scholar]
- Fukaya M, Yamazaki M, Sakimura K, Watanabe M. Spatial diversity in gene expression for VDCCgamma subunit family in developing and adult mouse brains. Neurosci Res. 2005;53:376–383. doi: 10.1016/j.neures.2005.08.009. [DOI] [PubMed] [Google Scholar]
- Gaarskjaer FB. The organization and development of the hippocampal mossy fiber system. Brain Res. 1986;396:335–357. doi: 10.1016/0165-0173(86)90004-4. [DOI] [PubMed] [Google Scholar]
- Gold AE, Kesner RP. The role of the CA3 subregion of the dorsal hippocampus in spatial pattern completion in the rat. Hippocampus. 2005;15:808–814. doi: 10.1002/hipo.20103. [DOI] [PubMed] [Google Scholar]
- Guzowski JF, McNaughton BL, Barnes CA, Worley PF. Environment-specific expression of the immediate-early gene Arc in hippocampal neuronal ensembles. Nat Neurosci. 1999;2:1120–1124. doi: 10.1038/16046. [DOI] [PubMed] [Google Scholar]
- Guzowski JF, Knierim JJ, Moser EI. Ensemble dynamics of hippocampal regions CA3 and CA1. Neuron. 2004;44:581–584. doi: 10.1016/j.neuron.2004.11.003. [DOI] [PubMed] [Google Scholar]
- Haglund L, Swanson LW, Köhler C. The projection of the supramammillary nucleus to the hippocampal formation: an immunohistochemical and anterograde transport study with the lectin PHA-L in the rat. J Comp Neurol. 1984;229:171–185. doi: 10.1002/cne.902290204. [DOI] [PubMed] [Google Scholar]
- Hargreaves EL, Rao G, Lee I, Knierim JJ. Major dissociation between medial and lateral entorhinal input to dorsal hippocampus. Science. 2005;308:1792–1794. doi: 10.1126/science.1110449. [DOI] [PubMed] [Google Scholar]
- Ishizuka N, Weber J, Amaral DG. Organization of intrahippocampal projections originating from CA3 pyramidal cells in the rat. J Comp Neurol. 1990;295:580–623. doi: 10.1002/cne.902950407. [DOI] [PubMed] [Google Scholar]
- Ito M, Shirao T, Doya K, Sekino Y. Three-dimensional distribution of Fos-positive neurons in the supramammillary nucleus of the rat exposed to novel environment. Neurosci Res. 2009;64:397–402. doi: 10.1016/j.neures.2009.04.013. [DOI] [PubMed] [Google Scholar]
- Jones MW, McHugh TJ. Updating hippocampal representations: CA2 joins the circuit. Trends Neurosci. 2011;34:526–535. doi: 10.1016/j.tins.2011.07.007. [DOI] [PubMed] [Google Scholar]
- Karlsson MP, Frank LM. Network dynamics underlying the formation of sparse, informative representations in the hippocampus. J Neurosci. 2008;28:14271–14281. doi: 10.1523/JNEUROSCI.4261-08.2008. [DOI] [PMC free article] [PubMed] [Google Scholar]
- Kawashima T, Okuno H, Nonaka M, Adachi-Morishima A, Kyo N, Okamura M, Takemoto-Kimura S, Worley PF, Bito H. Synaptic activity-responsive element in the Arc/Arg3.1 promoter essential for synapse-to-nucleus signaling in activated neurons. Proc Natl Acad Sci U S A. 2009;106:316–321. doi: 10.1073/pnas.0806518106. [DOI] [PMC free article] [PubMed] [Google Scholar]
- Kohara K, Pignatelli M, Rivest AJ, Jung HY, Kitamure T, Suh J, Frank D, Kajikawa K, Mise N, Obata Y, Wickersham IR, Tonegawa S. Cell type-specific genetic and optogenetic tools reveal hippocampal CA2 circuits. Nat Neurosci. 2014;17:269–279. doi: 10.1038/nn.3614. [DOI] [PMC free article] [PubMed] [Google Scholar]
- Lein ES, Callaway EM, Albright TD, Gage FH. Redefining the boundaries of the hippocampal CA2 subfield in the mouse using gene expression and 3-dimensional reconstruction. J Comp Neurol. 2005;485:1–10. doi: 10.1002/cne.20426. [DOI] [PubMed] [Google Scholar]
- Leutgeb JK, Leutgeb S, Moser MB, Moser EI. Pattern separation in the dentate gyrus and CA3 of the hippocampus. Science. 2007;315:961–966. doi: 10.1126/science.1135801. [DOI] [PubMed] [Google Scholar]
- Link W, Konietzko U, Kauselmann G, Krug M, Schwanke B, Frey U, Kuhl D. Somatodendritic expression of an immediate early gene is regulated by synaptic activity. Proc Natl Acad Sci U S A. 1995;92:5734–5738. doi: 10.1073/pnas.92.12.5734. [DOI] [PMC free article] [PubMed] [Google Scholar]
- Lorente de No R. Studies on the structure of the cerebral cortex. J Psychol Neurol. 1934:113–177. [Google Scholar]
- Lyford GL, Yamagata K, Kaufmann WE, Barnes CA, Sanders LK, Copeland NG, Gilbert DJ, Jenkins NA, Lanahan AA, Worley PF. Arc, a growth factor and activity-regulated gene, encodes a novel cytoskeleton-associated protein that is enriched in neuronal dendrites. Neuron. 1995;14:433–445. doi: 10.1016/0896-6273(95)90299-6. [DOI] [PubMed] [Google Scholar]
- McHugh TJ, Tonegawa S. CA3 NMDA receptors are required for the rapid formation of a salient contextual representation. Hippocampus. 2009;19:1153–1158. doi: 10.1002/hipo.20684. [DOI] [PMC free article] [PubMed] [Google Scholar]
- McHugh TJ, Jones MW, Quinn JJ, Balthasar N, Coppari R, Elmquist JK, Lowell BB, Fanselow MS, Wilson MA, Tonegawa S. Dentate gyrus NMDA receptors mediate rapid pattern separation in the hippocampal network. Science. 2007;317:94–99. doi: 10.1126/science.1140263. [DOI] [PubMed] [Google Scholar]
- McNaughton BL, Nadel L. Hebb-Marr networks and the neurobiological representation of action in space. In: Rumelhart DE, editor. Neuroscience and connectionist theory. Hillsdale, NJ: Erlbaum; 1990. pp. 1–63. [Google Scholar]
- Mercer A, Trigg HL, Thomson AM. Characterization of neurons in the CA2 subfield of the adult rat hippocampus. J Neurosci. 2007;27:7329–7338. doi: 10.1523/JNEUROSCI.1829-07.2007. [DOI] [PMC free article] [PubMed] [Google Scholar]
- Muller RU, Kubie JL. The effects of changes in the environment on the spatial firing of hippocampal complex-spike cells. J Neurosci. 1987;7:1951–1968. doi: 10.1523/JNEUROSCI.07-07-01951.1987. [DOI] [PMC free article] [PubMed] [Google Scholar]
- Nakashiba T, Cushman JD, Pelkey KA, Renaudineau S, Buhl DL, McHugh TJ, Rodriguez Barrera V, Chittajallu R, Iwamoto KS, McBain CJ, Fanselow MS, Tonegawa S. Young dentate granule cells mediate pattern separation, whereas old granule cells facilitate pattern completion. Cell. 2012;149:188–201. doi: 10.1016/j.cell.2012.01.046. [DOI] [PMC free article] [PubMed] [Google Scholar]
- Nakazawa K, Quirk MC, Chitwood RA, Watanabe M, Yeckel MF, Sun LD, Kato A, Carr CA, Johnston D, Wilson MA, Tonegawa S. Requirement for hippocampal CA3 NMDA receptors in associative memory recall. Science. 2002;297:211–218. doi: 10.1126/science.1071795. [DOI] [PMC free article] [PubMed] [Google Scholar]
- Ochiishi T, Saitoh Y, Yukawa A, Saji M, Ren Y, Shirao T, Miyamoto H, Nakata H, Sekino Y. High level of adenosine A1 receptor-like immunoreactivity in the CA2/CA3a region of the adult rat hippocampus. Neuroscience. 1999;93:955–967. doi: 10.1016/S0306-4522(99)00179-7. [DOI] [PubMed] [Google Scholar]
- O'Keefe J, Dostrovsky J. The hippocampus as a spatial map: preliminary evidence from unit activity in the freely-moving rat. Brain Res. 1971;34:171–175. doi: 10.1016/0006-8993(71)90358-1. [DOI] [PubMed] [Google Scholar]
- O'Reilly RC, McClelland JL. Hippocampal conjunctive encoding, storage, and recall: avoiding a trade-off. Hippocampus. 1994;4:661–682. doi: 10.1002/hipo.450040605. [DOI] [PubMed] [Google Scholar]
- Pintchovski SA, Peebles CL, Kim HJ, Verdin E, Finkbeiner S. The serum response factor and a putative novel transcription factor regulate expression of the immediate-early gene Arc/Arg3.1 in neurons. J Neurosci. 2009;29:1525–1537. doi: 10.1523/JNEUROSCI.5575-08.2009. [DOI] [PMC free article] [PubMed] [Google Scholar]
- Rolls ET, Kesner RP. A computational theory of hippocampal function, and empirical tests of the theory. Prog Neurobiol. 2006;79:1–48. doi: 10.1016/j.pneurobio.2006.04.005. [DOI] [PubMed] [Google Scholar]
- Rowland DC, Weible AP, Wickersham IR, Wu H, Mayford M, Witter MP, Kentros CG. Transgenically targeted rabies virus demonstrates a major monosynaptic projection from hippocampal area CA2 to medial entorhinal layer II neurons. J Neurosci. 2013;33:14889–14898. doi: 10.1523/JNEUROSCI.1046-13.2013. [DOI] [PMC free article] [PubMed] [Google Scholar]
- Schmidt B, Marrone DF, Markus EJ. Disambiguating the similar: the dentate gyrus and pattern separation. Behav Brain Res. 2012;226:56–65. doi: 10.1016/j.bbr.2011.08.039. [DOI] [PubMed] [Google Scholar]
- Sekino Y, Obata K, Tanifuji M, Mizuno M, Murayama J. Delayed signal propagation via CA2 in rat hippocampal slices revealed by optical recording. J Neurophysiol. 1997;78:1662–1668. doi: 10.1152/jn.1997.78.3.1662. [DOI] [PubMed] [Google Scholar]
- Shinohara Y, Hosoya A, Yahagi K, Ferecskó AS, Yaguchi K, Sík A, Itakura M, Takahashi M, Hirase H. Hippocampal CA3 and CA2 have distinct bilateral innervation patterns to CA1 in rodents. Eur J Neurosci. 2012;35:702–710. doi: 10.1111/j.1460-9568.2012.07993.x. [DOI] [PubMed] [Google Scholar]
- Simons SB, Caruana DA, Zhao M, Dudek SM. Caffeine-induced synaptic potentiation in hippocampal CA2 neurons. Nat Neurosci. 2012;15:23–25. doi: 10.1038/nn.2962. [DOI] [PMC free article] [PubMed] [Google Scholar]
- Steward O, Worley PF. Selective targeting of newly synthesized Arc mRNA to active synapses requires NMDA receptor activation. Neuron. 2001;30:227–240. doi: 10.1016/S0896-6273(01)00275-6. [DOI] [PubMed] [Google Scholar]
- Teber I, Köhling R, Speckmann EJ, Barnekow A, Kremerskothen J. Muscarinic acetylcholine receptor stimulation induces expression of the activity-regulated cytoskeleton-associated gene (ARC) Brain Res Mol Brain Res. 2004;121:131–136. doi: 10.1016/j.molbrainres.2003.11.017. [DOI] [PubMed] [Google Scholar]
- Vazdarjanova A, Guzowski JF. Differences in hippocampal neuronal population responses to modifications of an environmental context: evidence for distinct, yet complementary, functions of CA3 and CA1 ensembles. J Neurosci. 2004;24:6489–6496. doi: 10.1523/JNEUROSCI.0350-04.2004. [DOI] [PMC free article] [PubMed] [Google Scholar]
- Vazdarjanova A, McNaughton BL, Barnes CA, Worley PF, Guzowski JF. Experience-dependent coincident expression of the effector immediate-early genes Arc and Homer 1a in hippocampal and neocortical neuronal networks. J Neurosci. 2002;22:10067–10071. doi: 10.1523/JNEUROSCI.22-23-10067.2002. [DOI] [PMC free article] [PubMed] [Google Scholar]
- Waung MW, Pfeiffer BE, Nosyreva ED, Ronesi JA, Huber KM. Rapid translation of Arc/Arg3.1 selectively mediates mGluR-dependent LTD through persistent increases in AMPAR endocytosis rate. Neuron. 2008;59:84–97. doi: 10.1016/j.neuron.2008.05.014. [DOI] [PMC free article] [PubMed] [Google Scholar]
- Wyss JM, Swanson LW, Cowan WM. Evidence for an input to the molecular layer and the stratum granulosum of the dentate gyrus from the supramammillary region of the hypothalamus. Anat Embryol (Berl) 1979;156:165–176. doi: 10.1007/BF00300012. [DOI] [PubMed] [Google Scholar]
- Ying SW, Futter M, Rosenblum K, Webber MJ, Hunt SP, Bliss TV, Bramham CR. Brain-derived neurotrophic factor induces long-term potentiation in intact adult hippocampus: requirement for ERK activation coupled to CREB and upregulation of Arc synthesis. J Neurosci. 2002;22:1532–1540. doi: 10.1523/JNEUROSCI.22-05-01532.2002. [DOI] [PMC free article] [PubMed] [Google Scholar]
- Zhao M, Choi YS, Obrietan K, Dudek SM. Synaptic plasticity (and the lack thereof) in hippocampal CA2 neurons. J Neurosci. 2007;27:12025–12032. doi: 10.1523/JNEUROSCI.4094-07.2007. [DOI] [PMC free article] [PubMed] [Google Scholar]
- Ziv Y, Burns LD, Cocker ED, Hamel EO, Ghosh KK, Kitch LJ, El Gamal A, Schnitzer MJ. Long-term dynamics of CA1 hippocampal place codes. Nat Neurosci. 2013;16:264–266. doi: 10.1038/nn.3329. [DOI] [PMC free article] [PubMed] [Google Scholar]