

Abstract
It is often argued that climbing neural activity, as for example reflected by the contingent negative variation (CNV) in the electroencephalogram, is the signature of the subjective experience of time. According to this view, the resolution of the CNV coincides with termination of subjective timing processes. Paradoxically, behavioral data indicate that participants keep track of timing even after the standard interval (SI) has passed. This study addresses whether timing continues after CNV resolution. In Experiment 1, human participants were asked to discriminate time intervals while evoked potentials (EPs) elicited by the sound terminating a comparison interval (CI) were measured. As the amplitude of N1P2 components increases as a function of the temporal distance from the SI, and the latency of the P2 component followed the hazard rate of the CIs, timing processes continue after CNV resolution. Based on a novel experimental paradigm, statistical model comparisons and trial-by-trial analyses, Experiment 2 supports this finding as subjective time is more accurately indexed by the amplitude of early EPs than by CNV amplitude. These results provide the first direct evidence that subjective timing of multisecond intervals does not depend on climbing neural activity as indexed by the CNV and that the subjective experience of time is better reflected by distinct features of post-CI evoked potentials.
Keywords: climbing neural activity, contingent negative variation, interval timing, temporal accumulation
Introduction
A prominent notion in many time perception theories is that climbing neural activity (CNA; Durstewitz, 2003; Reutimann et al., 2004; for review, see Merchant et al., 2013a; Wittmann, 2013) is the primary neural representation of subjective time, with, as a potential instantiation, the contingent negative variation (CNV), a slow cortical potential of developing negative polarity at frontocentral scalp locations. Based on correlations between temporal performance and ramping activity, it has indeed been argued that temporal integration is indexed by the CNV (Walter et al., 1964; Macar and Vidal, 2003; but see van Rijn et al., 2011; Wiener et al., 2012). For example, when participants in temporal generalization studies judge the duration of a comparison interval (CI), which can be shorter (CIS) or longer (CIL) than a previously learned standard interval (SI), a CNV is observed from the onset of the CI, but this CNA deflects at the offset of the memorized SI during CIL trials (Pfeuty et al., 2005). As no external stimulus is associated with the deflection, the CNV is suggested to reflect the neural representation of physical time. However, based on the CNA hypothesis and the claim that the CNV is the neural representation of subjective time, no signatures of temporal sensitivity should be observed after the CNV starts to deflect. Thus, event-related potentials (ERPs) triggered by the CIL offset should not be a function of the temporal distance between SI and CI. In contrast to this view, behavioral data from temporal generalization studies show that CIL accuracy increases with increased distance to the SI (Wearden, 1992; Ulrich et al., 2006), suggesting that timing processes continue after the CNV has resolved.
Interestingly, existing work suggests a link between the ERPs associated with the offset of a CI and interval timing, as mismatch negativity (MMN; Näätänen and Winkler, 1999) observed in temporal oddball experiments is a function of the temporal distance to the SI for short durations (Loveless, 1986; Brannon et al., 2008).
We contrasted the hypothesis that the end of CNA signals the end of temporal processing to the hypothesis that interval timing does not depend on CNA reflected in the CNV by comparing CI-evoked ERPs. Following the CNA-based hypothesis, the ERPs to the offset of CIL trials should not be sensitive to the distance to the SI. However, two alternative hypotheses can be extrapolated from the MMN studies. If the MMN effect is a function of the distance to the SI, CI-evoked ERP amplitudes should reflect the distance to the SI. If, however, the MMN effect is driven by aging-based expectancy (Nobre et al., 2007), the ERPs should decrease with CI duration, as the expectancy of encountering the offset of that trial increases with time (Lange, 2009). Figure 1 depicts these alternative hypotheses.
Figure 1.

Graphical summary of hypotheses for Experiment 1. The line left of center indicates that all theories predict an increase in EP amplitudes for CIS further from the SI. Predictions for the CIL trials differ. The comparison-based hypothesis, supported by temporal oddball studies (Brannon et al., 2008), predicts an increase of offset-triggered EP amplitudes as a function of distance to the SI for the CIL trials. Conversely, the aging-based expectancy hypothesis predicts that EP amplitudes continue to decrease for CIL trials as a function of hazard rate (Niemi and Näätänen, 1981; Nobre et al., 2007; Coull, 2009). Both of these hypotheses suggest that timing continues after the SI duration has passed. The horizontal line depicts the CNA hypothesis. It predicts no differences in CIL-triggered amplitudes, as the CNA assumes that neural integration takes place until a particular threshold is reached (Durstewitz, 2003; Reutimann et al., 2004; Simen et al., 2011) and a decision is made. Because a single decision suffices, the CNA hypothesis would predict that no differences are observed for the different CI intervals.
A second test is presented in Experiment 2. If CNA reflects subjective time, CNV amplitudes should predict behavioral responses. Alternatively, if the ERPs to the CIs are driven by temporal information, the ERP amplitudes might outperform the CNV in predicting subjective time-based responses.
Materials and Methods
Experiment 1
Participants.
Twenty first-year psychology students with no self-reported hearing loss took part in the experiment and received partial course credit. Informed consent as approved by the Ethical Committee Psychology of the University of Groningen (identification number 11121-E) was obtained before testing. The data of three participants were not included in the analyses because of excessive artifacts in >20% of the trials. The final sample comprised data of 17 participants (all right handed, 6 males) between 19 and 27 years of age (mean age, 23 years). All cells of the design contained at least 25 observations.
Stimuli and procedures.
A training block familiarized participants with the standard interval of 2.2 s. It started with five presentations of the standard interval by means of two tone bursts (50 ms, 500 Hz, ∼75 dB) 2.2 s apart. Tones were presented at comfortable sound levels using a Tivoli Audio Model Two system, with speakers located at both sides of the computer monitor. After these initial presentations, participants were asked to reproduce the standard interval. During the reproduction trials, the onset of the interval was indicated by a tone and participants were asked to press the spacebar (which also triggered the offset tone) when they thought the standard interval had passed, after which feedback was provided (Kononowicz and van Rijn, 2011). This training block continued until the participant reproduced three intervals between 1.98 and 2.42 s (i.e., 2.2 ± 10%) in a row.
Figure 2 depicts the time course of the experimental trials that followed the training block. Each experimental trial started with the presentation of the 2.2 s SI. After an interstimulus interval, sampled from a uniform distribution from 1 to 2.5 s, the CI was presented, again demarcated by two tone bursts. Six different comparison intervals were used, each 10% shorter or 10% longer than the closest neighbor. To reduce noise associated with response preparation, participants could only respond after a jittered interval, sampled from a uniform distribution from 3 to 5 s. Participants were instructed to press the “x” key if they perceived the CI as shorter than the SI, and the “m” key if the CI was perceived as longer. No feedback was provided. A gray “+” was used as the default fixation point, replaced by a gray “!” and “x” during the presentation of the SI and CI, respectively, and by a green “+” during the response period.
Figure 2.

Time course of the experimental trials in the temporal comparison task. Both ISI and response delay are sampled from a uniform distribution.
Trials were presented in randomized order in eight blocks of 24 trials, with each block containing four repetitions of each CI. Participants received feedback after each block, indicating the number of accurate trails in that block. A short pause (participant paced, 1 min minimum) was provided between blocks.
EEG acquisition and analysis methods.
Electrical brain activity was measured from 30 scalp locations (Electro-Cap International, tin electrodes: AF3, AFz, AF4, F3, Fz, F4, FC3, FC1, FCz, FC2, FC4, C3, C1, Cz, C2, C4, CP3, CPz, CP4, P3, P1, Pz, P2, P4, PO3, POz, PO4, O1, Oz, and O2). To increase the signal-to-noise ratio, all CNV-related analyses are based on a frontocentral electrode cluster consisting of FC1, FCz, FC2, C1, Cz, and C2 (Ng et al., 2011). All auditory evoked potential (EP) analyses focused on FCz, because this electrode showed the strongest signal in Laplacian topographic plots. Vertical and horizontal EOG activity and both mastoids were registered. For all channels, impedances were kept below 5 kΩ. All channels were amplified and filtered with a digital finite impulse response filter with a cutoff frequency of 135 Hz (low pass) using the Refa system (TMS International B.V.) and were recorded with a sampling rate of 500 Hz using Portilab (TMS International B.V.).
The data were analyzed using FieldTrip (Oostenveld et al., 2011). Off-line, the signal was referenced to the mastoids, a 50 Hz notch filter was applied, and data were filtered with a Butterworth filter with a bandpass of 0.01–100 Hz. Trials containing excessive ocular artifacts, movement artifacts, or amplifier saturation were excluded from further processing by visual inspection. Eye blinks, heart beat, and muscle artifacts were corrected using independent component analysis (Bell and Sejnowski, 1995).
The main focus of Experiment 1 will be the auditory evoked potentials for the offset tone bursts of the comparison intervals. As we did not present a CI equal to the SI, no standard MMN could be assessed. In line with previous work (van Wassenhove et al., 2005; Ng et al., 2011), we focused on the N1P2 component, defined as the summed absolute amplitude of the N1 and P2 peaks. The N1 peak was defined as the minimum value between 70 and 160 ms after the tone burst, and the P2 peak was defined as the maximum value between 140 and 300 ms; both ranges were based on visual inspection of the averaged waveforms.
To filter out CNV-based contamination, a 1–20 Hz Butterworth bandpass, zero phase-shift filter was applied. As high-pass filtering at 1 Hz may cause distortions (Acunzo et al., 2012), we also performed all analyses on 0.01 Hz filtered and unfiltered data. As the results were not affected qualitatively, we will focus on the 1 Hz high-pass-filtered data as the same filter settings were used by Brannon et al. (2008). After filtering, a Laplacian transformation (local estimate method; Huiskamp, 1991; Oostendorp and van Oosterom, 1996) was applied to improve the spatial resolution (Nunez and Westdorp, 1994). All trials were baselined to the average voltage calculated over the 50 ms preceding and following the onset of the second tone of CI to minimize misalignment of the waveforms due to the CNV activity (Correa and Nobre, 2008).
Experiment 2
Participants.
Twenty-five first-year psychology students, with no self-reported hearing loss, took part in the study in exchange for partial course credit. Informed consent was obtained as for Experiment 1 (identification number 11191-NE), and data of two participants were excluded following the rejection criteria of Experiment 1. The final sample comprised data of 23 participants (all right handed, 6 males) between 19 and 29 years of age (mean age, 23 years).
Stimuli and procedures.
A setup similar to that for Experiment 1 was used (Fig. 1), but with four CI intervals. The S1/L1 durations remained unchanged, but the S2 and L2 intervals were set to the average of the S2/S3 and L2/L3 intervals, respectively, resulting in CIs of 1691, 1980, 2420, and 2795 ms. The training block was identical to that in Experiment 1, followed by two blocks of 24 experimental trials from Experiment 1 to familiarize the participants with the general setup of temporal generalization studies. After these two blocks, the main experimental phase started.
In this phase, participants were asked to indicate which CI they perceived. Hereto, four gray dots were displayed on the screen after the offset of the CI (instead of the green “+” of Experiment 1). The first decision was identical to Experiment 1, as participants had to indicate whether the perceived duration was shorter or longer than the SI by pressing the “x” or “m” key. Based on this response, either the left-most or right-most two dots turned green, and participants were asked to indicate whether the left or right green dot corresponded to their perception by pressing the “x” or “m” key. No feedback was provided on these trials.
To obtain a sufficient number of correct and incorrect classified trials, the number of trials per condition was increased to 56 trials, for a total of 224 trials.
EEG acquisition and analysis methods.
The following set of electrodes was recorded: Fp1, Fp2, AFz, F3, Fz, F4, C3, Cz, C4, P3, Pz, P4, FC1, FCz, FC2, FC5, FC6, CP5, CP1, CPz, CP2, and CP6. All CNV-related analyses are based on a frontocentral electrode cluster (Cz, FC1, FCz, FC2) similar to that used in Experiment 1. The auditory evoked potential analyses focused on both FCz, because this electrode showed the strongest signal in Laplacian topographic plots. In addition to these changes, other elements of the experimental design and EEG recordings were left unchanged.
Results
Experiment 1
Participants correctly categorized 91% of all trials, ranging from 97% for the most extreme durations (S3, L3) to 82% for the conditions most similar to the standard duration (S1, L1). Using a logistic psychometric function, fitted to the proportion of “long” responses (Wichmann and Hill, 2001; Prins and Kingdom, 2009), the point of subjective equality was estimated at 2236 ms (Fig. 3).
Figure 3.

Proportion of long responses per CI length (circles) with a fitted logistic psychometric function (Wichmann and Hill, 2001; Prins and Kingdom, 2009), which is shown in blue. See Figure 2 for the durations of the CIs.
As expected, a CNV was observed during the presentation of the CIs (Pouthas et al., 2000; Macar and Vidal, 2003; Pfeuty et al., 2003). Interestingly, the right panel of Figure 4 shows that the CNV deflects before the SI. To assess the deflection point, we used the method described by Pfeuty et al. (2003) in which the average CNV amplitude for successive time windows of 100 ms from 1000 to 2500 ms after sound onset is calculated. The center of the window with the highest average amplitude determines peak latency. This CNV peak latency was different from 2200 ms for all three long CIs (L1: 1806 ms, t(16) = 4.06, p < 0.01; L2: 1700 ms, t(16) = 4.5, p < 0.01; L3: 1871 ms, t(16) = 3.3, p < 0.01). As expected, because the three long CIs are identical before the SI, a one-way repeated-measures ANOVA did not show significant differences among these three conditions (F < 1). Given the difference between the CNV peak latency and SI, these results indicate that the deflection of the CNV aligns with the time at which a binary decision regarding the categorization of the CI interval can be made, instead of anchored to the memorized SI, as was suggested in previous work (Macar and Vidal, 2003; Pfeuty et al., 2005). Note, however, that in previous work the decision could not be made before the SI because a CI equal to the SI was presented. Therefore, a binary shorter/longer decision cannot be made until around the time of the SI.
Figure 4.

The CNV time course obtained at the frontocentral electrode cluster during presentation of CIs in Experiment 1, plotted separately for CIs shorter and longer than the SI. The vertical dotted line, marked SI, indicates the duration of the SI interval.
The analyses of the auditory evoked potentials focus on FCz because Laplacian-based topography plots show the strongest signal coming from this location (Fig. 5B). The main findings of Experiment 1 are depicted in Figure 5. The top panels of Figure 5 show a clear N1P2 complex, evoked by the sound demarcating the end of the CI. A two-way repeated-measures ANOVA with category (short vs long) and distance (1–3) as factors showed that the N1P2 amplitude increases as a function of the distance between SI and CI (F(2,32) = 5.70, p = 0.008, η2 = 0.26), with no significant effects for the main effect of category (F(2,32) = 1.65, p > 0.1), or for the interaction (F < 1). Planned post hoc comparisons showed clear N1P2 amplitude modulations for the CIs furthest from the SI when compared with CIs closest to the SI (t(16) = 2.86, p = 0.01). Post hoc comparisons between the middle S2/L2 and the extreme CIs did not reached significance (S2/L2 vs S1/L1: t(16) = 1.80, p = 0.09; S2/L2 vs S3/L3: t(16) = 1.98, p = 0.06), although numerically the effects followed the predicted V-shaped pattern. Similarly, the 0.01 Hz filtered data showed the main effect of distance (F(2,32) = 6.96, p = 0.003, η2 = 0.30) and no effect of category (F(2,32) = 1.91, p > 0.1), nor the interaction between factors (F(2,32) = 2.62, p > 0.05).
Figure 5.
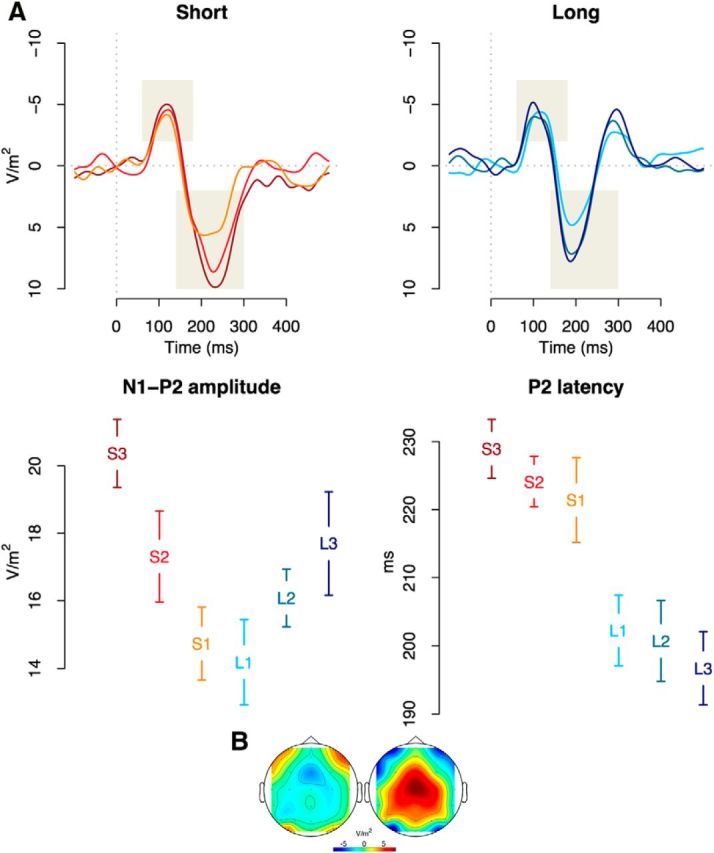
EPs triggered by the offset of CI interval. A, The top panels illustrate the post-CI auditory evoked potentials for CIs shorter and longer than the SI, recorded at FCz. Shaded areas represents measurement areas for amplitude and latency of N1 and P2 components. The bottom left panel depicts the amplitude of the N1P2 complex, which increases as a function of distance to the SI. The bottom right panel illustrates the latency decrease of the P2 component as a function of CI length. B, Topographies of N1 (80–120 ms) and P2 (180–240 ms) peaks, collapsed over all participants and conditions.
As the observed amplitudes are sensitive to the passing of time even after the deflection of the CNV, these results are at odds with the prediction that the resolution of CNA signals the end of temporal processing. At the same time, the observed nonlinearity argues against an aging-based expectancy effect. Instead, the N1P2 amplitude best matches the pattern predicted by the comparison account (Fig. 1; Loveless, 1986; Brannon et al., 2008), implying that timing processes continue after the SI has been reached and the CNV has deflected.
Although the V-shaped pattern of N1P2 amplitude argues against the aging-based expectancy effect, it is possible that this mounting temporal expectancy (Niemi and Näätänen, 1981; Nobre et al., 2007; Coull, 2009), as the probability of the second tone steadily increases, can be reflected in other features of ERPs (this possible dissociation between latency and amplitude has been proposed earlier; McDonald et al., 2005; Vibell et al., 2007; but see Seibold et al., 2011). We have therefore also assessed the latency of the auditory evoked potentials evoked by the offset of CIs. As can be seen in the lower-right panel of Figure 5, the latency of the P2 component presents a slightly different picture, with shorter latencies for CIs associated with higher aging-based expectancy (F(5,80) = 6.40, p < 10−4, η2 = 0.29; no effect was observed for N1, F < 1). This latency effect follows the patterns predicted by the expectancy account, but in terms of latency instead of amplitude, and is in line with the observation that more attended or expected stimuli are associated with shortened perceptual processes (Spence and Parise, 2010).
As visual inspection of Figure 5 suggests amplitude differences for the N2 component analogous to the N1P2 effect, especially for the CIL trials, we also tested for the N2 effect in the same way as the N1P2 amplitude. With N2 peak defined as the minimum value between 270 and 350 ms, only a main effect of category reached significance (F(1,16) = 10.23, p = 0.005, η2 = 0.39) with neither the main effect of distance nor the interaction reaching significance (F < 1, F = 1.40 respectively). Because this effect was not the focus of the current study, we refrain from further interpretation.
Together, the systematic effects on N1P2 amplitude and P2 latency both before and after the SI suggest that timing processes influence features of these EPs. Where the P2 latency effect might be related to the attentional enhancement based on the hazard rate of elapsed time, the origin of the N1P2 effect is more opaque. That is, although participants in Experiment 1 were asked to assess the duration of the perceived intervals, participants in a study by Brannon et al. (2008) showed very similar effects when auditory durations were presented while attention was focused on another task (adult: visual detection task; infants: watching a silent puppet show). Therefore, the effects observed in both the study by Brannon et al. (2008) and our study might simply be caused by a low-level physiological effect based on the objective differences in duration, which might not be accessible for further cognitive processing. To assess whether the observed N1P2 modulation is driven by top-down processes related to the subjective experience of time, Experiment 2 was conducted.
Experiment 2
ANOVA-based analyses
To assess whether the N1P2 amplitude reflects the subjective experience of time, the N1P2 and CNV amplitudes for correct trials have to be compared with those of incorrect trials: if the N1P2 effect is driven by objective duration, correctness should have no influence on the observed amplitude. On the other hand, if the N1P2 effect is driven by subjective duration, the amplitude for an incorrect trial should resemble the N1P2 amplitudes associated with the CI for which the current trail was mistaken. Similarly, based on the assumption that CNV-based CNA reflects the subjective experience of time, one has to predict that the CNV amplitude for an incorrect trial should resemble the amplitude associated with the subjective percept. To test these hypotheses, the design of Experiment 1 was changed so that after making a longer/shorter decision, participants were subsequently asked to indicate which of the shorter or longer CIs they perceived.
As in Experiment 1, the CNV (Fig. 6) peaked before the SI for the CIL trials (L1 = 1800 vs L2 = 1765 ms; not different from each other, t < 1; but shorter than SI: t(22) = 3.7, p < 0.01; t(22) = 5.6, p < 0.01). Based on the assumption that the deflection of the CNV might reflect the internal decision to answer “long,” it could be that participants initiate a second decision process to support the decision whether the current duration is the shorter or the longer of the two long CIs. As this process would result in a new duration estimation process, and thus a new boost of CNA, EPs to the long CIs are potentially contaminated. All subsequent analyses therefore focus on the S1/S2 judgments.
Figure 6.

The CNV time course obtained at the frontocentral electrode cluster during presentation of CIs in Experiment 2, plotted separately for CIs shorter and longer than the SI. The vertical dotted line, marked SI, indicates the duration of the SI interval.
Figure 7 depicts the potentials evoked by the onset of the tone demarcating the end of the S1 or S2 durations. Visual inspection of the left panel of Figure 7, showing all trials with correct responses, shows that the S2 trials are associated with higher amplitudes than the S1 trials, matching the amplitude effects found in Experiment 1. More importantly, the right panel of Figure 7 shows that the incorrect S2 trials—when the participants answered S1—are associated with the lower amplitude, similar to the correct S1 trials. A two-way repeated-measures ANOVA with correctness, distance, and electrode as factors supports this crossover interaction between distance and correctness (F(1,22) = 16.60, p = 0.001, η2 = 0.43). This interaction suggests that the N1P2 amplitudes correspond to the subjective experience of time as S2 trials that are erroneously categorized as “S1 trials” are associated with an amplitude that is similar to the amplitude associated with correct S1 trials (and vice versa for the incorrect S1 trials). The main effect of correctness reached trend level (F(1,22) = 4.04, p = 0.051, η2 = 0.16), and none of the other factors reached significance (all F values <1).
Figure 7.

The post-CI EPs for CIS trials, measured at the FCz electrode and plotted separately for the presentation of S1 and S2 durations. The left panel depicts the EPs in correctly classified trials (i.e., indicated S1 for an S1 trial, or S2 for an S2 trial); the right panel depicts the EPs for incorrectly classified trials (i.e., indicated S2 for an S1 trial or vice versa). Shaded areas represent measurement areas for amplitude and latency of N1 and P2 peaks.
Single-trial linear mixed-model regression analyses
However, due to the pseudo-experimental manipulation of correct and incorrect trials (see also Kononowicz and van Rijn, 2011), the number of observations per cell is variable. To correct for this potential bias, we also report analyses based on linear mixed-effects models (Bagiella et al., 2000; Pinheiro and Bates, 2000; Gelman and Hill, 2007; Baayen et al., 2008) that account for unequal cell counts. As linear mixed-effects models rely on single items instead of cell averages, the variables submitted to analysis were scored on single trials using the same ranges as those in previous analysis.
The linear mixed-effects model confirms the ANOVA analysis. First, we assessed the importance of interaction between distance and correctness by means of formal model comparison. Both models included a random effect intercept per participant, random slopes for distance per participant, and N1P2 amplitude as a dependent variable. We constructed two linear mixed-effects models, one including the interaction term between distance and correctness, and the other one without such interaction term. Comparison of these models, by means of Akaike Information Criterion (AIC) as well as log-likelihood-based χ2 statistics, showed that the model containing the interaction outperforms the model without the interaction term (ΔAIC = 8; χ(i)2 = 9.58, p < 0.002). The effects of the intercept (β = 30.47, p < 10−4), the distance (β = 3.79, p < 10−4), and the correctness (β = 2.76, p = 0.002) were significant. The interaction effect of distance and correctness was also significant (β = −4.68, p < 10−4), confirming that subjective similarity affects the amplitude of the N1P2 component. These results indicate that the amplitude difference between S1 and S2 trials is 3.79 V/m2, but that this effect is negated when an S2 trial is answered incorrectly (as 4.68 needs to be subtracted for those trials).
According to the view that the CNV reflects CNA, the subjective experience of time is a function of the CNV amplitude. Therefore, a main effect of duration should be observed as well as a crossover interaction between duration and correctness, as was found for the N1P2 amplitudes. Both ANOVA and linear mixed-effects analysis were performed, but no effects reached significance in the ANOVA. Similar results were observed for the linear mixed-effect analyses, as apart from the negative intercept that reflects the typical CNV negativity (β = −5.00, p < 10−4), none of the other factors or interactions reached the significance level (p > 0.1). This matches earlier results reported by Kononowicz and van Rijn (2011), and contradicts the notion that CNA, as reflected by the CNV, represents subjective time.
To further test the relative contribution of N1P2 and CNV amplitude in predicting the behavioral responses, we compared mixed-effect logistic regression models. All models included a random effect intercept per participant and random slopes for distance per participant. We constructed three linear mixed-effects models, including either N1P2, CNV, or both components as predictors, and correctness as a dependent variable. Comparisons of these models, by means of the AIC as well as log-likelihood-based χ2 statistics, showed that the N1P2 model outperforms the CNV model (ΔAIC = 5.4; χ(0)2 = 5.42, p < 0.001), the combined N1P2/CNV model outperforms the CNV model (ΔAIC = 3.8; χ(2)2 = 7.82, p = 0.02), and the additional model complexity of the N1P2/CNV model over the N1P2 model is not warranted (ΔAIC = 1.6; χ(2)2 = 2.41, p > 0.1). All these model comparisons indicate that the fluctuations in CNV amplitude are worse predictors of the behavioral response than the N1P2 amplitudes. The estimated log-odds parameters of the N1P2 model showed significant effects of the distance (β = 1.92, p < 0.001) and N1P2 amplitude (β = 0.01, p = 0.019), and the interaction between distance and N1P2 amplitude (β = −0.02, p < 0.01). Figure 8 depicts the estimated effects for the N1P2 and lack of an effect for the CNV amplitude. The increase in N1P2 amplitude leads to an increase of the odds ratio for a correct response in the case of the S2 condition, and a decrease in the S1 condition.
Figure 8.

The results of logistic linear mixed-effects model fitted to the N1P2 and CNV data. Data points and error bars depict the model coefficients and SEs.
The comparison between the model containing the CNV amplitude as a predictor against the model without the CNV did not provide evidence that adding that factor to the model improves the model fit (ΔAIC = 0.2; χ(2)2 = 2.19, p > 0.1).
Discussion
According to the information-processing theories of interval timing (Treisman, 1963; Gibbon, 1977; Gibbon et al., 1984; Church et al., 1994; for review, see Buhusi and Meck, 2005; van Wassenhove, 2009; Wittmann and van Wassenhove, 2009), an accumulator keeps track of the passing of time. Earlier work (Pouthas et al., 2000; Macar and Vidal, 2003; Praamstra et al., 2006) has suggested that the CNV is the neural correlate of this process. However, here we show that higher-quality temporal information is available than can have been provided by the CNV, indicating that the accumulation measured by the CNV is unlikely to act as a source of temporal information. This claim is supported by empirical results from auditory potentials evoked by the offset of the comparison duration both before (Experiments 1 and 2) and after (Experiment 1) the standard duration has passed.
To assess timing-related neural signatures after the CNV has resolved, we focused on the potentials evoked by the offset tone of CI in a temporal-generalization paradigm. As the N1P2 amplitude was modulated as a function of temporal distance to the SI, and also for comparison durations longer than the SI, timing continued after the resolution of the CNV. As the N1P2 amplitude correlated with the absolute difference between SI and CI duration, these results suggest that the CI–SI similarity drives the N1P2 effects (Loveless, 1986; Tse and Penney, 2006, 2008; van Wassenhove and Nagarajan, 2007; Brannon et al., 2008; Roger et al., 2009) and rules out the alternative hypothesis that differences in N1P2 amplitude are purely driven by aging-based expectancy (Nobre et al., 2007). Most importantly, although previous studies have suggested that memory comparison and decision processes are completed before the end of a CI longer than the SI (Macar and Vidal, 2003; Tarantino et al., 2010; Lindbergh and Kieffaber, 2013), these results indicate that participants remain sensitive to the passing of time, even after the CNV has deflected.
In Experiment 2, we presented participants with a novel temporal generalization paradigm in which a relative shorter-/longer-than-SI decision and a decision about the absolute perceived duration (“shortest/longest” or “shorter/longer”) had to be made. As the N1P2 amplitude outperformed the CNV in predicting whether participants correctly identified the actual durations, the CNV cannot have served as the source of time on which the behavioral responses (and the N1P2 amplitudes) are based. Combined with Experiment 1, these results provide evidence that subjective timing of multisecond intervals does not depend on CNA as indexed by the CNV, and that the subjective experience of time is better reflected by distinct features of post-CI evoked potentials.
However, it is rather unlikely that modulation of the evoked potentials reflects a timing process in and of itself. Instead, it is more likely that the mechanisms underlying the N1P2 generation are governed by timing. For example, these effects might be analogous to mismatch negativity effects driven by a temporal comparison of CI to SI. Expectancy is an alternative explanation: as the task requires participants to be constantly focused on the SI, the appearance of a tone earlier or later than the SI might evoke a response based on a mismatch of expectancies. The observed results could therefore be accounted for by assuming that continuous changes in expectancy attenuate the evoked responses to the offset tones closer to the SI (Lange, 2009; but see Bendixen et al., 2009; Todorovic et al., 2011; Wacongne et al., 2011; Todorovic and de Lange, 2012). This explanation is in line with the predictive coding framework (Rao and Ballard, 1999; Friston, 2005, 2009, 2010) that suggests that the brain constantly generates expectations with regard to upcoming stimuli, based on statistical patterns in the environment. This “prediction error,” expressed by enhanced neural activity, reflects the mismatch between top-down predictions and sensory input. Interestingly, the prediction error is coded by dopamine neurons in the striatum (Schultz et al., 1997; Schultz, 2002), which is an important element of the striatal beat frequency model (Matell and Meck, 2004; Meck et al., 2008; for an introduction, see van Rijn et al., 2014). According to this model, striatal neurons continuously compare cortical patterns with the pattern detected at the time of the reward. Once the offset of the CI is observed, a dopaminergic burst updates the corticostriatal connections, and this burst might be enhanced based on the prediction error (for a link between N1P2 amplitude and dopaminergic activity in interval timing tasks, see Ng et al., 2011).
Interestingly, although the amplitudes support comparison-based explanations, the latencies of the post-CI potentials follow the pattern predicted by aging-based accounts (Niemi and Näätänen, 1981; Nobre et al., 2007; Coull, 2009). As these latencies shorten as a function of the CI duration, they can be explained by a speed up of perceptual processing as a function of the probability of appearance of the offset tone. Such a speedup of perceptual processing to more expected stimuli is known as the prior entry effect (for review, see Spence and Parise, 2010; Vangkilde et al., 2012). Importantly, as changes in expectancy require a sense of time, the shortening of latencies for CIs also indicates that the monitoring of time continues until after the SI, an observation that is also supported by a right frontal CNV peaking at the end of the CI, even when a medial frontal CNV has already deflected (Pfeuty et al., 2003). Whereas this latter finding can have multiple explanations, both the V-shaped amplitude attenuation and the progressive shortening of latency with increased expectancy suggest that timing continues after the SI has been reached, and thus after the CNV has resolved. Moreover, the results of Experiment 2 even question the role of the CNV in interval timing before it has deflected. First, the CNV amplitude before the tone demarcating the offset of the CI did not distinguish between correct and incorrect behavioral judgments (note that we also found no effect for the amplitude of the CNV during the SI on behavioral judgments; Wiener et al., 2012). Second, model comparisons showed that the N1P2 amplitude was a better predictor of behavioral performance than the CNV. These results support the notion that instead of the CNV driving temporal performance (Pfeuty et al., 2003; Macar et al., 1999, 2004), another source of temporal information is available that provides the system with more accurate temporal information than can be derived from the CNV.
Obviously, this does bring up the question of what the CNV represents. The results reported here nicely align with the observation of Ng et al. (2011), which suggests that the CNV reflects more general preparatory processes. In the experiment by Ng et al. (2011), using a temporal generalization study with much more widely spaced CIs, the CNV reached a plateau at the duration of the shortest CI and remained at this level until the SI, after which it deflected. This observation fits with the notion that the CNV reflects internal preparatory processes to an upcoming stimulus (i.e., the short CIs) or to an internal signal, which indicates that a decision about the behavioral response can be made (i.e., switch from short to long; Meijering and van Rijn, 2009). This interpretation is analogous to the view that the CNV reflects preparatory or anticipatory processes (Elbert, 1993; Leuthold et al., 2004; for review, see Van Boxtel and Böcker, 2004; Kononowicz and van Rijn, 2011; Ng et al., 2011; van Rijn et al., 2011; Mento et al., 2013).
Given that this work questions the role of CNA during timing as measured by the CNV, and suggests that another source of temporal information might drive both N1P2 amplitudes and the CNV, one could question whether observed correlations between CNA and interval timing actually support the hypothesis that CNA reflects the accumulation of time. Taking the opposite view; it could be argued that all CNA observed in temporal contexts is driven by temporal information instead of being the source of time. For example, the CNA in certain brain areas could be driven by information coming from coincident detection in the striatum (Matell and Meck, 2000, 2004; Meck et al., 2008; Jin et al., 2009; Allman and Meck, 2012; Merchant et al., 2013a,b). However, further work is needed to elucidate the role of CNA in the subjective experience of time.
In this study, we demonstrated that interval timing does not require CNA as observed in the CNV, questioning the prominent view that the CNV reflects the accumulator as hypothesized in the pacemaker-accumulator models of interval timing. Moreover, we showed that the N1P2 amplitudes for the offset of temporally relevant tones are a better reflection of internal, subjective time than the CNV.
The CNV is based on temporal information, but it does not express timing processes per se (Kononowicz and van Rijn, 2011; van Rijn et al., 2011). Although CNA is an attractive candidate for the internal representation of time, one should be cautious not to overinterpret an observed correlation between CNA and the hypothesized accrual of subjective time, as another source of temporal information might drive the observed patterns.
Notes
Supplemental material for this article is available at https://www.researchgate.net/publication/237201707_Kononowicz-VanRijn-Appendix?ev=prf_pub. To rule out the possibility that V-shaped modulation of N1P2 amplitude could have been caused by recovery from the refractory period for CIs longer than the SI, an additional experiment was run. In this study, participants heard tones separated by intervals ranging from 1.6 to 2.8 s, but were not instructed to explicitly time these durations. No effect of amplitude modulation as a function of interval length was observed. This material has not been peer reviewed.
Footnotes
This research has been partially supported by the European project COST (Cooperation in Science and Technology) ISCH (Individuals, Societies, Cultures and Health) Action TD0904 “Time In Mental activity: theoretical, behavioral, bioimaging, and clinical perspectives” (TIMELY; www.timely-cost.eu). We thank Gepke Veenstra, Steffen Bürgers, and Heleen Meijburg for assistance with data acquisition; and Marc Wittmann for discussions on this work.
References
- Acunzo DJ, Mackenzie G, van Rossum MC. Systematic biases in early ERP and ERF components as a result of high-pass filtering. J Neurosci Methods. 2012;209:212–218. doi: 10.1016/j.jneumeth.2012.06.011. [DOI] [PubMed] [Google Scholar]
- Allman MJ, Meck WH. Pathophysiological distortions in time perception and timed performance. Brain. 2012;135:656–677. doi: 10.1093/brain/awr210. [DOI] [PMC free article] [PubMed] [Google Scholar]
- Baayen RH, Davidson DJ, Bates DM. Mixed-effects modeling with crossed random effects for subjects and items. J Mem Lang. 2008;59:390–412. doi: 10.1016/j.jml.2007.12.005. [DOI] [Google Scholar]
- Bagiella E, Sloan RP, Heitjan DF. Mixed-effects models in psychophysiology. Psychophysiology. 2000;37:13–20. doi: 10.1111/1469-8986.3710013. [DOI] [PubMed] [Google Scholar]
- Bell AJ, Sejnowski TJ. An information-maximization approach to blind separation and blind deconvolution. Neural Comput. 1995;7:1129–1159. doi: 10.1162/neco.1995.7.6.1129. [DOI] [PubMed] [Google Scholar]
- Bendixen A, Schröger E, Winkler I. I heard that coming: event-related potential evidence for stimulus-driven prediction in the auditory system. J Neurosci. 2009;29:8447–8451. doi: 10.1523/JNEUROSCI.1493-09.2009. [DOI] [PMC free article] [PubMed] [Google Scholar]
- Brannon EM, Libertus ME, Meck WH, Woldorff MG. Electrophysiological measures of time processing in infant and adult brains: Weber's law holds. J Cogn Neurosci. 2008;20:193–203. doi: 10.1162/jocn.2008.20016. [DOI] [PMC free article] [PubMed] [Google Scholar]
- Buhusi CV, Meck WH. What makes us tick? Functional and neural mechanisms of interval timing. Nat Rev Neurosci. 2005;6:755–765. doi: 10.1038/nrn1764. [DOI] [PubMed] [Google Scholar]
- Church RM, Meck WH, Gibbon J. Application of scalar timing theory to individual trials. J Exp Psychol Anim Behav Process. 1994;20:135–155. doi: 10.1037/0097-7403.20.2.135. [DOI] [PubMed] [Google Scholar]
- Correa A, Nobre AC. Neural modulation by regularity and passage of time. J Neurophysiol. 2008;100:1649–1655. doi: 10.1152/jn.90656.2008. [DOI] [PubMed] [Google Scholar]
- Coull JT. Neural substrates of mounting temporal expectation. PLoS Biol. 2009;7:e1000166. doi: 10.1371/journal.pbio.1000166. [DOI] [PMC free article] [PubMed] [Google Scholar]
- Durstewitz D. Self-organizing neural integrator predicts interval times through climbing activity. J Neurosci. 2003;23:5342–5353. doi: 10.1523/JNEUROSCI.23-12-05342.2003. [DOI] [PMC free article] [PubMed] [Google Scholar]
- Elbert T. Slow cortical potentials reflect the regulation of cortical excitability. In: McCallum WC, Curry SH, editors. Slow potential changes in the human brain: NATO Sciences Series: A. New York: Plenum; 1993. pp. 235–251. [Google Scholar]
- Friston K. A theory of cortical responses. Philos Trans R Soc Lond B Biol Sci. 2005;360:815–836. doi: 10.1098/rstb.2005.1622. [DOI] [PMC free article] [PubMed] [Google Scholar]
- Friston K. The free-energy principle: a rough guide to the brain? Trends Cogn Sci. 2009;13:293–301. doi: 10.1016/j.tics.2009.04.005. [DOI] [PubMed] [Google Scholar]
- Friston K. The free-energy principle: a unified brain theory? Nat Rev Neurosci. 2010;11:127–138. doi: 10.1038/nrn2787. [DOI] [PubMed] [Google Scholar]
- Gelman A, Hill J. Data analysis using regression and multilevel/hierarchical models. New York: Cambridge UP; 2007. [Google Scholar]
- Gibbon J. Scalar expectancy theory and Weber's law in animal timing. Psychol Rev. 1977;84:279. doi: 10.1037/0033-295X.84.3.279. [DOI] [Google Scholar]
- Gibbon J, Church RM, Meck WH. Scalar timing in memory. Ann N Y Acad Sci. 1984;423:52–77. doi: 10.1111/j.1749-6632.1984.tb23417.x. [DOI] [PubMed] [Google Scholar]
- Huiskamp G. Difference formulas for the surface Laplacian on a triangulated surface. J Comp Phys. 1991;95:477–496. doi: 10.1016/0021-9991(91)90286-T. [DOI] [Google Scholar]
- Jin DZ, Fujii N, Graybiel AM. Neural representation of time in cortico-basal ganglia circuits. Proc Natl Acad Sci U S A. 2009;106:19156–19161. doi: 10.1073/pnas.0909881106. [DOI] [PMC free article] [PubMed] [Google Scholar]
- Kononowicz TW, van Rijn H. Slow potentials in time estimation: the role of temporal accumulation and habituation. Front Integr Neurosci. 2011;5:48. doi: 10.3389/fnint.2011.00048. [DOI] [PMC free article] [PubMed] [Google Scholar]
- Lange K. Brain correlates of early auditory processing are attenuated by expectations for time and pitch. Brain Cogn. 2009;69:127–137. doi: 10.1016/j.bandc.2008.06.004. [DOI] [PubMed] [Google Scholar]
- Leuthold H, Sommer W, Ulrich R. Preparing for action: inferences from CNV and LRP. J Psychophysiol. 2004;18:77–88. doi: 10.1027/0269-8803.18.23.77. [DOI] [Google Scholar]
- Lindbergh CA, Kieffaber PD. The neural correlates of temporal judgments in the duration bisection task. Neuropsychologia. 2013;51:191–196. doi: 10.1016/j.neuropsychologia.2012.09.001. [DOI] [PubMed] [Google Scholar]
- Loveless NE. Potentials evoked by temporal deviance. Biol Psychol. 1986;22:149–167. doi: 10.1016/0301-0511(86)90042-6. [DOI] [PubMed] [Google Scholar]
- Macar F, Vidal F. The CNV peak: an index of decision making and temporal memory. Psychophysiology. 2003;40:950–954. doi: 10.1111/1469-8986.00113. [DOI] [PubMed] [Google Scholar]
- Macar F, Vidal F, Casini L. The supplementary motor area in motor and sensory timing: evidence from slow brain potential changes. Exp Brain Res. 1999;125:271–280. doi: 10.1007/s002210050683. [DOI] [PubMed] [Google Scholar]
- Macar F, Anton JL, Bonnet M, Vidal F. Timing functions of the supplementary motor area: an event-related fMRI study. Brain Res Cogn Brain Res. 2004;21:206–215. doi: 10.1016/j.cogbrainres.2004.01.005. [DOI] [PubMed] [Google Scholar]
- Matell MS, Meck WH. Neuropsychological mechanisms of interval timing behavior. Bioessays. 2000;22:94–103. doi: 10.1002/(SICI)1521-1878(200001)22:1<94::AID-BIES14>3.0.CO;2-E. [DOI] [PubMed] [Google Scholar]
- Matell MS, Meck WH. Cortico-striatal circuits and interval timing: coincidence detection of oscillatory processes. Brain Res Cogn Brain Res. 2004;21:139–170. doi: 10.1016/j.cogbrainres.2004.06.012. [DOI] [PubMed] [Google Scholar]
- McDonald JJ, Teder-Sälejärvi WA, Di Russo F, Hillyard SA. Neural basis of auditory-induced shifts in visual time-order perception. Nat Neurosci. 2005;8:1197–1202. doi: 10.1038/nn1512. [DOI] [PubMed] [Google Scholar]
- Meck WH, Penney TB, Pouthas V. Cortico-striatal representation of time in animals and humans. Curr Opin Neurobiol. 2008;18:145–152. doi: 10.1016/j.conb.2008.08.002. [DOI] [PubMed] [Google Scholar]
- Meijering B, van Rijn H. Experimental and computational analyses of strategy usage in the time-left task. Proceedings of the 31st Annual Meeting of the Cognitive Science Society; Austin, TX: Cognitive Science Society; 2009. pp. 1615–1620. [Google Scholar]
- Mento G, Tarantino V, Sarlo M, Bisiacchi PS. Automatic temporal expectancy: a high-density event-related potential study. PLoS One. 2013;8:e62896. doi: 10.1371/journal.pone.0062896. [DOI] [PMC free article] [PubMed] [Google Scholar]
- Merchant H, Harrington DL, Meck WH. Neural basis of the perception and estimation of time. Annu Rev Neurosci. 2013a;36:313–336. doi: 10.1146/annurev-neuro-062012-170349. [DOI] [PubMed] [Google Scholar]
- Merchant H, Pérez O, Zarco W, Gámez J. Interval tuning in the primate medial premotor cortex as a general timing mechanism. J Neurosci. 2013b;33:9082–9096. doi: 10.1523/JNEUROSCI.5513-12.2013. [DOI] [PMC free article] [PubMed] [Google Scholar]
- Näätänen R, Winkler I. The concept of auditory stimulus representation in cognitive neuroscience. Psychol Bull. 1999;125:826–859. doi: 10.1037/0033-2909.125.6.826. [DOI] [PubMed] [Google Scholar]
- Ng KK, Tobin S, Penney TB. Temporal accumulation and decision processes in the duration bisection task revealed by contingent negative variation. Front Integr Neurosci. 2011;5:77. doi: 10.3389/fnint.2011.00077. [DOI] [PMC free article] [PubMed] [Google Scholar]
- Niemi P, Näätänen R. Foreperiod and simple reaction time. Psychol Bull. 1981;89:133–162. doi: 10.1037/0033-2909.89.1.133. [DOI] [Google Scholar]
- Nobre A, Correa A, Coull J. The hazards of time. Curr Opin Neurobiol. 2007;17:465–470. doi: 10.1016/j.conb.2007.07.006. [DOI] [PubMed] [Google Scholar]
- Nunez PL, Westdorp AF. The surface laplacian, high resolution EEG and controversies. Brain Topogr. 1994;6:221–226. doi: 10.1007/BF01187712. [DOI] [PubMed] [Google Scholar]
- Oostendorp TF, van Oosterom A. The surface Laplacian of the potential: theory and application. IEEE Trans Biomed Eng. 1996;43:394–405. doi: 10.1109/10.486259. [DOI] [PubMed] [Google Scholar]
- Oostenveld R, Fries P, Maris E, Schoffelen J-M. FieldTrip: open source software for advanced analysis of MEG, EEG, and invasive electrophysiological data. Comput Intell Neurosci. 2011;2011:156869. doi: 10.1155/2011/156869. [DOI] [PMC free article] [PubMed] [Google Scholar]
- Pfeuty M, Ragot R, Pouthas V. When time is up: CNV time course differentiates the roles of the hemispheres in the discrimination of short tone durations. Exp Brain Res. 2003;151:372–379. doi: 10.1007/s00221-003-1505-6. [DOI] [PubMed] [Google Scholar]
- Pfeuty M, Ragot R, Pouthas V. Relationship between CNV and timing of an upcoming event. Neurosci Lett. 2005;382:106–111. doi: 10.1016/j.neulet.2005.02.067. [DOI] [PubMed] [Google Scholar]
- Pinheiro JC, Bates DM. Mixed-effects models in S and S-Plus. New York: Springer; 2000. [Google Scholar]
- Pouthas V, Garnero L, Ferrandez AM, Renault B. ERPs and PET analysis of time perception: spatial and temporal brain mapping during visual discrimination tasks. Hum Brain Mapp. 2000;10:49–60. doi: 10.1002/(SICI)1097-0193(200006)10:2<49::AID-HBM10>3.0.CO;2-8. [DOI] [PMC free article] [PubMed] [Google Scholar]
- Praamstra P, Kourtis D, Kwok HF, Oostenveld R. Neurophysiology of implicit timing in serial choice reaction-time performance. J Neurosci. 2006;26:5448–5455. doi: 10.1523/JNEUROSCI.0440-06.2006. [DOI] [PMC free article] [PubMed] [Google Scholar]
- Prins N, Kingdom FA. Palamedes: Matlab routines for analyzing psychophysical data. 2009. Available at: http://www.palamedestoolbox.org.
- Rao SM, Ballard DH. The evolution of brain activation during temporal processing. Nat Neurosci. 1999;2:79–87. doi: 10.1038/4580. [DOI] [PubMed] [Google Scholar]
- Reutimann J, Yakovlev V, Fusi S, Senn W. Climbing neuronal activity as an event-based cortical representation of time. J Neurosci. 2004;24:3295–3303. doi: 10.1523/JNEUROSCI.4098-03.2004. [DOI] [PMC free article] [PubMed] [Google Scholar]
- Roger C, Hasbroucq T, Rabat A, Vidal F, Burle B. Neurphysics of temporal dyscrimination in the rat: a mismatch negativity study. Psychophysiology. 2009;46:1028–1032. doi: 10.1111/j.1469-8986.2009.00840.x. [DOI] [PubMed] [Google Scholar]
- Schultz W. Getting Formal with Dopamine and Reward. Neuron. 2002;36:241–263. doi: 10.1016/S0896-6273(02)00967-4. [DOI] [PubMed] [Google Scholar]
- Schultz W, Dayan P, Montague PR. A neural substrate of prediction and reward. Science. 1997;275:1593–1599. doi: 10.1126/science.275.5306.1593. [DOI] [PubMed] [Google Scholar]
- Seibold VC, Fiedler A, Rolke B. Temporal attention shortens perceptual latency: a temporal prior entry effect. Psychophysiology. 2011;48:708–717. doi: 10.1111/j.1469-8986.2010.01135.x. [DOI] [PubMed] [Google Scholar]
- Simen P, Balci F, de Souza L, Cohen JD, Holmes P. A model of interval timing by neural integration. J Neurosci. 2011;31:9238–9253. doi: 10.1523/JNEUROSCI.3121-10.2011. [DOI] [PMC free article] [PubMed] [Google Scholar]
- Spence C, Parise C. Prior-entry: a review. Conscious Cogn. 2010;19:364–379. doi: 10.1016/j.concog.2009.12.001. [DOI] [PubMed] [Google Scholar]
- Tarantino V, Ehlis AC, Baehne C, Boreatti-Huemmer A, Jacob C, Bisiacchi P, Fallgatter AJ. The time course of temporal discrimination: an ERP study. Clin Neurophysiol. 2010;121:43–52. doi: 10.1016/j.clinph.2009.09.014. [DOI] [PubMed] [Google Scholar]
- Todorovic A, de Lange FP. Repetition suppression and expectation suppression are dissociable in time in early auditory evoked fields. J Neurosci. 2012;32:13389–13395. doi: 10.1523/JNEUROSCI.2227-12.2012. [DOI] [PMC free article] [PubMed] [Google Scholar]
- Todorovic A, van Ede F, Maris E, de Lange FP. Prior expectation mediates neural adaptation to repeated sounds in the auditory cortex: an MEG study. J Neurosci. 2011;31:9118–9123. doi: 10.1523/JNEUROSCI.1425-11.2011. [DOI] [PMC free article] [PubMed] [Google Scholar]
- Treisman M. Temporal discrimination and the indifference interval: implications for a model of the “internal clock.”. Psychol Monogr. 1963;77:1–31. doi: 10.1037/h0093864. [DOI] [PubMed] [Google Scholar]
- Tse CY, Penney TB. Preattentive timing of empty intervals is from marker offset to onset. Psychophysiology. 2006;43:172–179. doi: 10.1111/j.1469-8986.2006.389.x. [DOI] [PubMed] [Google Scholar]
- Tse CY, Penney TB. On the functional fole of temporal and frontal cortex activation in passive detection of auditory devaince. Neuroimage. 2008;41:1462–1470. doi: 10.1016/j.neuroimage.2008.03.043. [DOI] [PubMed] [Google Scholar]
- Ulrich R, Nitschke J, Rammsayer T. Crossmodal temporal discrimination: assessing the predictions of a general pacemaker-counter model. Percept Psychophys. 2006;68:1140–1152. doi: 10.3758/BF03193716. [DOI] [PubMed] [Google Scholar]
- Van Boxtel GJM, Böcker KBE. Cortical measures of anticipation. J Psychophysiol. 2004;18:61–76. doi: 10.1027/0269-8803.18.23.61. [DOI] [Google Scholar]
- van Rijn H, Kononowicz TW, Meck WH, Ng KK, Penney TB. Contingent negative variation and its relation to time estimation: a theoretical evaluation. Front Integr Neurosci. 2011;5:91. doi: 10.3389/fnint.2011.00091. [DOI] [PMC free article] [PubMed] [Google Scholar]
- van Rijn H, Gu B-M, Meck WH. Dedicated clock/timing-circuit theories of interval timing. In: Merchant H, de Lafuente V, editors. Neurobiology of interval timing. New York: Springer; 2014. [Google Scholar]
- van Wassenhove V, Grant KW, Poeppel D. Visual speech speeds up the neural processing of auditory speech. Proc Natl Acad Sci U S A. 2005;102:1181–1186. doi: 10.1073/pnas.0408949102. [DOI] [PMC free article] [PubMed] [Google Scholar]
- van Wassenhove V. Minding time in an amodal representational space. Philos Trans R Soc Lond B Biol Sci. 2009;364:1815–1830. doi: 10.1098/rstb.2009.0023. [DOI] [PMC free article] [PubMed] [Google Scholar]
- van Wassenhove V, Nagarajan SS. Auditory cortical plasticity in learning to discriminate modulation rate. J Neurosci. 2007;27:2663–2672. doi: 10.1523/JNEUROSCI.4844-06.2007. [DOI] [PMC free article] [PubMed] [Google Scholar]
- Vangkilde S, Coull JT, Bundesen C. Great expectations: temporal expectation modulates perceptual processing speed. J Exp Psychol Hum Percept Perform. 2012;38:1183–1191. doi: 10.1037/a0026343. [DOI] [PubMed] [Google Scholar]
- Vibell J, Klinge C, Zampini M, Spence C, Nobre AC. Temporal order is coded temporally in the brain: Early event-related potential latency shifts underlying prior entry in a cross-modal temporal order judgment task. J Cogn Neurosci. 2007;19:109–120. doi: 10.1162/jocn.2007.19.1.109. [DOI] [PubMed] [Google Scholar]
- Wacongne C, Labyt E, van Wassenhove V, Bekinschtein T, Naccache L, Dehaene S. Evidence for a hierarchy of predictions and prediction errors in human cortex. Proc Natl Acad Sci U S A. 2011;108:20754–20759. doi: 10.1073/pnas.1117807108. [DOI] [PMC free article] [PubMed] [Google Scholar]
- Walter WG, Cooper R, Aldridge VJ, McCallum WC, Winter AL. Contingent negative variation: an electric sign of sensori-motor association and expectancy in the human brain. Nature. 1964;203:380–384. doi: 10.1038/203380a0. [DOI] [PubMed] [Google Scholar]
- Wearden JH. Temporal generalization in humans. J Exp Psychol Anim Behav Process. 1992;18:134–144. doi: 10.1037/0097-7403.18.2.134. [DOI] [PubMed] [Google Scholar]
- Wichmann FA, Hill NJ. The psychometric function: I. Fitting, sampling, and goodness of fit. Percept Psychophys. 2001;63:1293–1313. doi: 10.3758/BF03194544. [DOI] [PubMed] [Google Scholar]
- Wiener M, Kliot D, Turkeltaub PE, Hamilton RH, Wolk DA, Coslett HB. Parietal influence on temporal encoding indexed by simultaneous transcranial magnetic stimulation and electroencephalography. J Neurosci. 2012;32:12258–12267. doi: 10.1523/JNEUROSCI.2511-12.2012. [DOI] [PMC free article] [PubMed] [Google Scholar]
- Wittmann M. The inner sense of time: how the brain creates a representation of duration. Nat Rev Neurosci. 2013;14:217–223. doi: 10.1038/nrn3452. [DOI] [PubMed] [Google Scholar]
- Wittmann M, Van Wassenhove V. The experience of time: neural mechanisms and the interplay of emotion, cognition and embodiment. Philos Trans R Soc Lond B Biol Sci. 2009;364:1809–1813. doi: 10.1098/rstb.2009.0025. [DOI] [PMC free article] [PubMed] [Google Scholar]