

Abstract
Visual systems extract directional motion information from spatiotemporal luminance changes on the retina. An algorithmic model, the Reichardt detector, accounts for this by multiplying adjacent inputs after asymmetric temporal filtering. The outputs of two mirror-symmetrical units tuned to opposite directions are thought to be subtracted on the dendrites of wide-field motion-sensitive lobula plate tangential cells by antagonistic transmitter systems. In Drosophila, small-field T4/T5 cells carry visual motion information to the tangential cells that are depolarized during preferred and hyperpolarized during null direction motion. While preferred direction input is likely provided by excitation from T4/T5 terminals, the origin of null direction inhibition is unclear. Probing the connectivity between T4/T5 and tangential cells in Drosophila using a combination of optogenetics, electrophysiology, and pharmacology, we found a direct excitatory as well as an indirect inhibitory component. This suggests that the null direction response is caused by feedforward inhibition via yet unidentified neurons.
Keywords: Drosophila, feedforward inhibition, motion vision, optogenetics, pharmacology, synaptic connectivity
Introduction
The perception of dynamically changing visual images derives from time-varying brightness changes projected onto a 2D array of photoreceptors. To extract higher order features that are not explicitly encoded at the level of individual inputs, signals from each point in space need to be processed by downstream parallel circuits. An important question is how the direction of local image motion is detected, a process that requires the comparison of signals from at least two neighboring photoreceptors in time. An algorithmic model, the Reichardt detector, accounts for this by multiplying adjacent inputs after asymmetric temporal filtering (Hassenstein and Reichardt, 1956; Borst and Euler, 2011). A functional unit comprises two mirror-symmetrical half detectors tuned to opposite directions. Their outputs are thought to be subtracted on the dendrites of motion-sensitive cells by antagonistic neurotransmitter systems.
Much of our knowledge about the functional organization of such a neural circuit has emerged from studies in flies (Borst et al., 2010), where large tangential cells in the lobula plate (LPTCs) display direction-selective responses: depolarization during motion along their preferred direction and hyperpolarization during motion along the opposite/null direction. Two pathways, corresponding to separate ON and OFF channels, convey signals from photoreceptors to the LPTCs (Joesch et al., 2010, 2013; Eichner et al., 2011; Maisak et al., 2013), and their behavioral relevance has been investigated in great detail (Rister et al., 2007; Clark et al., 2011; Bahl et al., 2013; Maisak et al., 2013; Silies et al., 2013; Tuthill et al., 2013). The presumed outputs of these pathways are arrays of columnar T4 and T5 cells that are therefore prime candidates to represent the last processing stage of the antagonistic half detectors. In support of this notion, genetically silencing T4/T5 eliminates all motion sensitivity in LPTCs (Schnell et al., 2012). Moreover, both cell types carry direction-selective Ca2+ signals but differ in their preference for edge polarity (Maisak et al., 2013). In the lobula plate, individual T4/T5 axons segregate into four layers according to their tuning: cells selective for front-to-back motion target layer 1, those selective for back-to-front layer 2, cells tuned to upward motion terminate in layer 3, and those tuned to downward motion in layer 4 (Maisak et al., 2013). The planar dendrites of LPTCs are generally, though not exclusively, restricted to individual layers that match the T4/T5 cells' preferred direction (Hausen, 1982, 1984; Hengstenberg et al., 1982). Therefore, LPTCs likely obtain their preferred direction input by integrating excitation from T4/T5 terminals over large receptive fields. However, the synaptic origin of null direction inhibition in LPTCs is unknown.
We studied the functional connectivity of the lobula plate in Drosophila by optogenetically stimulating T4/T5 cells while recording the synaptic responses in LPTCs electrophysiologically. Combining this approach with intersectional genetics and pharmacology we found that LPTCs receive excitatory cholinergic input from both T4 and T5. Importantly, optogenetic activation of T4/T5 cells also elicits delayed indirect synaptic inhibition. We propose that LPTC dendrites indeed receive their preferred direction input from correspondingly tuned T4/T5 cell terminals in the same lobula plate layer. Their null direction input, however, likely arises from T4/T5 cells with opposite direction tuning terminating in the adjacent layer by feedforward inhibition via yet unidentified local interneurons.
Materials and Methods
Fly stocks.
Flies were raised at 25°C and 60% humidity on standard cornmeal agar medium at a 12 h light/dark cycle. The following fly strains were used: T4/T5-specific driver lines from the Howard Hughes Medical Institute Janelia Farm (Pfeiffer et al., 2008) and IMP Vienna stock collections (generously provided by Gerald Rubin and Barry Dickson) R42F06-Gal4 on third chromosome (T4+T5), R42F06-p65-AD on second (T4+T5), and VT37588-Gal4 on third (T4; Maisak et al., 2013); Cha-DBD on third (courtesy of Chi-Hon Lee; Gao et al., 2008); UAS-Channelrhodopsin2-H134R-mCherry on second (UAS-ChR2-H134R, courtesy of Stefan Pulver; Nagel et al., 2005; Pulver et al., 2009; Mattis et al., 2012); norpA7 on X (dysfunctional phototransduction mutant; Hotta and Benzer, 1970); UAS-mCD8-GFP on second (courtesy of Barry Dickson); UAS-synaptotagmin-HA on second (UAS-syt-HA, courtesy of Andreas Prokop; Löhr et al., 2002; Robinson et al., 2002); and UAS-stinger-GFP on second. The genotypes of flies used in our experiments are as follows, in order of appearance in the Results section: (1) w− ; UAS-stinger-GFP/+ ; R42F06-Gal4/+, (2) w− ; UAS-syt-HA, UAS-mCD8-GFP/+ ; R42F06-Gal4/+, (3) w− ; UAS-ChR2-H134R ; R42F06-Gal4, (4) w− ; UAS-ChR2-H134R ; VT37588-Gal4, (5) w− ; R42F06-p65-AD, UAS-ChR2-H134R/R42F06-p65-AD ; Cha-DBD, (6) w− ; + ; R42F06-Gal4 (control without ChR2 expression), (7) norpA7 ; UAS-ChR2-H134R ; R42F06-Gal4, (8) norpA7 ; UAS-ChR2-H134R ; VT37588-Gal4, and (9) wild-type Canton-S.
Immunohistochemistry and confocal imaging.
For immunostainings brains of 1- to 2-d-old female flies were dissected in PBS, fixed for 30–40 min in PBS/4% paraformaldehyde (PFA) at room temperature, and washed in PBS/0.5% Triton X-100 (PBT). Preparations were blocked for 2 h in PBT/5% NGS, incubated for 1–2 d at 4°C with primary antibodies and 2–3 d with secondary antibodies (5% normal goat serum added to antibody solutions). Primary and secondary antibodies used for T4/T5 > GFP, sytHA flies (genotype 2) were as follows: rabbit anti-GFP (1:1000; Torrey Pines Biolabs) + Alexa Fluor 488 goat anti-rabbit (1:500), rat anti-HA (1:50; Roche) + Alexa Fluor 568 goat anti-rat (1:500), and mouse anti-bruchpilot (1:25; NC82, Developmental Studies Hybridoma Bank) + Alexa Fluor 633 goat anti-mouse (1:500). Primary and secondary antibodies used for T4/T5 > stinger-GFP flies (genotype 1) were as follows: mouse anti-ChAT (1:1000; courtesy of P. Salvaterra; Takagawa and Salvaterra, 1996) + Alexa Fluor 568 goat anti-mouse (1:200), and rabbit anti-vGAT (1:200; courtesy of D. Kranz; Fei et al., 2010) + Alexa Fluor 568 goat anti-rabbit (1:200). All secondary antibodies were from Invitrogen. Brains were mounted (IMM; ibidi) and optically sectioned with a Leica SP5 confocal laser scanning microscope. To quantify anti-ChAT-positive and anti-vGAT-positive T4/T5 cells, respectively, two nonoverlapping optical sections from two brains for each staining were used for analysis. A total number of 2717 somata for anti-ChAT and 2503 somata for anti-vGAT were evaluated.
To verify ChR2-H134R-mCherry expression specificity and strength with the different driver lines we dissected brains from female flies (1 d after eclosion, genotypes as used in physiological experiments) in PBS (pH 7.4, 280 mOsmol/kg). Brains were fixed at room temperature for 30 min in PBS/4% PFA and an additional 10 min in PBS/4% PFA/0.1% Triton X-100. After three and two washing steps in PBT and PBS, respectively, brains were mounted (IMM; ibidi) and optically sectioned in the horizontal plane with a Leica SP5 confocal laser scanning microscope using 568 nm excitation and a step size of 1 μm. Identical procedures and confocal settings were applied throughout to compare relative signal intensities between different driver lines. For documentation, single sections were processed in ImageJ 1.46r (National Institutes of Health, Bethesda, Maryland), pseudocolored using the “Fire” lookup table, and images assembled in Adobe Photoshop CS5.
Cell counts.
A software-aided manual counting strategy was used to estimate T4/T5 cell numbers in confocal stacks (step size 1 μm) generated from brains expressing nuclear-targeted stinger-GFP with a T4/T5-specific driver line (UAS-stinger-GFP/+ ; R42F06-Gal4/+). While scrolling through a stack at two orthogonal views distinctly colored spheres were incrementally anchored to centers of individual nuclei. Thus, cells were only counted once and omitted nuclei could easily be detected.
Electrophysiology.
For all experiments 20- to 30-h-old female flies kept at 25°C were used, except for neurotransmitter injections where flies were 7–30 h old. For optogenetic experiments, yeast paste containing 1 mm all-trans-retinal (ATR, R2500; Sigma Aldrich) was fed to freshly eclosed flies. Preparation and recording conditions were modified from Joesch et al. (2008) and Maimon et al. (2010). Flies were anesthetized on ice and attached to a Plexiglas holder with the head bent down using melted beeswax. The holder was placed underneath a recording chamber with a magnet so that the back of the fly's head was accessible through a 1 mm slit in the bottom of the chamber consisting of thin foil. The head was gently attached to the slit edges on one side with melted beeswax. Under external solution, a window was cut into the head capsule on the other side with a hypodermic needle. Further dissection and recordings were performed under a Zeiss Axiotech vario microscope equipped with polarized light contrast and epifluorescence. Under polarized light contrast, the glial sheath was digested locally by applying a stream of 0.5 mg/ml Collagenase IV (Gibco) through a cleaning micropipette (∼5 μm opening). Whole-cell recordings were established with patch electrodes of 5–8 MΩ resistance. We used a BA-1S bridge amplifier (npi Electronics) to record in current-clamp, low-pass filtered at 3 kHz, and digitized signals at 10 kHz via an analog/digital converter (PCI-DAS6025; Measurement Computing). All physiological data were acquired in MATLAB (R2010b; Mathworks) using the data acquisition toolbox. Normal external solution contained the following (in mm): 103 NaCl, 3 KCl, 5 TES, 10 trehalose, 10 glucose, 3–7 sucrose, 26 NaHCO3, 1 NaH2PO4, 1.5 CaCl2, and 4 MgCl2, pH 7.3–7.35, 280–290 mOsmol/kg. Zero Ca2+/high Mg2+ external solution contained the following (in mm): 66 NaCl, 22 Na-gluconate, 3 KCl, 5 TES, 10 trehalose, 5 glucose, 25 NaHCO3, 1 NaH2PO4, and 20 MgCl2, pH 7.3–7.35, 280 mOsmol/kg. External solution was carboxygenated (95% O2/5% CO2) and, except for α-bungarotoxin (α-BTX) experiments, constantly perfused over the preparation at 2 ml/min. Internal solution, adjusted to pH 7.26 with 1N KOH, contained the following: 140 K-aspartate, 10 HEPES, 4 Mg-ATP, 0.5 Na-GTP, 1 EGTA, 1 KCl, and 0.1 Alexa Fluor 488 hydrazide salt (265 mOsmol/kg). Dye-filled cells included for analyses were VS and HS cells, identified by visual response profile (not possible in blind norpA7 mutant flies) and morphology. Apart from visual direction tuning, no discernible differences were observed for VS and HS cells in all assays.
Optogenetic stimulation.
During electrophysiological recordings, wide-field light pulses for optogenetic stimulation were delivered via the epifluorescence light path of the microscope through a 40×/0.8 NA water-immersion objective (LUMPlan FI; Olympus). As a light source, a Lambda DG-4 Plus wavelength switcher (Sutter) with a 300 mW Xenon Arc lamp was connected to the illumination port of the microscope via a liquid light guide. Attenuating the output of the DG-4 was achieved by offsetting the output galvanometer. The output for each setting was measured with a power meter (Thorlabs PM100D) under the 40× objective in air. Taking into account the field of illumination under water immersion, the light intensity per area on the specimen was estimated, as given in the Results section and figures. Light stimuli were triggered via the data acquisition software with voltage steps (∼500 μs delay to light onset according to the manufacturer and own measurements using a photodiode). A stimulus trial consisted of eight 2 ms light pulses interleaved by 5 s. For analysis, responses to the eight light pulses were averaged for each experimental condition and time point. All values in the text are given as mean ± SEM.
Pharmacology.
Aqueous stock solutions were prepared from the following antagonists at the following concentrations: 10 mm methyllycaconitine (MLA; Sigma M168), 100 mm mecamylamine (MEC; Sigma M9020) and 1 mm α-BTX (Tocris Bioscience 2133). Picrotoxinin (PTX; Sigma P8390) was dissolved in dimethylsulfoxide at 50 mm. For experiments, α-BTX was added directly to the bath with perfusion switched off. All other compounds were diluted in external solution to concentrations given in the results section and perfused over the preparation at 2 ml/min.
Neurotransmitter pressure injection.
All neurotransmitters were dissolved in dH2O at 50 mm (glutamate) or 100 mm (acetylcholine, GABA; all from Sigma; stocks kept aliquoted at −20°C), diluted at day of experiment in external solution to 1 mm with additional 10 μm Alexa Fluor 488 hydrazide (Invitrogen), and back-loaded into patch pipettes (∼1 μm tip diameter). The Alexa 488/neurotransmitter-filled pipettes were connected via a holder and rubber tube to a pressure-injection system (FemtoJet; Eppendorf) that was triggered via the MATLAB data acquisition software. During recordings of LPTCs, the neurotransmitter-filled pipettes were carefully positioned by a micromanipulator toward Alexa 488-filled LPTC dendrites in the lobula plate under epifluorescence illumination and electrophysiological responses to brief puffs of neurotransmitters (generally 100 ms) were monitored. Once robust responses remained stable for 5–10 min, a protocol was started during which responses to visual motion stimulation and transmitter puffs were probed continuously every 1–2.5 min while antagonists were washed in and out via the perfusion system. Ejection of Alexa 488/neurotransmitter solution from pipettes was controlled in regular intervals under epifluorescence. For each cell and time point, the average responses to five consecutive pressure pulses at intervals of 5 s were analyzed. Responses were quantified by subtracting the integrated voltage deviations during 1 s before stimulus trigger from 1 s following stimulus trigger. This was done separately for positive and negative values. For each cell and experiment, all positive and negative integrals were normalized either to positive baseline values for acetylcholine injections or negative baseline values for GABA and glutamate injections. All values in the text are given as mean ± SEM.
Results
T4/T5 cell numbers suggest eight distinct functional subtypes
T4/T5 cells represent the major small-field motion-sensitive input elements to the lobula plate and are required for both preferred direction excitation and null direction inhibition of LPTCs (Schnell et al., 2012). Golgi impregnations have identified eight anatomical types (Fischbach and Dittrich, 1989) and Ca2+ imaging data have categorized T4/T5 cells into eight functional subgroups: T4 and T5 cells are selective for moving positive and negative contrast changes, respectively, but are otherwise individually tuned to the same four cardinal directions of motion (Maisak et al., 2013). This provides evidence that T4 and T5 cells convey equivalent motion information to the lobula plate. We aimed to determine whether apart from their anatomy and visual response properties the T4/T5 cells could be further functionally subdivided, for instance, into two antagonistic sets implementing different transmitter systems. We reasoned that the total number of T4 and T5 cells divided by approximately 750 ommatidia of a Drosophila eye would yield the number of T4/T5 cells per column and therefore the maximum number of different functional subtypes repeated across the retinotopic array. To analyze T4/T5 cell numbers we expressed a nuclear GFP marker using a T4/T5-specific Gal4 line, generated confocal stacks of optic lobes, and counted nuclei manually with the aid of a custom-made tracking software. Our analyses yielded a total number of 5264 ± 433 (SD) T4 and T5 cells (N = 4). If a set of T4/T5 cells were represented by every retinotopic unit this would indicate a number of approximately seven cells per column, approximating eight. Taking into account that a small fraction of cells might have escaped from analysis or that numbers might be reduced toward the edges of the visual field, this result is well in agreement with an electron microscopy study that has identified four T4 cells per medulla column each projecting to one of the four different lobula plate layers (Takemura et al., 2013). In the light of these findings we interpret our result such that in general for each ommatidium each of the four lobula plate layers is innervated by one T4 and one T5 terminal only, both tuned to the same direction of visual motion but individually specialized for moving contrast increments and decrements, respectively.
Probing synaptic connectivity between T4/T5 and LPTCs
T4 and T5 cells receive synaptic input on their dendrites located in the medulla and lobula, respectively, and convey signals to the lobula plate where they are thought to connect to LPTC dendrites via chemical synapses (Fig. 1A,C; Strausfeld and Lee, 1991). Making use of specific T4/T5 driver lines (Fig. 1B–F) we set out to probe the underlying connectivity by optically stimulating T4/T5-expressing Channelrhodopsin2-H134R-mCherry while recording the synaptic responses in LPTCs by whole-cell patch clamp (Fig. 1A,B). Applying 2 ms blue light pulses at ∼3 mW mm−2 (472 nm center wavelength, 30 nm bandwidth) to T4/T5 > ChR2 brains resulted in a fast excitatory peak (latency Δ5.4 ± 0.4 ms after onset of stimulus trigger) followed by an inhibitory trough (Δ11.2 ± 0.2 ms) and a second smaller excitatory peak (Δ16.3 ± 1.2 ms). The time course of the response was highly reproducible as shown for four cells and a total number of 32 stimuli (Fig. 2A). Figure 2B (black trace) depicts the average of the same trials with the shaded area indicating the SD. A concern was the unintended stimulation of photoreceptors by the optogenetic light stimulus. To characterize visual artifacts we applied blue light pulses to control flies without expression (T4/T5-Gal4 only) and observed an excitatory response in all preparations starting with a latency of 8 ms and peaking at Δ15.5 ± 1.7 ms (Fig. 2B, blue trace). The relatively slow time course and long latency of the retina artifact suggests that the initial biphasic depolarizing and hyperpolarizing potential changes in T4/T5 > ChR2-expressing flies are caused by synaptic input from optogenetically stimulated T4/T5 cells to LPTCs with the second excitatory peak being evoked by visual input. To further isolate the optogenetic from the retina components we performed experiments in flies without functional phototransduction (norpA7: phospholipase C mutated; Hotta and Benzer, 1970). As expected, norpA7-mutant flies without ChR2 expression did not show a response to blue light pulses at the level of LPTCs (Fig. 2C, blue trace). Repeating the same stimulation in the mutant background with additional ChR2 expression in T4/T5 lead to an initial biphasic response as in visually intact flies (Fig. 2C, black trace; latency excitatory peak: Δ5.4 ± 0.4 ms, inhibitory trough: Δ11.7 ± 0.9 ms). This result demonstrates that the biphasic response is generated exclusively by optogenetic T4/T5 stimulation. It also supports the notion that the formation of visual circuits in flies is largely independent of sensory experience (Karmeier et al., 2001; Hiesinger et al., 2006). Differences between visually intact and blind flies were only discernible >8 ms after stimulus onset in that LPTCs in norpA mutants presumably due to the lack of visual input showed a sustained modest hyperpolarization with a time constant of 0.1 s (Fig. 2, compare B and C, black traces).
Figure 1.

Probing synaptic connectivity between T4/T5 and LPTCs. A, Schematic to illustrate anatomical layout of fly visual neuropils medulla, lobula, and lobula plate. One LPTC of the vertical system (VS) is shown in green with recording electrode; the dendrites arborize in layer 4 of the lobula plate. Examples of two T4 and two T5 cells are depicted in red that receive input onto their dendrites in the medulla and lobula, respectively. Individual terminals providing synaptic input to the lobula plate are located either in layer 3 or 4. Equivalent cells innervating layers 1 and 2 are omitted. A, anterior; P, posterior; M, medial; L, lateral. B, View on a preparation from posterior onto the back of the head (right hemisphere). T4/T5 cells express mCherry-tagged ChR2–H134R (red). A VS cell is filled via a patch electrode with a fluorescent dye (green). C–F, Single confocal images of horizontally sectioned Drosophila brains. C, Immunostaining of GFP (green) and the presynaptic marker synaptotagmin-HA (sytHA, red) expressed in T4 and T5 cells, bruchpilot (brp) is labeled in blue for neuropil reference. sytHA clearly demarcates the four synaptic layers in the lobula plate. D–F, ChR2–H134R-mCherry expression using three driver lines as used for optogenetic experiments. D, T4 and T5 cells; E, T4 cells only; F, cholinergic T4 and T5 cells.
Figure 2.

Synaptic LPTC responses to optogenetic T4/T5 cell stimulation. A, Individual voltage traces of LPTCs (N = 4) responding to optogenetic stimulation of T4 and T5 cells (T4/T5 > ChR2; n = 32 stimuli total). Optic stimuli consisted of 2 ms wide-field light flashes delivered through the microscope objective onto the preparation with a center wavelength and bandwidth of 472/30 nm and an intensity of ∼3 mW mm−2. LPTCs respond with initial biphasic voltage deflections consisting of a fast depolarization and a subsequent hyperpolarization. B, Average of the same traces as in A in black, with SD as shaded area. The blue trace is the response of LPTCs in control flies (Gal4 only) to the same stimulus (N = 4), showing the retina input only. C, Same as B, but with blind flies homozygously carrying the norpA7 mutation (black, N = 7; blue, N = 4). D, Same condition as for black trace in C, but light intensity varied between 0.05 and 22 mW mm−2 (N = 8, SD omitted for clarity). E, Responses were quantified and plotted as absolute (abs.) amplitudes (black) and latencies (magenta) of peak maxima (solid lines) and trough minima (dashed lines). The vertical gray line at 3 mW mm−2 denotes the approximate light intensity for all other optogenetic experiments except for T4/T5/Cha-Split flies. F, Optogenetic stimulation of T4 cells only (norpA7 T4 > ChR2; 3 mW mm−2, N = 5) evokes a biphasic voltage response in LPTCs that is comparable to the joint T4/T5 cell stimulation.
We next investigated the dependence of the optogenetic response on varying stimulus intensities to obtain a quantitative description of the underlying input–output relationship (Fig. 2D,E). Several features became apparent: (1) inhibition had a higher threshold than excitation; (2) the amplitudes increased approximately proportional to the logarithm of the stimulus intensity over a wide range; (3) the latency of the excitatory peak was approximately half of that for the inhibitory trough, a ratio that remained fairly stable across a wide range of intensities; and (4) at high light intensities the voltage progression became triphasic (not quantified).
Since we measured the LPTC responses to stimulation of both T4 and T5 cells at the same time the question arises in how far the two cell types might be differentially connected to LPTCs. We made use of a specific Gal4 line to optogenetically stimulate exclusively T4 cells (Figs. 1E, 2F). LPTC recordings show a biphasic response to 2 ms blue light flashes that is very similar to the joint T4/T5 stimulation at comparable light intensities (Fig. 2, compare C, black trace and F; latency excitatory peak: Δ5.9 ± 0.4 ms, inhibitory trough: Δ13.3 ± 1.3 ms). Due to the lack of a sufficiently selective driver line we were not able to perform corresponding experiments with T5 cells. However, the identical effects of our optogenetic T4 and T4/T5 stimulation argue that both cell types are synaptically connected to LPTCs in similar ways and that the initial sharp EPSP arises by direct excitation of LPTCs by both T4 and T5 terminals. This is to be expected because T4 and T5 cells are individually tuned to moving ON and OFF edges, respectively (Maisak et al., 2013), while LPTCs reliably depolarize in response to both visual stimuli.
The delayed hyperpolarization in LPTCs is less straightforward to explain and might be caused by one of the following mechanisms, which we will further address below: (1) direct synaptic inhibition by T4/T5 cells (slower than direct excitation); (2) feedforward inhibition via an additional cell type between T4/T5 and LPTCs; (3) LPTC intrinsic mechanisms, for instance, depolarization-triggered opening of hyperpolarizing conductances; or (4) feedback inhibition postsynaptic of LPTCs.
T4/T5 cells are primarily cholinergic
Acetylcholine is the primary excitatory neurotransmitter in insect CNS. It is reasonable to assume that at least a substantial fraction of T4/T5 releases acetylcholine onto LPTCs since those express nicotinic cholinergic receptors (nAChRs), depolarize in response to acetylcholine and its agonist carbachol (Brotz and Borst, 1996; Raghu et al., 2009), and receive excitatory preferred direction input, which is eliminated when T4 and T5 cells are genetically silenced (Schnell et al., 2012). However, LPTCs also receive inhibitory null direction input, which is presumably GABAergic (Brotz and Borst, 1996; Single et al., 1997; Raghu et al., 2007). Moreover, genetic expression data and histochemistry have indicated that T4 and T5 cells might also secrete GABA, glutamate, and/or aspartate as neurotransmitters (Strausfeld et al., 1995; Sinakevitch and Strausfeld, 2004; Raghu and Borst, 2011). We therefore asked whether T4/T5 cells employ neurotransmitters other than acetylcholine. First, we took an intersectional genetic approach (“Split Gal4”; Luan et al., 2006) to exclude potential noncholinergic T4/T5 cells from ChR2 expression. We targeted two functional domains (AD and DBD) both required for UAS activation independently to T4/T5 (R42F06-p65-AD) and cholinergic cells (Cha-DBD; Gao et al., 2008), respectively, by two different regulatory elements. Thus, functional transcription factor to activate UAS-ChR2 is reconstituted only in the intersection of the two expression patterns, i.e., in cholinergic T4 and T5 cells. It should be noted that in contrast to the other experimental backgrounds only a single copy of ChR2 was included because homozygous animals were not viable. Confocal images reveal that the resulting expression (T4/T5-p65-AD + Cha-DBD = T4/T5/Cha-Split > ChR2-H134R-mCherry) is generally weaker but otherwise not obviously different compared with T4/T5 > ChR2 (Fig. 1D,F). Notably, optic stimulation of T4/T5/Cha-Split > ChR2 brains (with higher intensities to compensate for weak expression: ∼30 mW mm−2) resulted in initial biphasic synaptic responses in LPTCs that were quite similar to the responses seen when driving ChR2 with T4/T5-Gal4 (compare Figs. 3A, 2B, black trace). Second, we expressed a nuclear reporter (stinger-GFP) using the T4/T5-specific driver line and stained brains with an antibody against choline acetyltransferase (ChAT). Confocal imaging of optic lobes revealed that 99.2% cells labeled with stinger-GFP colocalized with anti-ChAT (Fig. 3B,B′). We also labeled GABAergic neurons in brains of the same genotype with an antibody against vesicular GABA transporter (vGAT). The vast majority (97.6%) of stinger-GFP-labeled cells was clearly vGAT negative (Fig. 3C,C′). Therefore, assuming that T4/T5 cells transmit a single fast neurotransmitter, we conclude that T4/T5 cells are not GABAergic but instead primarily cholinergic.
Figure 3.

T4 and T5 cells are primarily cholinergic. A, Optogenetic stimulation of exclusively cholinergic T4/T5 cells leads to initial depolarization and subsequent hyperpolarization in LPTCs (Split-Gal4 approach: T4/T5–p65-AD + Cha-DBD > ChR2; 30 mW mm−2, N = 8), comparable to T4 and T4/T5 cell stimulation as in Figure 2. The following second excitatory peak is likely caused by retina input. B–C′, Confocal images of immunostained T4/T5-Gal4 > UAS-sti-GFP-expressing brains reveal that the vast majority of T4/T5 cells are (B, B′; 2696/2717: 99.2%) positive for ChAT and (C, C′; 2444/2503: 97.6%) negative for vGAT. Scale bars: B, C, 20 μm; for enlarged insets (B′, C′) 5 μm.
Pharmacologic profile of lobula plate tangential cells
The data so far strongly suggest that T4/T5 cells represent a homogenous group with respect to their cholinergic transmitter phenotype. Therefore, the biphasic effect observed in the LPTC membrane potential upon T4/T5 stimulation must arise by mechanisms postsynaptic of T4/T5 terminals. One possibility might be the existence of antagonistic cholinergic receptors expressed in LPTC dendrites, since both excitatory and inhibitory acetylcholine-gated channels have been documented in invertebrates (Pfeiffer-Linn and Glantz, 1989; Dent, 2010). However, this scenario seems unlikely because acetylcholine and its agonist carbachol elicit strong depolarizations but no hyperpolarizations in LPTCs in Calliphora and Drosophila (Brotz and Borst, 1996; Raghu et al., 2009). We aimed to confirm and extend these findings by dissecting the direct and indirect effects of neurotransmitters pharmacologically. To this end, we pressure injected neurotransmitters via micropipettes into the lobula plate while simultaneously recording from LPTCs. In agreement with the previous studies, injection of 1 mm acetylcholine generated strong excitatory peaks in LPTCs (Fig. 4A–C, white arrows; +10.9 ± 0.7 mV, N = 18). In 17/18 cases, the excitation was followed by a clear hyperpolarizing response smaller in amplitude (−1.9 ± 0.27 mV, N = 18) but with a prolonged time course (Fig. 4A–C, black arrows), reminiscent of the T4/T5 optogenetic stimulation effect albeit on a longer timescale due to the slower stimulus delivery. To quantify these effects relative to each other we divided the negative by the positive stimulus-evoked response integral (see Material and Methods) and obtained a relationship of −0.84 ± 0.16. We then performed acetylcholine injection experiments under conditions where synaptic transmission is silenced (Fig. 4D; N = 7, external solution without Ca2+ and with high Mg2+ concentration). We found excitatory responses comparable to the condition with intact synaptic transmission (+13.5 ± 1.1 mV). However, hyperpolarization was almost absent (−0.3 ± 0.08 mV) and averaged integrated responses relative to excitation amounted to a significantly smaller value (−0.1 ± 0.02) compared with the normal condition (Wilcoxon rank sum test, −0.84 ± 0.16 vs −0.1 ± 0.02: p = 0.001). These results demonstrate that acetylcholine injection evokes a direct depolarizing and an indirect hyperpolarizing response in LPTCs. Moreover, this outcome corroborates the notion that alone acetylcholine release from optogenetically stimulated T4/T5 might underlie the biphasic response in LPTCs. We went on to explore the sensitivity of LPTCs to two other prevalent neurotransmitters. Both pressure-applied GABA and glutamate elicited pronounced inhibitory potential changes (Fig. 4E–H) suggesting that both GABA- and glutamate-gated chloride channels (Cleland, 1996; Hosie et al., 1997) are expressed in LPTCs.
Figure 4.

Responses to neurotransmitter injections and pharmacologic profile of LPTCs. A–H, Representative average voltage traces from single LPTCs in response to five neurotransmitter pressure injections onto the dendrites in the lobula plate are shown (100 ms pulses indicated by small gray bars, neurotransmitters at 1 mm concentration indicated at the top). A–C, Acetylcholine injection evokes an initial depolarizing peak (white arrow) and a subsequent hyperpolarization (black arrow) in LPTCs. D, In conditions where synaptic transmission is silenced (zero Ca2+, high Mg2+ concentration in external solution) depolarization is still present while hyperpolarization is almost completely absent. E–H, Both GABA and glutamate injection leads to strong hyperpolarization in all cells recorded. A′–H′, Responses from the same cells after application of the indicated antagonists: (A′) 15 min 1 μm MLA, (B′) 15 min 100 μm MEC, (C′ + D′) 40 min 10 μm α-BTX, (E′ + G′) 10–15 min 25 μm PTX, (F′ + H′) 25 min 1 μm MLA. The dashed traces in B′, E′, and G′ denote responses after 30–60 min wash following MEC or PTX treatment. MLA and α-BTX effects could not be washed out effectively. A″–H″, Responses of individual cells were quantified as positive (black bars) and negative integrals (gray bars; the period 1 s before the stimulus was used as a baseline and subtracted away from the response 1 s after the stimulus; error bars denote SEM) normalized to the baseline depolarization for acetylcholine and baseline hyperpolarization for GABA and glutamate. A″, N = 5, B″, N = 8, C″, N = 5, D″, N = 4, E″, N = 5, F″, N = 2, G″, N = 5, H″, N = 2. Two-tailed Wilcoxon rank-sum test: n.s., Not significant; p > 0.3; *p < 0.05; **p ≤ 0.01; ***p < 0.001.
Next, we used the pressure-injection assay to establish specificity and effectiveness of available cholinergic and GABAergic antagonists. We consider this strategy essential because neurotoxins can display a considerable degree of cross-reactivity particularly for the functionally diverse group of phylogenetically related pentameric ionotropic receptors in insects (Bai et al., 1992; Barbara et al., 2005; Dent, 2010). We thus combined acetylcholine pressure injection into the lobula plate with patch-clamp recordings from LPTCs and bath perfusion of the nicotinic antagonists MLA, α-BTX (both competitive), and MEC (noncompetitive). We found that 1 μm MLA was most effective and irreversibly eliminated all acetylcholine responses within 10–15 min after administering the drug (Fig. 4A–A″). MEC was less potent and reduced both depolarizing and hyperpolarizing responses at a concentration of 100 μm to 9 and 5%, respectively, with a similar time course (Fig. 4B–B″). This effect, however, was reversible (110% for depolarization and 80% for hyperpolarization) after washing for ∼40 min (N = 7; Fig. 4B′, dashed trace). Depolarization in response to acetylcholine was also blocked by 10 μm α-BTX (30%) within 40 min (Fig. 4C–C″). The longer time course is presumably due to the much larger molecular weight of the α-BTX peptide compared with the other compounds or the different delivery (see Material and Methods). Notably, in contrast to MLA and MEC, α-BTX did not significantly change the indirect inhibitory effect of acetylcholine, which remained at 106% of baseline level. Because insect nAChR subunits are known to substantially differ in their sensitivity to α-BTX (Thany et al., 2007, 2010) this result indicates that α-BTX-sensitive receptors might be expressed on LPTCs while α-BTX-insensitive receptors are located on another cell type also activated by acetylcholine and providing inhibitory input to LPTCs. We confirmed that the hyperpolarizing component in LPTCs in response to acetylcholine in presence of α-BTX is indeed indirect, since, as for the baseline, it is absent in conditions where synaptic release is prevented (Fig. 4D–D″).
We then tested the noncompetitive GABA receptor antagonist PTX in combination with GABA injection onto LPTC dendrites. As expected, 25 μm PTX effectively reduced the hyperpolarizing GABA response to 7% (Fig. 4E–E″; recovery 90% after 50–60 min wash; Fig. 4E′, dashed trace). As a control, we confirmed that the cholinergic antagonist MLA did not have any effect on GABA-evoked hyperpolarization, which remained reliably at baseline levels throughout drug treatment (Fig. 4F–F″). Since glutamate also produces hyperpolarizing conductances in LPTCs in our assay, we wanted to test a potential blocking action of PTX on those. Indeed, PTX reduced glutamate responses to 25% (Fig. 4G–G″; recovery 86% after 30–60 min wash; Fig. 4G′, dashed trace) indicating that PTX does not selectively block GABA-gated receptors but also other ligand-gated chloride channels in insects, in line with previous accounts (Rohrbough and Broadie, 2002; Barbara et al., 2005; Liu and Wilson, 2013). As in combination with GABA, MLA had no discernible effect on the LPTC responses to glutamate (Fig. 4H–H″).
Feedforward inhibition from T4/T5 to LPTCs
The experiments above established that T4/T5 cells are cholinergic and that pressure-applied acetylcholine elicits monosynaptic depolarizing responses in LPTCs. Hence, acetylcholine release from T4/T5 cells most likely directly excites tangential cells. In contrast, the inhibitory component of the biphasic synaptic response in LPTCs upon optogenetic T4/T5 stimulation is probably indirectly elicited by yet unidentified inhibitory neurons. To further demonstrate this point, we compared LPTC responses to optogenetic stimulation of T4/T5 cells before and after the application of the cholinergic antagonists characterized above. Since the action of pharmacologic substances build up rather slowly in vivo we wanted to control for unspecific changes of the synaptic response in LPTCs over time, for instance, caused by synaptic depletion. However, we observed that the biphasic LPTC response did not substantially change at least over 50 individual stimulations and 40 min recording time (Fig. 5A, the black trace represents average baseline responses, the red trace recordings from the same cells 40 min later). Next, we combined T4/T5 stimulation with bath application of the potent and specific cholinergic antagonist MLA. Indeed, in full agreement with indirect synaptic inhibition, both the excitatory and the inhibitory responses were almost completely eliminated within 15 min after applying the drug (Fig. 5B, red trace). We then combined T4/T5 stimulation with the less potent cholinergic antagonist MEC (Fig. 5C). Now, the inhibitory component was abolished but a slowed excitatory component remained. Like in the acetylcholine pressure application assay, effects of MEC were largely reversible (data not shown). The residual excitation in presence of MEC with absent inhibition could mean that cholinergic receptors on LPTCs are less affected by MEC than receptors on the putative inhibitory neuron type. The existence of nAChRs that differ in their sensitivity to MEC has, for instance, been suggested in cockroach DUM neurons (Courjaret and Lapied, 2001). Alternatively, regardless of nicotinic receptor properties, the putative inhibitory interneurons might have a higher threshold to become activated by T4/T5 cells than the LPTCs. The latter explanation is supported by experiments in which reduced light intensities were applied to optogenetically stimulate T4/T5 cells (<0.5 mW mm2). Similar to MEC treatment, low light intensities resulted in slow and predominantly depolarizing responses in LPTCs (Fig. 2D,E). We wondered how the biphasic response would be affected by the more selective drug α-BTX. As expected, the excitatory peak was effectively reduced (Fig. 5D, red trace). However, the IPSP was virtually unchanged similar to the result obtained by acetylcholine injection into the lobula plate (Fig. 4C–C″). This finding demonstrates that T4/T5-mediated inhibition in LPTCs does not require a preceding depolarization in those and thus rules out LPTC-intrinsic depolarization-triggered processes and feedback inhibition downstream of LPTCs. This conclusion is also supported by direct stimulation of ChR2-expressing tangential cells, which produced strong depolarizations without following hyperpolarizing troughs (N = 3, data not shown). Given that at least 10 nAChR subunits are encoded by the Drosophila genome (Jones and Sattelle, 2010), and expressed in various combinations in the optic lobe (Takemura et al., 2011), our experiments point toward a more complex connectivity between T4/T5 and LPTCs than just a direct cholinergic synapse. Rather, T4 and T5 cells additionally activate a yet unidentified cell type potentially expressing α-BTX-insensitive receptors, which in turn supplies inhibition to LPTCs.
Figure 5.
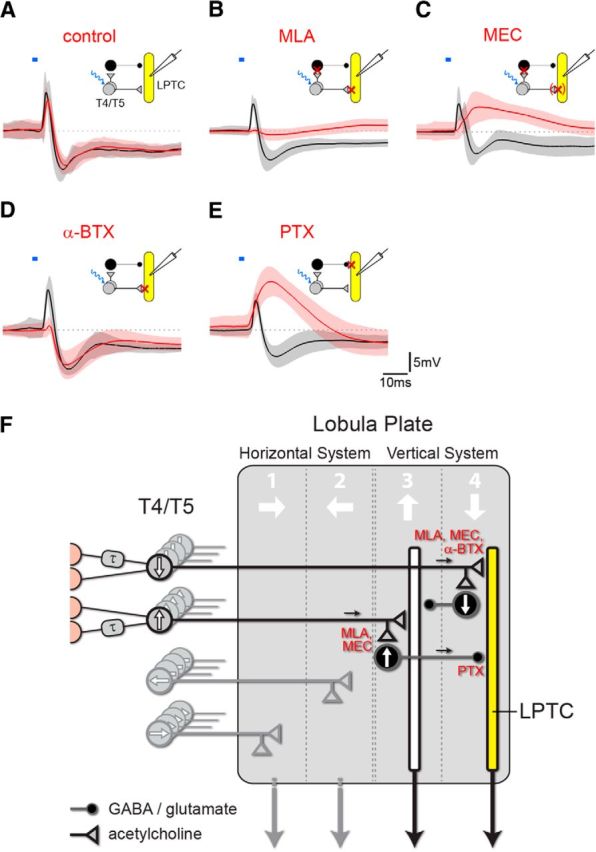
Effects of neurotransmitter antagonists on T4/T5-mediated synaptic potentials in LPTCs. A, Biphasic LPTC voltage response to optogenetic T4/T5 cell stimulation (T4/T5 > ChR2; 2 ms 472/30 nm at ∼3 mW mm−2) over at least 50 individual stimulations and 40 min recording time (N = 5; black, baseline; red, the same cells 40 min later). Amplitude and dynamics have not obviously changed over time. B–E, Responses of LPTCs (same genotype and stimulation) before (black trace) and after (red trace) indicated drug application (1 μm MLA: N = 5, 15 min; 100–200 μm MEC: N = 4, 15 min; 10 μm α-BTX: N = 6, 40 min; 25 μm PTX: N = 7, 15 min). The schematic insets illustrate the connectivity supported by the data between T4/T5 and LPTCs with a direct excitatory connection and an inhibitory indirect arm. Synaptic targets of the individual antagonists are indicated with red crosses. The bracketed cross for MEC treatment indicates a potentially incomplete block. F, Connectivity model of the lobula plate that incorporates results from this study as well as previously published data (see Discussion). T4 and T5 cells terminate in one of four lobula plate layers according to their direction tuning where they directly connect to LPTC dendrites (yellow) in the same layer via cholinergic synapses and thus provide preferred direction excitation. T4 and T5 cells with opposite tuning terminate in the adjacent layer and provide feedforward null direction input to the same LPTC via putative GABAergic or glutamatergic inhibitory neurons. The inferred synaptic blocking sites of the antagonists (red) are indicated.
Furthermore, we also combined optogenetic T4/T5 stimulation with bath perfusion of PTX (Fig. 5E). LPTCs responded with depolarizations of rise time kinetics similar to the baseline but with enhanced peak amplitude. Importantly, fully in agreement with an indirect inhibitory synaptic connection from T4/T5 to the LPTCs, PTX strongly delayed and reduced hyperpolarizing effects of T4/T5 optogenetic stimulation. Since hyperpolarizing responses of LPTCs to both GABA and glutamate injection could be blocked by PTX (Fig. 4E′,G′) this indicates that the postulated inhibitory cell type could be either GABAergic or glutamatergic.
Discussion
The visual ganglia of insects have been powerful model systems to address questions related to visual processing and circuit function largely because of experimental accessibility and the existence of individually identifiable neurons (Borst, 2009; Borst et al., 2010; Fotowat and Gabbiani, 2011; Homberg et al., 2011). However, due to the intricate connectivity and small sizes of most visual interneurons detailed circuit information has been difficult to establish. Here, we present a strategy to probe functional synaptic connectivity between identified neurons in Drosophila by combining optogenetic stimulation, electrophysiology, and pharmacology. The outcome of this work reveals a new synaptic processing stage in the fly motion vision circuitry.
Our experiments have established that wide-field visual motion-sensitive lobula plate tangential cells receive fast excitation when T4/T5 cells are optogenetically stimulated. We have shown that the excitatory input is cholinergic because it can be effectively blocked by selective nicotinic antagonists. The short latency of the optogenetic response (<3 ms after light onset; not taking into account the delay caused by ChR2-H134R opening kinetics) suggests that this excitatory cholinergic connection of T4/T5 cells onto LPTCs is most likely direct, well in agreement with functional, light microcopy and ultrastructure data (Fischbach and Dittrich, 1989; Strausfeld and Lee, 1991; Schnell et al., 2012; Maisak et al., 2013). Moreover, all T4/T5 somata are labeled by a choline acetyltransferase-specific antibody and acetylcholine pressure injection onto LPTC dendrites also elicits strong excitatory peaks in conditions where synaptic release is blocked (zero Ca2+/high Mg2+). These optogenetic and pressure injection paradigms provide opportunities to explore synaptic ligand-gated receptors and their pharmacologic profiles on the level of individually identifiable neurons. In Drosophila, 10 nAChR subunits have been identified but their individual properties are not well understood largely because heterologous expression of functional insect nAChRs has been exceedingly difficult (Sattelle et al., 2005; Thany et al., 2007; Jones and Sattelle, 2010; Millar and Lansdell, 2010). LPTCs have been proposed to express Dα7 nAChR subunits (Raghu et al., 2009) that are candidates to form channels of an α-BTX-sensitive type (Thany et al., 2007). In line with this view, depolarizing responses to acetylcholine and carbachol can be largely eliminated by α-BTX (Fig. 4D–D″; Brotz and Borst, 1996). Somewhat surprisingly, however, in Dα7-mutant flies visual responses in LPTCs are largely unaltered and a fluorophore-conjugated α-BTX probe still binds to LPTC dendrites (Raghu et al., 2009) suggesting that other α-BTX-sensitive subunits can substitute for Dα7 absence. It remains to be seen whether the cholinergic receptors are of heteromeric or homomeric types. Transcript profiling of individual LPTCs could help to assign nicotinic subunit composition to identified neurons (Takemura et al., 2011) and perhaps also reveal post-transcriptional modifications that might further functionally diversify receptors in a cell-specific manner (Sattelle et al., 2005). This approach in combination with whole-cell recordings, optogenetic stimulation, neurotransmitter injection, and genetic manipulation would open up this system for detailed analyses of the pharmacologic properties of nicotinic and other channels at the level of individual subunits and functional domains.
In addition to direct excitation, both optogenetic stimulation of T4/T5 cells and acetylcholine pressure injection onto LPTC dendrites elicit delayed hyperpolarization. This inhibitory component is indirect because it can be eliminated by the cholinergic antagonists MLA and MEC (Figs. 4A–A″,B–B″, 5B,C) and because it is absent for acetylcholine injection when synaptic transmission is blocked (Fig. 4D). We therefore propose that cholinergic T4/T5 cells excite yet unidentified local interneurons, which supply inhibition to LPTCs. Such putative local interneurons might express acetylcholine receptors of an α-BTX-insensitive type because this neurotoxin had no effect on inhibition evoked by optogenetic T4/T5 cell stimulation and acetylcholine injection (Figs. 4C–C″, 5D). What is the functional significance of the T4/T5 cell-mediated direct excitation and indirect inhibition onto LPTCs? During visual stimulation, LPTCs receive two kinds of inputs: excitation tuned to their preferred direction and inhibition tuned to the opposite/null direction. Since T4/T5 cells have been identified to represent the motion-sensitive input elements to the lobula plate (Schnell et al., 2012; Maisak et al., 2013; Takemura et al., 2013) three scenarios seemed conceivable to underlie preferred and null direction responses in LPTCs. (1) T4/T5 cells convey signals to LPTCs via a single neurotransmitter with graded positive and negative release modulations from a spontaneous level, similar to photoreceptor terminals. (2) Synaptic connections between T4/T5 and LPTCs comprise two antagonistic types, for instance, implementing different transmitter systems mediating oppositely tuned excitation and inhibition. In line with this model T4 and T5 cells have been suggested to release acetylcholine, GABA, glutamate, and aspartate as neurotransmitters (Strausfeld et al., 1995; Sinakevitch and Strausfeld, 2004; Raghu and Borst, 2011; Raghu et al., 2011). (3) Excitatory output from T4/T5 cells is partly sign inverted and fed forward to LPTCs by inhibitory cells in a direction-specific manner. Possibility 1 appears highly unlikely on the basis of current injections in LPTCs during visual motion stimulation (Borst et al., 1995, 2010; Joesch et al., 2008). These experiments reveal that the synaptic currents underlying preferred and null direction responses are mediated by different synaptic receptors because the responses have markedly different reversal potentials. As for the remaining possibilities, previous data (Fischbach and Dittrich, 1989; Maisak et al., 2013; Takemura et al., 2013) and our cell counts indicate eight functional types of T4/T5 per retinotopic column: each tuned to one of two contrast polarities and one of the four cardinal directions of motion. This number is difficult to reconcile with the second model, because it would require a further subdivision of T4/T5 cells according to transmitter profile. Moreover, individual LPTC dendrites generally do not anatomically overlap with T4/T5 terminals tuned to the LPTC's null direction. Rather, our results clearly support the third possibility because, as we have shown, all T4/T5 cells are in fact cholinergic and supply direct excitation and indirect inhibition to LPTCs.
We thus favor a model where LPTC dendrites receive cholinergic input during preferred direction motion from T4/T5 terminals in one layer of the lobula plate where they overlap, and input from the neighboring layer conveyed by yet unidentified inhibitory cells during null direction motion (Fig. 5F). Furthermore, the postulated inhibitory neurons might additionally inhibit presynaptic T4/T5 terminals in the adjacent layer and thereby antagonize excitatory inputs to tangential cells both presynaptically and postsynaptically at the same time. Such a wiring would constitute a recurrent inhibitory motive and potentially explain why optogenetic stimulation of all T4/T5 cells with high intensities generates a triphasic voltage progression in tangential cells (Fig. 2D, red trace). In line with this idea, prolonged optogenetic T4/T5 cell stimulation evokes membrane potential oscillations in tangential cells (data not shown). The transmitter used by neurons responsible for null direction inhibition has been suggested to be GABA. This conclusion is primarily based on experiments in which PTX has been used to block inhibition (Schmid and Bülthoff, 1988; Egelhaaf et al., 1990; Brotz and Borst, 1996; Single et al., 1997). However, we have found that LPTCs respond with hyperpolarization both to GABA and to glutamate injection, and that both responses can be blocked by PTX. These results challenge the notion that GABA underlies the null direction responses in LPTCs and suggest glutamate as another candidate neurotransmitter that should be taken into consideration.
The identification of the neurons underlying null direction inhibition will be required for the verification of the underlying neurotransmitter system and to complete the suggested wiring model of the lobula plate. Previous anatomical studies might provide an entry point. Fischbach and Dittrich (1989), Raghu et al. (2011, 2013), and Raghu and Borst (2011) describe cells such as Tlp, Lpi, and Y neurons, which arborize in more than one lobula plate layer but also in other neuropils and are therefore not immediately persuasive to fulfill the postulated role. Additional anatomically analyses and identification of novel cell types might therefore be necessary. Genetic control over the postulated inhibitory neurons would facilitate the study of the integration and functional implications of antagonistic preferred and null direction inputs on tangential cells. Depending on the anatomical and physiological properties of the postulated inhibitory cells some null direction-specific processing might occur. For instance, while ON and OFF motion vision pathways likely converge first at the level of the tangential cells during preferred direction motion (Maisak et al., 2013), it remains to be determined whether null direction ON and OFF motion signals are perhaps integrated in the inhibitory neurons presynaptic to tangential cells.
Footnotes
The authors declare no competing financial interests.
This work was supported by the Max-Planck-Society and the CRC 870 of the Deutsche Forschungsgemeinschaft. Preparatory experiments were carried out at the Marine Biological Laboratory (Woods Hole, MA), funded by a Grass Fellowship (A.S.M.). We are greatly indebted to Gerald Rubin, Aljoscha Nern, and Barry Dickson for generously sending us driver lines before publishing. We would also like to thank Bettina Schnell for teaching A.S.M. lobula plate tangential cell recordings; Chi-Hon Lee, Stefan Pulver, and Andreas Prokop for kindly providing fly strains; Johannes Plett for advice on the LED arena; and Wolfgang Essbauer, Christian Theile, Renate Gleich, Dieter Mauss, and the MPI workshop for excellent technical support. We are grateful to Alexander Arenz, Armin Bahl, and Jürgen Haag for critically reading this manuscript.
References
- Bahl A, Ammer G, Schilling T, Borst A. Object tracking in motion-blind flies. Nat Neurosci. 2013;16:730–738. doi: 10.1038/nn.3386. [DOI] [PubMed] [Google Scholar]
- Bai D, Erdbrugger H, Breer H, Sattelle DB. Acetylcholine receptors of thoracic dorsal midline neurones in the cockroach, Periplaneta americana. Arch Insect Biochem Physiol. 1992;21:289–301. doi: 10.1002/arch.940210406. [DOI] [PubMed] [Google Scholar]
- Barbara GS, Zube C, Rybak J, Gauthier M, Grünewald B. Acetylcholine, GABA and glutamate induce ionic currents in cultured antennal lobe neurons of the honeybee, Apis mellifera. J Comp Physiol A Neuroethol Sens Neural Behav Physiol. 2005;191:823–836. doi: 10.1007/s00359-005-0007-3. [DOI] [PubMed] [Google Scholar]
- Borst A. Drosophila's view on insect vision. Curr Biol. 2009;19:R36–R47. doi: 10.1016/j.cub.2008.11.001. [DOI] [PubMed] [Google Scholar]
- Borst A, Euler T. Seeing things in motion: models, circuits, and mechanisms. Neuron. 2011;71:974–994. doi: 10.1016/j.neuron.2011.08.031. [DOI] [PubMed] [Google Scholar]
- Borst A, Egelhaaf M, Haag J. Mechanisms of dendritic integration underlying gain control in fly motion-sensitive interneurons. J Comput Neurosci. 1995;2:5–18. doi: 10.1007/BF00962705. [DOI] [PubMed] [Google Scholar]
- Borst A, Haag J, Reiff DF. Fly motion vision. Annu Rev Neurosci. 2010;33:49–70. doi: 10.1146/annurev-neuro-060909-153155. [DOI] [PubMed] [Google Scholar]
- Brotz TM, Borst A. Cholinergic and GABAergic receptors on fly tangential cells and their role in visual motion detection. J Neurophysiol. 1996;76:1786–1799. doi: 10.1152/jn.1996.76.3.1786. [DOI] [PubMed] [Google Scholar]
- Clark DA, Bursztyn L, Horowitz MA, Schnitzer MJ, Clandinin TR. Defining the computational structure of the motion detector in Drosophila. Neuron. 2011;70:1165–1177. doi: 10.1016/j.neuron.2011.05.023. [DOI] [PMC free article] [PubMed] [Google Scholar]
- Cleland TA. Inhibitory glutamate receptor channels. Mol Neurobiol. 1996;13:97–136. doi: 10.1007/BF02740637. [DOI] [PubMed] [Google Scholar]
- Courjaret R, Lapied B. Complex intracellular messenger pathways regulate one type of neuronal alpha-bungarotoxin-resistant nicotinic acetylcholine receptors expressed in insect neurosecretory cells (dorsal unpaired median neurons) Mol Pharmacol. 2001;60:80–91. [PubMed] [Google Scholar]
- Dent JA. The evolution of pentameric ligand-gated ion channels. Adv Exp Med Biol. 2010;683:11–23. doi: 10.1007/978-1-4419-6445-8_2. [DOI] [PubMed] [Google Scholar]
- Egelhaaf M, Borst A, Pilz B. The role of GABA in detecting visual motion. Brain Res. 1990;509:156–160. doi: 10.1016/0006-8993(90)90325-6. [DOI] [PubMed] [Google Scholar]
- Eichner H, Joesch M, Schnell B, Reiff DF, Borst A. Internal structure of the fly elementary motion detector. Neuron. 2011;70:1155–1164. doi: 10.1016/j.neuron.2011.03.028. [DOI] [PubMed] [Google Scholar]
- Fei H, Chow DM, Chen A, Romero-Calderón R, Ong WS, Ackerson LC, Maidment NT, Simpson JH, Frye MA, Krantz DE. Mutation of the Drosophila vesicular GABA transporter disrupts visual figure detection. J Exp Biol. 2010;213:1717–1730. doi: 10.1242/jeb.036053. [DOI] [PMC free article] [PubMed] [Google Scholar]
- Fischbach KF, Dittrich A. The optic lobe of Drosophila melanogaster. I. A Golgi analysis of wild-type structure. Cell Tissue Res. 1989;258:441–475. [Google Scholar]
- Fotowat H, Gabbiani F. Collision detection as a model for sensory-motor integration. Annu Rev Neurosci. 2011;34:1–19. doi: 10.1146/annurev-neuro-061010-113632. [DOI] [PubMed] [Google Scholar]
- Gao S, Takemura SY, Ting CY, Huang S, Lu Z, Luan H, Rister J, Thum AS, Yang M, Hong ST, Wang JW, Odenwald WF, White BH, Meinertzhagen IA, Lee CH. The neural substrate of spectral preference in Drosophila. Neuron. 2008;60:328–342. doi: 10.1016/j.neuron.2008.08.010. [DOI] [PMC free article] [PubMed] [Google Scholar]
- Hassenstein B, Reichardt W. Systemtheoretische Analyse der Zeit-, Reihenfolgen- und Vorzeichenauswertung bei der Bewegungsperzeption des Rüsselkäfers Chlorophanus. Z Naturforsch. 1956;11b:513–524. [Google Scholar]
- Hausen K. Motion sensitive interneurons in the optomotor system of the fly I. The horizontal cells: structure and signals. Biol Cybernet. 1982;45:143–156. doi: 10.1007/BF00335241. [DOI] [Google Scholar]
- Hausen K. Photoreception vision invertebrates, NATO ASI Series. Vol 74. New York: Springer; 1984. The lobula-complex of the fly: structure, function and significance in visual behaviour; pp. 523–559. [Google Scholar]
- Hengstenberg R, Hausen K, Hengstenberg B. The number and structure of giant vertical cells (VS) in the lobula plate of the blowfly Calliphora erythrocephala. J Comp Physiol A Neuroethol Sens Neural Behav Physiol. 1982;149 [Google Scholar]
- Hiesinger PR, Zhai RG, Zhou Y, Koh TW, Mehta SQ, Schulze KL, Cao Y, Verstreken P, Clandinin TR, Fischbach KF, Meinertzhagen IA, Bellen HJ. Activity-independent prespecification of synaptic partners in the visual map of Drosophila. Curr Biol. 2006;16:1835–1843. doi: 10.1016/j.cub.2006.07.047. [DOI] [PMC free article] [PubMed] [Google Scholar]
- Homberg U, Heinze S, Pfeiffer K, Kinoshita M, el Jundi B. Central neural coding of sky polarization in insects. Philos Trans R Soc Lond B Biol Sci. 2011;366:680–687. doi: 10.1098/rstb.2010.0199. [DOI] [PMC free article] [PubMed] [Google Scholar]
- Hosie AM, Aronstein K, Sattelle DB, ffrench-Constant RH. Molecular biology of insect neuronal GABA receptors. Trends Neurosci. 1997;20:578–583. doi: 10.1016/S0166-2236(97)01127-2. [DOI] [PubMed] [Google Scholar]
- Hotta Y, Benzer S. Genetic dissection of the Drosophila nervous system by means of mosaics. Proc Natl Acad Sci U S A. 1970;67:1156–1163. doi: 10.1073/pnas.67.3.1156. [DOI] [PMC free article] [PubMed] [Google Scholar]
- Joesch M, Plett J, Borst A, Reiff DF. Response properties of motion-sensitive visual interneurons in the lobula plate of Drosophila melanogaster. Curr Biol. 2008;18:368–374. doi: 10.1016/j.cub.2008.02.022. [DOI] [PubMed] [Google Scholar]
- Joesch M, Schnell B, Raghu SV, Reiff DF, Borst A. ON and OFF pathways in Drosophila motion vision. Nature. 2010;468:300–304. doi: 10.1038/nature09545. [DOI] [PubMed] [Google Scholar]
- Joesch M, Weber F, Eichner H, Borst A. Functional specialization of parallel motion detection circuits in the fly. J Neurosci. 2013;33:902–905. doi: 10.1523/JNEUROSCI.3374-12.2013. [DOI] [PMC free article] [PubMed] [Google Scholar]
- Jones AK, Sattelle DB. Diversity of insect nicotinic acetylcholine receptor subunits. Adv Exp Med Biol. 2010;683:25–43. doi: 10.1007/978-1-4419-6445-8_3. [DOI] [PubMed] [Google Scholar]
- Karmeier K, Tabor R, Egelhaaf M, Krapp HG. Early visual experience and the receptive-field organization of optic flow processing interneurons in the fly motion pathway. Vis Neurosci. 2001;18:1–8. doi: 10.1017/S0952523801181010. [DOI] [PubMed] [Google Scholar]
- Liu WW, Wilson RI. Glutamate is an inhibitory neurotransmitter in the Drosophila olfactory system. Proc Natl Acad Sci U S A. 2013;110:10294–10299. doi: 10.1073/pnas.1220560110. [DOI] [PMC free article] [PubMed] [Google Scholar]
- Löhr R, Godenschwege T, Buchner E, Prokop A. Compartmentalization of central neurons in Drosophila: a new strategy of mosaic analysis reveals localization of presynaptic sites to specific segments of neurites. J Neurosci. 2002;22:10357–10367. doi: 10.1523/JNEUROSCI.22-23-10357.2002. [DOI] [PMC free article] [PubMed] [Google Scholar]
- Luan H, Peabody NC, Vinson CR, White BH. Refined spatial manipulation of neuronal function by combinatorial restriction of transgene expression. Neuron. 2006;52:425–436. doi: 10.1016/j.neuron.2006.08.028. [DOI] [PMC free article] [PubMed] [Google Scholar]
- Maimon G, Straw AD, Dickinson MH. Active flight increases the gain of visual motion processing in Drosophila. Nat Neurosci. 2010;13:393–399. doi: 10.1038/nn.2492. [DOI] [PubMed] [Google Scholar]
- Maisak MS, Haag J, Ammer G, Serbe E, Meier M, Leonhardt A, Schilling T, Bahl A, Rubin GM, Nern A, Dickson BJ, Reiff DF, Hopp E, Borst A. A directional tuning map of Drosophila elementary motion detectors. Nature. 2013;500:212–216. doi: 10.1038/nature12320. [DOI] [PubMed] [Google Scholar]
- Mattis J, Tye KM, Ferenczi EA, Ramakrishnan C, O'Shea DJ, Prakash R, Gunaydin LA, Hyun M, Fenno LE, Gradinaru V, Yizhar O, Deisseroth K. Principles for applying optogenetic tools derived from direct comparative analysis of microbial opsins. Nat Methods. 2012;9:159–172. doi: 10.1038/nmeth.1808. [DOI] [PMC free article] [PubMed] [Google Scholar]
- Millar NS, Lansdell SJ. Characterisation of insect nicotinic acetylcholine receptors by heterologous expression. Adv Exp Med Biol. 2010;683:65–73. doi: 10.1007/978-1-4419-6445-8_6. [DOI] [PubMed] [Google Scholar]
- Nagel G, Brauner M, Liewald JF, Adeishvili N, Bamberg E, Gottschalk A. Light activation of channelrhodopsin-2 in excitable cells of Caenorhabditis elegans triggers rapid behavioral responses. Curr Biol. 2005;15:2279–2284. doi: 10.1016/j.cub.2005.11.032. [DOI] [PubMed] [Google Scholar]
- Pfeiffer BD, Jenett A, Hammonds AS, Ngo TT, Misra S, Murphy C, Scully A, Carlson JW, Wan KH, Laverty TR, Mungall C, Svirskas R, Kadonaga JT, Doe CQ, Eisen MB, Celniker SE, Rubin GM. Tools for neuroanatomy and neurogenetics in Drosophila. Proc Natl Acad Sci U S A. 2008;105:9715–9720. doi: 10.1073/pnas.0803697105. [DOI] [PMC free article] [PubMed] [Google Scholar]
- Pfeiffer-Linn C, Glantz RM. Acetylcholine and GABA mediate opposing actions on neuronal chloride channels in crayfish. Science. 1989;245:1249–1251. doi: 10.1126/science.2476848. [DOI] [PubMed] [Google Scholar]
- Pulver SR, Pashkovski SL, Hornstein NJ, Garrity PA, Griffith LC. Temporal dynamics of neuronal activation by Channelrhodopsin-2 and TRPA1 determine behavioral output in Drosophila larvae. J Neurophysiol. 2009;101:3075–3088. doi: 10.1152/jn.00071.2009. [DOI] [PMC free article] [PubMed] [Google Scholar]
- Raghu SV, Borst A. Candidate glutamatergic neurons in the visual system of Drosophila. PLoS One. 2011;6:e19472. doi: 10.1371/journal.pone.0019472. [DOI] [PMC free article] [PubMed] [Google Scholar]
- Raghu SV, Joesch M, Borst A, Reiff DF. Synaptic organization of lobula plate tangential cells in Drosophila: gamma-aminobutyric acid receptors and chemical release sites. J Comp Neurol. 2007;502:598–610. doi: 10.1002/cne.21319. [DOI] [PubMed] [Google Scholar]
- Raghu SV, Joesch M, Sigrist SJ, Borst A, Reiff DF. Synaptic organization of lobula plate tangential cells in Drosophila: Dalpha7 cholinergic receptors. J Neurogenet. 2009;23:200–209. doi: 10.1080/01677060802471684. [DOI] [PubMed] [Google Scholar]
- Raghu SV, Reiff DF, Borst A. Neurons with cholinergic phenotype in the visual system of Drosophila. J Comp Neurol. 2011;519:162–176. doi: 10.1002/cne.22512. [DOI] [PubMed] [Google Scholar]
- Raghu SV, Claussen J, Borst A. Neurons with GABAergic phenotype in the visual system of Drosophila. J Comp Neurol. 2013;521:252–265. doi: 10.1002/cne.23208. [DOI] [PubMed] [Google Scholar]
- Rister J, Pauls D, Schnell B, Ting CY, Lee CH, Sinakevitch I, Morante J, Strausfeld NJ, Ito K, Heisenberg M. Dissection of the peripheral motion channel in the visual system of Drosophila melanogaster. Neuron. 2007;56:155–170. doi: 10.1016/j.neuron.2007.09.014. [DOI] [PubMed] [Google Scholar]
- Robinson IM, Ranjan R, Schwarz TL. Synaptotagmins I and IV promote transmitter release independently of Ca(2+) binding in the C(2)A domain. Nature. 2002;418:336–340. doi: 10.1038/nature00915. [DOI] [PubMed] [Google Scholar]
- Rohrbough J, Broadie K. Electrophysiological analysis of synaptic transmission in central neurons of Drosophila larvae. J Neurophysiol. 2002;88:847–860. doi: 10.1152/jn.2002.88.2.847. [DOI] [PubMed] [Google Scholar]
- Sattelle DB, Jones AK, Sattelle BM, Matsuda K, Reenan R, Biggin PC. Edit, cut and paste in the nicotinic acetylcholine receptor gene family of Drosophila melanogaster. Bioessays. 2005;27:366–376. doi: 10.1002/bies.20207. [DOI] [PubMed] [Google Scholar]
- Schmid A, Bülthoff H. Using neuropharmacology to distinguish between excitatory and inhibitory movement detection mechanisms in the fly Calliphora erythrocephala. Biol Cybernet. 1988;59:71–80. doi: 10.1007/BF00317769. [DOI] [Google Scholar]
- Schnell B, Raghu SV, Nern A, Borst A. Columnar cells necessary for motion responses of wide-field visual interneurons in Drosophila. J Comp Physiol A. 2012;198:389–395. doi: 10.1007/s00359-012-0716-3. [DOI] [PMC free article] [PubMed] [Google Scholar]
- Silies M, Gohl DM, Fisher YE, Freifeld L, Clark DA, Clandinin TR. Modular use of peripheral input channels tunes motion-detecting circuitry. Neuron. 2013;79:111–127. doi: 10.1016/j.neuron.2013.04.029. [DOI] [PMC free article] [PubMed] [Google Scholar]
- Sinakevitch I, Strausfeld NJ. Chemical neuroanatomy of the fly's movement detection pathway. J Comp Neurol. 2004;468:6–23. doi: 10.1002/cne.10929. [DOI] [PubMed] [Google Scholar]
- Single S, Haag J, Borst A. Dendritic computation of direction selectivity and gain control in visual interneurons. J Neurosci. 1997;17:6023–6030. doi: 10.1523/JNEUROSCI.17-16-06023.1997. [DOI] [PMC free article] [PubMed] [Google Scholar]
- Strausfeld NJ, Lee JK. Neuronal basis for parallel visual processing in the fly. Vis Neurosci. 1991;7:13–33. doi: 10.1017/S0952523800010919. [DOI] [PubMed] [Google Scholar]
- Strausfeld NJ, Kong A, Milde JJ, Gilbert C, Ramaiah L. Oculomotor control in calliphorid flies: GABAergic organization in heterolateral inhibitory pathways. J Comp Neurol. 1995;361:298–320. doi: 10.1002/cne.903610208. [DOI] [PubMed] [Google Scholar]
- Takagawa K, Salvaterra P. Analysis of choline acetyltransferase protein in temperature sensitive mutant flies using newly generated monoclonal antibody. Neurosci Res. 1996;24:237–243. doi: 10.1016/0168-0102(95)00999-X. [DOI] [PubMed] [Google Scholar]
- Takemura SY, Bharioke A, Lu Z, Nern A, Vitaladevuni S, Rivlin PK, Katz WT, Olbris DJ, Plaza SM, Winston P, Zhao T, Horne JA, Fetter RD, Takemura S, Blazek K, Chang LA, Ogundeyi O, Saunders MA, Shapiro V, Sigmund C, et al. A visual motion detection circuit suggested by Drosophila connectomics. Nature. 2013;500:175–181. doi: 10.1038/nature12450. [DOI] [PMC free article] [PubMed] [Google Scholar]
- Takemura SY, Karuppudurai T, Ting CY, Lu Z, Lee CH, Meinertzhagen IA. Cholinergic circuits integrate neighboring visual signals in a Drosophila motion detection pathway. Curr Biol. 2011;21:2077–2084. doi: 10.1016/j.cub.2011.10.053. [DOI] [PMC free article] [PubMed] [Google Scholar]
- Thany SH. Electrophysiological studies and pharmacological properties of insect native nicotinic acetylcholine receptors. Adv Exp Med Biol. 2010;683:53–63. doi: 10.1007/978-1-4419-6445-8_5. [DOI] [PubMed] [Google Scholar]
- Thany SH, Lenaers G, Raymond-Delpech V, Sattelle DB, Lapied B. Exploring the pharmacological properties of insect nicotinic acetylcholine receptors. Trends Pharmacol Sci. 2007;28:14–22. doi: 10.1016/j.tips.2006.11.006. [DOI] [PubMed] [Google Scholar]
- Tuthill JC, Nern A, Holtz SL, Rubin GM, Reiser MB. Contributions of the 12 neuron classes in the fly lamina to motion vision. Neuron. 2013;79:128–140. doi: 10.1016/j.neuron.2013.05.024. [DOI] [PMC free article] [PubMed] [Google Scholar]