

Abstract
When performing sequences of actions, we constantly keep track of our current position in the sequence relative to the overall goal. The present study searched for neural representations of sequence progression in corticostriatal circuits. Neurons within the anterior cingulate cortex (ACC) and its target region in the dorsal striatum (DS) were recorded from simultaneously as rats performed different sequences of lever presses. We analyzed the responses of the neurons to presses occurring in the “first,” “second,” or “third” serial position regardless of the particular sequence or physical levers. Principal component analysis revealed that the main source of firing rate variance in the ACC was a smooth ramp-like change as the animal progressed through the sequence toward the reward. No such smooth-ramping activity was observed in DS ensembles as firing tended to be tightly linked to each action. In the ACC, the progression in firing was observed only for correct choices and not errors, whereas in the DS, firing associated with each action in a sequence was similar regardless of whether the action was correct or not. Therefore, different forms of a signal exist within corticostriatal circuits that evolve across a sequence of actions, with DS ensembles tracking every action and ACC ensembles tracking actual progress toward the goal.
Keywords: anterior cingulate cortex, dorsal striatum, electrophysiology, ensemble, goal, sequence
Introduction
When performing a sequence of actions, one must continually track progress to know which actions are still required to attain the goal. As actions progress in the sequence, there is a growing anticipation or expectancy about receiving the reward. This anticipation can be dissociated from the actions themselves and helps one stay on track in the face of distractions or errors. The present study investigated the neural correlates of sequence progression simultaneously in the anterior cingulate cortex (ACC) and dorsal striatum (DS).
Actions are encoded in numerous brain regions; however, circuits involving the frontal cortex and striatum play a particularly important role in the flexible encoding of action sequences. In the DS, neurons with strong action encoding tend to fire when the rat is performing multiple actions, but only when the actions occur within a specific sequence and not when they occur in isolation (Aldridge and Berridge, 1998; Schmitzer-Torbert and Redish, 2004). Most frontal regions contain neurons that selectively encode the serial position of each action in a sequence (Barone and Joseph, 1989; Clower and Alexander, 1998; Procyk et al., 2000; Ninokura et al., 2004; Ryou and Wilson, 2004; Mushiake et al., 2006; Averbeck and Lee, 2007; Berdyyeva and Olson, 2010), with a particularly interesting form occurring in the ACC. Specifically, some ACC neurons fire progressively more following the completion of each action or subtask that brings the animal closer to a goal (Shidara and Richmond, 2002; Toda et al., 2012). This progressive increase in activity is referred to as a “reward expectancy” signal.
A reward expectancy signal must be both highly dynamic and integrative since at any point in time the degree of expectancy depends on what actions have been performed as well as actions yet to be performed. A reward expectancy signal is also likely to be critical for proposed functions of the ACC centered on reward processing (Pratt and Mizumori, 2001; Matsumoto et al., 2003; Rushworth et al., 2011; Cowen et al., 2012) or assigning value to actions (Kennerley et al., 2009). In parallel, dopamine signals in the striatum may be related to sustained motivation toward the final goal (Howe et al., 2013). Reward expectancy representations in the ACC and possibly the DS could ultimately be used by the brain to track progress and could help keep the organism stay focused on the task at hand in the face of setbacks or distractions.
To gain further insights into the neural basis of reward expectancy signals occurring during action sequencing, ensembles of neurons were recorded simultaneously from the ACC and the portion of the DS receiving afferents from the ACC (Sesack et al., 1989) while rats performed different sequences of actions that led to a food reward. The task was constructed such that the first, second, and third actions relative to a goal were performed on different physical levers in different action sequences. As a result, it was possible to disambiguate signals related to the encoding of relative progress toward a goal versus signals related to pressing specific physical levers or moving to specific locations. Using this task, we discovered neural responses to unique serial positions in both the ACC and DS, but their properties differed in important ways.
Materials and Methods
Animals.
Four experimentally naive male Long–Evans rats (450–550 g) were housed in a facility with a 12 h light/dark cycle, with all training and recording taking place during the light cycle. For the duration of the behavioral experiments, the rats were food-restricted to just below 90% of their free-feeding weights. Feeding took place in the home cage after their daily training/recording sessions, and water was available ad libitum in the cages at all times. All procedures were performed in accordance with the Canadian Council of Animal Care and the Animal Care Committee at the University of British Columbia.
Apparatus.
Within a large opaque Plexiglas box (25 × 18 inches), a main panel was installed with three levers (Fig. 1A). On any given day of sequence training, a unique tactile object (Velcro, cardboard, or soft foam) was stuck to the lever panel (but not on the lever itself) and the area on the floor immediately in front of the lever panel to symbolize the order in which the three levers should be pressed. An area of 25 × 13 inches was left for the rat to move freely. On the opposing-side wall, a food cup was located at the center, with each delivery of reward accompanied by a pure tone. Retractable levers and pellet dispenser were controlled and recorded with a PC via a Med Associates interface system.
Figure 1.
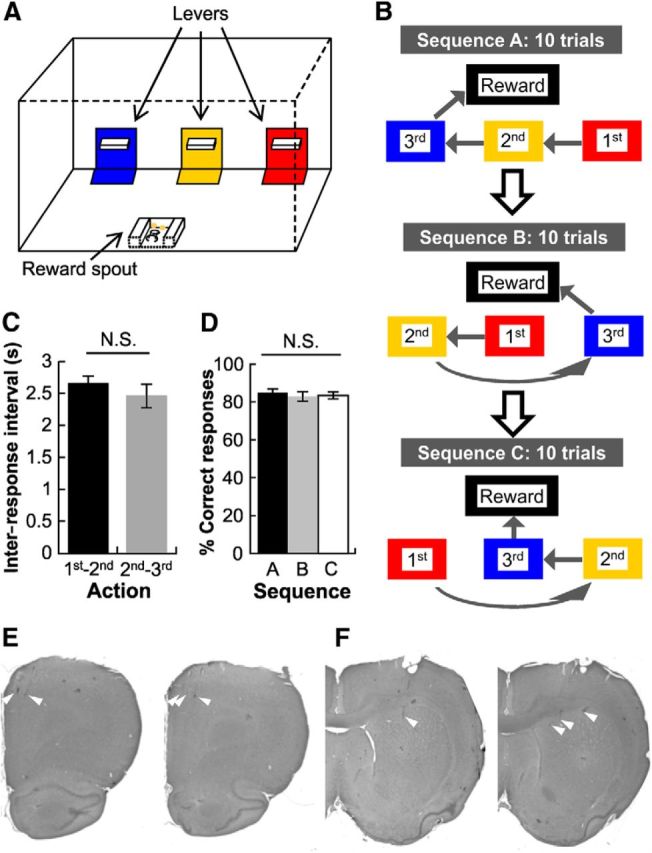
Task description and performance. A, The operant chamber contained 3 levers installed on the front panel and a food-cup on the opposing wall. A unique sensory cue was attached to the floor immediately in front of each lever as well as on the surrounding wall. The first lever (color-coded red in the schematic) to be pressed in a given sequence block could be surrounded by Velcro, the second lever (yellow in schematic) by cardboard, and the third lever (blue in schematic) by soft foam. B, Example of a test day on which the rat had to perform a minimum of 10 trials on each of the 3 sequence blocks, which were given in a pseudorandom order. Sequence block A required the rat to respond on the right lever, followed by the middle lever and then the left lever, before reward pellets were delivered to the food-cup on the opposite wall. The serial order of the 3 sensory cues remained constant for a given rat, but they were moved to different levers for each of the sequence blocks. C, Latencies to travel between the first and the second levers were equivalent to the latencies to travel between the second and the third levers across all sequence blocks. D, The animals' performance levels were equivalent across the 3 sequence blocks, as measured by the percentage of correct response on the third lever of each sequence block. E, Histology showing representative electrode track endings (white arrowheads) in the ACC. F, Representative electrode track endings (white arrowheads) in the DS.
Behavioral task.
The naive subjects were first trained on an FR1 schedule to press each of the three levers. A minimum of 60 presses within 0.5 h, with no less than 15 presses on each lever, was required before the rat moved on to the next stage of training. After 3–5 d of FR1 training, the rats learned three 3-lever sequences: Sequence A, B, and C, in three consecutive stages of training. The order of lever presses in each sequence was given by tactile objects placed on the panel and floor in front of the levers. For a given animal, each object consistently designated a single serial position. The order of lever presses in Sequence A was Right Lever→Middle Lever→Left Lever (Fig. 1B). A lever retracted only when it was pressed in the correct order and remained extended in the event of an error. Therefore, the level of performance on the right lever in Sequence A was necessarily 100%, whereas the chance level of performance on the middle lever was 50% (i.e., incorrect if pressed before the right lever) and that on the left lever was 33%. For training on each sequence, the percentage of correct responses on the third item of the sequence had to reach 75% before moving on to the next stage of training. Sequence B consisted of three lever presses in the order Middle Lever→Left Lever→Right Lever, and Sequence C in the order Left Lever→Right Lever→Middle Lever. At any one of the three stages of single-sequence training, if after 3 d of training, the animal still had not reached criterion and if day-to-day improvement stopped, a delay-punishment protocol was introduced to extinguish errors made on the third lever of the given sequence. Specifically, if the third lever was pressed before the first lever, all levers retracted and a 10 s time-out period ensued. This training continued until the animal reached criterion performance. When the criterion performance was reached on all three sequences, the rat was surgically implanted and allowed 10 d to recover. After recovery, two to three refresher sessions on each sequence were given before the first multisequence block test day.
On the multisequence block test days, the animals had to perform a block of at least 10 trials on each sequence at or above criterion, before switching to the next sequence in one of three possible pseudorandom orders: Sequence 3→Sequence 2→Sequence 1, Sequence 2→Sequence 1→ Sequence 3, or Sequence 1→Sequence 3→Sequence 2. In between sequence blocks, the animals were taken out of the box to allow for rearrangement of the tactile objects.
Surgery.
Stereotaxic surgeries were performed with sterilized-tip procedures under anesthesia by isoflurane. NSAIDs, analgesic, antibiotic, and a local anesthetic were given before incision. One elliptical-shaped craniotomy was made centered at AP, +3.2 mm; ML, +1.0 mm; and another craniotomy was made centered at AP, +1.2 mm; and ML, +3 mm (Paxinos and Watson, 2005). Once the dura mater was retracted, the bottoms of the two bundles of eight 30-gauge tubes, containing a total of 16 tetrodes, were placed on the cortical surface. The bundles were of cylindrical shape with a bottom radius of ∼0.4 mm, and were angled medially by ∼15°. The implants were fixed with bone screws and dental acrylic. At the end of the surgery, tetrodes in the anterior bundle were extended by ∼1.4 mm into the brain to enter the ACC, and tetrodes in the posterior bundle were extended by ∼3 mm to enter the DS (Paxinos and Watson, 2005). Animals were given 10 d to recover. Before each recording session, small adjustments were made with the hyperdrives to maximize the number of neurons recorded.
Acquisition of electrophysiological data.
Data acquisition and offline spike sorting were conducted using the same methods, equipment, and software as reported previously (Hyman et al., 2012).
Histology.
At the end of the studies, the animals were deeply anesthetized using an intraperitoneal urethane injection, and 100 μA electrical current was passed through the electrodes for 30 s. Animals were then perfused with a solution containing 250 ml of 10% buffered formalin, 10 ml of glacial acetic acid, and 10 g of potassium ferrocyanide. This solution causes a Prussian blue reaction, which marks with blue the location of the iron particles deposited by the electrode lesion. The brains were then removed and stored in a 10% buffered formalin/20% sucrose solution for at least 1 week, before being sliced and mounted to determine precise electrode locations. Since multiple sessions were recorded from individual animals, the precise recording locations could not be derived from electrode lesions, but all electrode tracks were inferred between the entrance point and the dyed spots. Figure 1, E and F, shows representative recording sites for ACC and DS, respectively.
Data analyses.
A total of 33 large ensembles (DS, Nmin = 19; ACC, Nmin = 21) were collected. Neurons firing <0.14 Hz were excluded from further analysis, because the sample of spikes was too small (250 or less) to be reliably representative of the cell's activity in relation to behavior. To obtain an estimate of the neural firing rate for each isolated cell i as a function of time bin t, ri(t), firing rates (FRs) were calculated for each spike train in each 50 ms bin [note: FR was different from instantaneous firing rate used in our past studies; Durstewitz et al. 2010; Hyman et al. 2012]. In each trial of the task, each behavioral epoch—a lever-press or reward-approach period—includes a 1 s period centered at the timestamp of that behavior. Thus each epoch is 20 bins long, and 80 bins from each trial were analyzed, including three lever presses and a reward-approach period. Further analyses were performed in MatLab (Mathworks), as detailed below.
Principal component analysis.
In the behavioral task, each trial contained 4 epochs (3 actions plus reward-approach period), each of which lasted for 1 s. Thus, each trial contained 80 bins. Each cell's normalized FRs were averaged across all trials to produce a single FR vector containing 80 numbers. Thus, in a matrix containing FRs from all cells recorded, there are 80 variables, for each of which there are 637 observations (i.e., total cell number) for the ACC and 351 for the DS. Principal component analysis (PCA) was performed on these 80 variables. The top principal components (PCs) represent the most prevalent firing patterns among all cells. For each PC, each cell has a unique coefficient or loading, indicating the extent to which this PC represents this cell's firing pattern. Ranking cells based on their loadings resulted in two groups of cells: those with positive loadings and those with negative loadings. The averaged firing rates of these two groups were analyzed with two-way ANOVA using a 2 (number of groups)-by-3 (number of actions) design. Post hoc Tukey's test was then used to test for differences among groups.
Correlation analysis.
To determine whether the “ramping” and “action-linked” patterns exist within individual ACC and DS cells, two models were constructed to capture these features. The correlations between single-unit activities and the models were examined. The ramping model was a 60 bin vector containing numbers from 0 to 1, stepped at 1/59 (Fig. 4A, red line). The action-linked model was a 60 bin vector containing numbers from 0 to 1 stepped at 1/9, from the first to the 10th bin, from the 21st to the 30th bin, and from the 41st to the 50th bin. The 10th, 30th, and 50th bins were when the three lever presses, respectively, occurred. Additionally, from the 11th to the 20th bin, from the 31st to the 50th bin, and from the 51st to the 60th bin, the vector contained numbers from 1 to 0 stepped at −1/9, thereby forming a saw-tooth shape (see Fig. 4A, blue line). Spearman's correlation and p-values were calculated between each cell's averaged FRs and these models (α < 0.05). Bonferroni correction was not performed, because the purpose of this analysis was not to test significance, but to categorize cells and examine their collective action.
Figure 4.
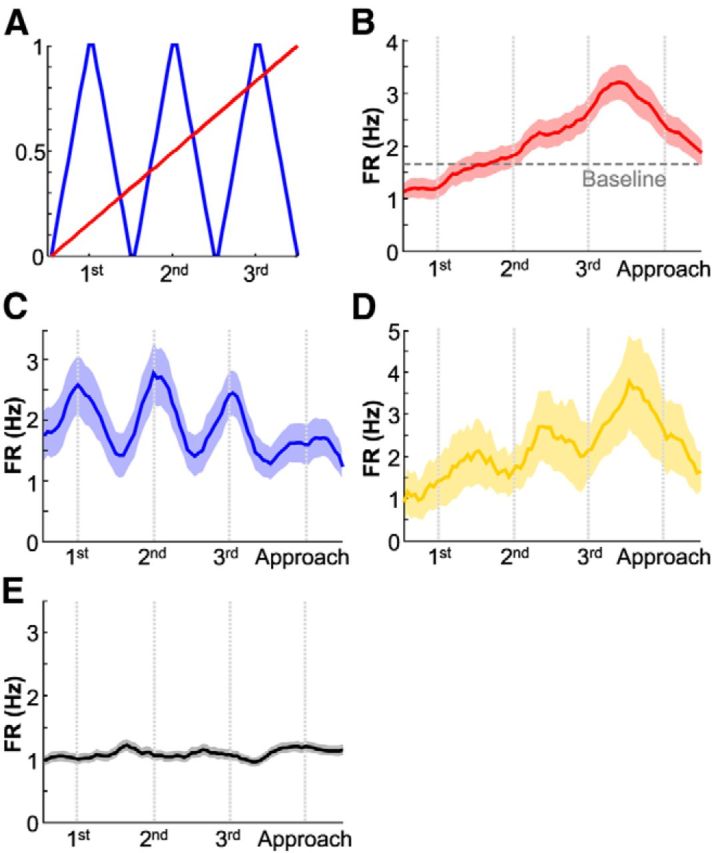
Testing possible single-unit firing patterns underlying the progressive firing-rate increase across the three actions leading to reward. A, Two potential models of firing rate variance across a trial were a smooth progressive change (red) or a lever press-linked change (blue). B, Average firing rate for all 107 neurons showing a positive correlation with the ramping model (mean ± SEM). The horizontal line represents the overall average baseline firing rate of the neurons. Note that the firing during the first correct response was below baseline, whereas subsequent responses rose above baseline. C, Average firing rate for all 37 neurons with a positive correlation with the action-linked model (mean ± SEM). D, The average firing rate of the 11 neurons that attained significance on both factors. Note how these neurons exhibited transient action-linked responses that increased for actions closer to the reward. E, The average firing rate for all neurons whose firing did not correlate with either model (n = 376).
Error analysis.
There were two types of error trials observed in almost all sessions. In the first case, the animal started a trial by pressing the wrong lever for that sequence block, then went on to press the three levers in the correct order. In the second case, the animal responded correctly on the first lever for that sequence block, then pressed on the incorrect lever (i.e., pressed on the lever which should have been the third item in the sequence rather than the second), and then went on to complete the trial correctly. The activities of ramping model-correlated ACC cells and action-linked model-correlated DS cells during these two types of error trials were averaged and compared with those recorded during the error-free trials, one type at a time. The averaged firing rates of these two groups were analyzed with two-way ANOVA using a 2 (error trials vs error-free trials)-by-3 (number of actions) design. Post hoc Tukey's test was then used to test for differences among groups.
Results
Rats were trained in an experimental apparatus which contained a panel with three retractable levers located on one wall (Fig. 1A). Each lever was distinguished by cues (Velcro, cardboard, or foam) temporarily affixed to the area immediately surrounding the levers (but not the levers themselves). For any given sequence block, each cue indicated the serial position in which individual levers had to be pressed to obtain food reward. This sequence of cues was always the same for a given rat, but the cues were moved to different lever locations for each of the two or three sequence blocks (preliminary testing revealed that the cues were neutral as neither the rats nor the recorded neurons systematically preferred one cue; Fig. 1B). On the multi-sequence block test days, behavioral performance within and across sequence blocks did not differ (within sequences: t1102 = 0.89, p = 0.38, Fig. 1C; across sequences: F(2,48) = 0.22, p = 0.80, Fig. 1D).
The first serial position was investigated in isolation by combining all responses on the right lever from sequence block A, the middle lever from sequence block B, and left lever from sequence block C and so on for second and third serial positions. At the end of testing, the animals were killed and recording sites in ACC (Fig. 1E) and DS (Fig. 1F) were located by histology.
Reward expectancy/proximity signals in ACC ensembles
Single neurons in the medial prefrontal cortex (mPFC), including the ACC, can exhibit virtually any type of response profile (Jung et al., 1998; Baeg et al., 2003; Hyman et al., 2005, 2010; Lapish et al., 2008; Rigotti et al., 2013); therefore, it was important to examine the overall signal emitted by large groups of neurons to reveal what specific aspects of our sequence task dominated this signal. Accordingly, PCA was used to identify the main sources of firing rate variance across all 637 ACC neurons recorded in this study. When lever presses were organized according to serial position across the three sequences, the first PC, which accounted for 17.7% of total firing rate variance, exhibited a smooth progressive increase consistently across the three lever presses before declining steeply following the third lever response as the animal approached the goal port (Fig. 2A). The eigenvector values of PC1 remained positive throughout the three lever presses, indicating that each of the ACC neurons in this network displayed similar changes in firing rates (excitation or inhibition) for all three responses and the magnitude of these changes increased with each successive lever press. The second PC (accounting for 9.46% of variance) increased slightly across the three lever presses, but exhibited an abrupt acceleration during goal approach at the point where PC1 began to decline (Fig. 2B). PC2 started trials with negative eigenvector values that suddenly shifted into positive values signifying that neurons in this network had opposing responses during the lever presses and goal approach periods (i.e., from inhibition to excitation or vice versa).
Figure 2.

The main patterns of firing rate variance in ACC ensembles as revealed by PCA. PCA was performed on all neurons recorded across all animals and sessions. Trials were arranged such that the first, second, and third lever presses and reward-approach period, each occupying a 1 s interval, were aligned across the three sequence blocks, regardless of which actual physical levers were pressed in each case. A, The PC1 eigenvector was characterized by a progressive increase during the lever presses followed by an abrupt decline during reward-approach. B, The PC2 eigenvector started negative and smoothly increased with an abrupt acceleration into positive values during reward-approach. C, Factor loadings for all 637 ACC neurons on PC1. Left inset, Average firing rate of all neurons with positive factor loadings on PC1. Right inset, Average firing rate of all neurons with negative factor loadings on PC1. D, The average firing rates during the 1 s lever-press periods for all neurons shown in C, with positive factor loadings on PC1 (left), or negative factor loadings on PC1 (right). The average firing of the neurons during lever presses in the first serial position are shown in light gray, the second serial position in dark gray, and the third serial position in black. Significance at ***p < 1 × 10⁻¹⁰, **p < 0.0005.
Since neurons can load positively or negatively on a given PC, we simply rank-ordered their loadings on PC1 and plotted the group average of all neurons with positive loadings (Fig. 2C, left inset) and of all neurons with negative loadings (Fig. 2C, right inset). Neurons with positive loadings increased their overall firing rate smoothly across the three serial positions, whereas the firing rate of neurons with negative loadings decreased smoothly, as one would predict. The average aggregate firing rates of all neurons that loaded positively on PC1 exhibited significantly higher firing rates for the second serial position relative to the first (Tukey's post hoc test, p = 4 × 10⁻¹²) and significantly higher firing rates for the third serial position relative to the second (Tukey's post hoc test, p = 7 × 10⁻⁶, Fig. 2D, left). The neurons with negative loadings on PC1 exhibited a similar serial position-linked change in response magnitude, but in the opposite direction (Tukey's post hoc test, first action > second action: p = 4 × 10⁻⁵, second action marginally higher than third action: p = 0.07, Fig. 2D, right). PCA therefore provided a means with which to group the firing activities of all 637 neurons based on the most dominant pattern of firing rate variance (PC1), but by so doing revealed a clear, robust, and relatively uniform activity pattern during the performance of a sequence of actions that led to a reward. An example of a neuron with strong positive loadings on both PC1 and PC2 is shown in Figure 3A. This neuron exhibited both the smooth increase in firing consistent with PC1 and also a further increase that emerged abruptly during reward approach consistent with PC2. To demonstrate the prevalence of these activity patterns, two more examples of cells with strong positive loadings on PC1 are shown in Figure 3, B and C. Figure 3, D–F, shows examples of neurons loaded negatively on PC1. The strong correlation between the responses of these neurons with the patterns identified by both of the top PCs illustrates the ability of PCA to detect neurons that contribute to multiple distinct network signals during different cognitive/behavioral epochs.
Figure 3.

Examples of the progressive firing rate patterns exhibited by ACC neurons. A–C, Examples of single neurons strongly positively loaded on both PC1 and PC2 (A) or on PC1 only (B, C). Top, Raster plot; bottom, average FR across all trials (mean ± SEM). D–F, Examples of single neurons negatively loaded on PC1. Top, Raster plot; bottom, all-trial average FR (mean ± SEM).
The reward expectancy/proximity signal is produced by a smooth firing-rate progression in ACC neurons
The smooth progression in firing rate revealed by PCA and shown in the overall average firing rates could be the product of two distinct patterns of spiking activity across the network. It is possible that individual neurons' firing rates ramp smoothly over the course of the three serial positions, or it is also possible that this smooth progression was produced by the combined activity of neurons that fired to each action stochastically, but asynchronously. To determine whether one or both response types were present in the ACC, correlations between single-unit activities and models designed to capture these features (Fig. 4A) were calculated. A large group of neurons correlated positively the ramping factor (n = 107, Fig. 4B), while a smaller group exhibited significant positive correlation with the action-linked factor (n = 37, Fig. 4C). Although these 37 neurons fired in conjunction with each action, on average their firing rate did not progress with each subsequent action. However, we did observe 11 of 637 neurons whose firing activity correlated with both factors. These neurons exhibited action-linked responses as well as a progressive increase for later actions (Fig. 4D). Finally, neurons without any correlation between average firing activity and either factor are shown in Figure 4E (n = 376). These neurons exhibited relatively flat firing rates throughout the trial. Given that this analysis categorized all neurons exhaustively, one can conclude that the ramping activity, captured by PC1 and PC2, was produced mainly by a network of neurons that themselves exhibited a ramping pattern.
Above, we categorized neurons based on their responses over an entire trial, but it is also informative to illustrate how neurons responded specifically during each lever press period. Figure 5 shows, for a single example session, the average change in firing rates (relative to their individual session-wide means) during a 1 s period surrounding presses on the same physical lever, grouped according to whether the lever was pressed as the first, second, or third action in a sequence. The patterns of activity in the three cases were quite similar because the action and the physical lever was the same. Yet it is noteworthy that the pattern became more differentiated for each subsequent press because neurons that fired above their average rate in response to presses on a given lever fired more for later serial positions, whereas neurons that fired below their average rate in response to presses on that lever fired progressively less for later serial positions. This illustrates that progression toward a goal tended to enhance the distinctness of action-linked activity state patterns.
Figure 5.

Prototypical activity state pattern observed in the ensemble in the 1 s period surrounding presses on the right lever in a single session. Each bar represents the firing rate z-scores for a single neuron averaged across the 1 s interval surrounding all presses on that lever within a sequence block. Average FR z-score values when the right lever was the first lever pressed in one sequence block (left, light gray bars), the second lever pressed in another sequence block (middle, dark gray bars) or the third lever in a third sequence block (right, black bars). The divergence in z-scores was related to differences in the serial positions of the lever press relative to the reward since the physical lever was identical in each case.
The reward expectation signal ramps only in association with correct choices
If the firing rate progression associated with movement toward a goal served as a type of reward expectancy (Shidara and Richmond, 2002) or reward proximity signal, it was unclear whether it should scale equally for all actions or only for correct actions that actually brought the animal closer to the goal. In the present study, well trained rats would sometimes press the incorrect lever as their first or second choice of a trial (there could be no errors on the third action in a trial because there was only one remaining lever, as the levers retracted after each correct press). The effects of these two types of errors on the firing rates of the 107 ramping neurons shown in Figure 4B are analyzed in detail below.
When an error was committed on the first lever press, the overall average firing rate of the neurons during the next correct lever press was the same size as during the first correct lever press on error-free trials (two-way ANOVA main effect of action: F(2,114) = 108.3, p = 5 × 10⁻²⁷, but not trial type: F(1,114) = 2.94, p = 0.08; Tukey's post hoc test: first correct actions in error trials vs those in error-free trials: p = 0.95) yet was significantly different from the second correct lever press on error-free trials (Tukey's post hoc test: p = 0.0002, Fig. 6A,B). Likewise, for trials in which an error occurred on the second lever press, the firing rate on the next correct lever press was the same size as it was on the second lever press for error-free trials (two-way ANOVA main effect of action: F(2,114) = 134.2, p = 1 × 10⁻³⁰, but not trial type: F(1,114) = 1.13, p = 0.28; Tukey's post hoc test: p = 0.87) and significantly different from what it was during the third lever press on error-free trials (Tukey's post hoc test: p = 5.5 × 10⁻¹¹) (Fig. 6C,D). To illustrate this visually, we overlaid the average response of the neurons on error-free trials with their average responses on error trials, assuming an error had not been committed. Specifically, the average response on error-free trials was shifted by one lever press and then overlaid (Fig. 6A, gray line) with trials in which the first lever press was incorrect (Fig. 6A, black line) or was cut after the first lever press and then shifted by one lever press and overlaid (Fig. 6C, gray line) with trials in which the second action was incorrect (Fig. 6C, black line). The firing rates were not altered or scaled in this plotting scheme. From these figures, it is clear that only correct choices initiated the firing rate progression (Fig. 6A), and once initiated, it appeared to progress only in association with correct choices (Fig. 6C). Thus, the smooth ramping signal in the ACC appears to track actual progress toward a goal rather than simply counting actions.
Figure 6.

Firing rate progression in the ACC during correct choices versus errors. A, Neurons' average firing rate on error-free trials shown in Figure 4B was replotted in gray, with the average firing rate of the same neurons on trials starting with an error (Type 1 error trials, black line). Note that the firing rate of the neurons increased but then returned to baseline following the initial error. Once correct choices resumed, the firing rate progression was essentially identical to trials without errors. B, Statistical analysis of firing rate changes of these neurons on error-free trials (gray bars) versus Type 1 error trials (black bars). Left, No significant differences (N.S.) in average firing rates in the 1 s period surrounding the first correct lever press, whether that lever press was preceded by an initial error (black bar) or not (gray bar). Right, Although average firing rates for the first versus second correct lever presses were different, this was true regardless of whether the trial began with an error (black bars) or not (gray bars). C, As in A, neurons' average firing rate on error-free trials shown in Figure 4B was replotted in gray, with the average firing rate of the same neurons on trials where the first correct choice was followed by an error being shown in gray (Type 2 error trials). Note that the firing rate of the neurons increased but then returned to baseline following the error. Once correct choices resumed, the firing rate progression recommenced at the same level as on trials without errors. D, Statistical analysis of firing rate changes of these neurons on error-free trials (gray bars) versus Type 2 error trials (black bars). Left, There were no significant differences (N.S.) in average firing rates during the first correct lever press, whether that lever press was followed by an error (black bar) or not (gray bar). Right, The average firing rates for the first versus second correct lever presses were different, and this was true regardless of whether an error occurred after the first correct choice (black bar) or not (gray bar). Since each subsequent lever press was associated with a significant change in average firing rate and this was true regardless of whether or not the trial contained an error, it suggests that the firing rate progression from one lever press to the next occurred only during correct choices. ***p < 1 × 10⁻¹⁰, **p < 0.0005.
Next we examined activity arising during different portions of the error trials themselves. Errors committed before the first correct action could involve presses on the lever that was supposed to be the second or the third correct action in the sequence block. Behavioral analysis revealed that the rats were more likely to press the lever associated with the third correct action than the one associated with the second correct action (Wilcoxon rank sum test: rank sum = 257.5, p = 0.00086). Given the abundance of trials in which an initial error involved the lever that was supposed to be the third correct action in the sequence block, we explored whether ACC activity during these types of errors resembled activity during the first correct action or the third correct action. We found that activity during these errors was actually significantly different from both (one-way ANOVA, F(2,59) = 53.42, p = 8.5 × 10⁻¹⁴). Specifically, these errors were associated with higher levels of activity than the first correct response (Tukey's HSD test: error > first correct, p = 0.00012), but with lower activity than the third correct response (Tukey's HSD test: error < third correct: p = 0.0016). This latter effect is exactly consistent with what one would expect for a system encoding serial position. The former effect arose because the first correct response tended to be below baseline (Fig. 4B), yet when an error was committed, firing was essentially at baseline levels. As a result, the firing was higher when the first response was an error than when it was correct.
Firing rate progression in DS neurons is tightly tied to actions
The same techniques used to examine ACC ensembles were applied to DS ensembles recorded simultaneously from the same animals. PCA performed on all DS neurons revealed that the first PC (Fig. 7A) identified a group of DS cells whose activity varied closely in association with the lever presses themselves. The second PC (Fig. 7B) showed variation around each lever press, but like PC2 in the ACC also exhibited a pronounced acceleration during reward approach. The firing rates of neurons that loaded positively versus negatively on PC1 were plotted separately and revealed that the change in firing rates for later serial positions occurred during the time of the actions themselves (Fig. 7C). Once again, all DS neurons were included in this figure but were simply split into the two subgroups based on their loadings on PC1 and shown in the insets. Positively loaded cells fired significantly higher during the second action than during the first action (Tukey's post hoc test: p = 0.007), but did not fire differently during the third action (Tukey's post hoc test: third vs first action: p = 0.93, third vs second action: p = 0.10; Fig. 7D, left). Negatively loaded cells responded similarly to all three actions (Fig. 7D, right). Figure 7, E and F, shows examples of neurons loaded strongly on PC1 and PC2, respectively.
Figure 7.

The main patterns of firing rate variance in DS ensembles as revealed by PCA. PCA was performed on all DS neurons recorded across all animals and sessions. Plots were arranged as in Figure 2. A, The PC1 eigenvector was characterized by strong variations in association with each lever press followed by an abrupt decline during the reward-approach epoch. B, The PC2 eigenvector showed smaller variations in association with the lever presses followed by an abrupt acceleration in the reward-approach epoch. C, Factor loadings for all DS neurons on PC1. Left inset, Average firing rate of all neurons with positive factor loadings on PC1. These neurons exhibited peaks in firing tightly locked to lever presses. Right inset, Average firing rate of all neurons with negative factor loadings on PC1. These neurons exhibited troughs in firing tightly locked to lever presses. D, Average firing rates during the 1 s period surround each of the three lever presses and reward-approach for neurons that were loaded positively (left) or negatively (right) on PC1. Although there was a significant increase in DS firing for positively loaded cells from the first to the second action, this increase did not continue to the third action, even though it was the action closest to the reward. No change in average firing was observed for the negatively loaded cells. E, Example of a single neuron that was strongly positively loaded on both PC1. Top, Raster plot; bottom, average FR across all trials (mean ± SEM). F, Example of a single neuron that was strongly loaded on PC2. Top, Raster plot; bottom, all-trial average FR (mean ± SEM). *p < 0.01.
Although this analysis suggested that DS activity was tightly linked to the lever presses, it remains a possibility that neurons similar to those ACC neurons that ramped more smoothly were buried within the DS population. In an attempt to extract these neurons, we correlated the firing rates of all DS neurons with the ramp and action-linked factors shown in Figure 4A. In this case, more neurons were significantly positively correlated with the action-linked factor (n = 32, Fig. 8A) than the ramp factor (n = 19, Fig. 8B). Even though these 19 DS neurons were significantly correlated with the ramp factor, when plotted, it was evident that the degree of ramp-like activity was very weak (Fig. 8B). To further test this possibility, we projected the DS ensemble activities onto PC1 derived from ACC ensembles (i.e., the principal component associated with smooth ramping activity, Fig. 2A), and tested the difference between the absolute values of the loadings of DS neurons and those of the ACC neurons on this PC. Absolute loadings were used because they reveal the amount of variance accounted for by the ACC PC in both ACC and DS neurons. The resulting loadings were significantly larger in the ACC neurons than in the DS neurons (independent-sample t test, t986 = 2.40, p = 0.0167). In other words, the smooth ramping pattern is indeed much more dominant in ACC than in DS. Finally, the firing rates of the DS neurons that failed to attain significance on either factor were also largely flat throughout the trial (n = 211, Fig. 8C). Based on these analyses, it would appear that firing rate progression in the DS relative to the goal was weak but very tightly linked to the actions themselves. This conclusion, based on PCA and correlation analysis of the entire ensemble, was consistent with the firing properties of single neurons (Fig. 7E).
Figure 8.

Testing possible single-unit firing patterns during the three actions leading to reward in the DS. All 351 DS neurons were tested for correlations with the model features shown in Figure 4A. A, The average firing rate for all DS neurons showing a positive correlation with the action-linked model (n = 32). B, The average firing rate for all DS neurons with a positive correlation with the ramp model (n = 19). C, The average firing rate for DS neurons whose firing did not correlate with either model (n = 211).
Errors do not alter serial position signaling in the DS
Given the relatively weak firing rate progression and the tight association between DS neuron activity and the actions themselves, it was unclear whether these neurons would fire differently due to errors or whether they would continue to faithfully track all actions indiscriminately. Since in the DS the bulk of the progressive change in firing for subsequent actions occurred during the actions, for this analysis we focused on the responses of the 32 DS neurons shown in Figure 8A that exhibited a significant positive correlation to the action-linked factor.
When an error was committed as the first lever press, the FR on the next correct lever press was not different from the first correct lever press on error-free trials (two-way ANOVA, main effect of action: F(2,114) = 4.91, p = 0.01, but not trial type: F(1,114) = 0.74, p = 0.39; Tukey's post hoc test: first correct actions in error trials vs those in error-free trials: p = 0.99) and was also not different from the second correct lever press on error-free trials (Tukey's post hoc test: p = 0.63) (Fig. 9A,B). When the error occurred on the second lever press, the FR for the next correct lever press was the same size as that for the second lever press on error-free trials and was also not different from what it was on the third lever press on error-free trials (two-way ANOVA, no main effect of action: F(2,114) = 2.57, p = 0.08, nor of trial type: F(1,114) = 0.01, p = 0.91; Fig. 9C,D). This lack of differentiation between correct and error trials was evident when the average firing rates of the neurons on correct and error trials were overlaid (Fig. 9A,C). There was little difference in the DS signal on correct versus error trials because the DS neurons fired so strongly in association with errors. DS activity arising during different portions of the error trials themselves was also explored in greater detail. When we examined activity during trials that began with the rat pressing the lever that should have been the third in the sequence, firing rates during these initial errors were not different from firing during either the first correct response (one-way ANOVA, F(2,59) = 4.01, p = 0.024, Tukey's HSD test: p = 0.088) or from when the lever was pressed correctly as the third response in the sequence (Tukey's HSD test: p = 0.88). These results are different from what was observed in the ACC but are fully consistent with a generic action-related change in firing rate for DS neurons.
Figure 9.

Firing rate progression in the DS during correct choices versus errors. A, Neurons' average firing rate on error-free trials shown in Figure 4B was replotted in green, with the average firing rate of the same neurons on trials starting with an error in black (Type 1 error trials). B, Statistical analysis of firing rate changes of these neurons on all correct trials (gray bars) versus trials where the first response was an error (black bars). Left, There were no significant differences (N.S.) in average firing rates in the 1 s period surrounding the first correct lever press depending on whether that lever press was preceded by an initial error (black bar) or not (gray bar). Right, Importantly, and in contrast to the ACC, for DS neurons the first and second correct lever presses were not significantly different. This was true regardless of whether the trial began with an error (black bar) or not (gray bar). C, The average firing rate change of the same neurons examined in A and B, but on trials where the second lever press in the sequence block was an error (Type 2 error trials, black line). D, Statistical analysis of firing rate changes of these neurons on all correct trials (gray bars) versus trials where the second response was an error (black bars). Left, There were no significant differences (N.S.) in average firing rates in the 1 s period surrounding the first correct lever press depending on whether that lever press was followed by an error (black bar) or not (gray bar). Right, However, more critically, the average firing rates for the first versus second correct lever presses were not different, and this was true regardless of whether an error occurred after the first correct choice (black bar) or not (gray bar). Since there was no difference in firing for the first versus second correct choice or the second versus third correct choice, the DS could not be considered to track action progression toward the goal. Rather the DS tracked all actions equally regardless of serial position or whether they were correct or not.
Discussion
Previous studies have shown robust representations of various aspects of sequential behaviors by single neurons in the frontal cortex (Barone and Joseph, 1989; Clower and Alexander, 1998; Nakamura et al., 1998; Procyk et al., 2000; Ninokura et al., 2004; Ryou and Wilson, 2004; Fujii and Graybiel, 2005; Mushiake et al., 2006; Averbeck and Lee, 2007; Shima et al., 2007; Berdyyeva and Olson, 2010). In the present study, when trials were organized according to serial position of the lever presses relative to reward, the dominant pattern of activity accounting for the largest portion of variance across all recorded ACC neurons was a smooth ramp-like change in firing rate as animals progressed through the three actions to the reward. Firing rate progression appeared to occur only in association with correct actions and not errors. The ability to represent one's progress in a sequence relative to a goal could be expected in a brain region such as the ACC that is involved in monitoring actions and outcomes (Alexander and Brown, 2011). In contrast to the ACC, the largest portion of variance across all DS neurons, recorded simultaneously from the same animals, was a change in firing rate linked to a lever press that had a slight tendency to become stronger for lever presses occurring in later serial positions. Unlike ACC neurons, DS neurons tended to fire the same way regardless of whether the actions were correct or not, suggesting that this region mainly encodes the actions.
It is becoming increasingly evident that neurons in the frontal cortex have multiple, diverse and dynamic firing rate correlates (Jung et al., 1998; Rigotti et al., 2013). Neurons in the rat mPFC (ACC and prelimbic regions) exhibit potent responses to both actions (Jung et al., 1998; Hyman et al., 2005; Lapish et al., 2008; Durstewitz et al., 2010) and rewards (Pratt and Mizumori, 2001; Hyman et al., 2011; Caracheo et al., 2013; Horst and Laubach, 2013). mPFC neurons fire during reward approach with the strength of the response being dependent on the reward magnitude (Pratt and Mizumori, 2001; Kargo et al., 2007). Furthermore, many mPFC neurons fire differently during identical action sequences if the sequences resulted in the delivery of rewards of a different magnitude (Kargo et al., 2007). In addition, modulation of mPFC neurons that respond in anticipation of a forthcoming reward was also based on the route taken to acquire the reward, suggesting that mPFC neurons multiplex information about actions with expectations of future rewards and their magnitude (Cowen et al., 2012). In the primate ACC, a subset of neurons fired in response to the completion of different actions or subtasks but fired more robustly for later actions that were closer to the delivery of reward (Shidara and Richmond, 2002; Toda et al., 2012). The present results resemble those of Shidara and Richmond (2002) with the exception that only 2 of 106 neurons in their study showed a smooth ramp-like increase in firing. Instead, most neurons fired upon lever release with further increases in firing rate for those lever releases performed later in the multitrial schedule. In addition to obvious differences in species, one reason for these different profiles may be attributed to our use of self-paced and continuous responding rather than a series of discrete subtasks. In our case, neuronal responses seemed to decay more slowly after each action, resulting in a smoother overall response profile.
The continuous response profile most commonly observed in ACC in the present study was similar to climbing or ramping activity previously reported for subsets of dorsolateral PFC neurons during the delay period of a memory task before a response, as well as in primate and rat ACC on tasks requiring interval timing (Niki and Watanabe, 1979; Narayanan and Laubach, 2009). Ramping activity has been proposed to reflect the neural processes associated with withholding a temporally inappropriate response (Narayanan et al., 2006; Narayanan and Laubach, 2009; Hyman et al., 2013), with timing of an interval (Durstewitz, 2003) or with the timing of rewards (Horst and Laubach, 2013). Hence ramping activity may be a general mechanism related to expectation and, in the present case, specifically reward expectation. Importantly, we observed that ramping was absent during errors, suggesting that the expectation signal is not simply an action or time accumulator, but rather may process abstract knowledge about which actions actually move the animal forward toward the reward compared with those actions that are ineffective. Furthermore, the firing rate progression did not reset to baseline levels following an error but rather resumed at a level where it would have been had the error not occurred (Fig. 6). Accordingly, this pattern of firing rate appeared to maintain a running tally of the animal's location relative to the reward, a property that remained intact even when temporarily disrupted by an error. Collectively, these considerations suggest that while progressive changes in the firing activity of ACC neurons during approach to a goal could reflect expectation of a forthcoming reward, as previously proposed (Shidara and Richmond, 2002), this change may also reflect an internalized representation of progress.
Previously, we reported that ACC and prelimbic neurons represent discrete types of information using a distributed pattern-based coding scheme (Lapish et al., 2008; Durstewitz et al., 2010; Hyman et al., 2012, 2013). We also found evidence for this type of code in the present study as illustrated in Figure 5, where the lever press was associated with a pattern of activity as indicated by increases or decreases in firing relative to each neuron's overall grand mean. Presses on individual levers were associated with different activity patterns, much in the same way that distinct activity patterns effectively differentiated each unique epoch in a radial arm maze working memory task (Lapish et al., 2008), individual rules on a set-shifting task (Durstewitz et al., 2010), different stimuli and actions in an operant delayed alternation task (Hyman et al., 2013), as well as distinct environmental contexts (Hyman et al., 2012). This type of pattern-based coding scheme involving large groups of general purpose neurons may subserve the capacity of the frontal cortex to efficiently parse any arbitrary task and hence may be what endows this region of the brain with considerable flexibility. In contrast to such a patterned-based code, the reward expectancy signal is quite different. As shown in Figure 5, the firing-rate pattern is similar for all three types of lever presses because the animal performs the identical action on the exact same physical lever. However, what does vary is the magnitude of the differentiation in firing rates, which is progressively increased when that lever is pressed as the first, second, or third action in the sequence. As a result, the pattern associated with presses on a given physical lever was progressively amplified as the animal approached the reward.
Although the mechanisms responsible for this phenomenon are unknown, dopamine levels in the mPFC increase in a manner that is directly related to the approach to a reward (Ahn and Phillips, 2002; Phillips et al., 2004; Rossetti and Carboni, 2005). Furthermore, based on biophysical data obtained by patch-clamp recordings in vitro, we argued that dopamine (as well as serotonin) could produce exactly this type of pattern-based amplification (Di Pietro and Seamans, 2011). We would therefore argue that discrete declarative forms of information may be represented in the frontal cortex using a patterned-based coding scheme, whereas motivation variables, such as the proximity to reward, may act via neuromodulators to amplify or modify the strength of these activity state patterns.
In the present study, the reward expectation signal in the DS was quite different from what was observed in the ACC. Even on this self-paced task, there was no evidence for the same type of continuous smooth ramp-like activity observed in ACC ensembles recorded simultaneously from the same animals. Instead, DS activity was tightly locked to the lever presses (PC1) and/or the reward approach (PC2). PC1 in DS ensembles was characterized by strong variation during the lever-press periods which increased slightly as the animal progressed through the sequence. While several neurons were correlated with the ramping factor, not all exhibited the progressive increase in firing for subsequent lever presses and any progression was lost in the overall average. Recently, Howe et al. (2013) showed that the extracellular dopamine level in the striatum ramps as rats run toward the goal in a T-maze. Yet in many cases, this effect did not appear in the averaged firing rates of DS cells. The current study differs from that of Howe et al. (2013) in that it involved several operant actions, and it remains to be seen whether DS dopamine would also ramp up smoothly in our task. Collectively, it seems that although DS neurons are sensitive to the sequence in which actions are performed, they do not seem to code progress within a sequence in the same dynamic and integrated manner as neurons in the ACC. Furthermore, DS neurons did not respond to correct lever presses as distinct from incorrect ones. When viewed together, the main signal present in ACC ensembles on this task is associated with tracking progression in a manner that is largely abstracted from the encoding of the actual lever presses, whereas the DS acts as the complement, tracking lever presses in a more literal fashion. The integrated signal produced by these two interconnected regions would effectively keep the animal on track in its progression toward a goal, even in the face of errors, delays, or distractions.
Footnotes
This research was supported by Canadian Institutes of Health Research Grants MOP-93784 and MOP-84319.
The authors declare no competing financial interests.
References
- Ahn S, Phillips AG. Modulation by central and basolateral amygdalar nuclei of dopaminergic correlates of feeding to satiety in the rat nucleus accumbens and medial prefrontal cortex. J Neurosci. 2002;22:10958–10965. doi: 10.1523/JNEUROSCI.22-24-10958.2002. [DOI] [PMC free article] [PubMed] [Google Scholar]
- Aldridge JW, Berridge KC. Coding of serial order by neostriatal neurons: a “natural action” approach to movement sequence. J Neurosci. 1998;18:2777–2787. doi: 10.1523/JNEUROSCI.18-07-02777.1998. [DOI] [PMC free article] [PubMed] [Google Scholar]
- Alexander WH, Brown JW. Medial prefrontal cortex as an action-outcome predictor. Nat Neurosci. 2011;14:1338–1344. doi: 10.1038/nn.2921. [DOI] [PMC free article] [PubMed] [Google Scholar]
- Averbeck BB, Lee D. Prefrontal neural correlates of memory for sequences. J Neurosci. 2007;27:2204–2211. doi: 10.1523/JNEUROSCI.4483-06.2007. [DOI] [PMC free article] [PubMed] [Google Scholar]
- Baeg EH, Kim YB, Huh K, Mook-Jung I, Kim HT, Jung MW. Dynamics of population code for working memory in the prefrontal cortex. Neuron. 2003;40:177–188. doi: 10.1016/S0896-6273(03)00597-X. [DOI] [PubMed] [Google Scholar]
- Barone P, Joseph JP. Prefrontal cortex and spatial sequencing in macaque monkey. Exp Brain Res. 1989;78:447–464. doi: 10.1007/BF00230234. [DOI] [PubMed] [Google Scholar]
- Berdyyeva TK, Olson CR. Rank signals in four areas of macaque frontal cortex during selection of actions and objects in serial order. J Neurophysiol. 2010;104:141–159. doi: 10.1152/jn.00639.2009. [DOI] [PMC free article] [PubMed] [Google Scholar]
- Caracheo BF, Emberly E, Hadizadeh S, Hyman JM, Seamans JK. Abrupt changes in the patterns and complexity of anterior cingulate cortex activity when food is introduced into an environment. Front Neurosci. 2013;7:74. doi: 10.3389/fnins.2013.00074. [DOI] [PMC free article] [PubMed] [Google Scholar]
- Clower WT, Alexander GE. Movement sequence-related activity reflecting numerical order of components in supplementary and presupplementary motor areas. J Neurophysiol. 1998;80:1562–1566. doi: 10.1152/jn.1998.80.3.1562. [DOI] [PubMed] [Google Scholar]
- Cowen SL, Davis GA, Nitz DA. Anterior cingulate neurons in the rat map anticipated effort and reward to their associated action sequences. J Neurophysiol. 2012;107:2393–2407. doi: 10.1152/jn.01012.2011. [DOI] [PubMed] [Google Scholar]
- Di Pietro NC, Seamans JK. Dopamine and serotonin interactively modulate prefrontal cortex neurons in vitro. Biol Psychiatry. 2011;69:1204–1211. doi: 10.1016/j.biopsych.2010.08.007. [DOI] [PubMed] [Google Scholar]
- Durstewitz D. Self-organizing neural integrator predicts interval times through climbing activity. J Neurosci. 2003;23:5342–5353. doi: 10.1523/JNEUROSCI.23-12-05342.2003. [DOI] [PMC free article] [PubMed] [Google Scholar]
- Durstewitz D, Vittoz NM, Floresco SB, Seamans JK. Abrupt transitions between prefrontal neural ensemble states accompany behavioral transitions during rule learning. Neuron. 2010;66:438–448. doi: 10.1016/j.neuron.2010.03.029. [DOI] [PubMed] [Google Scholar]
- Fujii N, Graybiel AM. Time-varying covariance of neural activities recorded in striatum and frontal cortex as monkeys perform sequential-saccade tasks. Proc Natl Acad Sci U S A. 2005;102:9032–9037. doi: 10.1073/pnas.0503541102. [DOI] [PMC free article] [PubMed] [Google Scholar]
- Horst NK, Laubach M. Reward-related activity in the medial prefrontal cortex is driven by consumption. Front Neurosci. 2013;7:56. doi: 10.3389/fnins.2013.00056. [DOI] [PMC free article] [PubMed] [Google Scholar]
- Howe MW, Tierney PL, Sandberg SG, Phillips PE, Graybiel AM. Prolonged dopamine signalling in striatum signals proximity and value of distant rewards. Nature. 2013;500:575–579. doi: 10.1038/nature12475. [DOI] [PMC free article] [PubMed] [Google Scholar]
- Hyman JM, Zilli EA, Paley AM, Hasselmo ME. Medial prefrontal cortex cells show dynamic modulation with the hippocampal theta rhythm dependent on behavior. Hippocampus. 2005;15:739–749. doi: 10.1002/hipo.20106. [DOI] [PubMed] [Google Scholar]
- Hyman JM, Zilli EA, Paley AM, Hasselmo ME. Working memory performance correlates with prefrontal-hippocampal theta interactions but not with prefrontal neuron firing rates. Front Integr Neurosci. 2010;4:2. doi: 10.3389/neuro.07.002.2010. [DOI] [PMC free article] [PubMed] [Google Scholar]
- Hyman JM, Hasselmo ME, Seamans JK. What is the functional relevance of prefrontal cortex entrainment to hippocampal theta rhythms? Front Neurosci. 2011;5:24. doi: 10.3389/fnins.2011.00024. [DOI] [PMC free article] [PubMed] [Google Scholar]
- Hyman JM, Ma L, Balaguer-Ballester E, Durstewitz D, Seamans JK. Contextual encoding by ensembles of medial prefrontal cortex neurons. Proc Natl Acad Sci U S A. 2012;109:5086–5091. doi: 10.1073/pnas.1114415109. [DOI] [PMC free article] [PubMed] [Google Scholar]
- Hyman JM, Whitman J, Emberly E, Woodward TS, Seamans JK. Action and outcome activity state patterns in the anterior cingulate cortex. Cereb Cortex. 2013;23:1257–1268. doi: 10.1093/cercor/bhs104. [DOI] [PubMed] [Google Scholar]
- Jung MW, Qin Y, McNaughton BL, Barnes CA. Firing characteristics of deep layer neurons in prefrontal cortex in rats performing spatial working memory tasks. Cereb Cortex. 1998;8:437–450. doi: 10.1093/cercor/8.5.437. [DOI] [PubMed] [Google Scholar]
- Kargo WJ, Szatmary B, Nitz DA. Adaptation of prefrontal cortical firing patterns and their fidelity to changes in action-reward contingencies. J Neurosci. 2007;27:3548–3559. doi: 10.1523/JNEUROSCI.3604-06.2007. [DOI] [PMC free article] [PubMed] [Google Scholar]
- Kennerley SW, Dahmubed AF, Lara AH, Wallis JD. Neurons in the frontal lobe encode the value of multiple decision variables. J Cogn Neurosci. 2009;21:1162–1178. doi: 10.1162/jocn.2009.21100. [DOI] [PMC free article] [PubMed] [Google Scholar]
- Lapish CC, Durstewitz D, Chandler LJ, Seamans JK. Successful choice behavior is associated with distinct and coherent network states in anterior cingulate cortex. Proc Natl Acad Sci U S A. 2008;105:11963–11968. doi: 10.1073/pnas.0804045105. [DOI] [PMC free article] [PubMed] [Google Scholar]
- Matsumoto K, Suzuki W, Tanaka K. Neuronal correlates of goal-based motor selection in the prefrontal cortex. Science. 2003;301:229–232. doi: 10.1126/science.1084204. [DOI] [PubMed] [Google Scholar]
- Mushiake H, Saito N, Sakamoto K, Itoyama Y, Tanji J. Activity in the lateral prefrontal cortex reflects multiple steps of future events in action plans. Neuron. 2006;50:631–641. doi: 10.1016/j.neuron.2006.03.045. [DOI] [PubMed] [Google Scholar]
- Nakamura K, Sakai K, Hikosaka O. Neuronal activity in medial frontal cortex during learning of sequential procedures. J Neurophysiol. 1998;80:2671–2687. doi: 10.1152/jn.1998.80.5.2671. [DOI] [PubMed] [Google Scholar]
- Narayanan NS, Laubach M. Delay activity in rodent frontal cortex during a simple reaction time task. J Neurophysiol. 2009;101:2859–2871. doi: 10.1152/jn.90615.2008. [DOI] [PMC free article] [PubMed] [Google Scholar]
- Narayanan NS, Horst NK, Laubach M. Reversible inactivations of rat medial prefrontal cortex impair the ability to wait for a stimulus. Neuroscience. 2006;139:865–876. doi: 10.1016/j.neuroscience.2005.11.072. [DOI] [PubMed] [Google Scholar]
- Niki H, Watanabe M. Prefrontal and cingulate unit activity during timing behavior in the monkey. Brain Res. 1979;171:213–224. doi: 10.1016/0006-8993(79)90328-7. [DOI] [PubMed] [Google Scholar]
- Ninokura Y, Mushiake H, Tanji J. Integration of temporal order and object information in the monkey lateral prefrontal cortex. J Neurophysiol. 2004;91:555–560. doi: 10.1152/jn.00694.2003. [DOI] [PubMed] [Google Scholar]
- Paxinos G, Watson C. The rat brain in stereotaxic coordinates. Amsterdam: Elsevier Academic; 2005. [Google Scholar]
- Phillips AG, Ahn S, Floresco SB. Magnitude of dopamine release in medial prefrontal cortex predicts accuracy of memory on a delayed response task. J Neurosci. 2004;24:547–553. doi: 10.1523/JNEUROSCI.4653-03.2004. [DOI] [PMC free article] [PubMed] [Google Scholar]
- Pratt WE, Mizumori SJ. Neurons in rat medial prefrontal cortex show anticipatory rate changes to predictable differential rewards in a spatial memory task. Behav Brain Res. 2001;123:165–183. doi: 10.1016/S0166-4328(01)00204-2. [DOI] [PubMed] [Google Scholar]
- Procyk E, Tanaka YL, Joseph JP. Anterior cingulate activity during routine and non-routine sequential behaviors in macaques. Nat Neurosci. 2000;3:502–508. doi: 10.1038/74880. [DOI] [PubMed] [Google Scholar]
- Rigotti M, Barak O, Warden MR, Wang XJ, Daw ND, Miller EK, Fusi S. The importance of mixed selectivity in complex cognitive tasks. Nature. 2013;497:585–590. doi: 10.1038/nature12160. [DOI] [PMC free article] [PubMed] [Google Scholar]
- Rossetti ZL, Carboni S. Noradrenaline and dopamine elevations in the rat prefrontal cortex in spatial working memory. J Neurosci. 2005;25:2322–2329. doi: 10.1523/JNEUROSCI.3038-04.2005. [DOI] [PMC free article] [PubMed] [Google Scholar]
- Rushworth MF, Noonan MP, Boorman ED, Walton ME, Behrens TE. Frontal cortex and reward-guided learning and decision-making. Neuron. 2011;70:1054–1069. doi: 10.1016/j.neuron.2011.05.014. [DOI] [PubMed] [Google Scholar]
- Ryou JW, Wilson FA. Making your next move: dorsolateral prefrontal cortex and planning a sequence of actions in freely moving monkeys. Cogn Affect Behav Neurosci. 2004;4:430–443. doi: 10.3758/CABN.4.4.430. [DOI] [PubMed] [Google Scholar]
- Schmitzer-Torbert N, Redish AD. Neuronal activity in the rodent dorsal striatum in sequential navigation: separation of spatial and reward responses on the multiple T task. J Neurophysiol. 2004;91:2259–2272. doi: 10.1152/jn.00687.2003. [DOI] [PubMed] [Google Scholar]
- Sesack SR, Deutch AY, Roth RH, Bunney BS. Topographical organization of the efferent projections of the medial prefrontal cortex in the rat: an anterograde tract-tracing study with Phaseolus vulgaris leucoagglutinin. J Comp Neurol. 1989;290:213–242. doi: 10.1002/cne.902900205. [DOI] [PubMed] [Google Scholar]
- Shidara M, Richmond BJ. Anterior cingulate: single neuronal signals related to degree of reward expectancy. Science. 2002;296:1709–1711. doi: 10.1126/science.1069504. [DOI] [PubMed] [Google Scholar]
- Shima K, Isoda M, Mushiake H, Tanji J. Categorization of behavioural sequences in the prefrontal cortex. Nature. 2007;445:315–318. doi: 10.1038/nature05470. [DOI] [PubMed] [Google Scholar]
- Toda K, Sugase-Miyamoto Y, Mizuhiki T, Inaba K, Richmond BJ, Shidara M. Differential encoding of factors influencing predicted reward value in monkey rostral anterior cingulate cortex. PLoS One. 2012;7:e30190. doi: 10.1371/journal.pone.0030190. [DOI] [PMC free article] [PubMed] [Google Scholar]