Abstract
The availability of whole genome sequences from various model organisms and increasing experimental data and literatures stimulated the evolution of a systems approach for biological research. The development of computational tools and algorithms to study biological pathway networks has made great progress in helping analyze research data. Pathway databases become an integral part of such an approach. This chapter first discusses how biological knowledge is represented, particularly the importance of ontologies or standards in systems biology research. Next, we use PANTHER Pathway as an example to illustrate how ontologies and standards play a role in data modeling, data entry, and data display. Last, we describe the usage of such systems. We also describe the computational tools that utilize PANTHER pathway information to analyze gene expression experimental data.
Keywords: pathway database, ontology, systems biology, bioinformatics, evolution, protein classification, gene expression analysis
1. Introduction
With the availability of whole genome sequences from various model organisms, and increasing experimental data and literatures, it becomes obvious that a systems approach is needed for biological research. Such an approach will allow us to go beyond individual genes, and study how multiple proteins work together in a complex biological system, i.e., how proteins interact and regulate each other in biological pathway networks, and how they communicate within a cell and signal among different cells. It should also be recognized that two crucial elements would be brought into such an approach. First, computers and software must be used to facilitate the data processing and analysis. Second, it would require collaborative work from a number of groups with different platforms, either computational or experimental. Ultimately, scientists should interpret the results, and computers and software would be there to facilitate the process.
One essential element for such an approach is a standardized data structure that both a computer and a human being can read. In recent years, the concept of using ontology has been brought into biological research. The creation of the Gene Ontology Consortium, and the subsequent formation of the Open Biology Ontology Foundry were the first indications that biologists are willing to follow such standards. While there are strict implications for the use of the term ontology, “standards” are created, especially for pathway networks, simply for data exchange and other computational purposes.
In this chapter, we will first discuss how biological knowledge is represented in systems biology, particularly the importance of using ontologies or standards to capture biological knowledge. Next, we use PANTHER Pathway as an example to illustrate how, in practice, ontologies and standards play a role in data modeling, data entry, and data display. Last, we describe the usage of such systems. We also describe the computational tools that utilize PANTHER pathway information to analyze gene expression experimental data.
2. Theory: Biological Knowledge Representation
We discuss how biological knowledge is represented, particularly how ontologies and standards are used in capturing biological knowledge and represented in a form that can be read by both computers and scientists.
2.1. What is an Ontology?
Ontology is originated from ancient Greek philosophy. It is a study of being and of existence, and their basic categories and the relationships between them. It is a formal structuring of knowledge.
Contemporary ontology was first used in computer science and information science. It was used as a data model to represent a set of concepts within a domain and the relationships among those concepts. It is often used to reason about the objects within that domain. Nowadays, it is also used as a form of knowledge representation in a number of fields, including artificial intelligence, the Sementic Web, software engineering, biomedical informatics, library science, and information architecture. The contemporary ontology differs from the classical philosophical ontology in that it is expressed in a machine-readable format, and that it assesses in terms of usefulness rather than truth.
An ontology consists of continuants (entities, or things that exist) and occurrents (events, processes, or activities), each of which is described by four main elements: individuals (instances), classes (concepts), attributes, relationships. For example, a particular human type I hexokinase (HXK1) is an instance of the molecule class called “hexokinase” and its molecular weight, number of amino acids, and chromosomal location would be the attributes. Hexokinase is a subtype of another molecule class called “kinase”; therefore, the formal ontology representation of the relationship is hexokinase is_a kinase. Hexokinase catalyzes a phosphorylation reaction (an event) that converts glucose to glucose-6-phosphate, which is one of the reactions in a glycolysis pathway; therefore, the phosphorylation reaction is part_of the glycolysis pathway.
2.2. Ontologies for Biological Knowledge
The Gene Ontology (GO) was probably the first ontology that was designed as a formal representation of biological knowledge (Ashburner et al. 2003; Gene Ontology Consortium 2006). It consists of three knowledge domains: molecular function, biological process, cellular component. Molecular function describes activity, such as catalytic or binding activity, which the gene product possesses at the molecular level. Because the emphasis of molecular function ontology is on activities, it describes action rather than substance; therefore, molecular functions are occurrents rather than continuants (Smith et al. 2003). In other words, GO molecular functions are used to describe the events that gene products are capable of doing, but not the substance aspect of the gene products. Biological processes are occurrents also. A biological process is defined as “a series of events accomplished by one or more ordered assemblies of molecular functions”. The difference between molecular function and biological process is that the former covers biology at the local, individual molecular level, while the latter covers biology at all higher levels, from metabolic pathways to organism-level physiology and even behavior. In addition, a biological process is different from a pathway in that it does not represent the dynamics and dependencies that would be necessary to describe a pathway. Cellular components are continuants. A cellular component describes location, at the level of subcellular structure and macromolecule complex. The subcellular structure can be membrane-bound organelles (e.g., mitochondrion, endoplasmic reticulum), or a non-membrane-bound subcellular compartment (e.g., cytosol, plasma membran). Macromolecule complex is usually protein complex (e.g., the proteasome or spliceosome) that describes the location where a particular molecular function activity resides in a multi-subunit structure (http://www.geneontology.org/GO.doc.shtml).
It has been pointed out that although GO uses hierarchies of terms, it is not a true ontology, because it lacks certain ontological features, such as software implementations and the logical expression of theories encompassing the GO terms (Smith et al. 2003). Nevertheless, it provides a framework of controlled vocabulary that helps biologists to annotate genes and gene products.
2.3. Pathway Ontology and Database
The first example of computation representation of pathway ontology was the EcoCyc database (Karp et al. 1996; Keseler et al. 2005). During the past decade, more than 240 pathway databases have been built and are currently available on the Internet (http://www.pathguide.org/). There are various efforts aiming toward the establishment of an accepted standard or ontology to represent pathway data. Pathway data usually include three major classes. The first class includes the molecules involved in the pathways. The second class includes the chemical reactions in which these molecules are involved. The third class describes the location of the reactions. A pathway ontology should not only represent all these three classes of data, but also capture the intricate relationships among them. For example, a molecule can be related to a reaction as a reactant or a product. The transition from a reactant to a product can be affected by another molecule called a modifier. The modifier can exert various effects to the transition, such as catalysis, stimulation, inhibition, or modulation. Furthermore, the relationship between reactions and cellular components describes the location of these reactions. GO Biological Process ontology is not adequate to represent such data, as it does not capture all the dynamic relationships in the pathways. As a result, two standard formats emerged during the past few years to represent molecular reactions and pathway ontology. Systems Biology Markup Language (SBML) (Hucka et al. 2003) emerged from the computation biology community and is an XML-based software-independent language designed to represent pathway models together with parameters and mathematical rules for quantitative modeling. BioPAX (Luciano 2005), on the other hand, emerged from the genomics community and was created as an exchange format for pathway data. It represents pathway models together with protein sequences and gene identifiers.
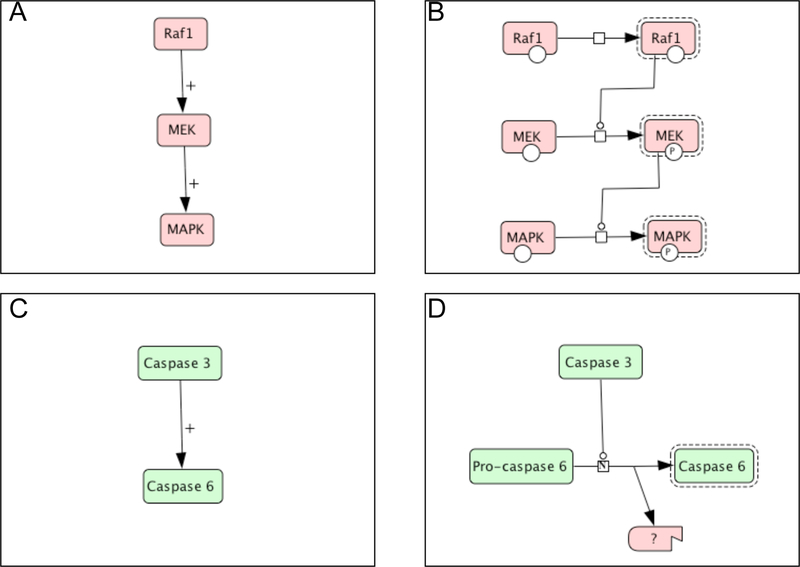
One key feature of both standards is that they represent pathways by biochemical reactions, so detailed molecular events are captured in a structured format. This is usually not an issue in metabolic pathways. However, the conventional way to represent signaling pathways is to use activity flow diagrams. Figure 1A and C represent diagrams that display activity flows of two activation reactions that are commonly seen in scientific papers. Figure 1A shows the typical MAPK cascade, i.e., Raf 1 activates MEK, which subsequently activates MAPK. Figure 1C shows the activation of caspase 6 by caspase 3. The detailed mechanisms for these reactions are left out of the diagram, but rather discussed in unstructured text. Therefore, from the diagram, both reactions look identical. However, the mechanisms of the activation reactions in these two diagrams are completely different. Raf1 and MEK activate MEK and MAPK, respectively, by catalyzing phosphorylation reactions (Figure 1B), while caspase 3 activates caspase 6 by a proteolytic cleavage of pro-caspase 6 to form the mature active form of caspase 6 (Figure 1D). Both SBML and BioPAX will capture these molecular events and store them in a structure format.
Figure 1. Two views of pathway reactions.
(A) and (C). Reaction diagrams that display activity flows of two activation reactions that are commonly used in scientific papers. (B) and (D). Diagrams drawn in CellDesigner, which captures the different molecular mechanisms of the activation reactions illustrated in (A) and (C), respectively.
Of course, a pathway diagram is an integral part of a pathway. Although SBML and BioPAX provide nice structures for a computer to read pathway information, a pathway diagram is still more appealing to human eyes. Software needs to be developed that can read those files, and reflect on diagrams accurately. Recently, a new effort, called Systems Biology Graphic Notation (SBGN), has been launched to create a standard of graphic notations for computation modeling in systems biology (http://www.sbgn.org/). CellDesigner is pathway editing software that conforms SBGN. It allows curators to capture molecular events of the pathway with controlled graphic notations, and store them in a computer-readable format that is compatible with SBML (Kitano 2003; Kitano et al. 2005). Figure 1B and 1D are examples of reactions generated by CellDesigner. However, we also have to recognize that ontology is a very new concept to biologists, who are the end users of the pathway diagrams. The standard will be successful only if it has a large user base. Therefore, displaying the diagram in a form that is familiar to them will encourage more biologists to use the standard. However, such a view can only be used to display the reaction through computation of the detailed information captured by the ontology. PANTHER Pathway implemented an applet that will read the files generated by CellDesigner, and display the diagrams in two views: the standard CellDesigner view, and the Lite view. Figures 1A and 1C are Lite views generated automatically by the applet from 1B and 1D, respectively.
Table 1 summarizes several popular pathway databases. BioCyc (Karp et al. 2005) and the Kyoto Encyclopedia of Genes and Genomes (KEGG) database (Kanehisa et al. 2006; Kushida et al. 2006) are more focused on metabolic pathways, while Integrating Network Objects with Hierarchies (INOH) (Fukuda et al. 2004; Kushida et al. 2006) and Signal Transduction Knowledge Environment (Gough 2002) are focused only on signaling pathways. The remaining pathway databases include both metabolic and signaling pathways. All databases except for the Ingenuity Pathways Knowledge Base support one of, or both, SBML and BioPax format. However, BioCarta, KEGG, and STKE display relational pathway diagrams, which shows the potential inconsistency between the diagrams and the data captured in the back. This also shows the importance of creating a standard for graphic representation of pathways. Pathways (except for STKE) are usually linked to protein sequences, which link the pathways to the genome information. A few databases also provide tools for community curation (BioCyc and PANTHER) and data analysis (Ingenuity and PANTHER).
Table 1.
Comparison of pathway databases
| BioCarta | BioCyc | Ingenuity | INOH | KEGG | PANTHER | PID | Reactome | STKE | |
|---|---|---|---|---|---|---|---|---|---|
| Pathway Type | M, S | M | M,S | S | Μ | M, S | M, S | M, S | S |
| Data Type | Relational | Reaction | Relational | Relational and Reaction | Relational | Reaction | Reaction | Reaction | Relational |
| Standard Format | Bio PAX | Bio PAX, SBML | N/A | SBML | Bio PAX | SBML | Bio PAX | BIO PAX, SBML | Bio PAX |
| link to protein sequences | Yes | Yes | Yes | Yes | Yes | Yes | Yes | Yes | No |
| Link to evolution Information | No | No | No | No | No | Yes | No | No | No |
| Literature Evidence | N/A | Link to reaction | Link to sequence and reaction | N/A | Link to sequence and reaction | Link to reaction | Link to reaction | ||
| Community Curation tools | No | Yes | No | No | No | Yes | No | No | No |
| Analysis tools | No | Yes | No | No | Yes | No | No | No | |
| Availability | Free to all users | Free to Academic users | Fee to use | Free to all users | Free to all users | Free to all users | Free to all users | Free to all users | Free to Academic users |
| References | N/A | Karp et al., 2005 | N/A | Fukuda et al. 2004; Kushida et al. 2006 | Kanehisa et al. 2006 | Mi et al., 2007 | N/A | Joshi-Tope et al 2005 | Gough 2002 |
Abbreviations
M: metabolic pathway
S: signaling pathway
3. Method: PANTHER Pathway System
We use the PANTHER Pathway System as a practical example to show how a pathway database is built to represent biological knowledge, and how ontologies and standards play a role in data modeing, data entry, and data display.
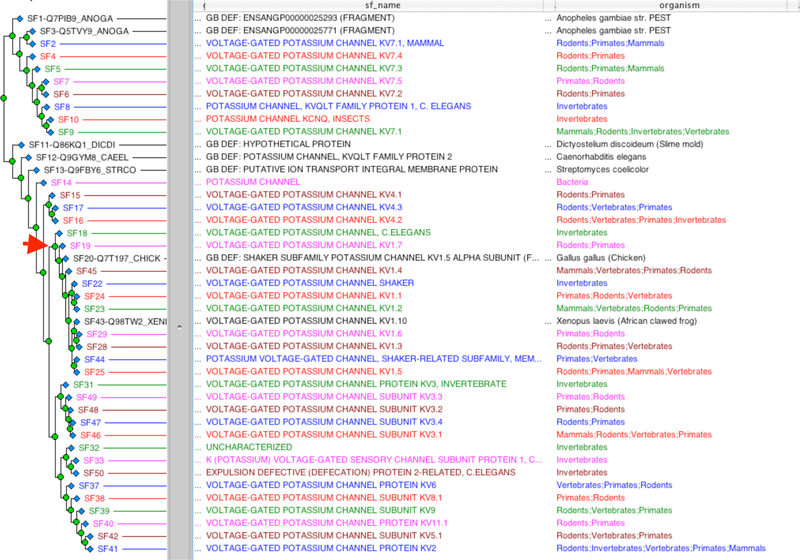
PANTHER (Protein ANalysis THrough Evolutionary Relationships) is a freely available, comprehensive software system for relating protein sequence evolution to the evolution of specific protein functions and biological roles (Mi et al. 2007). The core of the system is a large collection of phylogenetically defined protein families and subfamilies generated by computational algorithms, and curated by expert biologists using an extensive software system for associating ontology terms (Thomas et al. 2003). Each protein family or subfamily is represented by a phylogenetic tree, a hidden Markov model (HMM), and a multisequence alignment (MSA). Protein family trees are constructed computationally from sequence data. Nodes in the tree, corresponding to common ancestors of extant family members, are annotated by expert biologists with their inferred molecular functions and roles in biological processes and pathways, based on experiments performed on extant proteins. These annotated nodes define protein subfamilies, each of which is represented by an HMM to allow classification of newly discovered protein sequences (Figure 2).
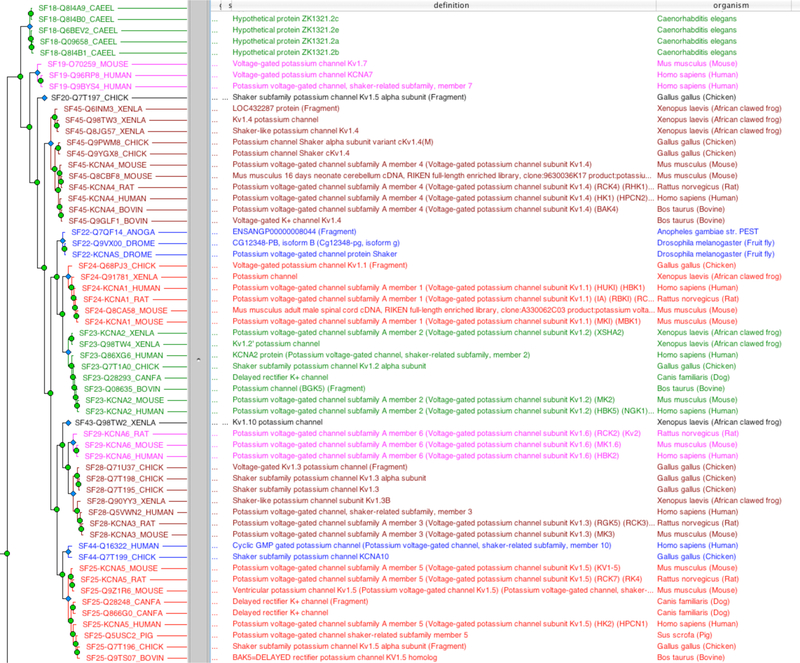
Figure 2. Phylogenetic tree of a PANTHER protein family.
This figure shows an example of a PANTHER protein family PTHR1537, a voltage-gated potassium channel family. The phylogenetic tree was constructed computationally from sequence data. (A) The tree is collapsed to show the subfamilies as leafnodes (blue diamond nodes). Subfamily nodes correspond to common ancestors of extant family members, and are annotated by expert biologists with their inferred molecular functions and roles in biological processes and pathways, based on experiments performed on extant proteins. Each subfamily is represented by a hidden Markov model (HMM) to allow classification of newly discovered protein sequences. (B) A subset of the tree (under red arrow in (A)) is expanded to show an individual training sequence that is used to build a family multisequence alignment, as well as family and subfamily HMMs.
PANTHER Pathway is one of the modules within PANTHER (Mi et al. 2007). All pathways are curated by experts using the PANTHER Pathway Curation Software Module (see later). They are represented by a pathway ontology stored in SBML format, and displayed in diagrams with the CellDesigner applet (discussed later).
3.1. PANTHER Pathway structure
The PANTHER Pathway ontology uses controlled vocabulary to describe pathways, their components, and the relationships among them. The PANTHER Pathway ontology has four key classes.
3.1.1. Pathway class
Pathway class is an occurrent that represents the concept and scope of each pathway. The scope of the pathways is similar to those documented in textbooks or review articles. It is usually very well defined in metabolic pathways, but much less in signaling (or regulatory) pathways. For example, the MAP kinase signaling cascade has been referred to as a pathway on many occasions, but it is also a signaling module in some specific pathways, such as an apoptosis signaling pathway, angiogenesis pathway, or p53 pathway. In PANTHER, the pathways are as representative and inclusive as possible, especially for signaling pathways. A pathway class is associated with the following attributes:
Pathway name – This is usually the name commonly referred to by biologists in the field.
Definition – A description of the pathway.
If a pathway is sufficiently well established to appear in a textbook, a textbook reference is usually sufficient. Otherwise, we require at least three references to support the overall structure and boundaries of the pathway.
3.1.2. Molecule class
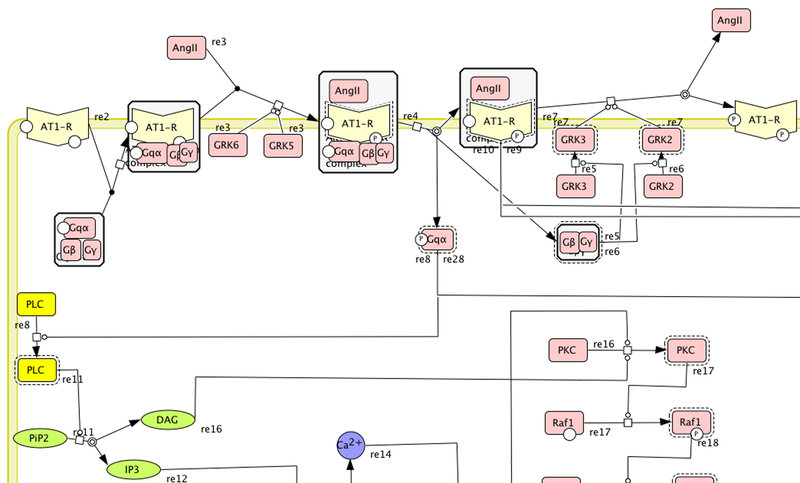
A molecule class is a continuent that represents a specific class of molecules that play the same mechanistic role within a pathway. There are five molecule subclasses: proteins, genes/DNA, RNA, simple molecules (small organic, inorganic, or synthetic molecule), and ions. If a molecule is a protein, gene, or transcribed RNA, it is associated with protein sequences in the PANTHER protein family trees by manual curation (see below). The individual protein sequences are instances of the molecule class. In these cases, a molecule class is typically a group of homologous/orthologous proteins across various organisms that participate in the same specific biochemical reactions within the pathway, e.g., the molecule class “PLC” (phospholipase C) in the pathway “Angiotensin II-stimulated signaling through G proteins and beta-arrestin” includes different subtypes of PLC-beta (PLC-beta 1, PLC-beta 2, PLC-beta 3) in vertebrates (Figure 4). In addition, it is also associated with the following attributes:
Name − The name that appears on the pathway diagram. It is usually an acronym or a short version of the full name, e.g., MAPK.
Full name − The complete, more descriptive version of the name, e.g., Mitogen-activated protein kinase.
Synonyms − All other names used to describe the molecule class, e.g., MAP kinase.
Definition − A short description of the molecule class.
Reference – Literature references, usually OMIM entries or review articles, are captured at this level to support the involvement of the molecule class in the pathway. However, it is not a requirement. More references are captured when sequences are associated to the molecule class.
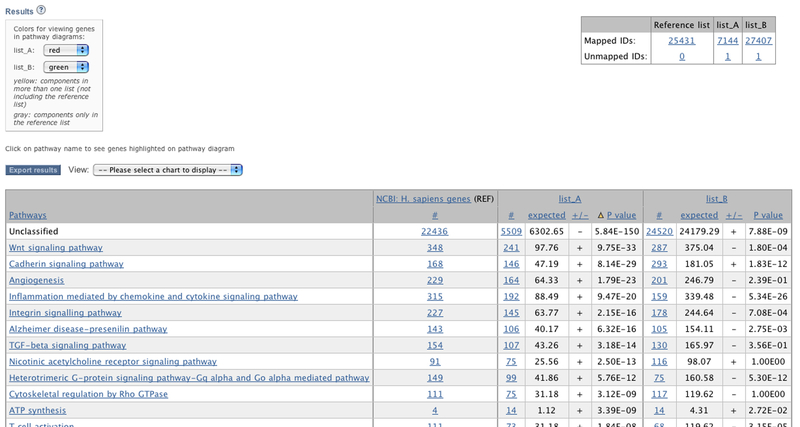
Figure 4. Gene expression data from Compared gene lists tool viewed on PANTHER website.
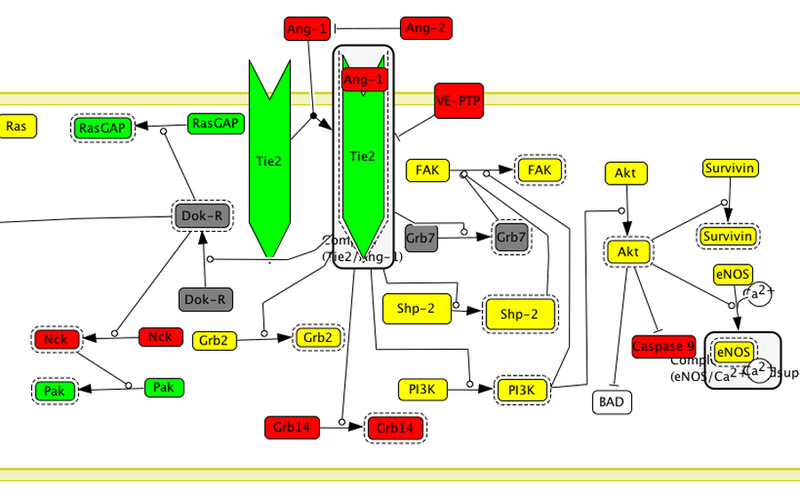
(A) The results from Compare gene lists tool. Two sample lists were uploaded to the tool, List_A and List_B. The NCBI human gene list was used as the reference list. (B) The results in the Angiogenesis pathway show molecule classes only present in List_A (red), List_B (green), or both (yellow).
3.1.3. Reaction class and relationships
The reaction class is an occurrent that represents biochemical relationships among various molecule classes. It is similar to the set of molecular state transition classes from SBGN. Typical examples include transition, transport, complex formation/dissociation, catalysis, modulation, stimulation transcriptional activation/inhibition, and so on.
Based on the reactions, we derive relationships among various molecule classes. For example, if a kinase catalyzes a transition of a protein from a non-phosphorylated state to a phosphorylated state, the kinase is upstream_of, and phosphorylates the protein. Typical relationships include upstream, downstream, phosphorylates, dephosphorylates, acetylates, ubiquitinates, and methylates.
3.1.4. Cell type or subcellular compartment class
This is a continuent representing the location(s) where the reaction occurs. Each molecule class and reaction class are generally associated with a particular cell type or subcellular compartment. Currently, the cell type or component is free text entered by the curator, but we are in the process of enforcing the use of cellular component ontology terms from the Gene Ontology.
3.2. PANTHER Pathway Curation
3.2.1. PANTHER Pathway Curation Software Module
The PANTHER Pathway curation module is another freely available infrastructure to encourage scientists in the community to participate and contribute to the pathway curation effort, and share the knowledge. There are three major properties that make this infrastructure differ from other pathway curation systems, such as from Reactome (Joshi-Tope et al. 2005) and EcoCyc (Keseler et al. 2005). First, the pathway diagrams are drawn with CellDesigner software (Kitano 2003; Kitano et al. 2005). There are two advantages to using CellDesigner. First, controlled graphic notations are used to draw the pathway diagram, and the software automatically creates a computational representation that is compatible with the SBML standard. Second, a pathway diagram can be viewed with an exact, one-to-one correspondence with the ontological representation of the pathways stored in the back end. The second property is that the scope of the pathway is defined first based on literature, and pathway components (proteins, genes, RNAs) are treated as ontology terms, or molecule classes, rather than specific instances. This means that multiple proteins from the same organism or different organisms can potentially play the same given role in a pathway. The advantage is that the work flow is more similar to the thinking process of the biologists who are the users of our curation software module. The third major property is that the curation software is designed to be simple enough to be used directly by bench biologists after a brief training course. All other pathway databases we are aware of employ highly trained curators, who of course cannot be experts in all areas of biology. The current set of PANTHER pathways has been curated by more than 40 different external experts from the scientific community; they must only have demonstrated their expertise with publications in the relevant field.
3.2.2. PANTHER Pathway Curation Process
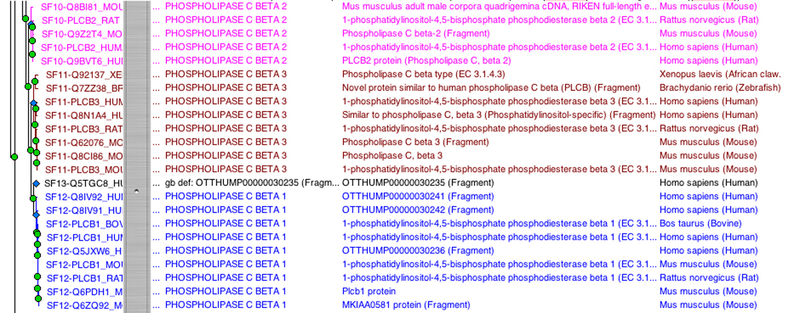
The PANTHER Pathway curation process was carefully designed to capture molecular events and biochemical reactions of the pathways. The curation process is divided into two phases. The first phase is to generate the pathway diagram and ontology. CellDesigner is used as the pathway editing tool for the curator to draw the pathway diagram. The knowledge captured in the diagram is accurately stored in a computer-readable file that is compatible with SBML. Literature references must be provided for the pathway. As mentioned earlier, unless the pathway is well established in the textbook, such as many of the classic metabolic pathways, all pathways require at least three literature references. The pathway file is then parsed by a computer program to create the pathway ontology, which is stored in the PANTHER Pathway curation database, implemented in Oracle. The second phase is the sequence annotation step, where the curator works with a direct web interface to the curation database. If a pathway molecule is a protein, gene, or transcript, it is associated with protein sequences in the PANTHER database that are used to build the PANTHER protein family trees, and the family and subfamily HMM models (Figure 3). The interface displays each of the molecule classes (terms) that correspond to a protein, mRNA, or gene. At this point, these are simply the terms the curator had used to name the classes in the CellDesigner pathway diagram. The system allows the curators to search for the trainings sequences based on the molecule class term and manually associate the sequences to the ontology term (Figure 3). For each annotation, a confidence code must be selected from the list defined by the Gene Ontology Consortium and a PubMed identifier of the source of the literature references as evidence (see below). Curators are allowed to associate orthologous or even paralogous sequences to the molecule class without experimental evidence, using the ISS (inferred by sequence similarity) evidence code.
Figure 3. Associating pathway molecule classes to subfamilies in a phylogenetic tree.
(A) A molecule class of phospholipase C (PLC, in yellow) in the Angiotensin II-stimulated signaling through G protein and beta-arrestin (PANTHER accession P05911). (A) The phylogenetic tree of phospholipase C subfamilies (PANTHER accession PTHR10336:SF10 -- SF12). A web curation interface is built to allow expert biologists to associate protein training sequences of the tree to the molecule class. For each annotation, a confidence code must be selected from the list defined by the Gene Ontology Consortium and a PubMed identifier of the source of the literature references as evidence.
3.2.3. Literatures and References
References are captured at three levels. First, each pathway as a whole requires a reference. For signaling pathways, at least three references, usually review papers, are required in order to provide a more objective view of the scope of the pathway. For metabolic pathways, a textbook reference is usually sufficient. Second, references are often associated to each molecule class in the pathway. Most of these references are OMIM records or review papers. Third, references are provided to support association of specific protein sequences with a particular molecule class, e.g., the SWISS-PROT sequence P53_HUMAN annotated as an instance of the molecule class “P53” appearing in the pathway class “P53 pathway”. These are usually research papers that report the experimental evidence that a particular protein or gene participates in the reactions represented in the pathway diagram.
4. Usage: PANTHER Gene Expression Analysis Tools
We have discussed the importance of using ontology for knowledge representation of biological data. We also use PANTHER pathway as an example to show how such standards and ontology are used in practice to capture biological knowledge. The ultimate goal of building such infrastructures is to use them for the analysis of biological research data in an efficient and robust way. PANTHER provides a number of applications and services to help our users in their research (Thomas et al. 2006). One of them is the gene expression analysis application, which is to find statistically significant associations between gene expression experiment results and gene function.
4.1. Compare Gene List Tool
This tool is based conceptually on the simple binomial test described previously (Cho et al. 2000). An input list is divided into groups based on PANTHER classification (either molecular function, biological process, or pathway). As many as four lists can be uploaded for each analysis. A reference list, which usually contains all the genes/proteins from which the list was drawn, is divided into groups in the same way. PANTHER provides NCBI human and mouse lists as default reference lists, so uploading a reference list is optional. Then, for each functional category, e.g., protein kinase for molecular function, cell proliferation for biological process, or apoptosis signaling pathway for pathway, the binomial test is applied to determine whether there is a statistical over- or under-representation of genes/proteins in the input list relative to the reference list.
The input files or reference file must be in one of two formats. If the user wishes to use the pre-calculated HMM scoring data stored on the PANTHER website, the format is simply a single column file of identifiers that can specify records in the PANTHER database. Currently, the pre-calculated data covers only the human, mouse, rat, and Drosophila genomes. The supported identifiers include gene identifiers (Entrez Gene (Pruitt et al. 2001) for human, mouse and rat, or FlyBase (FlyBase Consortium 2003; Wilson et al. 2008) FBgn numbers for Drosophila), protein identifiers (RefSeq or FlyBase), and gene symbols. If the user wishes to use a file generated by scoring that user’s own protein sequences against the PANTHER family/subfamily HMMs (available for download at http://www.pantherdb.org/downloads), the “PANTHER generic mapping file” format must be used instead. This format consists of two columns: the first column can be any type of identifier used to score; the second column is the PANTHER HMM identifier (e.g., PTHR10000, or PTHR10000:SF1), which is used to look up molecular function, biological process, and pathway associations.
The output of the tool is a list of P-values for under- or over-representation of each functional category in each of the input lists (Figure 4A). From this output page, the user can export the statistics, or follow links to graphically view (as pie charts or bar graphs) the data used to compute the P-values, or to look at the list of genes/proteins in any functional group. When pathways are chosen as the functional categories, clicking on the pathway name brings up pathway diagrams colored according to preferences specified by the user (Firgure 4B).
4.2. Analyze List with Gene Expression Values
This tool is for analysis of a complete list of genes/proteins that have numerical data associated with each gene/protein. The numerical data can be normalized raw readouts from the microarray experiments or, more commonly, the fold-change value for each gene in a differential expression experiment. The statistical test is general enough to handle any numerical data, continuous or discontinuous. First, a reference distribution is generated by the statistical tool using all values for all input data in the list, and then distributions for each functional categories are generated. The probability that the functional category distribution was drawn randomly from the reference distribution is estimated using the Mann-Whitney Rank-Sum Test (U-Test) (Clark et al. 2003). This tool provides a more sensitive test than the simple list-based test described in Section 4.1.
For this test, only a single input file is needed. Similar to those in the list comparison tool (Section 4.1), there are two formats for the uploaded file, depending on the desired source of the PANTHER classification data: either the pre-calculated classifications available on the PANTHER site, or a user-generated file. For using the pre-calculated PANTHER data, the file must contain two columns: the first is the gene or protein identifier, and the second is the numerical value. For user-specified data, the file must contain three columns: an arbitrary tracking identifier (e.g., a UniProt identifier or gene symbol), the PANTHER HMM identifier indicating the classification of the gene/protein, and the numerical value.
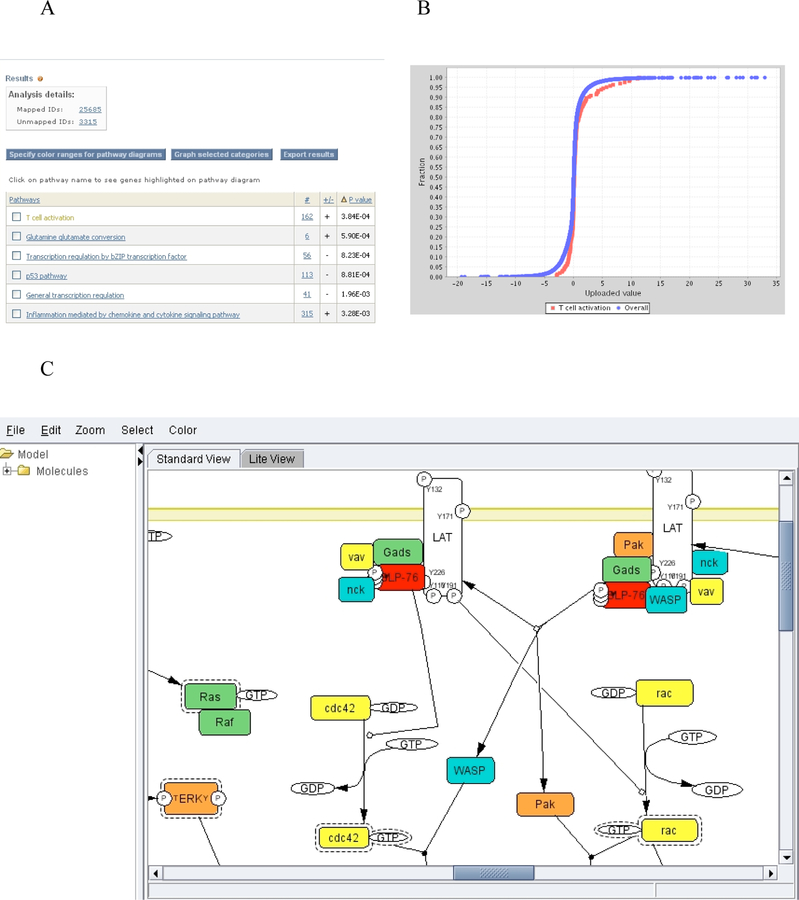
The output of the tool is a list of P-values for each comparison between a functional category distribution and the reference distribution (Figure 5A). Each distribution, and how it compares to the reference distribution, can be viewed graphically from the output page. We find that this is critical for interpreting any deviation between the functional category distribution and the overall distribution (Figure 5B). The genes/proteins in each category can also be viewed from the output page by clicking on the listed counts. In addition, for pathways, clicking on the pathway name will bring up an interactive Java applet that colors the pathway using a “heat map” derived from the input values (Figure 5C).
Figure 5. Gene expression data from Analyze a list of genes with gene expression values tool viewed on PANTHER website.
(A) The output of the tool with a list of P-values for each comparison between a functional category distribution and the reference distribution. (B) Comparison of the distributions from T-cell activation signaling pathway (red) and reference (blue) in graph view. (C) A pathway diagram of T-cell activation signaling pathway that is visualized using an interactive pathway JAVA applet that colors the pathway using a “heat map” derived from the input values.
5. Notes
In both gene expression analysis tools, users can upload two types of file. The file format that supports pre-calculated PANTHER classification is simple and easy to use. It does not require scoring and generating the classification file. However, its limitation is that only four organisms and a few identifier types are supported by PANTHER. Many researchers are using microaray platforms that use identifiers other than Entrez ID or RefSeq. Sometimes, it could be a mix of different types of IDs in the same file. Many of our users are not bioinformaticists, so they are not aware of the differences between all the different types of ID. On the results page, we show how many sequences are actually mapped to the pre-calculated PANTHER classification. If the unmapped IDs are over 20%, it is very likely that there are wrong types of IDs in the input file.
If the identifiers from the input file are from one of the four organisms supported by PANTHER (human, mouse, rat, and fly), but not the supported types of IDs, the user can convert them to one of the supported types by using some public tools. One tool is the IDmapper developed by European Bioinformatics Institute (EBI) and on its UniProt website (http://www.pir.uniprot.org/search/idmapping.shtml).
If the identifiers from the input file are from organisms other than the four organisms supported by PANTHER, then the user must score them against the PANTHER HMM library, and generate the classification (Thomas et al. 2006).
4. References
- Ashburner M, Mungall CJ, Lewis SE. Ontologies for biologists: a community model for the annotation of genomic data. Cold Spring Harb Symp Quant Biol 2003; 68:227–35. [DOI] [PubMed] [Google Scholar]
- Cho RJ, Campbell MJ. Transcription, genomes, function. Trends Genet 2000; 16 (9):409–15. [DOI] [PubMed] [Google Scholar]
- Clark AG, Glanowski S, Nielsen R et al. Inferring nonneutral evolution from human-chimp-mouse orthologous gene trios. Science 2003; 302 (5652):1960–3. [DOI] [PubMed] [Google Scholar]
- FlyBase Consortium. The FlyBase database of the Drosophila genome projects and community literature. Nucleic Acids Res 2003; 31 (1):172–5. [DOI] [PMC free article] [PubMed] [Google Scholar]
- Fukuda KI, Yamagata Y, Takagi T. FREX: a query interface for biological processes with hierarchical and recursive structures. In Silico Biol 2004; 4 (1):63–79. [PubMed] [Google Scholar]
- Gene Ontology Consortium. The Gene Ontology (GO) project in 2006. Nucleic Acids Res 2006; 34 (Database issue):D322–6. [DOI] [PMC free article] [PubMed] [Google Scholar]
- Gough NR. Science’s signal transduction knowledge environment: the connections maps database. Ann N Y Acad Sci 2002; 971:585–7. [DOI] [PubMed] [Google Scholar]
- Hucka M, Finney A, Sauro HM et al. The systems biology markup language (SBML): a medium for representation and exchange of biochemical network models. Bioinformatics 2003; 19 (4):524–31. [DOI] [PubMed] [Google Scholar]
- Joshi-Tope G, Gillespie M, Vastrik I et al. Reactome: a knowledgebase of biological pathways. Nucleic Acids Res 2005; 33 (Database issue):D428–32. [DOI] [PMC free article] [PubMed] [Google Scholar]
- Kanehisa M, Goto S, Hattori M et al. From genomics to chemical genomics: new developments in KEGG. Nucleic Acids Res 2006; 34 (Database issue):D354–7. [DOI] [PMC free article] [PubMed] [Google Scholar]
- Karp PD, Ouzounis CA, Moore-Kochlacs C et al. Expansion of the BioCyc collection of pathway/genome databases to 160 genomes. Nucleic Acids Res 2005; 33 (19):6083–9. [DOI] [PMC free article] [PubMed] [Google Scholar]
- Karp PD, Riley M, Paley SM et al. EcoCyc: an encyclopedia of Escherichia coli genes and metabolism. Nucleic Acids Res 1996; 24 (1):32–9. [DOI] [PMC free article] [PubMed] [Google Scholar]
- Keseler IM, Collado-Vides J, Gama-Castro S et al. EcoCyc: a comprehensive database resource for Escherichia coli. Nucleic Acids Res 2005; 33 (Database issue):D334–7. [DOI] [PMC free article] [PubMed] [Google Scholar]
- Kitano H A graphical notation for biochemical networks. Biosilico 2003; 1:169–76. [Google Scholar]
- Kitano H, Funahashi A, Matsuoka Y et al. Using process diagrams for the graphical representation of biological networks. Nat Biotechnol 2005; 23 (8):961–6. [DOI] [PubMed] [Google Scholar]
- Kushida T, Takagi T, Fukuda KI. Event ontology: a pathway-centric ontology for biological processes. Pac Symp Biocomput 2006:152–63. [PubMed]
- Luciano JS. PAX of mind for pathway researchers. Drug Discov Today 2005; 10 (13):937–42. [DOI] [PubMed] [Google Scholar]
- Mi H, Guo N, Kejariwal A et al. PANTHER version 6: protein sequence and function evolution data with expanded representation of biological pathways. Nucleic Acids Res 2007; 35 (Database issue):D247–52. [DOI] [PMC free article] [PubMed] [Google Scholar]
- Pruitt KD, Maglott DR. RefSeq and LocusLink: NCBI gene-centered resources. Nucleic Acids Res 2001; 29 (1):137–40. [DOI] [PMC free article] [PubMed] [Google Scholar]
- Smith B, Williams J, Schulze-Kremer S. The ontology of the gene ontology. AMIA Annu Symp Proc 2003:609–13. [PMC free article] [PubMed]
- Thomas PD, Campbell MJ, Kejariwal A et al. PANTHER: a library of protein families and subfamilies indexed by function. Genome Res 2003; 13 (9):2129–41. [DOI] [PMC free article] [PubMed] [Google Scholar]
- Thomas PD, Kejariwal A, Guo N et al. Applications for protein sequence-function evolution data: mRNA/protein expression analysis and coding SNP scoring tools. Nucleic Acids Res 2006; 34 (Web Server issue):W645–50. [DOI] [PMC free article] [PubMed] [Google Scholar]
- Wilson RJ, Goodman JL, Strelets VB. FlyBase: integration and improvements to query tools. Nucleic Acids Res 2008; 36 (Database issue):D588–93. [DOI] [PMC free article] [PubMed] [Google Scholar]


