

Summary
Whether hippocampal neurogenesis persists throughout life in the human brain is not fully resolved. Here we demonstrate that hippocampal neurogenesis is persistent through the tenth decade of life, and is detectable in patients with mild cognitive impairments and Alzheimer’s disease. In a cohort of 18 patients with a mean age of 90.6 years, Nestin+Sox2+ neural progenitor cells (NPCs) and DCX+ neuroblasts and immature neurons were detected, but their numbers greatly varied between patients. Nestin+ cells localize in the anterior hippocampus while NPCs neuroblasts and immature neurons are evenly distributed along the anterior/posterior axis. The number of DCX+PCNA+ cells is reduced in mild cognitive impairments and higher numbers of neuroblasts are associated with better cognitive status. The number of DCX+PCNA+ cells correlates with functional interactions between presynaptic SNARE proteins. Our results suggest that hippocampal neurogenesis persists in the aged and diseased human brain and the possible association of neurogenesis with cognition.
Keywords: human neurogenesis, adult neurogenesis, neural stem cells, neurogenesis in aging, cognitive dysfunction, aging, Alzheimer’s disease
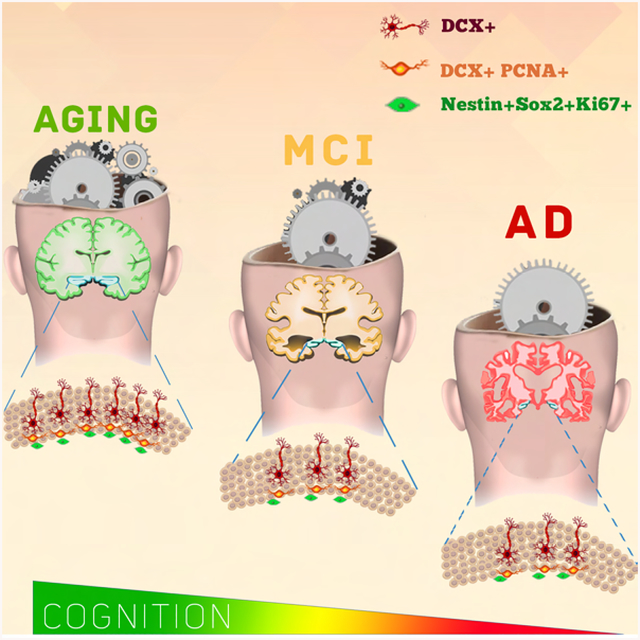
Graphical Abstract
Tobin et al. observe persistent hippocampal neurogenesis in aging brains with no cognitive impairments, mild cognitive impairments and Alzheimer’s disease. The number of neuroblasts drops in individuals with mild cognitive impairments. Higher numbers of neuroblasts are associated with better cognitive status and greater functional interaction of synaptic proteins.
Introduction
It is well established that adult hippocampal neurogenesis declines with age and this has been demonstrated in rodents (Demars et al., 2013), non-human primates (Aizawa et al., 2011; Leuner et al., 2007), and humans (Bergmann et al., 2015). There is a general consensus in the neurogenesis field that hippocampal neurogenesis in the human brain persists throughout adulthood (Kempermann et al., 2018). However, a recent study by Sorrells et al. (Sorrells et al., 2018) suggests that adult hippocampal neurogenesis is non-existent beyond adolescence showing undetectable levels of proliferating cells (Ki67+Sox2+) and immature neurons (DCX+PSA-NCAM+) in both aged non-human primates and young or adult humans. While these findings have reignited debate in the field, they starkly contrast with other recently published data demonstrating that adult hippocampal neurogenesis is sustained through aging in the human brain, albeit at lower levels than in the young human brain (Boldrini et al., 2018; Kempermann et al., 2018; Moreno-Jimenez et al., 2019; Spalding et al., 2013; Tartt et al., 2018). Moreover, a recent study demonstrates the existence of neurogenesis in Alzheimer’s disease (AD) (Moreno-Jimenez et al., 2019).
While landmark studies of human neurogenesis utilized birth dating strategies, including thymidine analog incorporation (Eriksson et al., 1998; Ernst et al., 2014) and carbon dating (Spalding et al., 2013), limitations of recent studies, including our study here, stem from the reliance upon utilization of proxy markers (e.g., DCX) which may not reliably demonstrate adult neurogenesis as it does in rodents. With that said, using similar proxy markers as several recent studies (Boldrini et al., 2018; Moreno-Jimenez et al., 2019; Sorrells et al., 2018), we demonstrate that adult hippocampal neurogenesis is present from the eighth to the tenth decade of life and that it is detectable even in persons with mild cognitive impairments (MCI) and AD. Moreover, we observed a decline in the number of DCX+PCNA+ neuroblasts in people with MCI and show that higher numbers of these neuroblasts correlate with improved global cognitive scores and an overall better clinical diagnosis. Finally, we show association between the numbers of cells within different neurogenic subpopulations and levels of presynaptic markers. Specifically, we observed positive correlation between the number of DCX+PCNA+ and the level of interaction between the SNARE proteins syntaxin and SNAP-25. Disrupted levels of these proteins are associated with cortical atrophy and dementia (Ramos-Miguel et al., 2017) while greater levels are associated with cognitive reserve (Honer et al., 2012). Taken together, our study provides evidence that the extent of neurogenesis is associated with cognitive status and that a decline in neurogenesis may be an early event in AD.
Results
Neural progenitor cells and neuroblasts are detectable in the aged and AD hippocampus.
In these studies, we examined hippocampi from 18 individuals between the ages of 79 and 99 years (Supplementary Table 1) for the presence of neural progenitor cells (NPCs), proliferating NPCs, neuroblasts, or immature neurons. Each cell count was normalized in cubic millimeters and the volume-normalized cell counts were upweighted to total dentate gyrus (DG) volumes obtained from postmortem ex vivo MRI to estimate the total numbers of these cell types present in the entire DG. Additionally, cell numbers were stratified into counts in the granule cell layer (GCL) and subgranular layer (SGL) of the dentate gyrus.
To examine the presence of NPCs we quantified the number of cells that were immunopositive for several combinations of proxy markers of neurogenesis. We quantified the volume-normalized cell counts of these cell types in the SGL and GCL separately. We found that in the SGL, these individuals had an average of 419.9 ± 119 Nestin+ cells/mm3 (Figure 1a), 898.9 ± 216.6 PCNA+ cells/mm3 (Figure 1b). To determine the number of proliferating Nestin+ cells we quantified the number of double labeled Nestin+PCNA+ cells and observed that these individuals had an average of 11.2 ± 6.7 Nestin+ PCNA+ cells/mm3 (Figure 1c). In the GCL, these subjects had an average number of 284.4 ± 85.55 Nestin+ cells/mm3 (Figure 1d), 1,096 ± 295.5 PCNA+ cells/mm3 (Figure 1e), and 3.5 ± 2.4 Nestin+ PCNA+ cells/mm3 (Figure 1f). When upweighted to the volume of the entire DG, our data suggests a mean count of 55,460 ± 14,687 Nestin+ cells (Figure 1g), an average count of 163,564 ± 43,292 PCNA+ (Figure 1h) and an average count of 1,567 ± 669 Nestin+PCNA+ (Figure 1i). The 95% confidence intervals for Nestin+ cells in the SGL, GCL, and total are (2799, 14,023), (2896, 11,747), and (8335, 25,341) respectively (Table 1). The 95% confidence intervals for PCNA+ cells in the SGL, GCL, and total are (8845, 26941), (18541, 64316), and (33052, 96006) respectively (Table 1). As these confidence intervals do not include zero, we can say with 95% certainty that Nestin+ and PCNA+ cell types exist in the adult human dentate gyrus. While single positive cells were detectable from all 18 subjects, double and triple positive cells were detectable from subsets of subjects. Out of 18 subjects, 33.3% of subjects (p=6/18) subjects showed positive Nestin+PCNA+ (95% CI for p: 0.12, 0.97, Table 2). To better characterize these cells and improve our ability to ascertain whether these are NPCs, we quantified numbers of Nestin+Sox2+ double positive cells (Figure 1j,m,p). To determine whether a fraction of these NPCs proliferate, we quantified the number of Nestin+Sox2+Ki67+ triple positive cells from the DG (Figure 1l,o,q). Ki67 was used to validate data obtained using PCNA, because Ki67 was previously reported to be more specific (Bologna-Molina et al., 2013). 77.8% subjects (p=14/18) showed the presence of Nestin+Sox2+ cells (95% CI for p: 0.7, 1, Table 2), where the number of cells for positive subjects were 45.7 ± 10.3 cells/mm3 (Figure 1j). Almost all subjects (p=17/18) showed positive Nestin+Ki67+, where the number of cells were 18.9 ± 2.9 cells/mm3 (Figure 1k). The 95% confidence intervals for Nestin+Ki67+ cells in the DG are (859, 2,016, Table 1). 50% subjects (p=9/18) showed positive Nestin+Sox2+Ki67+ (95% CI for p: 0.26, 1, Table 2), where the number of cells for positive subjects were 9.3 ± 1.3 cells/mm3 (Figure 1l). When upweighted to the volume of the entire DG for subjects with positive double/triple labelled cells, our data estimates a mean count as 2,473.7 ± 494.1 for Nestin+Sox2+ (Figure 1m), 1437.8 ± 274.2 for Nestin+Ki67+ (Figure 1n) and 773.7 ± 108.9 for Nestin+Sox2+Ki67+ (Figure 1o). Of these 18 subjects, 10 (55.6%) had AD (Supplementary Table 1). These results suggest that NPCs are present in the aging, MCI, and AD hippocampus. It should be noted that in contrast to previous reports (Bologna-Molina et al., 2013), our comparison between Ki67+ and PCNA+ labeling in Nestin+ was inconclusive. Some brain sections had higher number of Nestin+PCNA+ compared to Nestin+Ki67+ and vice versa (Supplemental Figure 1). Based on this data, one cannot conclude that one proxy exhibits greater specificity compared to the other. Rather, our data in postmortem human brain sections suggests that Ki67 and PCNA are complementary proxies of cell proliferation in NPCs. More studies are warranted in order to determine their expression pattern in adult neurogenesis.
Figure 1. Counts of neural progenitor cells in the hippocampus of aged humans.

a-c. Cell counts in the SGL: Nestin+ (a), PCNA+ (b), Nestin+PCNA+ (c). d-f. Cell counts in the GCL: Nestin+ (d), PCNA+ (e), and Nestin+PCNA+ (f). g-i. Cell counts upweighted to DG volume: Nestin+ (g), PCNA+ (h), and Nestin+PCNA+ (i). j-l. Total cell counts in the DG: Nestin+Sox2+ (j), Nestin+Ki67+ (k), Nestin+Sox2+Ki67+ (l). m-o Cell counts upweighted to DG volume. Nestin+ (m), Nestin+Ki67+ (n), Nestin+Sox2+Ki67+ (o). Data represent the mean ± SEM of all 18 subject with each data point corresponding to a single subject. Clinical diagnosis is color coded (black = normal, no cognitive impairments, blue = mild cognitive impairments, red = Alzheimer’s disease). p,q. Representative images of Nestin+Sox2+ (p) or Nestin+Sox2+Ki67+ (q) -expressing cells. (GCL and SGL are noted, white outline = area presented in high power on the right). Scale bar represents low magnifications images (left panel): 20 μm, high magnification images (right panel): 10 μm.
Table 1. Regression coefficients and 95% confidence intervals for cell counts upweighted to regional hippocampal volumes for all 18 patients.
Estimated quantification of single (Nestin+, PCNA+, DCX+) or double (Nestin+Ki67+) immunolabeled cells present in the SGL, GCL and whole DG in brain sections of humans participated in this study.
| Subgranular Layer | |||
|---|---|---|---|
| 95% Confidence Interval | |||
| Estimate | Lower Bound | Upper Bound | |
| Nestin+ | 8411 | 2799 | 14023 |
| PCNA+ | 17892 | 8845 | 26941 |
| DCX+ | 10653 | 4213 | 17093 |
| Granular Cell Layer | |||
| 95% Confidence Interval | |||
| Estimate | Lower Bound | Upper Bound | |
| Nestin+ | 7321 | 2896 | 11747 |
| PCNA+ | 41429 | 18542 | 64316 |
| DCX+ | 30381 | 15900 | 44861 |
| Total | |||
| 95% Confidence Interval | |||
| Estimate | Lower Bound | Upper Bound | |
| Nestin+ | 16838 | 8335 | 25341 |
| PCNA+ | 64529 | 33052 | 96006 |
| DCX+ | 48208 | 25065 | 71351 |
| Nestin+Ki67+ | 1438 | 859 | 2016 |
Table 2. Proportion of patients with double and triple positive cells and 95% confidence intervals for all 18 patients.
Proportion and 95% confidence intervals of patients positive for double (Nestin+PCNA+, Nestin+Sox2+, DCX+PCNA+) or triple (Nestin+Sox2+Ki67+) immunolabeled cells in brain sections of humans participated in this study.
| Total | |||
|---|---|---|---|
| 95% Confidence Interval | |||
| Proportion | Lower Bound | Upper Bound | |
| Nestin+PCNA+ | 0.333 | 0.12 | 0.97 |
| Nestin+Sox2+ | 0.778 | 0.7 | 1 |
| Nestin+Sox2+Ki67+ | 0.5 | 0.26 | 1 |
| DCX+PCNA+ | 0.5 | 0.09 | 1 |
We next sought to determine the presence of neuroblasts and immature neurons in these brains. We found that in the SGL, these individuals had an average of 771.6 ± 181.1 DCX+ cells/mm3 (Figure 2a,g). In the GCL, these subjects had an average number of 735.3 ± 180.9 DCX+ cells/mm3 (Figure 2b). When upweighted to the volume of the entire DG, our data suggests an average count of 127,342 ± 28,864 DCX+ cells (Figure 2c). The 95% confidence intervals for DCX+ cells in the SGL, GCL, and total are (4213, 17093), (15900, 44861), and (25065, 71351) respectively (Table 1). As these confidence intervals do not include zero, we can say with 95% certainty that DCX+ cells exist in the adult human dentate gyrus. To determine the number of proliferating neuroblasts we quantified the number of DCX+PCNA+. The average number of DCX+PCNA+ in the SGL was 13.65 ± 6.81(Figure 2d), and in the GCL 22.8 ± 8.7 (Figure 2e). 50% subjects (p=9/18) showed positive DCX+PCNA+ (95% CI for p: 0.09, 1, Table 2). Upweighted to the volume of the entire DG, our data estimates a mean count as 3,054 ± 1,149 for PCNA+DCX+ cells (Figure 2f). Collectively, this suggests that NPCs, neuroblasts, and immature neurons remain detectable even in aging persons with disorders affecting hippocampal function.
Figure 2. Quantification of neuroblasts and immature neurons in the hippocampus of aged humans.

a-c. Number of DCX+ cells in the SGL (a), GCL (b) and whole DG (c). d-f. Number of DCX+PCNA+ cells in the SGL (d), GCL (e) and whole DG (f). Data represent the mean ± SEM of all 18 subject with each data point corresponding to a single subject. Clinical diagnosis is color coded (black = normal, no cognitive impairments, blue = mild cognitive impairments, red = Alzheimer’s disease). g. Representative images of DCX - expressing cells co-stained with DAPI (GCL and SGL are noted, white outline = area presented in high power on the right). Scale bar Top and Middle Panels: low magnification 20 μm, high magnification 20 μm. Bottom Panel: low magnification 10 μm, high magnification 20 μm.
One potential obstacle to studying postmortem brain tissue is the postmortem brain interval (PMI) with some previous studies demonstrating a deleterious effect of prolonged PMI on brain antigenicity (Boldrini et al., 2009; Lewis, 2002; Li et al., 2003). Most of the tissue used in our study had a PMI ≤ 20 hours. To investigate the effect of PMI on our cell counts, we performed Spearman’s rank-order correlation analysis between PMI and cell numbers. We observed an inverse correlation between the number of Nestin+, PCNA+, and DCX+ cells in the SGL and GCL and PMI (Supplemental Figure 2a,b,e,f,i,j). However, these correlations only reach statistical significance for Nestin+ and PCNA+ cells specifically in the SGL (Supplemental Figure 2b,f). It should be noted that we had only one case of PMI > 20h, thus, further analysis is required in order to establish an association between PMI and number of cells in postmortem brain sections. These results may suggest that the PMI should be taken into consideration during tissue selection for this type of analysis.
More Nestin+ cells in the anterior dentate gyrus
Due to known differences in the functional significance of the dorsal and ventral parts of the hippocampus (Bannerman et al., 2003; Fanselow and Dong, 2010; Henke, 1990; Moser et al., 1993; Moser et al., 1995; Swanson and Cowan, 1977) we next wanted to determine if there were any correlations between the number of cells and the location within the hippocampal formation. To do this, linear mixed effects regression with subject-specific random slope and intercept was performed. The location in the hippocampus was measured as the distance posterior to the mammillary bodies (the anatomical landmark used to determine the anterior most aspect of the hippocampus). It is noteworthy that the number of sections per subject determined by absolute distance as described above vary across subjects due to differences in individual hippocampal shape and volume. We additionally examined statistical meta-analysis that estimates each subject’s slope and then synthesized to draw inference across subjects. Results from linear mixed effects regression are presented to demonstrate any correlation between cell count and location within the hippocampus (Figure 3). We found that the number of Nestin+ cells in the SGL (Figure 3a, β = −0.265, p = 0.038), the number of Nestin+ cells in the GCL (Figure 3d, β = −0.325, p = 0.02), and the total number of Nestin+ cell (Figure 3g, β = −0.336, p = 0.015) had a significant negative association with the distance posterior to the mammillary bodies, meaning that the more posterior in the hippocampus (i.e. the dorsal aspects of the hippocampus), the fewer number of Nestin+ cells were present. There were no other significant associations detected for the other cell types or layers of the dentate gyrus (Figures 3b,c,e,f,h–n), suggesting that NPCs, neuroblasts, and immature neurons are evenly distributed along the dorsal-ventral axis.
Figure 3. Correlation of cell numbers along the dorsal/ventral axis of the hippocampus.

a-c. Correlation of Nestin+ (a), PCNA+ (b), and DCX+ (c) cell counts in the SGL. d-f. Correlation of Nestin+ (d), PCNA+ (e), and DCX+ (f) cell counts in the GCL. g-n. Correlation of total Nestin+ (g), PCNA+ (h), DCX+ (i), Nestin+Sox2+ (j), Nestin+PCNA+ (k), Nestin+Ki67+ (l), Nestin+Sox2+Ki67+ (m) and DCX+PCNA+ (n) cell counts upweighted to DG volume. Coefficients (β) were estimated with each cell volume normalized with mean and standard deviation.
Reduced numbers of neuroblasts in MCI
To start to address a possible association between the extent of neurogenesis and cognition we tested the correlation between the number of neurogenic proxy and cognitive diagnosis. For this purpose, we performed logistic regression analysis. We show a significant association between the number of DCX+PCNA+ cells and cognitive diagnosis, where patients with MCI, compared to normal patients with no cognitive impairments, are associated with fewer numbers of DCX+PCNA+ cells (P=0.038, Figure 4a). In addition, when combined into one group of patients with cognitive impairments (MCI+AD), these patients show a trend towards fewer DCX+PCNA+ cells, but the association fails to reach statistical significance (P=0.068, Figure 4b). These results suggest that with higher numbers of DCX+PCNA+ cells, it is less likely that one would have MCI or AD. General linear model (GLM) analysis with global cognitive score and the number of DCX+PCNA+ cells shows significant association (P=0.0461, Figure 4c), suggesting that higher numbers of DCX+PCNA+ cells correlate with higher cognitive scores. Interestingly, association between global cognitive scores and the number of Nestin+Sox2+Ki67+ cells is also suggested, albeit insignificant (P=0.098, Figure 4d), where lower cognitive score is associated with higher numbers of Nestin+Sox2+Ki67+ cells. These analyses suggest a possible association between the extent of neurogenesis and cognitive status. In addition, it suggests that cognitive status may be associated with differential levels of distinct neurogenic subpopulations. Lastly, the number of DCX+PCNA+ cells may be indicative of early cognitive decline.
Figure 4. Association of neurogenesis with cognitive diagnosis and presynaptic proteins.

a,b. Logistic regression analysis of cognitive diagnosis and the number of DCX+PCNA+ cells shows significant correlation with MCI (p=0.038) (a) and borderline significance with MCI+AD (p=0.067) (b). c,d. Association between the number of DCX+PCNA+ (c) or Nestin+Sox2+Ki67+ (d) cells and global cognition score (p=0.046, p=0.098, respectively). e. Association between the number of DCX+PCNA+ cells and SNARE protein-protein interaction (p=0.0038). f. Representative image showing the distribution of presynaptic proteins in the dentate gyrus of the hippocampus inner molecular layer (IML), granule cell layer (GCL), subgranular layer (SGCL) and CA4 subfield. SNAP-25 immunostaining (magenta) with cell nuclei stained with DAPI (green) in a section of brain where DCX+PCNA+ cells were identified. Scale bar representes 25 μm.
Increasing evidence suggests that levels of synaptic proteins are associated with cognitive decline (Ramos-Miguel et al., 2018; Ramos-Miguel et al., 2017). Particularly, the ability of the SNARE proteins (i.e., syntaxin-1, SNAP25, VAMP) to form complexes were found to be predictors of cognitive function (Ramos-Miguel et al., 2018). Analysis of these presynaptic proteins suggests that the level of their functional interactions is associated with greater brain reserve, better cognition, and less decline over time (Honer et al., 2012; Ramos-Miguel et al., 2017). Thus, we next asked whether the number of neurogenic cell populations correlates with the level of functional interaction of these synaptic proteins in the brains of these individuals. We found that numbers of DCX+PCNA+ cells and a summary measure of the amount of SNARE protein-protein interactions (SNAP-25-syntaxin) measured from 6 regions (hippocampus, midfrontal cortex, inferior temporal, calcarine cortex, posterior putamen, ventromedial caudate) were positively correlated (Figure 4e), supporting the preliminary observation of positive correlation between numbers of DCX+PCNA+ cells and cognition. SNAP-25 expression could be detected in the hippocampal neurogenic niche in these brain sections (Figure 4f). Taken together, these results suggest that there is an association between level of newly maturing neurons and the level of functional interactions of SNARE proteins. Similar to previously reported observations, relationships between neurogenesis, synaptic proteins and cognition can be cell- or region-specific.
Another factor that may affect the extent of neurogenesis, particularly in MCI and AD are the pathological hallmarks of AD, i.e., amyloid deposition and neurofibrillary tangles or their precursors. Thus, we next asked whether there is an association between tau and amyloid pathology and levels of neurogenesis in these brains. To address that, we performed Spearman’s rank correlation analysis between neurogenesis and levels of amyloid deposition, neurofibrillary tangles, as previously described (Boyle et al., 2013), and found no association (Supplemental Figures 3–5).
Discussion
This study offers several important insights. First, contrary to previous data (Sorrells et al., 2018), our results demonstrate the detectable existence of hippocampal neurogenesis in many aged human brains which is in line with other reports (Boldrini et al., 2018; Knoth et al., 2010; Moreno-Jimenez et al., 2019; Spalding et al., 2013). Not only do we show that these cells persist in aging, but we show that even in patients with cognitive dysfunction, such as MCI and AD, these cells are still present. Importantly, we show that the extent of neurogenesis greatly varies between individuals, for reasons that are yet to be determined. Unraveling this difference may provide critical insight into the role of neurogenesis in human cognition and hippocampal function. This high variation stresses the absolute necessity of the examination of large cohorts in studies examining adult neurogenesis in the human brains.
Second, we show regional changes in expression of the cells with Nestin+ cells localizing more in the ventral portions of the hippocampus while Nestin+Sox2+, PCNA+ and/or DCX+ cells are more evenly distributed along the dorsal/ventral axis of the hippocampus. This is interesting as there have been numerous studies documenting the functional differences between the dorsal and ventral hippocampus (Bannerman et al., 2003; Fanselow and Dong, 2010; Moser et al., 1993) with unique input and output connections to and from the dorsal and ventral hippocampus (Swanson and Cowan, 1977). The dorsal hippocampus is implicated in learning and memory functions (Moser et al., 1995) while the ventral hippocampus is thought to be associated with emotional behavior and stress responses (Henke, 1990). The relatively even distribution of neurogenic subpopulations in the dorsal and ventral hippocampus suggest that other factors contribute to the different roles attributed to these areas.
Third, we provide preliminary evidence that level of neurogenesis, particularly the number of newly-forming neurons, is associated with better cognitive diagnosis and with greater levels and functional interactions of critical synaptic proteins. Interestingly, we see reduced numbers of neuroblasts in early stages of cognitive decline, i.e., MCI, suggesting that deficits in neurogenesis may promote cognitive deficits in AD or exacerbate them. The trending inverse correlation between Nestin+Sox+Ki67+ and global cognition may suggest that the ratio between neurogenic populations may be altered following cognitive decline. While our sample size of a given age group is significantly larger than some of the previous studies (e.g. Sorrells et al.), a larger cohort will be necessary in order to determine alterations in neurogenesis during dementia. In that regard, levels of hippocampal neurogenesis were recently analyzed in a large cohort of AD patients (Moreno-Jimenez et al., 2019). Our observations are in agreement with the results of this study, demonstrating the presence of immature neurons in the aging and AD brain. In addition, our study is in agreement with the observation that neurogenesis drops with cognitive dysfunction. It should be noted, however, that the cohort analyzed by Moreno-Jimenez et al. included control subjects that are Braak stage I only, while their AD cohort included pathological levels of Braak stage II-VI. In contrast, our study categorized patients based on their cognitive status and clinical diagnosis, rather than Braak stage. Thus, for example, we have a total of 7 patients that are Braak stage IV. Among them, 2 are clinically diagnosed as normal with no cognitive impairment, 3 as MCI, and 2 as AD. Thus, our analysis associates level of new neurons with cognitive status, rather than stage of pathology. In support of this link is our observation that the level of neuroblasts (DCX+PCNA+) is associated with the functional interaction of presynaptic SNARE proteins. In fact, our study suggests a significant drop in the number of neuroblasts (DCX+PCNA+) as early as MCI, suggesting that reduced neurogenesis takes place early in the development of dementia. In contrast to Moreno-Jimenez et al. (2019), we did not observe a correlation between level of neurogenesis and amyloid deposition or neurofibrillary tangles. Nevertheless, the large variation in the number of neurogenic proxies between patients warrants further comprehensive analysis, thoroughly examining neurogenesis in the brains of aging, MCI and AD in order to determine the association between neurogenesis, cognitive function, synaptic reserve, and brain pathology in AD.
Notably, the range of DCX+ cells observed in our study is comparable to the observed in Boldrini et al. (3–30 × 103 /DG), but significantly lower than the range observed in Moreno-Jimenez et al. (5–45 × 103/mm3). However, the age range of the controls and AD patients analyzed in the latter was 52–97 years while ours was 79–99 years (Boldrini et al., 2018; Moreno-Jimenez et al., 2019). Based on the preliminary observations in this study it would be reasonable to assume that differences in PMI, fixation time and tissue processing are contributing factors to these differences.
Younger individuals were not analyzed in our study. Thus, we did not determine how cell numbers change across the lifespan. The relevance of neurogenesis to normal hippocampal function is still unknown. Future studies should aim at exploring the functional significance of new neurons in the human brain. Likewise, new technologies that would enable us to determine whether DCX+ cells in the aging brain fully mature to become functional neurons in the hippocampus are warranted. It is evidently clear that more studies examining human neurogenesis in the adult, aging and AD brain are necessary to help answer these fundamental questions. This study underscores the importance of the thorough examination of adult neurogenesis in the human brain, its functional significance and potential implications for AD.
STAR Methods
CONTACT FOR REAGENTS AND RESOURCE SHARING
Further information and requests for resources and reagents should be directed to and will be fulfilled by the Lead Contact, Orly Lazarov (olazarov@uic.edu).
EXPERIMENTAL MODEL AND SUBJECT DETAILS
Human tissue collection
Postmortem hippocampal tissue sections were obtained from eighteen participants from the Rush Memory and Aging Project, a prospective cohort studies of aging and dementia.(Bennett et al., 2018) All participants enroll without known dementia, agree to annual clinical evaluation, and donation of brain, spinal cord, nerve and muscle at death. A complete neuropathologic evaluation is performed for Alzheimer’s disease (AD) and other common pathologies blinded to all clinical data (Schneider et al., 2007). The study was approved by the Institutional Review Board at Rush University Medical Center. All participants signed an informed consent and an Anatomic Gift Act for organ donation. Demographic data from these 18 persons is summarized in Supplementary Table 1. Neonatal sections were obtained from the UIC Tissue Biorepository to serve as positive controls for immunofluorescence staining.
Generation and selection of brain sections
One hemisphere is placed into a plexiglass jig which holds the tissue firmly in place. 1 cm coronal slabs are cut with the blade guided by 1 cm slits in the jig. This provides clean 1 cm slabs of brain across the entire hemisphere. The slabs containing hippocampus were visually determined based on morphology (see Supplemental Figure 6). A 0.5 cm thick block of hippocampus was dissected from each slab. Block numbers were sequentially assigned from anterior to posterior according to the slabs from which the block was taken. The number of blocks of hippocampus and the location of individual blocks vary across subjects because of heterogeneous shape and size of hippocampus across subjects. Mean number of blocks for the entire hippocampus for the subjects in this analysis is 3.94 (SD: 0.42, range: 3 to 5). The mean length of hippocampus is thus estimated from 3.5 cm to 5.3 cm. We compared blocks of the entire hippocampus from a normal and an AD subject.
METHOD DETAILS
Immunofluorescence staining
Paraffin-embedded tissue sections were first dewaxed in xylene and then dehydrated through a graded ethanol series before being incubated in a 1× TBST solution (1× TBS, pH 7.4, 0.1% Tween 20) for 5 minutes. Antigen retrieval was then performed using 1× Reveal Decloaker Buffer in a Decloaking Chamber (both from Biocare Medical, Pacheco, California) in set to 110°C for 20 minutes. Sections were then incubated in 3% hydrogen peroxide for 10 minutes at room temperature to block endogenous peroxidase activity and washed 3 times with 1× TBS. Sections were then incubated in blocking buffer (1× TBS, 0.3M glycine, 0.1% Tween 20, 10% normal donkey serum) for 1 hour at room temperature before being incubated in overnight at 4°C in primary antibody dilutions made in blocking buffer (Supplementary Table 2). The next day, sections were washed 3 times in 1× TBS and then incubated in biotinylated anti-rabbit IgG for 1 hour at room temperature. Sections were then washed 3 times in TBS incubated and incubated in fluorophore-conjugated secondary antibodies for 2 hours at room temperature. Sections were then washed and incubated with TBS+DAPI for 5 minutes at room temperature. Next, sections were washed and incubated in a Sudan Black B solution (0.1% Sudan Black B in 70% methanol) for 8 minutes at room temperature to quench tissue autofluorescence. Sections were then washed and mounted using PVA-DABCO and allowed to air dry overnight at room temperature. Mounted slides were stored in the dark at 4°C until analyzed. To serve as a positive control for staining a single section from a post-mortem neonatal section was utilized.
QUANTIFICATION AND STATISTICAL ANALYSIS
Stereological quantification
Cell counts were performed using design-based stereology (StereoInvestigator, MBF Biosciences) by investigators blinded to subject demographics. For the analysis, two to four sections per subject were quantified using the optical fractionator workflow of StereoInvestigator. Because there was an unknown distance between sections within each subject, each section within a subject was treated as its own subject. Regions of interest were traced using the 5× objective while counting was performed using the 63× objective. In order to ensure the entire dentate gyrus was quantified, workflow parameters were set as follows: tissue thickness: 12 μm, counting frame size: 225 × 145 μm, sampling grid size: 100 × 100 μm, top and bottom guard zones: 1 μm, section interval: 1. Total cells were quantified using the following formula:
where N is the total number of cells, Q is the number of particles counted, t is the section thickness, h is the optical dissector height (accounting for the top and bottom guard zones), asf is the area sampling fraction, and ssf is the section sampling fraction.
Hippocampal volume measurements
Using established anatomic landmarks (Pruessner et al., 2000) a single operator who was blinded to all cognitive and pathologic data and diagnoses outlined the hippocampal formation on postmortem T2-weighted MRI, thereby generating a 3D hippocampal region, as previously described (Supplemental Figure 2) (Dawe et al., 2011). The sagittal plane was used as the primary selection view because this was the native plane of the acquired slices, therefore providing superior in-plane resolution. The coronal and axial views were referenced as necessary to confirm landmark position. The hippocampal region included all subdivisions of the cornu ammonis (CA), the dentate gyrus, and the subiculum. The volume of the hippocampal region was calculated by multiplying the number of voxels by the volume of each voxel (Supplemental Figure 2).
Granular cell layer and subgranular layer volume measurements
To determine the volumes of the GCL and SGL, the area of each layer and of the whole hippocampus was measured from H&E sections of each tissue block analyzed in these studies and the proportion of the GCL and SGL were determined relative to the total hippocampal area (Supplemental Figure 6d). These GCL and SGL proportions were then averaged across blocks from each subject and multiplied by the total hippocampal volume as determined above to determine the total GCL and SGL volume from each patient.
Automated image acquisition and analysis
For the quantification of double and triple stained cells, automated image acquisition and analysis was applied. For image acquisition, immunolabeled tissue was scanned automatically using a TissueFAXS PLUS microscope (TissueGnostics). First, a whole slide scan was acquired using the DAPI channel with a 2.5× objective and the region of interest (ROI), the DG, was manually identified by a contour. These ROIs were then imaged sequentially using a 20× objective with autofocus settings being applied at each ROI to assure optimum quality. For image analysis and marker counting, TissueQuest software (TissueGnostics) was used. Nucleus size and DAPI intensity were the main parameters for defining cells followed by manual counting for markers within the imaged planes. Total counts were then normalized to the volume of the DG and counts per mm3 are presented.
Quantification of presynaptic proteins and protein-protein interaction
For complementary analyses, we examined putative structural elements of brain reserve, presynaptic proteins. Protein-protein interactions between SNAP-25 and syntaxin were assayed using an immunoprecipitation strategy implemented with a high throughput, heterologous capture ELISA (Barakauskas et al., 2010). Purified antibody directed against SNAP-25 was immobilized on an ELISA plate, serially diluted brain homogenate samples were incubated on the plate, and then a second antibody was added to detect the protein binding partner (syntaxin) of the initially captured target (SNAP-25).
Immunohistochemistry for SNAP-25
Paraffin embedded hippocampal sections were cut in the coronal plane at 6 m. Sections were stained for SNAP-25, and a general marker for nuclei, 4’6-diamidino-2-phenylindole (DAPI). Sections were deparaffinized and underwent antigen retrieval, blocked with 5% non-fat milk, then incubated overnight at 4°C with mouse anti-SNAP-25 (clone SP12, 1:500, produced in house). SNAP-25 was detected with an Alexa Fluor™ 647 coupled secondary antibody.
Statistical analysis
For data upweighted to hippocampal volumes (GCL, SGL, or total), the average of volume-normalized cell counts across tissue blocks were multiplied by the volume per subject to determine the total number of cells in the whole dentate gyrus or within each sublayer. Two to four sections were analyzed per subject with each section considered as a statistically distinct replicate. As such, these were analyzed as repeated measures for subsequent statistical analyses. Random effects meta-analysis was performed for single stained Nestin+, PCNA+ and DCX+, to estimate 95% confidence intervals (C.I.). In addition, random effect meta-analysis with binomial distribution for the number of positive blocks per subject for each of the double/triple stained PCNA+DCX+, PCNA+Nestin+, Nestin+Sox2+, Nestin+Sox2+Ki67+ was performed to estimate 95% C.I. of the proportion of positive subjects per case (Hamza et al., 2008). Statistical analyses were performed using the R package – metafor (Viechtbauer, 2010) and SAS/STAT software (Version 9.4; SAS Institute, Cary, NC). Figures were done using GraphPad Prism (Version 7.03; GraphPad Software Inc., La Jolla, CA, USA). Data are presented as mean ± SEM unless otherwise stated. A probability value of less than 0.05 was considered statistically significant.
Association analysis
Each of the double- and triple-labeled cells (DCX+PCNA+, Nestin+Sox2+Ki6+) was associated with each of last validated clinical diagnosis of cognitive status, and global cognitive score showing cognitive ability from multiple domains – episodic memory, semantic memory, working memory, perceptual orientation, perceptual speed. Clinical diagnosis of cognitive status is a categorical variable with three levels: no cognitive impairment (NCI), mild cognitive impairment (MCI), and Alzheimer’s disease (AD). Multinomial logistic regression was applied to compare odds of MCI and AD, respectively, over NCI. We also collapsed MCI and AD into a (cognitively impaired) group, and compared the odds of cognitive impairment over NCI. In addition, abundance of individual synaptic protein was associated with double- and triple-labeled cells in GLM analysis.
DATA AVAILABILITY
All raw data have been uploaded in Mendeley at http://dx.doi.org/10.17632/58z9mb8xpf.1.. Data from the Rush Memory and Aging Project (MAP) can be requested at www.radc.rush.edu.
Supplementary Material
KEY RESOURCES TABLE
| REAGENT or RESOURCE | SOURCE | IDENTIFIER |
|---|---|---|
| Antibodies | ||
| Rabbit polyclonal anti-Nestin | EMD Millipore | Cat#ABD69; RRID: AB 2744681 |
| Mouse monoclonal anti-PCNA (Clone PC10) | Santa Cruz | Cat#sc-56; RRID: AB 628110 |
| Goat polyclonal anti-Doublecortin (Clone C-18) | Santa Cruz | Cat#sc-8066; RRID: AB 2088494 |
| Rabbit polyclonal anti-Doublecortin | Abcam | Cat#ab18723; RRID: AB 732011 |
| Goat polyclonal anti-Sox2 (Clone Y-17) | Santa Cruz | Cat#sc17320; RRID: AB 2286684 |
| Mouse monoclonal anti-Ki67 (Clone MM1) | Leica Biosystems | Cat#NCL-L-Ki67-MM1; RRID: AB 563841 |
| Mouse monoclonal anti-SNAP-25 (Clone SP12) | Barakauskas et al., 2010 | N/A |
| Biological Samples | ||
| Human adult hippocampal tissue sections | Rush Alzheimer’s Disease Center | https://www.radc.rush.edu/ |
| Human neonatal hippocampal tissue sections | UI Health Biorepository | http://rrc.uic.edu/cores/rsd/biorepository/ |
| Deposited Data | ||
| Clincal data from the Rush Memory and Aging Project | Rush Alzheimer’s Disease Center | www.radc.rush.edu |
| Raw data | This paper | Available in Mendeley at http://dx.doi.org/10.17632/58z9mb8xpf.1 |
Highlights Tobin et al.
Neurogenic subpopulations are evenly distributed along the dorsal-ventral hippocampal axis.
Neurogenic subpopulations evenly distribute along the dorsal-ventral hippocampal axis.
Numbers of neuroblasts are reduced in MCI.
Higher numbers of DCX+PCNA+ cells correlate with higher cognitive scores.
Increased DCX+PCNA+ cells correlate with levels of interaction of presynaptic SNAREs.
Acknowledgements:
This work was supported by NIA AG033570, AG033570-S1,S2, AG060238, AG062251, AG061628 (O.L.), the Canadian institutes of Health Research (MT-14037, MOP-81112) and the Jack Bell Chair in Schizophreina (W.G.H.), AG17917, AG34374, UH2NS100599 (D.A.B.; Rush University Memory and Aging Project). The authors would like to thank the UIC Tissue Biorepository for supplying neonatal brain tissue sections as control tissue for these studies. Part of the imaging work was performed at the Northwestern University Center for Advanced Microscopy generously supported by NCI CCSG P30 CA060553 awarded to the Robert H Lurie Comprehensive Cancer Center.
Footnotes
Publisher's Disclaimer: This is a PDF file of an unedited manuscript that has been accepted for publication. As a service to our customers we are providing this early version of the manuscript. The manuscript will undergo copyediting, typesetting, and review of the resulting proof before it is published in its final citable form. Please note that during the production process errors may be discovered which could affect the content, and all legal disclaimers that apply to the journal pertain.
Declaration of Interests: The authors declare no competing financial interests.
LITERATURE CITED
- Aizawa K, Ageyama N, Terao K, and Hisatsune T (2011). Primate-specific alterations in neural stem/progenitor cells in the aged hippocampus. Neurobiol Aging 32, 140–150. [DOI] [PubMed] [Google Scholar]
- Bannerman DM, Grubb M, Deacon RM, Yee BK, Feldon J, and Rawlins JN (2003). Ventral hippocampal lesions affect anxiety but not spatial learning. Behav Brain Res 139, 197–213. [DOI] [PubMed] [Google Scholar]
- Barakauskas VE, Beasley CL, Barr AM, Ypsilanti AR, Li HY, Thornton AE, Wong H, Rosokilja G, Mann JJ, Mancevski B, et al. (2010). A novel mechanism and treatment target for presynaptic abnormalities in specific striatal regions in schizophrenia. Neuropsychopharmacology 35, 1226–1238. [DOI] [PMC free article] [PubMed] [Google Scholar]
- Bennett DA, Buchman AS, Boyle PA, Barnes LL, Wilson RS, and Schneider JA (2018). Religious Orders Study and Rush Memory and Aging Project. J Alzheimers Dis. [DOI] [PMC free article] [PubMed] [Google Scholar]
- Bergmann O, Spalding KL, and Frisen J (2015). Adult Neurogenesis in Humans. Cold Spring Harb Perspect Biol 7, a018994. [DOI] [PMC free article] [PubMed] [Google Scholar]
- Boldrini M, Fulmore CA, Tartt AN, Simeon LR, Pavlova I, Poposka V, Rosoklija GB, Stankov A, Arango V, Dwork AJ, et al. (2018). Human Hippocampal Neurogenesis Persists throughout Aging. Cell Stem Cell 22, 589–599 e585. [DOI] [PMC free article] [PubMed] [Google Scholar]
- Boldrini M, Underwood MD, Hen R, Rosoklija GB, Dwork AJ, John Mann J, and Arango V (2009). Antidepressants increase neural progenitor cells in the human hippocampus. Neuropsychopharmacology 34, 2376–2389. [DOI] [PMC free article] [PubMed] [Google Scholar]
- Bologna-Molina R, Mosqueda-Taylor A, Molina-Frechero N, Mori-Estevez AD, and Sanchez-Acuna G (2013). Comparison of the value of PCNA and Ki-67 as markers of cell proliferation in ameloblastic tumors. Med Oral Patol Oral Cir Bucal 18, e174–179. [DOI] [PMC free article] [PubMed] [Google Scholar]
- Boyle PA, Yu L, Wilson RS, Schneider JA, and Bennett DA (2013). Relation of neuropathology with cognitive decline among older persons without dementia. Front Aging Neurosci 5, 50. [DOI] [PMC free article] [PubMed] [Google Scholar]
- Dawe RJ, Bennett DA, Schneider JA, and Arfanakis K (2011). Neuropathologic correlates of hippocampal atrophy in the elderly: a clinical, pathologic, postmortem MRI study. PLoS One 6, e26286. [DOI] [PMC free article] [PubMed] [Google Scholar]
- Demars MP, Hollands C, Zhao Kda T, and Lazarov O (2013). Soluble amyloid precursor protein-alpha rescues age-linked decline in neural progenitor cell proliferation. Neurobiol Aging 34, 2431–2440. [DOI] [PMC free article] [PubMed] [Google Scholar]
- Eriksson PS, Perfilieva E, Bjork-Eriksson T, Alborn AM, Nordborg C, Peterson DA, and Gage FH (1998). Neurogenesis in the adult human hippocampus. Nat Med 4, 1313–1317. [DOI] [PubMed] [Google Scholar]
- Ernst A, Alkass K, Bernard S, Salehpour M, Perl S, Tisdale J, Possnert G, Druid H, and Frisen J (2014). Neurogenesis in the striatum of the adult human brain. Cell 156, 1072–1083. [DOI] [PubMed] [Google Scholar]
- Fanselow MS, and Dong HW (2010). Are the dorsal and ventral hippocampus functionally distinct structures? Neuron 65, 7–19. [DOI] [PMC free article] [PubMed] [Google Scholar]
- Hamza TH, van Houwelingen HC, and Stijnen T (2008). The binomial distribution of meta-analysis was preferred to model within-study variability. J Clin Epidemiol 61, 41–51. [DOI] [PubMed] [Google Scholar]
- Henke PG (1990). Hippocampal pathway to the amygdala and stress ulcer development. Brain Res Bull 25, 691–695. [DOI] [PubMed] [Google Scholar]
- Honer WG, Barr AM, Sawada K, Thornton AE, Morris MC, Leurgans SE, Schneider JA, and Bennett DA (2012). Cognitive reserve, presynaptic proteins and dementia in the elderly. Transl Psychiatry 2, e114. [DOI] [PMC free article] [PubMed] [Google Scholar]
- Kempermann G, Gage FH, Aigner L, Song H, Curtis MA, Thuret S, Kuhn HG, Jessberger S, Frankland PW, Cameron HA, et al. (2018). Human Adult Neurogenesis: Evidence and Remaining Questions. Cell Stem Cell 23, 25–30. [DOI] [PMC free article] [PubMed] [Google Scholar]
- Knoth R, Singec I, Ditter M, Pantazis G, Capetian P, Meyer RP, Horvat V, Volk B, and Kempermann G (2010). Murine features of neurogenesis in the human hippocampus across the lifespan from 0 to 100 years. PLoS One 5, e8809. [DOI] [PMC free article] [PubMed] [Google Scholar]
- Leuner B, Kozorovitskiy Y, Gross CG, and Gould E (2007). Diminished adult neurogenesis in the marmoset brain precedes old age. Proc Natl Acad Sci U S A 104, 17169–17173. [DOI] [PMC free article] [PubMed] [Google Scholar]
- Lewis DA (2002). The human brain revisited: opportunities and challenges in postmortem studies of psychiatric disorders. Neuropsychopharmacology 26, 143–154. [DOI] [PubMed] [Google Scholar]
- Li J, Gould TD, Yuan P, Manji HK, and Chen G (2003). Post-mortem interval effects on the phosphorylation of signaling proteins. Neuropsychopharmacology 28, 1017–1025. [DOI] [PubMed] [Google Scholar]
- Moreno-Jimenez EP, Flor-Garcia M, Terreros-Roncal J, Rabano A, Cafini F, Pallas-Bazarra N, Avila J, and Llorens-Martin M (2019). Adult hippocampal neurogenesis is abundant in neurologically healthy subjects and drops sharply in patients with Alzheimer’s disease. Nat Med 25, 554–560. [DOI] [PubMed] [Google Scholar]
- Moser E, Moser MB, and Andersen P (1993). Spatial learning impairment parallels the magnitude of dorsal hippocampal lesions, but is hardly present following ventral lesions. J Neurosci 13, 3916–3925. [DOI] [PMC free article] [PubMed] [Google Scholar]
- Moser MB, Moser EI, Forrest E, Andersen P, and Morris RG (1995). Spatial learning with a minislab in the dorsal hippocampus. Proc Natl Acad Sci U S A 92, 9697–9701. [DOI] [PMC free article] [PubMed] [Google Scholar]
- Pruessner JC, Li LM, Serles W, Pruessner M, Collins DL, Kabani N, Lupien S, and Evans AC (2000). Volumetry of hippocampus and amygdala with high-resolution MRI and three-dimensional analysis software: minimizing the discrepancies between laboratories. Cereb Cortex 10, 433–442. [DOI] [PubMed] [Google Scholar]
- Ramos-Miguel A, Jones AA, Sawada K, Barr AM, Bayer TA, Falkai P, Leurgans SE, Schneider JA, Bennett DA, and Honer WG (2018). Frontotemporal dysregulation of the SNARE protein interactome is associated with faster cognitive decline in old age. Neurobiol Dis 114, 31–44. [DOI] [PMC free article] [PubMed] [Google Scholar]
- Ramos-Miguel A, Sawada K, Jones AA, Thornton AE, Barr AM, Leurgans SE, Schneider JA, Bennett DA, and Honer WG (2017). Presynaptic proteins complexin-I and complexin-II differentially influence cognitive function in early and late stages of Alzheimer’s disease. Acta Neuropathol 133, 395–407. [DOI] [PMC free article] [PubMed] [Google Scholar]
- Schneider JA, Arvanitakis Z, Bang W, and Bennett DA (2007). Mixed brain pathologies account for most dementia cases in community-dwelling older persons. Neurology 69, 2197–2204. [DOI] [PubMed] [Google Scholar]
- Sorrells SF, Paredes MF, Cebrian-Silla A, Sandoval K, Qi D, Kelley KW, James D, Mayer S, Chang J, Auguste KI, et al. (2018). Human hippocampal neurogenesis drops sharply in children to undetectable levels in adults. Nature 555, 377–381. [DOI] [PMC free article] [PubMed] [Google Scholar]
- Spalding KL, Bergmann O, Alkass K, Bernard S, Salehpour M, Huttner HB, Bostrom E, Westerlund I, Vial C, Buchholz BA, et al. (2013). Dynamics of hippocampal neurogenesis in adult humans. Cell 153, 1219–1227. [DOI] [PMC free article] [PubMed] [Google Scholar]
- Swanson LW, and Cowan WM (1977). An autoradiographic study of the organization of the efferent connections of the hippocampal formation in the rat. J Comp Neurol 172, 49–84. [DOI] [PubMed] [Google Scholar]
- Tartt AN, Fulmore CA, Liu Y, Rosoklija GB, Dwork AJ, Arango V, Hen R, Mann JJ, and Boldrini M (2018). Considerations for Assessing the Extent of Hippocampal Neurogenesis in the Adult and Aging Human Brain. Cell Stem Cell 23, 782–783. [DOI] [PMC free article] [PubMed] [Google Scholar]
- Viechtbauer W (2010). Conducting Meta-Analyses in R with the metafor Package. Journal of Statiscal Software 36, 48. [Google Scholar]
Associated Data
This section collects any data citations, data availability statements, or supplementary materials included in this article.
Supplementary Materials
Data Availability Statement
All raw data have been uploaded in Mendeley at http://dx.doi.org/10.17632/58z9mb8xpf.1.. Data from the Rush Memory and Aging Project (MAP) can be requested at www.radc.rush.edu.