Abstract
Tendinopathies are common chronic injuries that occur when damage accumulation caused by subrupture fatigue loading outpaces repair. Studies have linked fatigue loading with various mechanical, structural, and biological changes associated with pathology. However, the multiscale progression of damage accumulation with respect to area, severity and the distinct contributions of strain level and number of cycles has not been fully elucidated. The objective of this study was to investigate multiscale mechanisms underlying fatigue damage accumulation and their effect on the cellular environment. Using an in situ model in rat tail tendon (RTT), fatigue loading was applied at various strains and cycle numbers to induce fatigue damage. Pre- and post- fatigue diagnostic mechanical testing, second harmonic generation (SHG) imaging, and transmission electron microscope (TEM) imaging were used to investigate extracellular and cellular damage modes at multiple scales. Fatigue loading at strains at or below 1.0% resulted in no significant changes in SHG damage area or severity and no changes in collagen fibril or cell morphology compared with controls. Fatigue loading at strains above 1.5% resulted in greater mechanical changes correlated with increased damage area measured by SHG and collagenous damage observed by TEM. Increased cycles at high strain further altered mechanical properties, increased structural damage severity (but not area), and altered TEM collagen rupture patterns. Cell morphology was similarly progressively affected with increased strain and cycle number. These damage mechanisms that may trigger degenerative changes characteristic of tendinopathy could be targeted as a part of prevention or therapy.
Keywords: Tendinopathy, Fatigue damage, Microstructure, Second harmonic generation, Electron microscopy
1. Introduction
Tendinopathy is a prevalent degenerative pathology accounting for over 30% of musculoskeletal consultations (Andarawis-Puri et al., 2015). Chronic injuries typically occur from sub-rupture loading that leads to accumulation of structural damage at a rate that overwhelms the reparative processes (Kleiner, 1998; Renstrom and Johnson, 1985). Sub-rupture fatigue loading disrupts the normal fiber alignment in the tendon, with varying degrees of fiber kinking dependent on injury extent and chronicity (Andarawis-Puri et al., 2012a; Fung et al., 2009). However, the mechanisms of damage progression with regards to matrix structure, damage area, and severity as well as the distinct contributions of strain versus number of cycles has yet to be fully described. More specifically, the multiscale nature (intra- or inter- fibril, fiber, or fascicle) of fatigue loading induced damage has not been fully elucidated. Understanding these relationships will link bulk mechanical loading with progressive changes in the cell micromechanical environment that drive the altered biological signaling and response associated with tendinopathy.
Consequently, the objective of this study is to investigate mechanisms that underlie fatigue damage accumulation at the micro- and nano-scales as a first step towards understanding the associated changes to the cellular environment. We utilized an in situ fatigue damage model in the rat tail tendon (RTT). Fatigue loading was applied to the tendons at various strains and mechanical testing, quantitative analysis of second harmonic generation (SHG) images using an edge detection technique for damage segmentation and stratification by severity (Ros et al., 2013), and transmission electron microscope (TEM) imaging of fatigue damaged tendons were utilized to provide insight into damage mechanisms with regards to collagen fibril deformation and damage patterns with increasing cycle number. We hypothesized that at low strains within physiological levels, fatigue damage accumulation initiates in non-collagenous components such as in the decorin-rich interfibrillar space. At higher strains, we hypothesized that fatigue damage progresses with increased number of cycles within isolated areas of collagen fiber disorganization, propagating in area and severity with increased number of cycles and leading to altered mechanical properties, cell mechanical environment, and collagen fibril damage.
2. Methods
2.1. Tendon harvest and fatigue loading setup
RTT fascicles from 18 (n = 11 mechanical testing, 5 SHG, 2 TEM) female, 9-month-old, control Sprague Dawley (S-D) rats (approximately 28–32 per tail) from other studies were harvested at sacrifice and immediately placed in phosphate-buffered saline (PBS). A 9-month-old rat is comparable to a human age of middle 20 s (Sengupta, 2013), which is an age that is appropriate for investigation of early onset of tendinopathy. Fascicles were gripped between custom sandpaper grips for a 50 mm gauge length and mounted in a materials testing system (Instron 8872, MA) equipped with a 2.5-lb load cell (Transducer Techniques, CA) and 37 °C PBS bath. Fascicles were preloaded to 0.1 N and then pre-conditioned cyclically to a mid-toe region load (0.3 N) at 0.5 Hz for 10 cycles. After preconditioning, fascicles were pre-loaded to 0.1 N, gauge length measured, and displacement zeroed on the testing instrumentation. A fatigue loading protocol was applied which consisted of a first diagnostic test serving as a naive baseline (cyclical loading to 0.5% strain for 10 cycles at 0.5 Hz) followed by fatigue loading at 0.5 Hz-sinusoidal waveform at 0.5%, 1.0%, 1.5% or 2.5% strain, corresponding with regions of a typical RTT fascicle load-elongation curve (Table 1). The number of fatigue cycles was based on preliminary studies measuring post-fatigue monotonic load to failure properties (Fig. S2–S4, Supplemental). Post fatigue, a second diagnostic test, identical to the first, was performed and compared with the first diagnostic to determine parameters reflecting induced damage (Andarawis-Puri et al., 2012a): elongation, maximum load, loading slope, unloading slope, and hysteresis. An identical third diagnostic test after a l0min recovery period showed no significant recovery for any parameter or fatigue group when compared with the second diagnostic (Supplemental). Fascicles were unloaded and removed from the testing apparatus. RTT hydration was maintained by PBS immersion.
Table 1.
Fatigue loading groups examined for mechanical properties, SHG, and TEM. All groups underwent mechanical testing except control and the 1.0%, 300 cycle group which was TEM imaged only (++). Groups with SHG imaging and analysis (*) and TEM imaging (+) are denoted.
| Load Level | Cycle Number | Sample Size |
|---|---|---|
| Control | 0*+ | N = 49, N* = 6, N+ = 4 |
| Toe Region | 500 | N = 12 |
| 0.5% Strain | ||
| Linear Region | 300++, 500* | N = 12, N* = 10, N++ = 3 |
| 1.0% Strain | ||
| Plastic Region | 50, 200, 300, 500 | N = 12/group |
| 1.5% Strain | ||
| Post-Plastic | 50*+, 100,200,300*+, | N = 12/group, N* = 10/group,N |
| Region | 400, 500* | +=2–4/group |
| 2.5% Strain |
2.2. SHG/Cell nuclei imaging
Fascicles were loaded onto a custom-made tendon fixation μg under a 0.1 N load in 10% neutral buffered formalin for at least 48 h. Fascicles were unloaded from the fixation μg, maintaining rigidity after removal from the μg. Fascicles were rinsed in PBS and permeabilized in 0.5% Triton-X in PBS. Cell nuclei were visualized using ethidium homodimer at 2.5 μM concentration for 5 min. Fascicles were then rinsed, mounted on culture dishes, and immersed in PBS. Mounted fascicles were imaged using a multiphoton laser scanning microscope (Olympus FluoView FV1000MPE, Japan) equipped with a Coherent (Santa Clara, CA) Chameleon Vision II pulsed IR laser. Structural damage to the collagen matrix was visualized at three locations in the fascicle (both grip-ends and in the middle) by SHG imaging at 60x magnification (LUMPFL W/IR, NA 0.90) using a 760 nm laser excitation wavelength. Cell nuclei were imaged concurrently with the SHG signal using two photon excitation fluorescence (TPEF) at the same excitation wavelength. Image stacks were collected from the fascicle surface to 60 μm tissue depth at a 1 μm step size. Segmentation and identification of damage regions as low, moderate, or highly damaged was accomplished using previously published criteria (Ros et al., 2013) (Table S1, Supplemental). Total fascicle damage area and regional severity were averaged for each group for each location in the fascicle (both grip-ends and in the middle). Outliers determined by mean ± 2SD were removed in each group. Nuclear morphology and alignment relative to matrix were also qualitatively inspected throughout the entire stack at this time.
2.3. TEM imaging
Fascicles were fatigue loaded and processed differently for TEM imaging to retain and investigate native cell-cell and cell-matrix interactions. RTTs were harvested and maintained in culture media consisting of DMEM, 4mM glutamine, and 10% FBS and maintained in an incubator at 37 °C and 5% C02 until time of fatigue loading. Fascicles were fatigue loaded as described above with groups summarized in Table 1 and placed onto the custom fixation μg under tension in 2.5% glutaraldehyde/2% paraformaldehyde in 0.1 M sodium cacodylate buffer for at least 48 h. Post-fixation, fascicles were cut and stained with cupromeronic blue in sodium acetate buffer for proteoglycan visualization, rinsed, and stained with sodium tungstate (Fessel and Snedeker, 2009; Scott and Haigh, 1986). Samples were contrasted with uranyl acetate to reveal fibrils and dehydrated with graduated concentrations of ethanol and propylene oxide. Specimens were infiltrated and embedded in Epon using the EMS EMBed-812 Embedding Kit procedure. Finally, 80 nm ultra-thin sections were cut and mounted on grids. TEM imaging was performed by a trained electron microscopy technician on blinded sections from specimen blocks (Hitachi H-7650 transmission electron microscope) at magnifications ranging from 700x to 70000x. TEM images (10–20 per fascicle) were qualitatively evaluated by a blinded user for matrix injury in both longitudinal and transverse sections based on damage severity, type, and amount of fibril deformations. Further, images were inspected for decorin linkages between fibrils, inter-fibrillar spacing, and cell-matrix interactions.
2.4. Statistical analysis
Statistical differences between groups were determined by oneway ANOVA with post-hoc Bonferroni for all parameters (p < 0.05).
3. Results
3.1. Mechanical damage parameters at varying strains
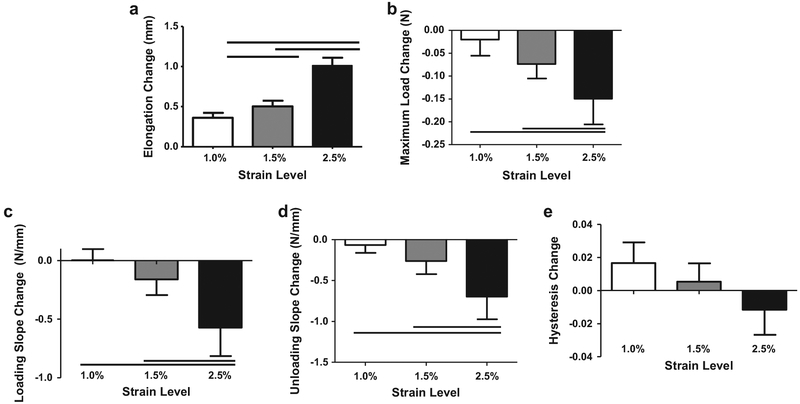
For 500 cycle groups, diagnostic tests revealed a significant increase in elongation from 1.0% strain to 1.5% strain, and further significant increases from 1.5% to 2.5% strain (Fig. la). The maximum load, loading slope, and unloading slope during the diagnostic were significantly decreased in the 2.5% strain group compared to 1.0% and 1.5% groups (Fig. lb–d). Change in hysteresis did not differ between groups (Fig. le).
Fig. 1.
Diagnostic changes (pre-versus post-loading) for 500 cycle groups in elongation (a) were greater with increased strain. Decreases in minimum load (b), loading (c) and unloading slope (d) were greater in 2.5% groups when compared with 1.0% and 1.5%. Change in hysteresis (e) did not vary with strain. Bar denotes p < 0.05.
3.2. Mechanical damage parameters at varying cycle numbers
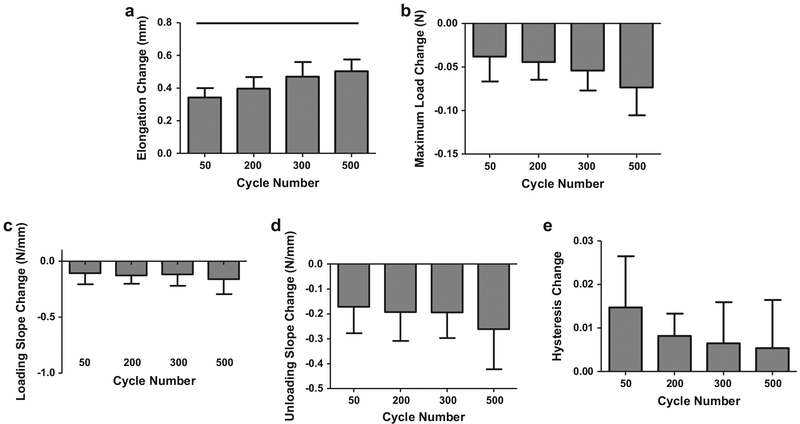
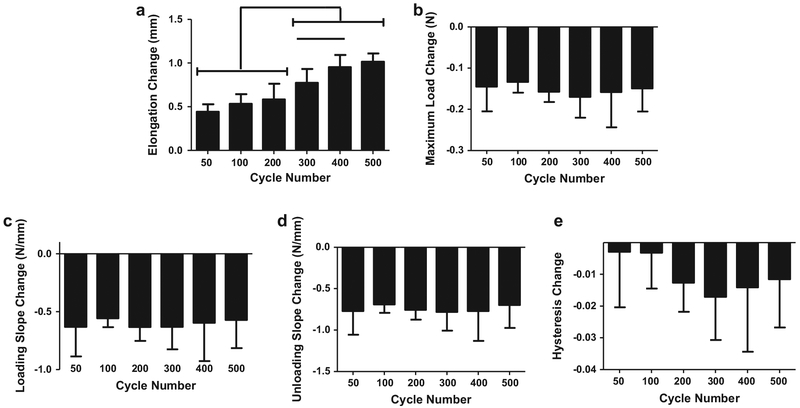
For the 1.5% strain group, diagnostic tests showed a significant increase in elongation from 50 cycles to 500 cycles only (Fig. 2a). There were no significant differences between cycle groups for any other parameter (Fig. 2b–e). For the 2.5% strain groups, diagnostic tests showed that elongation did not differ between the 50, 100, and 200 cycles groups but each of these groups differed from the 300, 400, and 500 cycle groups (Fig. 3a). Further, 300 cycles was significantly different than 400 cycles. There were no significant differences between cycle groups for any other parameter (Fig. 3b–e).
Fig. 2.
Diagnostic changes (pre-versus post- fatigue loading) for 1.5% strain groups in elongation (a) were significantly greater in 500 than 50 cycle groups. Changes in minimum load (b), loading slope (c), unloading slope (d), and hysteresis (e) did not vary with cycle number. Bar denotes p < 0.05.
Fig. 3.
Diagnostic changes (pre- versus post- fatigue loading) for 2.5% strain groups in elongation (a) were significantly greater in 300, 400, and 500 cycle than 50, 100, and 200 cycle groups. Changes in minimum load (b), loading slope (c), unloading slope (d), and hysteresis (e) did not vary with cycle number. Bar denotes p < 0.05.
3.3. Assessment ofSHG images
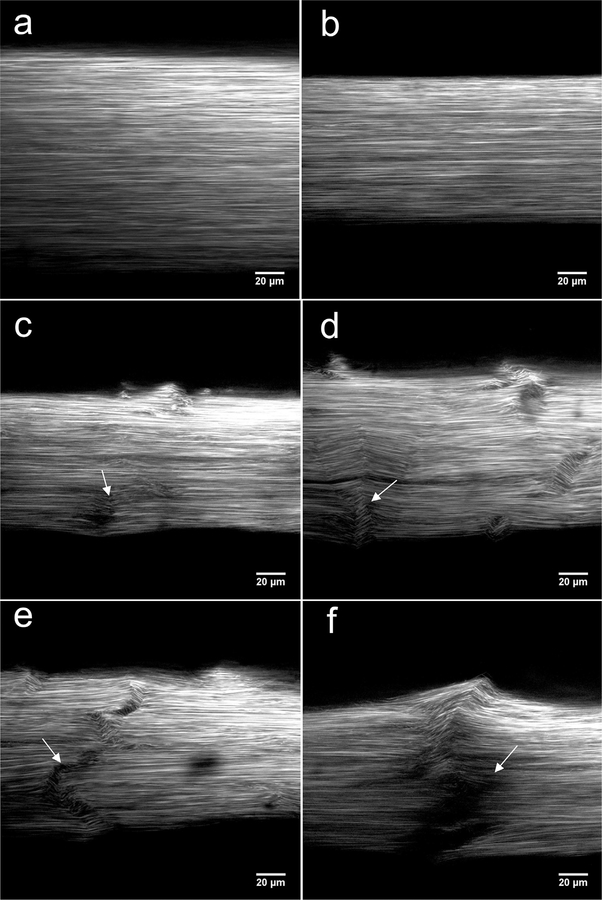
Control (Fig. 4a) and 1.0%, 500 cycles (Fig. 4b) fatigue groups showed highly aligned collagen with no evidence of kinking, fibrillar deformation, or damage. The 2.5%, 50 cycles fatigue group showed small areas (regions of ~20 μm by 20 μm) of fibril deformation and kinking with no signs of microscopic discontinuities (Fig. 4c). The 2.5%, 300 cycles fatigue group exhibited more severe and larger areas (regions of >~20 μm by 20 μm) of fibril deformation and kinking (Fig. 4d). These damage regions were greater along the width of the fascicle than the center. Further, damage patterns seemed to propagate through the depth and along the width of the fascicle when assessing whole image stacks, with the most severe damage patterns seen at the image surface. Qualitative assessment of the 2.5%, 500 cycles fatigue group showed similar damage patterns (Fig. 4e and f). Along with the observation of micro-discontinuities, width-spanning (~300 μm) discontinuities and fibril deformations were also found.
Fig. 4.
Representative SHG images of control (a) and 1.0%, 500 cycle (b) showed highly aligned collagen. Areas of fibril deformation and kinking were smaller in 2.5%, 50 cycle (c, arrow), and larger in 2.5%, 300 cycle (d, arrow) groups. Width-spanning discontinuity was observed in 2.5%, 500 cycle fatigue groups (e and f, arrows). Images shown were taken from random image stacks at random depth and image width is not indicative of actual tendon width.
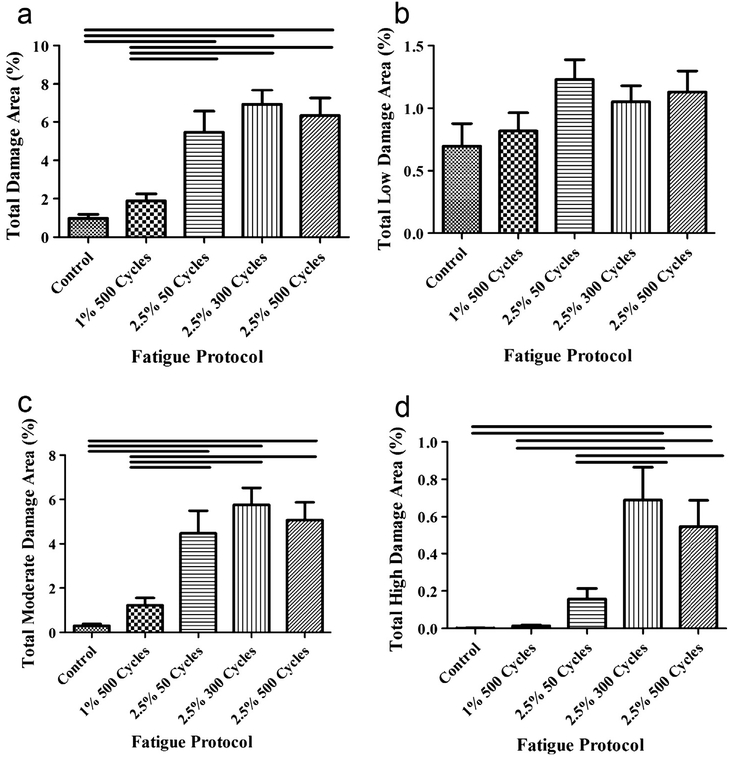
Damage area comparisons between locations within a fascicle showed no differences in area or severity between both grip-ends and the middle, providing a rationale for pooling the three locations for further damage area/severity comparison between fatigue groups. Comparison of fatigue groups for total damage area irrespective of severity showed no differences between control and 1.0%, 500 cycles of fatigue (Fig. 5a). Control and 1.0%, 500 cycles of fatigue were significantly different than each 2.5% strain group. No differences were found between any 2.5% groups. No significant differences between any fatigue group were found for total low damage area (Fig. 5b) and can likely be attributed to image noise. Significant differences between groups for moderate damage areas were identical to those found for total tendon damage area (Fig. 5c). Comparisons between fatigue groups for high damage regions showed no significant differences between control tendons, 1.0% 500 cycles of fatigue, or 2.5% 50 cycles of fatigue (Fig. 5d). Those groups, however, were significantly different from 2.5% 300 and 2.5% 500 cycles of fatigue. No differences between 2.5% 300 and 2.5% 500 fatigue groups were found
Fig. 5.
Total (a) and moderate (c) damage area percent were greater in 2.5% strain for all cycle numbers when compared with the 1.0%, 500 cycle group and control. High damage area percent was greater in 2.5%, 300 and 500 cycle groups when compared with the lower cycle number (2.5%, 50 cycle) and lower strain (1.0%, 500 cycle and control) groups. Bar denotes p < 0.05.
3.4. Assessment of nuclear morphology imaged by TPEF
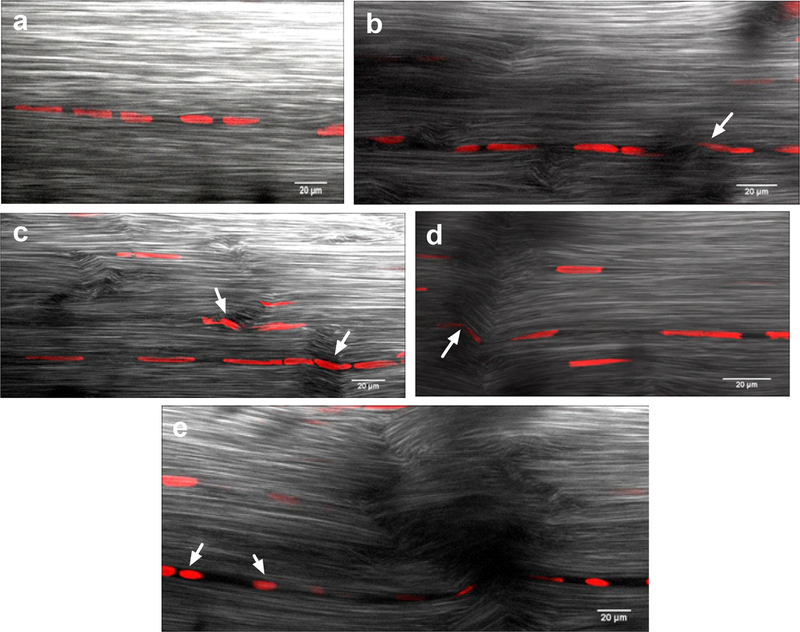
Cell nuclei were qualitatively assessed between groups for changes in morphology that occur due to fatigue. Images from control tendon stacks had cell nuclei arranged in highly aligned, parallel rows in the direction of normal collagen orientation. Nuclear morphology was the expected elongated ellipse with no evidence of cell deformation. Images from 1.0%, 500 cycle groups showed similar alignment and morphology to controls (Fig. 6a). 2.5% 50 cycle fatigue tendons had cell nuclei arranged in highly aligned, parallel rows (Fig. 6b). Nuclear morphology began to show evidence of minor nuclear deformation within regions of fibril kinking. Cell nuclei in 2.5%, 300 and 2.5%, 500 cycle fatigue tendons were still aligned in rows, but the rows showed severe alignment changes in damage regions (Fig. 6c–e). Nuclear elongation and major nuclear deformation was observed within damage regions. Also, in areas of major disruption, cell nuclei had a more rounded morphology and that morphology propagated along a chain of cells (Fig. 6e). Damage regions overlaid on representative nuclear morphology TPEF images showed nuclear rounding and deformation occurred primarily within or near damage regions (Fig. S5b–d). However, not all nuclei within damage regions showed clear rounding or deformation (Fig. S5a).
Fig. 6.
Representative nuclear morphology TPEF images was similar to control for the 1.0%, 500 cycle group (a). Nuclear deformation was minor in the 2.5%, 50 cycle group (b, arrow) and more severe in the 2.5%, 300 cycle groups (c and d, arrows). Nuclear rounding was observed in the 2.5%, 500 cycle group (e, arrows).
3.5. Assessment of damage imaged by TEM
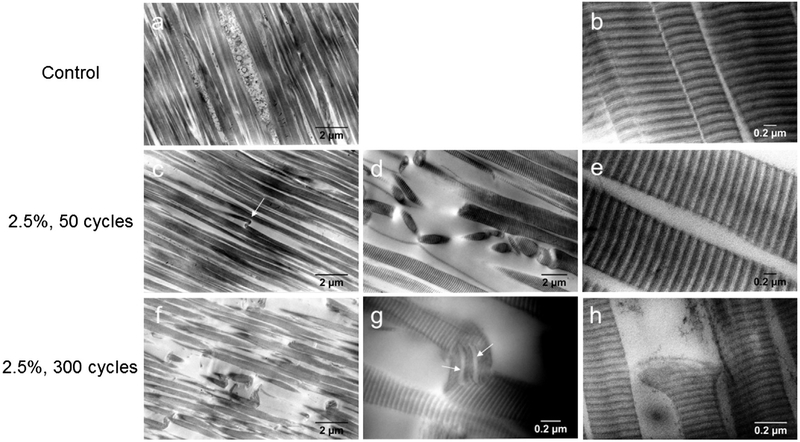
Qualitatively, distinct and pronounced differences in matrix morphology were found between groups. Control and 1.0%, 300 cycle fatigue groups showed highly aligned collagen with no evidence of fibril disruption, damage, rupture, or discontinuity (Fig. 7a). At 70000x magnification, collagen fibrils showed no evidence of disruption with D-spacing intact (Fig. 7b). Inspection of transverse images showed uniform, highly packed collagen fibrils and no evidence of cell-matrix disruption. No differences between control and 1.0% groups were observed. The 2.5%, 50 cycles group showed fibrillar kinking and deformation involving single fibrils. In general, fibrils remained aligned, but individual fibrils had a marked bend that was not found in control specimens and was not periodic or crimp-like (Fig. 7c). Singular kinks showed a sub-fibrillar component that was twisted in the bend (Fig. 7d). A small number of areas exhibited a multi-fibrillar damage region with several kinks and fibrillar recoil or rupture (Fig. 7e). High magnification of collagen proteoglycans showed no evidence of bridging (Fig. 7f) and no disruption of D-spacing. Inspection of transverse images showed evidence of disrupted fibril packing with increased spacing between fibrils. There was no evidence of cell-matrix disruption. The 2.5%, 300 cycle group showed a greater number of fibrillar kinks and deformation than the 2.5%, 50 cycle group. A larger number of fibrils showed the marked bend shown previously as well as fibrillar ruptures (Fig. 7g). More regions showed severe fibrillar deformations with visualization of sub-fibrillar components in bends (Fig. 7h). Fibril recoil and rupture were observed (Fig. 7i). High magnification of collagen proteoglycans showed no evidence of bridging and no disruption of D-spacing. Inspection of transverse sections showed evidence of disrupted fibril packing with increased spacing between fibrils. At lower magnification (700x), several regularly spaced bends/kinks were observed the 2.5%, 50 cycle images (Fig. S6b, arrows) while kinks in addition to ruptures were present in 2.5%, 300 cycle images (Fig. S6c, arrows). This was opposed to control images where no sharp bends or kinks were visible (Fig. S6a).
Fig. 7.
TEM images of collagen fibrils at various magnification in control groups showed highly aligned collagen (a) and tight fibril spacing (b). The 2.5%, 50 cycle group showed singular kinks (c, arrow), sub-fibrillar twisting and some multi-fibrillar damage regions (d) with greater spacing between fibrils (e). 2.5%, 300 cycle fatigue group showed several fibril bends and ruptures (f) and sub-fibrillar separation (g, arrows) and rupture (h). No differences between control and 1.0%, 300 cycles were observed.
3.6. Assessment of cell morphology imaged by TEM
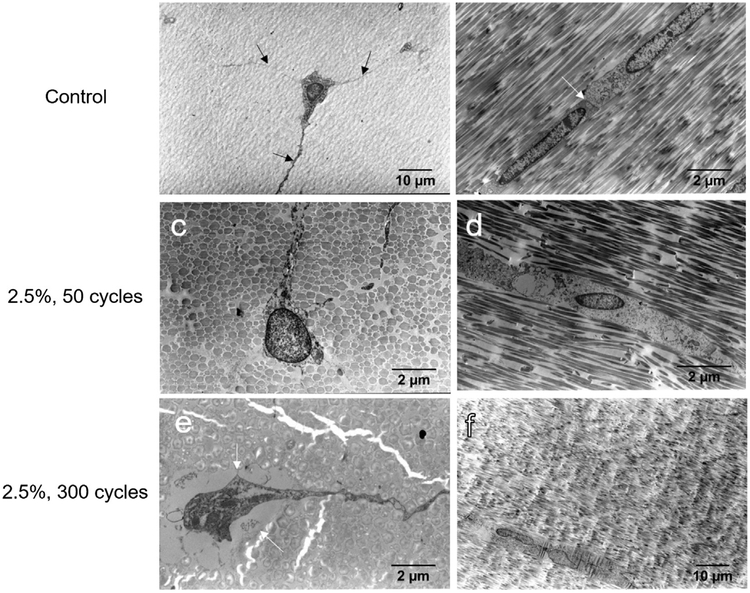
Control group cells had characteristic cell extensions with possible immature collagen fibrils present (Fig. 8a). Longitudinal cross-sections showed direct contact between tenocyte cell bodies (Fig. 8b). TEM imaging of 2.5%, 50 cycle tendons showed excellent preservation of morphology (Fig. 8c and d). However, in regions of fibrillar kinking cytoplasmic processes seemed disrupted. Furthermore, some cells had cellular membrane disruptions. TEM imaging of 2.5%, 300 cycle tendons showed further evidence of cellular and cell-matrix disruptions. Some cells showed increased spacing from the surrounding matrix and cellular organelle deterioration (Fig. 8e). Some cells showed evidence of necrotic processes, but further studies are required to confirm cellular death.
Fig. 8.
TEM images of tenocytes in control groups showed characteristic cell extensions (a, arrows) and contact between tenocytes (b, arrow). 2.5%, 50 cycle groups showed disrupted cytoplasmic processes (c) but preserved morphology (d). 2.5%, 300 cycle fatigue groups showed cell separation from the surrounding matrix (e, arrows) and evidence of necrotic processes (f). Sections were (a,c,e) transverse and (b,d,f) longitudinal.
4. Discussion
We have shown that mechanisms and structure of fatigue damage accumulation in tendon at multiple scales are dependent on loading strain and cycle number. Damage progression can be linked to changes in bulk mechanical properties and cell environment shown here and previously observed in fatigue loaded tendons, providing insight into the physical progression from overuse to tendinopathy. Quantification of SHG imaging and TEM imaging echoed the reduction in mechanical properties that resulted from fatigue loading. Based on our hypothesis, lower strain groups were expected to only show cycle dependent, non-collagenous damage. Results indicate that toe-region (0.5%) and elastic-region (1.0%) strain loading are nondamaging since these groups did not differ from control for any mechanical parameter investigated. In addition, SHG imaging data shows that loading to 1.0% strain for 500 cycles resulted in no discernible changes to the matrix, evidenced by highly aligned collagen fibrils with no kink deformations. The results suggest that loading within the linear elastic region of the monotonic load to failure curve for up to 500 cycles results in no collagen matrix injury, suggesting a probable physiological loading range in the RTT.
Conversely, high strain tendons were expected to show cycle dependent damage area and severity and ultra-structural collagen damage in SHG and TEM images when compared with unloaded control and lower strain groups, corresponding with changes in mechanical properties. 2.5% fatigue loading to 500 cycles resulted in significant differences from 1.0% and 1.5% for several mechanical properties tested. In addition, cycle number-dependent elongation is evident (with 50,100, and 200 cycles having significantly different elongation changes than 300,400, and 500 cycles). Correspondingly, SHG imaging showed loading to 2.5% strain resulted in progressive accumulation in high damage area between 50 and 300 cycles with no evidence of further damage between 300 and 500 cycles. This data provides evidence that loading to 2.5% results in progressive accumulation of kink patterns that progress from mild deformations to moderate kinking, which then progress to severe kink patterns and disruptions with additional cycles.
Each cyclic diagnostic test and monotonic load to failure test outcome in this study was indicative of different damage processes. Previous studies have shown different damage parameters serve as indicators of different aspects of damage. For example, while changes in hysteresis and unloading stiffness correlate with stiffness 7 days after loading in fatigue loaded tendons (Andarawis-Puri et al., 2012a), changes in elongation and unloading stiffness correlate with molecular response 7 days after loading (Andarawis-Puri et al., 2012b). Because changes in elongation depend on the changes in the protective natural fiber crimp, our findings suggest microscale crimp changes were cycle dependent. Interestingly, changes in loading and unloading stiffness did not appear to be cycle dependent despite changes in TEM images and increased high severity damage assessed by SHG after 2.5%, 50 cycles, demonstrating how lack of bulk mechanical change does not necessarily preclude damage at the micro- and nano-scales. As stiffness is indicative of fiber engagement and recoil, it is possible that there was a redistribution of load from damaged to undamaged fibers. Monotonic load to failure tests showed decreases in failure load, strain at failure, and area under load-displacement curve after 2.5%, 50 cycles (Fig. S4), suggesting that cycle dependent damage accumulation manifested in failure properties in addition to diagnostic properties measured at lower strains.
TEM data showed that 1.0% strain loading results in no collagen disruption or cellular injury, confirming mechanical findings suggesting that 1.0% strain is within the physiological loading range of the RTT. Additionally, TEM visualized the accumulation of matrix injury that occurs during fatigue at higher strains. Evidence of kink deformation and increased spacing between fibrils early during fatigue suggest that sub-sets of fibrils are unloaded and others are over-loaded. With further loading, additional fibrillar kinking/bending occurs, increasing the area of injured matrix as seen by increased area of in-plane and out-of-plane fibrils in longitudinal section and decreased packing density in transverse section. Individual fibrils showed signs of damage, marked by visualization of sub-fibrillar components as well as fibril rupture. Data also suggests that increased spacing and decreased packing density of fibrils occurs early (within 50 cycles) during high strain fatigue but not during low strain fatigue as hypothesized. Disruption of decorin bridges may be responsible for these changes, though cupromeronic blue staining was inconclusive.
Together, TEM, SHG, and mechanical data provide insight into the mechanisms of damage progression and accumulation in fatigue loaded RTT at multiple scales. At low strains within the linear load region (1.0%), collagen, and cell structure are preserved up to 500 cycles, corresponding with preserved mechanical properties. At higher strains beyond the plastic region (2.5%), at as low as 50 cycles, single- or small areas of multi-fibrillar kinking and disruption of fibril packing correspond with increased SHG moderate severity damage area and loss of load bearing capacity, tendon elongation, and reduction in area under the load displacement curve. With increased cycles (up to 300), other fibrils near the damaged fibril are then recruited to bear the load, leading to further damage and rupture. Since fibrils are sliding past one another, specific fibrils are enduring high local strains leading to rupture and severe deformations. This is supported by the fact that from 50 to 300 cycles at 2.5% strain, total SHG damage area remains the same but high severity damage area increases, corresponding with a greater number of fibrillar kinks and cases of complete fibril rupture observed by TEM. Although these high severity damage areas were relatively small (<10% of total damage area in all groups), they may cause stress concentrations that increase in area with further loading or impact nearby cells outside damage regions. The progression of damage described here mirrors the predicted behavior of fiber-reinforced composites, where failure originates from the formation of stress concentrations at localized critical clusters of fiber breaks (Okabe et al., 2001).
Congruent with matrix damage, cell morphology was expected to be more disrupted with collagenous damage in high strain groups when compared with lower damage in control and low strain tendons, increasing in severity with cycle number. TEM data showed that cellular damage can occur with fatigue loading along with changes in cell-matrix interactions. This corresponds with SHG and TPEF evidence of cell nuclear deformation/bending with collagen fibril deformations that may have interesting implications to integrin mediated cell signaling responses to loading, cell homeostasis, and gap junction communication between cells and should be investigated fully. Although it is not clear from this data that cells are unloaded in damaged regions due to fibril relaxation (as hypothesized by Arnoczky et al., 2007), it is more likely that the local cell-matrix and cell-cell interactions are broken during fatigue leading to abnormal cell homeostasis/mechanotransduction. This reflects studies showing that fatigue loading alters cell behavior such as inflammation (Spiesz et al., 2015; Thorpe et al., 2015), apoptosis (Andarawis-Puri et al., 2014), and expression of matrix remodeling associated genes (Andarawis-Puri et al., 2012b).
There are several limitations to this study. Although load controlled fatigue may be more relevant in in vivo tendons, limited cycle number and strain control were used to decrease likelihood that fatigue would progress into the tertiary, rupture phase. SHG image analysis was limited to ~30 μm depth from the surface. However, the use of RTT fascicles as opposed to whole tendon enabled a more realistic assumption of homogeneity throughout the tendon. In addition, whole tendon models require significant processing to investigate matrix and cellular changes associated with fatigue. Increased sample complexity and thickness in these models diminish tissue/cell imaging quality and introduce variability between samples. Better image quality may result from plastic embedding and the use of oil immersion lenses, although plastic embedding requires dehydration processes that may alter collagen packing and the contrast of SHG images. Damage to other structural components besides the intra-fascicle collagenous matrix that are not detectable by SHG could have driven mechanical changes. Conversely, changes in SHG or TPEF nuclear morphology could occur without manifestation into changes in mechanics, such as with the denaturation of collagen (Szczesny et al., 2018) or death of cells before or during fatigue loading. The use of RTT enabled the observation of single fascicles, ensuring that damage only occurred within fascicles, either within or between fibers or fibrils.
This study provides evidence of novel strain- and cycle-dependent collagen damage accumulation mechanisms including micro- and ultra-structural descriptions of area and severity progression and corresponding changes in mechanics. Findings of nuclear deformations and changes in cell morphology with fatigue may have important implications to local cell behavior, providing rationale for changes in gene expression and cell imaging observed in other studies. Although this injury model consists of a single bout of fatigue damage, damage modes and mechanisms described here may be the critical trigger for the degenerative changes seen with tendinopathy, simulating the first insult the tendon experiences leading to reduced mechanical integrity and a matrix degradative response during future insults. These mechanisms should be further investigated and considered as targets for preventative and therapeutic strategies.
Supplementary Material
Acknowledgments
We acknowledge NIAMS/NIH AR068301 and AR052743.
Footnotes
Conflict of interest statement
All authors on this manuscript (Stephen J. Ros, MD PhD., Patrick M. Muljadi, Evan L. Flatow, MD, and Nelly Andarawis Puri, PhD) have no financial or personal relationships with other people or organizations that could inappropriately influence or bias this work.
Appendix A. Supplementary material
Supplementary data to this article can be found online at https://doi.org/l0.1016/j.jbiomech.2019.01.026
References
- Andarawis-Puri N, Flatow EL, Soslowsky LJ, 2015. Tendon basic science: development, repair, regeneration, and healing. J. Orthop. Res. 33, 780–784. 10.1002/jor.22869. [DOI] [PMC free article] [PubMed] [Google Scholar]
- Andarawis-Puri N, Philip A, Laudier D, Schaffler MB, Flatow EL, 2014. Temporal effect of in vivo tendon fatigue loading on the apoptotic response explained in the context of number of fatigue loading cycles and initial damage parameters. J. Orthop. Res. 32, 1097–1103. 10.1002/jor.22639. [DOI] [PMC free article] [PubMed] [Google Scholar]
- Andarawis-Puri N, Sereysky JB,Jepsen KJ, Flatow EL, 2012a. The relationships between cyclic fatigue loading, changes in initial mechanical properties, and the in vivo temporal mechanical response of the rat patellar tendon. J. Biomech. 45, 59–65. 10.1016/j.jbiomech.2011.10.008. [DOI] [PMC free article] [PubMed] [Google Scholar]
- Andarawis-Puri N, Sereysky JB, Jepsen KJ, Flatow EL, 2012b. Molecular response of the patellar tendon to fatigue loading explained in the context of the initial induced damage and number of fatigue loading cycles. J. Orthop. Res. 30, 1327–1334. 10.1002/jor.22059. [DOI] [PMC free article] [PubMed] [Google Scholar]
- Arnoczky SP, Lavagnino M, Egerbacher M, 2007. The mechanobiological aetiopathogenesis of tendinopathy: is it the over-stimulation or the understimulation of tendon cells? Int. J. Exp. Pathol. 88, 217–226. 10.1111/j.l365-2613.2007.00548.x. [DOI] [PMC free article] [PubMed] [Google Scholar]
- Fessel G, Snedeker JG, 2009. Evidence against proteoglycan mediated collagen fibril load transmission and dynamic viscoelasticity in tendon. Matrix Biol. 28, 503–510. https://doi.org/l0.1016/j.matbio.2009.08.002. [DOI] [PubMed] [Google Scholar]
- Fung DT, Wang VM, Andarawis-Puri N, Basta-Pljakic J, Li Y, Laudier DM, Sun HB, Jepsen KJ, Schaffler MB, Flatow EL, 2010. Early response to tendon fatigue damage accumulation in a novel in vivo model. J. Biomech. 43, 274–279. 10.1016/jjbiomech.2009.08.039. [DOI] [PMC free article] [PubMed] [Google Scholar]
- Fung DT, Wang VM, Laudier DM, Shine JH, Basta-Pljakic J, Jepsen KJ, Schaffler MB, Flatow EL, 2009. Subrupture tendon fatigue damage. J. Orthop. Res. 27, 264–273. 10.1002/jor.20722. [DOI] [PMC free article] [PubMed] [Google Scholar]
- Geng Y, McQuillan D, Roughley PJ, 2006. SLRP interaction can protect collagen fibrils from cleavage by collagenases. Matrix Biol. 25, 484–491. 10.1016/j.matbio.2006.08.259. [DOI] [PubMed] [Google Scholar]
- Kleiner DM, 1998. Human tendons: anatomy, physiology and pathology. J. Athletic Training 33, 185–186. [Google Scholar]
- Okabe T, Takeda N, Kamoshida Y, Shimizu M, Curtin WA, 2001. A 3D shear-lag model considering micro-damage and statistical strength prediction of unidirectional fiber-reinforced composites. Compos. Sci. Technol. 61, 1773–1787. https://doi.org/l0.1016/S0266-3538(01)00079-3. [Google Scholar]
- Patel S, Santra M, McQuillan DJ, Iozzo RV, Thomas AP, 1998. Decorin activates the epidermal growth factor receptor and elevates cytosolic Ca2+ in A431 carcinoma cells. J. Biolog. Chem 273, 3121–3124. [DOI] [PubMed] [Google Scholar]
- Renstrom P, Johnson RJ, 1985. Overuse Injuries in Sports. Sports Med. 2,316–333. 10.2165/00007256-198502050-00002. [DOI] [PubMed] [Google Scholar]
- Ros SJ, Andarawis-Puri N, Flatow EL, 2013. Tendon extracellular matrix damage detection and quantification using automated edge detection analysis. J. Biomech. 46, 2844–2847. 10.1016/jjbiomech.2013.09.002. [DOI] [PMC free article] [PubMed] [Google Scholar]
- Ruoslahti E, Yamaguchi Y, 1991. Proteoglycans as modulators of growth factor activities. Cell 64, 867–869. [DOI] [PubMed] [Google Scholar]
- Scott JE, Haigh M, 1986. Proteoglycan-collagen interactions in intervertebral disc, a chondroitin sulphate proteoglycan associates with collagen fibrils in rabbit annulus fibrosus at the d-e bands. Biosci. Rep. 6, 879–888. 10.1007/BF01116241. [DOI] [PubMed] [Google Scholar]
- Sengupta P, 2013. The laboratory rat: relating its age with human’s. Int J Prev Med 4, 624–630. [PMC free article] [PubMed] [Google Scholar]
- Spiesz E, Thorpe CT, Saira C, Riley GP, Birch HL, Clegg PD, Screen HRC, 2015. Tendon extracellular matrix damage, degradation and inflammation in response to in vitro overload exercise. J. Orthop. Res. 33, 889–897. 10.1002/jor.22879. [DOI] [PMC free article] [PubMed] [Google Scholar]
- Szczesny SE, Aeppli C, David A, Mauck RL, 2018. Fatigue loading of tendon results in collagen kinking and denaturation but does not change local tissue mechanics. J. Biomech. 71, 251–256. 10.1016/jjbiomech.2018.02.014. [DOI] [PMC free article] [PubMed] [Google Scholar]
- Thorpe CT, Chaudhury S, Lei II, Varone A, Riley GP, Birch HL, Clegg PD, Screen HRC, 2015. Tendon overload results in alterations in cell shape and increased markers of inflammation and matrix degradation. Scand. J. Med. Sci. Sports 25, e381–e391. https://doi.org/10.llll/sms.12333. [DOI] [PubMed] [Google Scholar]
Associated Data
This section collects any data citations, data availability statements, or supplementary materials included in this article.


