

SUMMARY
Little is known about the organizational and functional connectivity of the corticospinal (CS) circuits that are essential for voluntary movement. Here, we map the connectivity between CS neurons in the forelimb motor and sensory cortices and various spinal interneurons, demonstrating that distinct CS-interneuron circuits control specific aspects of skilled movements. CS fibers originating in the mouse motor cortex directly synapse onto premotor interneurons, including those expressing Chx10. Lesions of the motor cortex or silencing of spinal Chx10+ interneurons produces deficits in skilled reaching. In contrast, CS neurons in the sensory cortex do not synapse directly onto premotor inter-neurons, and they preferentially connect to Vglut3+ spinal interneurons. Lesions to the sensory cortex or inhibition of Vglut3+ interneurons cause deficits in food pellet release movements in goal-oriented tasks. These findings reveal that CS neurons in the motor and sensory cortices differentially control skilled movements through distinct CS-spinal inter-neuron circuits.
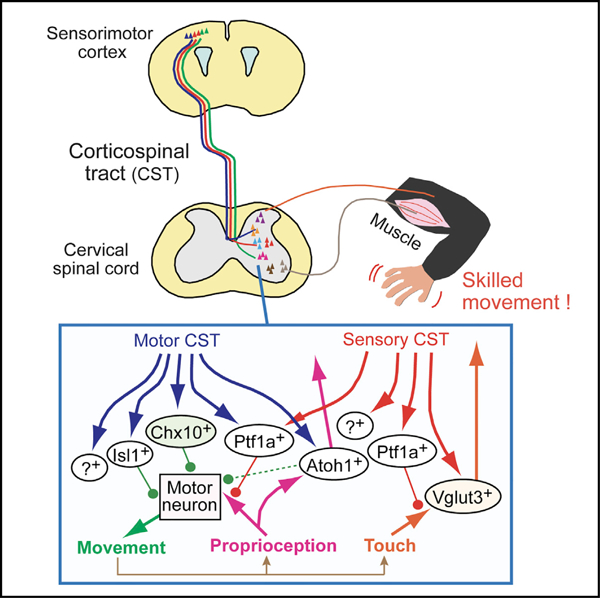
GRAPHICAL ABSTRACT
In Brief
Ueno et al. generate a detailed connectivity map between corticospinal (CS) neurons in the motor and sensory cortices and spinal interneurons. The CS circuits originating from the motor and sensory cortices connect to distinct subpopulations of spinal interneurons to control discrete aspects of skilled movements.
INTRODUCTION
Neural circuits originating in the cerebral cortex and traversing the spinal cord play critical roles in fine motor control (Levine et al., 2012). Corticospinal (CS) neurons (CSNs), which regulate voluntary motor control of the body and limbs, are located in layer V of the cerebral cortex. Their axons pass through the internal capsule and arrive at the caudal medulla where the majority decussate to the contralateral side of the spinal cord. Various axon projections from the cerebral cortex, including the primary motor (M1), primary somatosensory (S1), and premotor areas, traverse distinct regions of the spinal cord, suggesting that CSNs in different cortical areas may have distinct functions during multiphasic voluntary movements (Asante and Martin, 2013; Bareyre et al., 2002; Catsman-Berrevoets and Kuypers, 1976; Darian-Smith et al., 1996; Dum and Strick, 1991; Lemon, 2008; Lemon and Griffiths, 2005; Maier et al., 2002; Martin, 1996; Murray and Coulter, 1981). For instance, even a simple reaching task involves multiple steps, such as reaching, grasping, retrieving, and food release, which require the precise integration of sensory and motor information. However, how distinct CSNs participate in each behavioral segment remains largely unknown.
In primates, cats, and rats, CS axons from the sensory and motor cortices exhibit specific projection patterns to innervate the dorsal and ventral spinal cord, respectively (Bareyre et al., 2002; Coulter and Jones, 1977; Darian-Smith et al., 1996; Lemon, 2008; Lemon and Griffiths, 2005; Martin, 1996; Ralston and Ralston, 1985). Previous studies suggest that CS circuits directly regulate motor activity through CS motor pathways, but also indirectly affect motor control by modulating sensory information during voluntary movements (Moreno-López et al., 2016). For example, presynaptic inhibition of sensory afferents during voluntary behaviors appears to be induced by descending pathways (likely corticospinal tracts [CSTs]) in primates (Seki et al., 2003). Other studies indicate that CS axons send inputs to spinal interneurons (INs) innervated by sensory afferents (Bourane et al., 2015; Hantman and Jessell, 2010). Collectively, these studies suggest that motor and sensory information is integrated by CS circuits during voluntary movements, but how their activity is coordinated is unclear.
Monosynaptic connections between CSNs and motor neurons are observed both in higher-order primates and in early postnatal rodents. These connections are eliminated later during development in rodents but maintained in adult primates (Gu et al., 2017a; Lemon, 2008). In contrast, CS terminations onto spinal INs are well conserved among mammals, suggesting that basic motor programs directed by CS systems are encoded in cortico-interneuronal connections (Alstermark and Isa, 2012; Kinoshita et al., 2012). Indeed, disruptions of CS-IN circuits cause deficits in skilled movements in primates, cats, and rodents (Alstermark and Isa, 2012; Starkey et al., 2005; Whishaw et al., 1993). However, the precise composition of the synaptic networks linking CSNs to spinal INs that regulate fine motor control remains poorly understood. It is even unknown whether all, or only subsets, of CSNs connect to premotor neurons. Although multiple types of spinal INs are connected to CS axons in the spinal cord (Abraira et al., 2017; Bourane et al., 2015; Chakrabarty and Martin, 2010; Hantman and Jessell, 2010; Levine et al., 2014; Russ et al., 2013), it is difficult to compare the strength of various CS-IN connections across different studies given the diversity of experimental approaches used to characterize these pathways. Moreover, the functional importance of these connections for skilled behaviors has not been clarified. A systematic analysis to map the connectivity between distinct CS axon populations and various spinal IN classes will reveal important aspects of the functional organization of mammalian CS circuits.
Here we investigate the organizational and functional logic of CS circuitry using mouse genetics, viral tools, electrophysiology, and behavioral assays. Our results reveal that CS projections originating in the sensory and motor cortices engage distinct subpopulations of spinal INs to control skilled motor behaviors.
RESULTS
Identification of CSN Subpopulations
To begin mapping CSN-IN connectivity, we used two different neuronal tracers to determine the prevalence of CSNs that connect to premotor INs: retrobeads, a conventional retrograde tracer; and trans-synaptic, retrograde pseudorabies viruses (PRVs) expressing red fluorescent protein (RFP) or GFP (Figure 1A). Most of rodent CS axons reach the contralateral spinal gray matter. Accordingly, retrobeads injected into the cervical spinal cord of wild-type mice labeled layer V neurons mainly contralateral to the injection site (Figure 1A). In contrast, PRVs injected into muscles trans-synaptically moved to first-order motor neurons, second-order premotor INs, then third-order CSNs (Figure 1A; Gu et al., 2017b). Thus, retrobeads label most CSNs innervating the spinal cord, irrespective of their post-synaptic targets, whereas PRVs label only CSNs that connect with premotor INs. Combining these neuronal tracers enabled us to assess the degree to which CSNs connect to premotor INs.
Figure 1. Retrograde Tracing Reveals Distinct Subpopulations of CSNs.

(A) Schematic diagram of the retrograde tracing of CSNs using PRVs and retrobeads, which were injected into the forelimb muscle and cervical cord, respectively. (B–E) Images of retrobeads (B) and PRV-labeled (C) CSNs in layer V of the cerebral cortex. Green, retrobeads; red, PRV-RFP. Coronal section: right, medial (M); left, lateral (L). The medial population is PRV+/retrobeads+ while the lateral population is PRV−/retrobeads+ (D). The dotted box in (D) represent the PRV+/PRV− border areas magnified in (E). Scale bars, 200 μm (B) and 100 μm (E). (F) Ratios of PRV+/retrobeads−, PRV−/retrobeads+, and PRV+/retrobeads+ neurons along the mediolateral axis of layer V. Mean ± SEM, n = 7. (G) Plotting of retrobeads+ neurons in the cortex (green dots). Top view of the cortex: PRV+ and PRV− areas determined in (H)–(N) are outlined in red-orange and blue dotted lines, respectively. RFA (AP 1.25 ± 0.05 mm to 2.60 ± 0.10 mm, ML 0.54 ± 0.04 mm to 1.42 ± 0.13 mm; n = 2); CFA (AP −0.30 ± 0.00 mm to 1.10 ± 0.00 mm, ML 0.72 ± 0.07 mm to 2.57 ± 0.02 mm; n = 2). Top, anterior (A); bottom, posterior (P); right, medial (M); left, lateral (L). (H–N) Plotting of PRV+ cortical neurons, traced from the biceps (H, proximal forelimb flexor), clavotrapezius (I, neck), acromiotrapezius (J, shoulder), spino-deltoideus (K, shoulder), triceps (L, proximal forelimb extensor), palmaris longus (M, distal forelimb flexor), and extensor carpi radialis (N, distal forelimb extensor) muscles. Note that the lateral population is PRV—/retrobeads+ (blue dotted area), whereas the medial population is PRV+/retrobeads+ (reddish orange dotted area).
We first injected green fluorescent retrobeads into the gray matter at spinal cord level C5, which contains the motor neurons that innervate forelimb muscles (Tosolini et al., 2013). PRVs were then injected into the forelimb biceps muscle. Intriguingly, we found that, although retrobeads+ CSNs were distributed broadly in the mediolateral axis of layer V, PRVs labeled only a medial subset of those cells (Figures 1B–1E). PRV+/retrobeads+ CSNs were located in the medial area, while PRV–/retrobeads+ CSNs were located laterally (Figure 1F). Based on anatomical and physiological features of these cortical areas described in previous studies (Hira et al., 2013; Manita et al., 2015; Mathis et al., 2017; Paxinos and Franklin, 2001), the medial and lateral areas correspond to the forelimb motor and sensory cortices, respectively.
To further detail the distribution of CS subpopulations in the cortex, we produced horizontal cortical maps of neurons labeled with retrobeads and PRVs (Figures 1G–1N). Retrobeads+ CSNs were observed in the areas mostly rostral to bregma, with two separate areas in the rostrocaudal axis (Figure 1G), which correlated well with rodent rostral and caudal forelimb motor areas (RFA and CFA) reported previously (Tennant et al., 2011). We also found a laterally aligned retrobeads+ area positioned over 2 mm lateral from the midline and spread more caudally (to anteroposterior [AP]−1.80 mm from the bregma; blue dotted area in Figure 1G). In contrast, PRV+ CSNs were found in smaller areas compared to retrobeads+ areas. The PRV+ neurons traced from the biceps muscle were distributed in the medial region of the CFA (AP —0.80 ± 0.00 mm to 1.10 ± 0.00 mm, mediolateral [ML] 0.71 ± 0.01 mm to 1.98 ± 0.03 mm; n = 2), as well as in the RFA (AP 1.60 ± 0.10 mm to 2.65 ± 0.05 mm, ML 0.58 ± 0.02 mm to 1.05 ± 0.04 mm; n = 2) (Figure 1H). Notably, we observed few PRV+ cells in the area greater than 2 mm lateral from retrobeads+ neurons (blue dotted areas in Figures 1G and 1H). These patterns persisted when we injected PRVs into different forelimb/upper body muscles (clavotrapezius, acromiotrapezius, spinodeltoideus, triceps, palmaris longus, and extensor carpi radialis; Tosolini et al., 2013) (Figures 1I–1N). Cortical maps traced from these muscles showed PRV+ patterns similar to those for the biceps muscle (RFA, AP 1.95 ± 0.09 mm to 2.85 ± 0.06 mm, ML 0.55 ± 0.04 mm to 1.19 ± 0.10 mm; CFA, AP —0.73 ± 0.10 mm to 0.98 ± 0.07 mm, ML 0.70 ± 0.04 mm to 1.90 ± 0.04 mm; n = 6).
Taken together, these data reveal that mouse CSNs consist of distinct subtypes that differ in cortical position and connectivity: CSNs in the motor (medial) cortex, but not the sensory (lateral) cortex, connect with premotor INs.
CSNs in the Sensory and Motor Cortices Project to Distinct Spinal Cord Regions
To determine whether CSNs from the sensory and motor cortices differ in axonal projection patterns to the spinal cord, we injected biotinylated dextran amine (BDA), an anterograde tracer, into the medial (PRV+/retrobeads+) and lateral (PRV−/retrobeads+) cortical regions (Figures 2A and 2B). First, we examined the projection patterns of global CS populations (which include both sensory and motor CSTs) using fore-brain-specific Emx1-Cre; CAG-lox-stop-lox-tdTomato mice (Figure 2C). The tdTomato+ CS axons exhibited substantial innervations in the dorsoventral and mediolateral axes of the spinal gray matter at C4–7, especially in laminae III–VIII and X (Figure 2I). Less innervation was observed in laminae I~II and IX.
Figure 2. Sensory and Motor Subpopulations of CSNs Project Axons and Form Circuits in Segregated Dorsoventral Positions of the Spinal Cord.

(A) Schema of anterograde tracer (BDA) injection into the sensorimotor cortex. (B) BDA was injected into the medial (motor, red spots) or lateral (sensory, blue spots) area of the cortex, where retrobeads+/PRV− (blue dotted area) and retrobeads+/PRV+ CSNs (red dotted area) are located. (C–E) Projections of CS axons into the cervical cord gray matter labeled by Emx1-Cre; lsl-tdTomato mice (C). CS axons from medial (D, motor CST) or lateral cortical areas (E, sensory CST) traced with BDA project to the ventral and dorsal spinal cord regions, respectively. Rightmost panels show axon distribution heatmaps at levels C4–5 and C6–7, with red representing the highest numbers of axon pixels and blue representing the lowest. (F–H) Presynaptic terminals of CS axons in the cervical cord, labeled with synaptophysin (Syp)-tdTomato. The entire population of CS axon terminals are labeled through the use of Emx1-Cre; lsl-Syp-tdTomato mice (F). CS axons from medial (G, motor CST) or lateral cortical areas (H, sensory CST) were labeled by focal cortical injections of AAV1-Syn-EGFP-Cre into lsl-Syp-tdTomato mice. Right-hand panels show presynaptic terminal distribution heatmaps at levels C4–5 and C6–7. Scale bars, 200 μm. (I and J) Distribution of CS axons (I) and presynaptic terminals (J) in lamina I–X of the cervical cord. Whole CST, green; motor CST, red; sensory CST, blue. Data are represented as mean ± SEM (n = 4). See also Figure S1.
CS axons traced from the sensory and motor cortices using BDA showed distinct projection patterns. Axons from the motor cortex projected medioventrally in laminae IV–X, with particularly high densities in laminae V and VII (Figures 2D and 2I), while those from the sensory cortex projected to the dorsal laminae III–VI, with highest densities observed in laminae IV and V (Figures 2E and 2I).
We then examined the distribution of CS axon terminals in the spinal cord by labeling presynaptic terminals using CAG-lox-stop-lox-Synaptophysin-tdTomato (lsl-Syp-tdTomato) mice, which express a presynaptic synaptophysin protein fused with tdTomato in a Cre-dependent manner. Presynaptic terminals in global CSTs (from Emx1-Cre; lsl-Syp-tdTomato mice) were broadly distributed in the dorsoventral and mediolateral axes of the gray matter at C4–7, especially in laminae III–VIII and X (Figures 2F and 2J). Fewer terminals were found in laminae I~II and IX. We then labeled presynaptic terminals of CSNs in either the medial or lateral cortex by injecting adeno-associated viruses (AAVs) expressing Cre recombinase into these cortical regions of lsl-Syp-tdTomato mice. CSNs in the motor cortex had presynaptic sites in the medioventral laminae IV–X of the cervical cord, with a high number of puncta in laminae V and VII (Figures 2G and 2J). In contrast, sensory cortex neurons showed presynaptic sites in laminae I–VI, with high incidence in laminae III–V (Figures 2H and 2J). Thus, consistent with axon distribution, the presynaptic terminals of CSNs originating from the sensory and motor cortices in mice were concentrated within different regions of the cervical cord, suggesting that they may connect with distinct spinal IN populations. These segregated CS projection patterns are similar to those observed in monkeys, cats, and rats (Bareyre et al., 2002; Coulter and Jones, 1977; Martin, 1996). Hereafter, we refer to the CS subpopulations that derive from the motor and sensory cortices as motor and sensory CSTs, respectively (Bareyre et al., 2002).
To further define CSN subtypes, we injected BDA into restricted cortical areas (20 locations; Figures S1A–S1C). Similar to the segregated sensory and motor CST projections, the axons traced from medial locations of the cortex tended to project into the intermediate or ventral gray matter, whereas those from lateral positions projected dorsally. However, CSNs in each location exhibited more diverse projection patterns than simple sensory-motor CS segregations (Figure S1D). For instance, motor CSTs traced from the most medial neurons (ML 1.0 mm) contained ventral projections (D1–3 and 7 in Figure S1D), whereas neurons located at ML 1.5 mm projected axons to the intermediate zone (D4, 8, and 12). Sensory CSTs were subdivided into regional groups that projected axons along the mediolateral axis (D10, 13, 14, 17, 19, and 20). The rostral RFA population had ventromedial and bilateral projections along the midline (D1 and 2). The medial population caudal to bregma (corresponding to the hindlimb area), sent few axon collaterals into the cervical cord (D15, 16, and 18). These results support the existence of multiple classes of CSNs characterized by their axonal projections into the spinal cord (Figure S1E).
Identities of Spinal INs Connected to CSNs from the Sensory and Motor Cortices
Segregated projections of sensory and motor CSTs suggest that they may have different connectivity with spinal INs. Although spinal INs are classified into dozens of subtypes (e.g., dI1–6 and V0–3 INs) that are defined by specific developmental gene expression profiles (Alaynick et al., 2011) (Figures S2A and S2B), their systematic connectivity with descending CS fibers has never been mapped. We labeled a variety of spinal IN populations using mouse lines expressing Cre in different IN subtypes, crossed them with CAG-lox-CAT-lox-EGFP reporter mice (CC-EGFP) (Figure S2C), and examined the following different classes of IN populations: Atoh1+ (dI1), Olig3+ (dI13), Isl1+ (dI3), Ptf1a+ (dI4–dILA), Lmx1b+ (dILB–dI5), Dbx1+ (dI6V0), Chat+ (V0C), En1+ (V1), Chx10+ (V2a), Nkx2.2+ (V3), and Vglut3+ INs (dorsal INs). We found that each IN subtype was distributed in specific spatial patterns in the adult mouse spinal cord (Figures S2D–S2L).
We then examined which IN subtypes connected to CS axons by injecting AAVs expressing tdTomato into the cerebral cortex of Cre; CC-EGFP reporter mice (Figures S3A–S4C). Presynaptic CST terminals were detected using the excitatory presynaptic marker, Vglut1, and Vglut1+/tdTomato+ puncta were compared to GFP+ INs to determine anatomical contacts. The ratios of connected INs and numbers of presynaptic puncta revealed that each IN subtype had varying levels of anatomical connectivity with the global CSTs, which ranged from 65% (Dbx1+) to 98.9% (Atoh1 (D)+; Figure S3D). Average synapse numbers per IN ranged from 2.21 (Olig3+) to 6.35 (Vglut3+ (M)) (Figure S3E).
To identify anatomical connections between different INs and the motor and sensory CSTs, we injected BDA into the medial or lateral cortical region of each Cre; CC-EGFP line, and we counted Vglut1+/BDA+ presynaptic puncta on GFP+ INs (Figures 3A–3I). This localized CST labeling revealed some segregation of spinal connectivity. Motor CS axons connected mainly with INs in the ventral and intermediate spinal cord regions, whereas few, if any, connections were seen with dorsal INs (Figures 3A, 3C, 3E–3G, S4F, and S3H). Classes of INs showing predominant connectivity with motor CS systems were Atoh1 (V)+, Isl1+, Chat+, En1+, Chx10+, and Nkx2.2+ (Figure 3J), with the highest connectivity displayed by Chx10+ and Isl1+ INs (65.2% and 55.6%, respectively). Mid-level ratios were seen in Atoh1 (V)+ and Chat+ INs, while Nkx2.2+ and En1+ INs exhibited the lowest connectivity with the motor CST. Sensory CS axons, on the other hand, predominantly contacted dorsal INs, with virtually no connections observed with ventral IN populations (Figures 3B, 3D, 3H, 3I, S3G, and S3I). The most numerous sensory CST contacts were observed in Vglut3 (D) + and Lmx1b + INs (Figure 3J). In our experiments, the average numbers of CS presynaptic terminals seemed to correlate with connection ratios, and IN subtypes with the highest connectivity ratios also exhibited the highest average number of puncta (Figure S3J; e.g., Chx10+, 1.85 ± 0.22; Isl1+, 1.65 ± 0.08). Vglut3 (D) + and Lmx1b + INs had relatively higher numbers of presynaptic contacts with sensory CS fibers (Figure S3J; Vglut3 (D) +, 1.89 ± 0.16; Lmx1b+, 1.84 ± 0.04).
Figure 3. Connectivity of CS Axons and Spinal INs.

(A–D) Representative images of BDA-labeled motor (A and C) and sensory CS axons (B and D) (red) and GFP-labeled Chx10+ and Vglut3+ spinal INs in Chx10-Cre (A and B) and Vglut3-Cre; CC-EGFP (C and D) mice. Scale bar, 100 μm. (E–I) Higher-magnification views of connections between INs and CS axons. BDA+ motor (E–G) and sensory CSTs (H and I) (red), GFP+ spinal INs (blue), and Vglut1+ presynaptic terminals (green) in Chx10-Cre (E), Chat-Cre (F), Atoh1-Cre (G), Ptf1a-Cre (H), and Vglut3-Cre (I);CC-EGFP mice. The z stack confocal images have pseudo-colors. Scale bar, 20 mm. (J) The percentage of spinal INs connected with motor (light blue) and sensory CSTs (light orange) (n = 2–3 animals per IN subtype). (K and L) Connectivity maps of motor (K) and sensory CSTs (L) with spinal INs. Strength of anatomical connections (percentage of cells receiving CS input, from J) 3 mean number of Vglut1+/BDA+ synapses onto this population (Figure S4J) are represented by varying circle sizes, with green and red lines depicting excitatory and inhibitory connections, respectively, based on previous reports. See also Figures S2 and S3.
Interestingly, we found that some IN populations received inputs from both motor and sensory CSTs (Atoh1 (D)+, Olig3+, Ptf1a+, and Vglut3 (M)+ INs). Inputs were unbalanced, however, with Atoh1 (D)+ INs exhibiting more inputs from motor CS axons and Ptf1a+ and Vglut3 (M)+ INs showing biases toward sensory axons (Figure 3J). These IN populations with convergent inputs were mainly located in the intermediate dorsal zone of the gray matter (Figure S2), where motor and sensory CS axons coincide, particularly in lamina V (Figures 2I and 2J).
We summarized the connectivity of motor and sensory CSTs with IN subtypes using two measures (Figures 3K, 3L, and S2B): (1) the percentage of INs connected with CS axons (Figure 3J), and (2) the mean number of Vglut1+ and BDA+ synapses per IN (Figure S3J). These measures were multiplied (i.e., percentage of cells receiving CS input 3 mean number of Vglut1+/BDA+ synapses onto this population) to create a weighted connectivity map for motor (Figure 3K) and sensory (Figure 3L) CSTs. These density calculations highlighted the distinct connectivity of sensory and motor CS systems in the cervical cord, wherein the INs highly connected to motor CS axons were Chx10 +, Atoh1+, and Isl1+ subpopulations, while those showing extensive connectivity to the sensory CS system were Lmx1b+ and Vglut3+ INs.
Visualization of CS-IN Connectivity by trans-Synaptic Rabies Viruses
To further examine the connectivity between CS axons and three representative spinal IN populations (Chx10+, Ptf1a+, and Vglut3+), we performed monosynaptic retrograde tracing assays using an EnvA-coated G-deleted rabies virus expressing mCherry (EnvA-SADΔG-mcherry) that infects only the cells expressing an avian-specific retroviral TVA receptor and moves trans-synaptically in a retrograde manner only in the presence of G proteins (Osakada et al., 2011). We expressed TVA and G proteins in Chx10+ or Vglut3+ INs by injecting AAVs encoding both proteins (AAV1-Syn-FLEX-TVA-2A-EGFP-2A-RVG) into the cervical cords of Chx10- or Vglut3-Cre mice or into Ptf1a+ INs using Ptf1a-Cre; lox-stop-lox-histone GFP-2A-TVA-2A-RVG mice (Figure 4A). EnvA-SADΔG-mCherry viruses were then injected into the same areas of the cervical cord. Consistent with our anterograde tracing assay results (Figure 3), the majority of CSNs connected to Chx10+ INs were located in the medial region of the cortex, indicating that they are involved in motor CS circuitry (Figures 4B, 4E, and 4F). CSNs connected to Vglut3+ and Ptf1a+ INs were observed more frequently in the lateral (sensory) cortex, although some cells were also present in the medial and mediolateral borders (Figures 4C–4F).
Figure 4. Monosynaptic Tracing of CSNs Connected to Specific Spinal INs.

(A) Diagram of monosynaptic retrograde tracing assay using EnvA-coated G-deleted rabies virus expressing mCherry (EnvA-SADΔG-mcherry). G and TVA proteins were expressed in specific INs by the use of Cre mice together with AAV1-FLEX-TVA-2A-EGFP-2A-RVG (for Chx10+ and Vglut3+ INs) or lox-stop-lox-histone GFP-2A-TVA-2A-RVG mice (for Ptf1a+ INs). (B–D) Representative images of CSNs traced from Chx10+ (B), Ptf1a+ (C), and Vglut3+ (D) INs. In the panels, two images were combined to cover medial and laterals region of the cortex. White dotted lines show the cerebral cortex margins. Coronal section: right, medial; left, lateral. Scale bar, 100 μm. (E) Plotting of EnvA-SADΔG-mCherry+ CSNs traced from Chx10+ (red), Ptf1a+ (green), and Vglut3+ (blue) INs. Top view of the cortex. (F) Ratios of EnvA-SADΔG-mCherry+ CSNs traced from Chx10+ (red), Ptf1a+ (green), and Vglut3+ (blue) INs in ML % 1.7 mm, 1.7–2.0 mm, and R2.0 mm to total labeled neurons. Data are represented as mean ± SEM (n = 3). See also Figure S4.
Physiological Connections between CSNs and Spinal INs
We then examined the functionality of the anatomical connections between CSNs and Chx10+ and Ptf1a+ INs using a combined optogenetic and electrophysiological approach. We injected AAVs into the cerebral cortex to express ChR2 in the CST, and we obtained patch-clamp recordings from GFP+ INs in cervical slices of Chx10-Cre and Ptf1a-Cre; CC-EGFP mice (Figure 5A). Excitatory postsynaptic currents (EPSCs) were evoked by blue laser stimulation and classified as monosynaptic based on the following: (1) the ability to follow repetitive high-frequency stimulation (10 Hz) with a relatively constant latency (jitter < 3.5 ms), and (2) an absence of synaptic failures (although repetitive stimulation often caused a gradual depression of EPSC amplitudes; Figures 5B and 5C). Among the 18 cells analyzed from Chx10-Cre; CC-EGFP mice, 50% exhibited either mono- or polysynaptic EPSCs, and 4 cells showed monosynaptic EPSCs with an average latency of 4.52 ± 0.27 ms (Figure 5B). From the 20 cells examined from Ptf1a-Cre; CC-EGFP mice, 10 cells exhibited EPSCs, 3 of which had putative mono-synaptic EPSCs with an average latency of 5.75 ± 0.19 ms (Figure 5C). This electrophysiological data strongly suggest that CS axons synapse directly onto Chx10+ and Ptf1a+ IN populations.
Figure 5. Functional Connections between CS Axons and Spinal INs.

(A) Diagram of optogenetic stimulation and whole-cell patch-clamp recordings. ChR2-expressing CS axons were stimulated with a laser, and Chx10-GFP+ or Ptf1a-GFP+ spinal INs were recorded in slices. (B and C) Representative images of putative monosynaptic EPSCs recorded in Chx10-GFP+ (B) and Ptf1a-GFP+ INs (C) following the stimulation. Red trace, an average of 10 sweeps (black); lower traces in red, the 10-ms optical stimulation; traces in the boxes (B and C, left), the onset of the EPSCs by 10-Hz stimulation; traces in the right box of (C), an example of polysynaptic EPSCs with a greater variability in onset latency (i.e., jitter).
Physiological Connections of Sensory and Motor CSTs with Muscles
Based on the differences in sensory and motor CST projections and their connectivity with premotor INs, we also investigated the physiological connections between the sensory or motor cortices and muscles. We performed intracortical microstimulation (ICMS) in different mediolateral locations where CSNs reside (ML 0.5–3.0 mm and AP 0.5–1.0 mm; Figures 1G–1N and 6A), and electromyograms (EMGs) were recorded from a forelimb muscle. Upon stimulation of medial cortical areas encompassing either the motor cortex (ML 1.0–1.5 mm) or the border between the sensory and motor cortices (ML 2.0 mm), EMG responses were clearly evoked in the biceps muscle with relatively low thresholds (Figures 6B, 6C, and 6E). Although muscle responses in the biceps were also detected following stimulation of lateral areas (ML 2.5–3.0 mm), the thresholds to evoke EMGs gradually increased compared to the medial areas (Figures 6D and 6E). Furthermore, stimulation of the lateral cortex evoked smaller EMG responses compared to those produced by medial stimuli (Figures 6B–6D and 6F). These data suggest that the motor CST has stronger functional connections with muscles than the sensory CST.
Figure 6. Electrophysiological Analyses of Cortex-Spinal Cord-Muscle Circuits.

(A) Diagram of the ICMS and EMG experiments. Different areas of the sensorimotor cortex were stimulated by ICMS, and EMGs were recorded from contralateral biceps muscle. (B–D) Representative EMG responses evoked by ICMS at different mediolateral cortical areas. Stimulation was conducted at the threshold current in AP 1.0, ML 1.0 (B), 2.0 (C), and 2.5 mm (D). (E) Quantitative data of ICMS thresholds for EMG responses at different cortical areas from ML 0.5 to 3.0 mm. Mean ± SEM; one-way ANOVA followed by Tukey’s test, *p < 0.05 and **p < 0.01; n = 8–12. (F) Strength of EMG responses by ICMS (mV × ms) at threshold amplitudes at cortical areas from ML 0.5 to 3.0 mm. Kruskal-Wallis test followed by Dunn’s test, *p < 0.05 and **p < 0.01; n = 8–12. (G) Thresholds to evoke EMG responses by optical simulation at cortical spots from ML 0.5 to 3.0 mm in Thy1-ChR2 mice. Repeated one-way ANOVA followed by Tukey’s test, *p < 0.05 and **p < 0.01; n= 4. (H) Thresholds of EMG responses by optical simulation in Thy1-ChR2 and Thy1-ChR2; Chx10-Cre mice + AAV8-Syn-DIO-hM4Di pre- and post-CNO injections. Paired t test (left bars, n = 16, 4 animals) and Wilcoxon matched-pairs signed-rank test (right bars, n = 25, 7 animals), **p < 0.01. See also Figure S5.
We also specifically targeted layer V neurons using an alternative optogenetic approach with Thy1-ChR2 mice, which express ChR2 only in layer V of the cerebral cortex (Ayling et al., 2009). We again compared EMG responses from the biceps muscle when laser stimulation was applied along the mediolateral axis of the cortex. Clear EMG responses were observed when medial areas (ML 1.0–2.0 mm) were stimulated (Figure 6G), whereas stimulation to the lateral cortex (ML 2.5–3.0 mm) evoked responses only at higher thresholds (Figure 6G). Consistent with the anatomical data, these two electrophysiological approaches suggest that the motor CST establishes physiologically functional circuits that efficiently evoke forelimb muscle movements whereas the sensory CST has weaker connections to those muscles.
Next, we looked at how INs mediate CST-induced muscle activation. For this, we focused on Chx10+ spinal INs, which were one of the major excitatory IN populations connected with the motor CST (Figure 3). Our PRV assays showed that over 15% of PRV+ spinal INs (presumably premotor neurons) traced from the biceps muscle were Chx10+ (Figure S5). We then tested whether these Chx10+ INs mediated muscle responses triggered from optogenetic stimulation of CSNs in the motor cortex. We compared control mice against mice whose Chx10+ INs were chemogenetically silenced by expressing an engineered Gi/o-coupled human muscarinic M4 designer receptor, hM4Di, in Chx10+ neurons, which was accomplished by injecting AAV8-Syn-DIO-hM4Di-mcherry into the postnatal cervical cords of Thy1-ChR2; Chx10-Cre mice or Thy1-ChR2 control mice and inactivating the hM4Di-expressing Chx10+ neurons through administration of the receptor’s pharmacological ligand, clozapine-N-oxide (CNO). We found that thresholds to evoke EMGs were significantly higher after CNO injections in Thy1-ChR2; Chx10-Cre + hM4Di mice, but not in control Thy1-ChR2 mice (Figure 6H), indicating that Chx10+ spinal INs mediate neuronal signals from the motor cortex to forelimb muscles.
Role of Motor and Sensory CSTs in Skilled Motor Behaviors
Finally, to explore whether CS circuits from the motor and sensory cortices control skilled movements, we ablated or silenced cortical neurons and spinal INs involved in the CS circuits, and we examined the resulting effects on skilled movements (Figures S6A and S6B). Using high-speed cameras, we monitored and recorded skilled motor behaviors during a single-pellet reaching task, a well-established test for rodents (Gu et al., 2017b; Whishaw, 1996) (Figure S6B). We employed multiple approaches to inhibit various neuronal components of these CS circuits: (1) pyramidotomy (CST transection at the pyramid) or chemogenetic silencing of layer V neurons for global CST inhibition; (2) medial (motor) cortex lesioning or chemogenetic silencing of Chx10+ INs to inhibit the motor CS circuit; and (3) lateral (sensory) cortex lesioning or chemogenetic silencing of Vglut3+ INs to inhibit the sensory CS circuit. For medial and lateral cortical lesions, we induced photothrombotic stroke in restricted areas where motor or sensory CSNs were located (Figures S6F–S6J). In the chemogenetic approach, we introduced hM4Di into specific neurons, and we administered CNO to block neuronal activity in the targeted populations. Specifically, we injected AAV8-Syn-DIO-hM4Di-mcherry into the cortex of layer V-specific Rbp4-Cre mice to express hM4Di in layer V neurons and into the C4–7 region of Chx10-Cre and Vglut3-Cre mice to express hM4Di in Chx10+ and Vglut3+ INs (Figures S6K–S6O). Regard-less of the approach chosen, success rates in the single-pellet reaching task were significantly diminished (Figures 7A–7G).
Figure 7. Variable Deficits in Skilled Motor Behaviors Induced by Silencing or Ablating Neurons within Motor and Sensory CS Circuits.

(A–G) Success rates of individual mice in a single-pellet reaching test. Pyramidotomy (A), Rbp4-Cre + AAV-DIO-hM4Di + CNO (B), lesions in the medial (motor) cortex (C), lesions in the lateral (sensory) cortex (D), Chx10-Cre + AAV-DIO-hM4Di + CNO (E), Vglut3-Cre + AAV-DIO-hM4Di + CNO (F), and wild-type (WT) + AAV-DIO-hM4Di + CNO (G) are shown. Colored circles and lines are success rates for individual mice pre- and post-manipulation (injury or CNO injection), with horizontal black bars showing group averages. Paired t test or Wilcoxon matched-pairs signed-rank test, *p < 0.05 and **p < 0.01; n = 4–5. (H–N) Motion component scores in the reaching test of mice with pyramidotomy (H), Rbp4-Cre + AAV-DIO-hM4Di + CNO) (I), lesions in the medial cortex (J), Chx10-Cre + AAV-DIO-hM4Di + CNO (K), lesions in the lateral cortex (L), Vglut3-Cre + AAV-DIO-hM4Di + CNO (M), and WT + AAV-DIO-hM4Di + CNO (N). Data are represented as mean ± SEM (n = 4–5). Paired t test or Wilcoxon matched-pairs signed-rank test, *p < 0.05 and **p < 0.01. (O) The p values for comparisons of each motion component between control and treated mice analyzed in (H)–(N), with motions showing differences (p < 0.05) represented in red. Common deficits were seen in the advancement (encircled in blue) and food release phases (encircled in red) by suppression of motor and sensory CST-related neurons, respectively. (P–T) Kinematic analyses of aberrant reaching in the advancement phase in mice with medial cortex lesions (P), silencing Chx10+ INs (Q), with pyramidotomies (R), silencing Rbp4+ layer V neurons (S), and with lateral cortex lesions (T). Note the short reaching distance in treated mice (arrowheads in P and Q). Bottom panels show heatmaps of the spatial probabilities of the far distal positions of the reaching paw relative to the pellet position (‘‘x’’). Top view: upward, the advanced direction of the forelimb. Mice with the medial cortex lesions (control, 78 reaches; injury, 121 reaches); Chx10-Cre + AAV-DIO-hM4Di (control, 84 reaches; post-CNO injection, 109 reaches); pyramidotomies (control, 88 reaches; injury, 118 reaches); Rbp4-Cre + AAV-DIO-hM4Di (control, 64 reaches; post-CNO, 110 reaches); lateral cortex lesions (control, 64 reaches; injury, 92 reaches). Scale bar, 2 mm. (U) Acceleration of paw movement (cm/s2) during the advancement step in groups with the medial cortex lesion (M), Chx10-Cre + AAV-DIO-hM4Di with/without CNO, and other groups. Data are represented as mean ± SEM (n = 4–5). Paired t test, *p < 0.05. (V) Images of food manipulation and release. A control mouse bites the pellet and quickly releases its grip on the pellet (arrowheads). (W) Releasing time of food in lateral cortex-lesioned mice (L), Vglut3-Cre + AAV-DIO-hM4Di with/without CNO, and other groups. Data are represented as mean ± SEM (n = 4–5). Paired t test, *p < 0.05. See also Figures S6 and S7.
We then took a closer look at individual components of the affected behaviors in test mice. The single-pellet reaching task involves multiple ordered motions, which are divided into 10 components for rodents: limb lifting, digits closing, aiming, advancement, digit extension, pronation, grasping, supination I, supination II, and food release (Whishaw, 1996). We determined which motions exhibited defects within this complex behavioral sequence by scoring the deficits in each motion using frame-by-frame analysis of video recordings (Figure S6C). After identifying the motion phases that were commonly affected by neural inhibition of motor and sensory CS circuits, we performed detailed kinematic analyses to evaluate and characterize the behavioral deficiencies (Figures S6D and S6E).
Our pyramidotomy assay severely affected skilled movements with deficits arising in limb lifting, advancement, pronation, grasping, and food release (Figure 7H; Video S1), as reported previously (Starkey et al., 2005; Whishaw et al., 1993). In addition, inhibition of layer V neurons using Rbp4-Cre mice induced deficits in advancement, pronation, grasping, and food release (Figure 7I). Mice in both groups frequently exhibited shorter reaching distances or misdirected movements in the advancement phase with less pronation, and they displayed clumsy digit movements during the grasping and food release phases, suggesting that these components correspond to CST-dependent motions.
To specifically inhibit the motor CS circuits, we lesioned medial cortical neurons by focal stroke. The injured mice showed aberrant scores particularly in the advancement, pronation, and grasping phases of the task (Figure 7J). They exhibited shorter reaching distances and off-target advancement, less pronation, and clumsy grasping techniques (Video S2).
When Chx10+ INs were inhibited by hM4Di expression and CNO administration, mice exhibited short reaching during the advancement phase, but they did not show significant deficits in other steps (Figure 7K; Video S3). Control mice injected with AAV8-Syn-DIO-hM4Di-mcherry and CNO did not show significant deficits in those motions (Figures 7G and 7N). These results corroborated a previous study, which showed that ablation of Chx10+ INs disrupted skilled reaching (Azim et al., 2014).
Comparison of motions affected by motor cortex lesions and Chx10+ IN silencing suggests that motor CST-Chx10+ IN circuits are involved in arm advancement, but not pronation and grasping (Figures 7O and S6D). Indeed, kinematic analyses revealed shallower final positions of reaching paws and similar patterns of attenuated acceleration (cm/s2) in the advancement step after medial cortical lesioning and Chx10 neuron inhibition (Figures 7P, 7Q, 7U, S6P, and S6Q). CST inhibition by pyramidotomy or layer V silencing also exhibited similar short reaching behaviors and decreases in acceleration, further suggesting that Chx10+ INs contribute to CST-dependent skilled reaching (Figures 7R, 7S, 7U, S6R, and S6S).
To inhibit sensory CS circuits, we lesioned lateral cortical neurons. These mice showed aberrant movements in advancement and food release but normal pronation and grasping (Figure 7L). In the advancement step, the mice sometimes demonstrated hypometria (underreaching), with reach attempts often stopping short of the slit followed by grasping behavior, suggesting that the mice were unable to control the timing of the shift between reaching and grasping/retraction (Video S4). This acute termination of arm advancement seems to differ from the smooth advancements with short reaching distances seen in motor CS inhibition (Videos S2 and S3), since kinematic analyses of the lateral cortex-lesioned cohort revealed short reaching distances with normal acceleration (cm/s2) in arm advancements (Figures 7T, 7U, and S6T). The lateral cortex-lesioned mice also frequently performed supination II even when they failed to grasp the pellet, although these behaviors seemed to be CST independent since no other manipulations caused similar defects (Video S4). If pellets were obtained, the mice often showed apraxic manipulation and release of pellets during eating (Figure 7V; Video S5). Chemogenetic silencing of Vglut3+ INs by hM4Di and CNO also evoked deficits in food release, while of Vglut3+ neurons suggests that sensory CST-Vglut3 circuits are involved in the food release step, but not in the global steps of forearm reaching and retraction (Figures 7O and S6D). We further quantified the timing of food release during pellet consumption, and we found that lesions in the lateral cortex and inhibition of Vglut3+ INs both prolonged release times (Figure 7W). Pyramidotomy or layer V silencing also increased release times, indicating that pellet release is a CST-dependent motion (Figure 7W). Vglut3+ INs were also involved in the grasping phase, as suppression of those INs sometimes led to delays in the timing of pellet grasping, though the overall contribution of the sensory CST to the grasping phase seemed relatively weak (Figures 7L, 7M, and 7O).
Taken together, the correlation of deficits observed by ablation or inhibition of cortical neurons or spinal INs during CST-dependent motor behaviors suggests that the sensory and motor CSTs play distinct roles in skilled movements through connections with different IN populations.
DISCUSSION
Prior studies have documented various classes of CS projections with different cortical origins in mammals, which predict the existence of multiple compartmentalized CS circuits, including those involving the motor and sensory cortices (Lemon, 2008; Lemon and Griffiths, 2005). The dorsal and ventral projections of the sensory and motor CSTs, respectively, have been found in monkeys (Coulter and Jones, 1977), cats (Martin, 1996), and rats (Bareyre et al., 2002; Olivares-Moreno et al., 2017), suggesting that these descending CS pathways have essential, conserved roles across species. We found that mice also exhibit dorsal and ventral projections in their sensory and motor CSTs. In this study, we examined the connectivity and functions of these two different CS populations.
The Importance of the Motor CST for Motor Command
Taking advantage of genetic labeling tools, we performed a comprehensive analysis of CS connections with a variety of spinal INs covering most of the dorsal and ventral populations. One of the major IN groups connected to the motor CST is the V2a Chx10+ INs, which function in left-right alternative limb locomotion (Crone et al., 2008) and are essential for skilled reaching (Azim et al., 2014). More than 30% of Chx10+ INs are propriospinal neurons with dual innervation to motor neurons at cervical levels and to pre-cerebellar neurons of the lateral reticular nucleus. Ablation of Chx10+ INs caused skilled reaching deficits, possibly due to the disruption of propriospinal functions as an internal copy pathway for rapid feedback corrections (Azim et al., 2014). Our neuronal silencing assay similarly showed that Chx10+ INs contributed specifically to reaching progression during a pellet retrieval task. Although it is possible that silencing Chx10+ INs may have caused skilled reaching deficits through mechanisms unrelated to CS circuits, the accompanying reduction in EMG responses to motor cortex stimulation (Figure 6H) strongly suggest that Chx10+ INs relay CS information to motor neurons during skilled reaching behaviors.
Our behavioral analyses also suggest that Chx10+ INs relay commands from CS inputs to motor neurons, since both motor cortex lesions and Chx10+ IN silencing decelerate the speed of the reaching arm (Figure S7). However, since motor cortex lesioning resulted in additional motor dysfunctions, such as loss of pronation and clumsy grasping behaviors, other IN populations likely participate in mediating these different actions. Our PRV data further support the idea of IN multiplicity, as Chx10+ INs comprised only 15% of the premotor neurons and silencing Chx10+ INs did not completely abolish EMG responses (Figures 6H and S5).
Other types of INs can also relay complex motor commands from the motor CST. Our connectivity mapping analyses identified Atoh1+ (D) and Isl1+ INs as potential premotor candidates, which comprised 8.81% and 13.2% of PRV+ premotor INs, respectively (n = 1–2; data not shown). Tcfap2b+ and Satb1/ 2+ premotor INs residing in laminae IV and V, where Atoh1+ and Isl1+ INs are located, also receive substantial anatomical CS inputs (Levine et al., 2014). The degree to which these distinct, yet potentially overlapping, spinal circuits interact to guide various skilled motions remains an important topic for future study.
The Sensory CST and Sensorimotor Integration
Sensory CST projections were previously implicated in sensory transmission and modulation rather than motor execution during behavioral tasks (Lemon, 2008; Lemon and Griffiths, 2005). Here we found that excitatory Vglut3+ INs received abundant inputs from the sensory CST. Vglut3+ INs are involved in sensory circuits of the dorsal horn, where they receive low-threshold mechanosensory inputs and relay mechanical sensory information (Peirs et al., 2015). Lesioning of the sensory cortex, or suppression of Vglut3+ INs, led to similar deficits in pellet-releasing behaviors, which may be putative sensory compartments within this motor task. The apraxic manipulations observed in test mice closely resembled the clumsy digit and hand movements observed in monkeys following sensory cortex inhibition (Hikosaka et al., 1985; Iwamura and Tanaka, 1991). Although we could not distinguish whether deficits in skilled movements by sensory cortex lesions were caused by deficiency of bottom-up (from spinal cord to S1) or top-down (from S1 to spinal cord) signaling, or both, our comparative behavioral analyses with Vglut3+ IN and CST inhibition suggest that some of the top-down sensory signals might function to smooth out the execution of complex sequential behaviors (Figure S7).
Interestingly, recent studies revealed that activation in the motor cortex (M2) induces firing of layer V neurons in S1 as top-down signals and blocking this pathway causes deficits in sensory perception (Manita et al., 2015). Therefore, signaling from S1 to the spinal cord may be involved in sensory functions, such as sensory perception (Manita et al., 2015) or motor adaptation (Mathis et al., 2017). Though it is not known how the descending projections from the sensory cortex to the spinal cord control particular phases of skilled movements, they may send efferent copies to provide a predictive gating function or act as a filtering mechanism for anticipated sensory inputs generated by movements (Wolpert et al., 2001) (Figure S7). Concordantly, in our experiments, sensory cortex ablation produced dysmetric premature transitions from reaching to grasping/retracting, which may be caused by a loss in sensory predictive abilities. Since inhibition of Vglut3+ INs did not cause such defects, other IN populations may mediate this function. We also observed that Vglut3+ IN inhibition caused aberrant grasping particularly in paw flexion timing during the pellet grab, which was not observed in sensory cortex-lesioned mice. This suggests that Vglut3+ INs control the grasping phase through a CS circuit-independent manner.
The CSTs are also connected with inhibitory INs, which are likely involved in top-down sensory modulation and gating. For example, circuits underlying motor behaviors have a gating system for sensory information, likely mediated by cortical descending pathways (Moreno-López et al., 2013; Seki and Fetz, 2012; Seki et al., 2003). Recent detailed anatomical classifications in deep dorsal horn neurons demonstrate diverse types of neurons receiving inputs from the cortex, including several inhibitory IN populations (Abraira et al., 2017). In agreement with a previous study (Russ et al., 2013), we found that Ptf1a+ INs are connected to CSNs. Those Ptf1a+ INs are one of the major inhibitory IN populations with presynaptic inhibitory contacts on cutaneous and proprioceptive afferents (Betley et al., 2009). Gad2+ inhibitory neurons (a group that includes Ptf1a+ INs) play critical roles in ensuring smooth limb movements by controlling proprioceptive transmissions in a skilled reaching task (Fink et al., 2014). These INs might be regulated by the CS system in a top-down manner to control sensory information during the motor task, especially via suppressive effects on sensory inputs (Figure S7B).
Other CSN-IN connections might also be involved in sensory-motor integration. RORa+ INs are connected to both sensory afferents and CS axons (Bourane et al., 2015). Similarly, GDNF+ Clarke’s column neurons in the lumbar cord receive inputs from both proprioceptive afferents and CS axons, and they have long spinocerebellar projections transmitting proprioceptive information (Hantman and Jessell, 2010) that could be involved in sending predictive efferent copies of fine motor controls. These top-down pathways may also contribute to the gating of sensory information and convey prediction.
More CS Subtypes and Their Potential Functions
Although we examined the connectivity of sensory and motor CSTs, focal tracer injections revealed additional subtypes of CSNs, which are probably formed by both genetic and activity-dependent programs. CSNs are, therefore, likely to be classified into many subtypes beyond those proposed in this study. For example, the rostral population corresponding to the RFA projects axons ventromedially with bilateral projections. This resembles the projection patterns of CSNs in the premotor and supplementary motor areas in primates (Kuypers and Brinkman, 1970). Inhibition of the RFA or its CSNs causes specific impairments in grasping in rodents, which is also seen when the premotor area is inhibited in primates (Brown and Teskey, 2014; Fogassi et al., 2001; Wang et al., 2017).
In summary, our study reveals the connectivity between CSNs and their target INs, and it identifies the functional significance of these connections, thereby providing a conceptual framework to guide future investigations into the organizational and functional logic of motor circuits controlling skilled movements. The present data not only highlight the neural substrates governing skilled motor control in the CNS but also identify the basic neuronal architecture required to reconstruct appropriate motor circuits, with the goal of promoting the recovery of motor function following CNS injuries or in treating diseases affecting motor control.
STAR★METHODS
KEY RESOURCES TABLE
CONTACT FOR REAGENT AND RESOURCE SHARING
Further information and requests for resources and reagents should be directed to and will be fulfilled by the Lead Contact, Yutaka Yoshida (yutaka.yoshida@cchmc.org).
EXPERIMENTAL MODEL AND SUBJECT DETAILS
The following mouse lines were used in this study: C57BL/6J (Jackson laboratory), Rbp4-Cre (GENSAT, MMRRC), En1-Cre (gifted from Dr. Alexandra Joyner, Sloan Kettering Institute) (Kimmel et al., 2000), Chx10-Cre (Azim et al., 2014), Ptf1a-Cre (gifted from Dr. Christopher Wright, Vanderbilt University) (Kawaguchi et al., 2002), Chat-Cre (Jackson laboratory), Isl1-Cre (Jackson laboratory), Vglut3-Cre (Jackson laboratory), Dbx1-Cre (gifted from Dr. Alessandra Pierani, Institut Jacques Monod) (Bielle et al., 2005), Atoh1-Cre (Jackson laboratory), Olig3-Cre (gifted from Dr. Yasushi Nakagawa, University of Minnesota) (Vue et al., 2009), Nkx2.2-Cre (gifted from Dr. Lori Sussel, Columbia University) (Balderes et al., 2013), Lmx1b-Cre (gifted from Dr. Randy Johnson, University of Texas, and Dr. Artur Kania, IRCM) (Li et al., 2010), CAG-lox-CAT-lox-EGFP mice (CC-EGFP) (gifted from Dr. Jeffrey Robbins, Cincinnati Children’s Hospital Medical Center) (Nakamura et al., 2006), CAG-lox-stop-lox-tdTomato (Ai14, Jackson laboratory), CAG-lox-stop-lox-synaptophysin-tdTomato (Ai34D, Jackson laboratory), Thy1-ChR2 mice (line 18; gifted from Dr. Guoping Feng, MIT) (Arenkiel et al., 2007) and lox-stop-lox-histone GFP-2A-TVA-2A-G mice (Bourane et al., 2015). Mice were maintained in a pathogen-free environment in accordance with protocols approved by the Institutional Animal Care and Use Committee of the Cincinnati Children’s Hospital Research Foundation and Niigata University.
METHOD DETAILS
PRV tracing
Bartha strain PRV152 (expressing GFP; 4.9 × 10⁹ pfu/ml) and PRV614 (expressing RFP; 3.9 × 10⁹ pfu/ml; gifts from Dr. Lynn Enquist, Princeton University) were used as trans-synaptic and retrograde tracers (Gu et al., 2017b; Ueno et al., 2016). Under anesthesia with isoflurane, a skin incision was made to expose the target right forelimb muscle. PRV was injected into the muscle using a glass capillary (biceps, clavotrapezius, acromiotrapezius, spinodeltoideus, triceps, palmaris longus, or extensor carpi radialis; total 5 μl). PRV614 was used for double labeling with retrobeads (Figures 1B–1F), while PRV152 was used for other studies (Figures 1H–1N). Skin was then sutured. Animals were kept for 4 days to label the CSNs, then mice were perfused with 4% paraformaldehyde (PFA). Brains were processed for histological analyses. To label premotor spinal interneurons, PRV614 (total 2.5 μl) was injected into the biceps at P14, then animals were perfused 2 days later. In pilot studies, we determined that day 2 is the optimal time-point for sacrificing mice to observe trans-synaptic PRV infection of 2nd order premotor spinal interneurons, while day 4 is best for observing 3rd order neuron infection in the adult cerebral cortex (Gu et al., 2017b).
Retrograde tracing
CS and other brain neurons were retrogradely labeled with green retrobeads (Lumafluor) or 2% fluorogold (Fluorochrome), a fluorescent retrograde neuronal tracer, 1 week before the mice were sacrificed (Ueno et al., 2012). Mice were anaesthetized with isoflurane, and laminectomy was performed at vertebral level C5. They were then stabilized in a stereotaxic frame and 0.6 μL of tracer was infused into the right side of the spinal gray matter (0.5 mm lateral, 0.5 mm depth) using a glass capillary. After infusion, muscles and skin layers were sutured.
Anterograde tracing
Injection of anterograde tracer was performed as described previously (Ueno et al., 2012) with minor modifications. Six week-old mice were anesthetized with isoflurane and placed on a stereotaxic frame. Small holes were made in the corresponding sites of injections by using a 27G needle. To label the CST, BDA (MW, 10,000; Invitrogen; 10% in PBS, 0.6 ml/site; 3 injection sites for motor CST labeling (AP 0.0, ML 1.0 mm; AP 0.5, ML 1.0 mm; AP 0.5, ML 1.5 mm); 2 injection sites for sensory CST labeling (AP 0.5, ML 2.5 mm; AP−0.5, ML 2.25 mm); Figure 2B), AAV1-Syn-EGFP-Cre (2.0 × 10¹¹ GC/ml; Penn vector core; 0.6 μl/site; same coordinates with BDA injection for focal CS presynaptic terminal labeling in lsl-Syp-tdTomato mice), or AAV1-CAG-tdTomato (1.2 3 1012 GC/ml; Penn vector core; 0.6 ml/site; AP 0.5, ML 1.5 mm; for broad CST labeling) was injected into the left cortical hemisphere by using a Hamilton syringe tipped with a glass micropipette (all at a depth of 0.5 mm). After the injections, the scalp was sutured.
To ensure the stringency of the method to label most of the CS fibers by AAV1-CAG-tdTomato, we compared a ratio of contact and number of tdTomato+ CS synapses on Ptf1a+ INs, with an alternative CST marker PKCγ (Russ et al., 2013; Ueno et al., 2012). Overall the data showed similar values (ratio, 98.8 ± 1.22 versus 92.5%; synapse number, 3.78 ± 0.93 versus 3.16; AAV1-CAG-tdTomato (n = 2) versus PKCγ (n = 1)), suggesting sufficient labeling of CS fibers by AAV. In this study, we used AAV-tdTomato tracers rather than PKCγ staining, since PKCγ stains relatively a less amount of CST fibers (95% of the entire CST (Russ et al., 2013)) and cannot exclude some mixed axons of PKCγ+ spinal interneurons in the dorsal horn and midline crossing CS fibers from contralateral side of the cord (Ueno et al., 2012).
Immunohistochemistry
Animals were perfused transcardially with 4% PFA. Brains and spinal cords were dissected and post-fixed in the same fixatives over-night at 4°C. The tissues were then cryopreserved in 30% sucrose in PBS overnight and embedded in Tissue-Tek OCT compound (Sakura Finetek). Fifty μm-thick (for Figures 1, 4, and S2–S6) or 20 μm-thick serial sections (for Figures 2 and S1) were made with a cryostat and mounted on Superfrost Plus slides (Fisher).
For immunohistochemical staining, sections were blocked with 1% bovine serum albumin (BSA) / 0.3% Triton X-100 in PBS for 2 h and then incubated with the following primary antibodies in 0.1% Triton X-100 / PBS overnight at 4°C: sheep anti-GFP (1:1000; AbD Serotec, 4745–1051), rabbit anti-GFP (1:1000; Invitrogen, A11122), rat anti-GFP (1:1000; Nacalai, 04404–84), rabbit anti-RFP (Rockland, 1:1000, 600–401-379), rabbit anti-DsRed (1:500, Clontech, 632496), rabbit anti-PKCγ (1:500, Santa cruz, sc-211), rat anti-Ctip2 (1:500, Abcam, ab18465), and mouse anti-NeuN (1:100, Millipore, MAB377) antibodies. After washing with 0.1% Tween20 / PBS, sections were incubated with their corresponding secondary antibodies: Alexa Fluor 488 or Alexa Fluor 568 donkey anti-sheep, rabbit, rat, or mouse anti-IgG antibodies (1:1000; Invitrogen) in 0.1% Tween20 / PBS, for 2 h at room temperature.
For BDA staining, the sections were incubated in 0.3% Triton X-100 / PBS for 4 h, followed by incubation with Alexa Fluor 568 streptavidin (1:400, Invitrogen) for 2 h at room temperature. Nissl staining was performed by immersing sections in 0.1% cresyl violet solution.
Images were acquired by using a fluorescence microscope (Zeiss, AXIO IMAGER Z1 or Olympus BX51) or a confocal microscope (Nikon, A1R+).
For analyses of anatomical connection of spinal INs with the CST (for Figures 3, S2, and S3), we first prepared cervical cords perfused with 4% PFA and post-immersed in PBS. Spinal cords were then embedded in low melting agarose, and 80 μm-thick serial sections were made with a vibratome (Leica). Floating sections were blocked with 1% BSA / 0.3% Triton X-100 in PBS for 1 h and then sections of BDA-injected samples were incubated with Alexa Fluor 568 streptavidin in 0.1% Triton X-100 / PBS (1:400, Invitrogen) for 3 overnights at 4°C. After washing with 0.1% Triton X-100 in PBS, sections were incubated with the following primary anti-bodies for 3 overnights at 4°C: rabbit anti-GFP (1:1000; Invitrogen), rat anti-GFP (1:1000; Nacalai), rabbit anti-RFP (Rockland, 1:1000), rabbit anti-PKCγ (1:500; Santa cruz), and guinea pig anti-Vglut1 antibodies (1:10000; Millipore, AB5905) in 0.1% BSA / 0.1% Triton X-100 / PBS. After washing with 0.1% Triton X-100 / PBS, the sections were incubated with their corresponding secondary antibodies (Alexa Fluor 488 or 568 donkey anti-rabbit, rat IgG (1:1000; Invitrogen) and Alexa Fluor 647 guinea pig anti-IgG (1:1000; Jackson ImmunoResearch) antibodies) in 0.1% BSA/ 0.1% Triton X-100 / PBS, for an additional 3 overnights at 4°C. After washing, sections were mounted on slides and images were acquired with a confocal microscope (Nikon, A1R+) or a fluorescence microscope (Zeiss, AXIO IMAGER Z1).
Monosynaptic retrograde tracing with rabies virus
To detect presynaptic neurons that synapsed with Chx10+, Ptf1a+, or Vglut3+ spinal INs, monosynaptic retrograde tracing was performed by using modified rabies virus (Osakada et al., 2011). Since Chx10+ and Vglut3+ brainstem neurons also have descending outputs to the spinal cord (Nakamura et al., 2004) (Figures S4A–S4D), TVA and G protein expression were locally introduced into the cervical cord by AAVs. In contrast, since Ptf1a+ INs in the brain do not have descending projections to the cervical cord (Figures S4E–S4G), we used Ptf1a-Cre; lox-stop-lox-histone GFP-TVA-G mice. For Chx10+ and Vglut3+ INs, a P10 Chx10-Cre or Vglut3-Cre mouse was first anesthetized with isoflurane, and a laminectomy was performed at the C4 and 6 level. AAV1-Syn-FLEX-TVA-2A-EGFP-2A-RVG (1.4 × 10¹² vg/ml; UNC Vector Core) was injected stereotaxically into the cervical cord (0.8 μl/ site; 2 sites 0.6 mm apart rostrocaudally; 0.4 mm lateral, 0.5 mm in depth for Chx10+ INs; 0.4 mm lateral, 0.4 mm deep for Vglut3+ neurons). At P17, the mice were again anesthetized and EnvA-coated G-deleted rabies virus expressing mCherry (EnvA-SADΔG-mcherry (derived from SAD-B19 strain); 2.0 μ 108 TU/ml; gift from Dr. Edward Callaway and Gene Transfer, Targeting and Therapeutics Core (Salk Institute)) (Osakada et al., 2011) were injected into approximately the same sites (0.8 μl/ site, 2 sites 0.6–0.8 mm apart rostrocaudally; 0.5 mm lateral, 0.4–0.5 mm in depth). Mice were perfused 7 days later and histological analyses were performed. To visualize the synaptic connections of Ptf1a+ INs, Ptf1a-Cre; lox-stop-lox-histone GFP-2A-TVA-2A-RVG mice were injected with EnvA-SADΔG-mcherry (0.8 μl/ site, 2 sites 0.6–0.8 mm apart rostrocaudally; 0.5 mm lateral, 0.4 mm in depth) and perfused 7 days later. Postnatal ages around 2 weeks were selected for rabies virus injection due to the greater transportation efficiency of the SAD-B19 strain in postnatal mice and based on developmental stages of establishment of CS projections. Since the SAD-B19 strain has a lower retro-grade transport capacity, especially through a long axonal tract, the number of labeled presynaptic CSNs would be underestimated. Positional information of neurons, however, would be critical in this study.
Quantification
Plotting of CSNs on a cortical map (Figures 1 and 4)
Serial 50 μm thick coronal cortical sections were made and images of every other section were acquired with a Zeiss microscope. The labeled cell positions in the ML and AP axes (0 at midline in ML; 0 at bregma in AP, the position where lateral ventricles begin to be separated was determined as bregma (Paxinos and Franklin, 2001), were plotted using ImageJ software (Point picker, NIH). We observed much fewer labeled CSNs in the cortex ipsilateral to the side of retrograde tracer injection and the sensory cortex II, as previously reported (Ueno et al., 2012). These neurons were excluded from the analyses in this study.
Distribution of CST collaterals and presynaptic terminals in the spinal gray matter (Figure 2)
Images of 10 sections labeled with BDA, tdTomato, or Syp-tdTomato, each at the C4–5 and C6–7 levels, were acquired using a Zeiss microscope. The distribution of axons and presynaptic puncta were plotted using ImageJ software (NIH). Their distributions were further calculated in 0.1 mm squares, and heatmaps were generated using Graph-R software (instructed by Dr. Masachika Masujima, National Research Institute of Fisheries Science). The value in each square was assigned into 20 divisions ordered from high to low numbers with the squares in the highest division represented in red and the lowest in blue color. The margin of gray matter written in each heatmap was from one representative image analyzed at the C4–5 and C6–7 levels. Images of 4 sections counterstained with neuron-specific anti-NeuN antibody were subjected to analyses of lamina distribution by assessing areas of BDA+, tdTomato+ axons, or presynaptic terminals in spinal laminae of Rexed I~II, III, IV, V, VI, VII, VIII, IX and X, with ImageJ software (NIH). The borders of laminae were defined in NeuN-stained sections (Watson et al., 2009).
Spatial distribution of INs (Figure S2)
Images of GFP-labeled spinal INs at levels C4–5 and C6–7 (8–10 sections each) were acquired using a Zeiss microscope. Neuron positions were plotted by using ImageJ software (Point picker, NIH) with xy coordinates set using the position of the central canal as the origin (0, 0). Their distributions were further evaluated in 0.1 mm squares and demonstrated in heatmaps using Graph-R software. The margin of gray matter presented in each heatmap was from one representative image analyzed at levels C4–5 and C6–7.
Anatomical connections of spinal INs with CST (Figures 3 and S3)
Z stack images of 80 μm thick sections were acquired by confocal microscopy and the numbers of Vglut1+ / BDA+ puncta on GFP+ cells were counted in NIS elements viewer (Nikon). Atoh1-GFP+, Vglut3-GFP+, and Chat-GFP+ INs, which have subpopulations with different areal positions in the spinal cord, were subdivided as D (dorsal), V (ventral), and M (medial), respectively (Figures S2D, S2H, and S2K), and calculated separately. Vglut3-GFP+ V neurons located at the ventral midline and Chat-GFP+ D neurons located in the dorsal horn (Figure S2K) were relatively few in number, and thus excluded from the analyses. Glia-like cells in Olig3-Cre, Dbx1-Cre, and Nkx2.2-Cre; CC-EGFP samples, which had smaller soma and bushy dendritic structures were also excluded from the analyses. Since the existence of direct CST inputs on motor neurons is controversial in rodents and beyond the scope of this study, GFP-labeled motor neurons located in lamina IX of Atoh1-Cre, Isl1-Cre and Chat-Cre; CC-EGFP mice were also omitted from the study.
Four to six sections in C4–5 and C6–7 levels were selected, and percentages of GFP+ cells contacted by Vglut1+ / BDA+ (or Vglut1+ / tdTomato+) CST presynaptic terminals on cell bodies were counted. Two animals were tested, but if sufficient numbers of GFP+ neurons were not detected, an additional mouse was analyzed. Since the full lengths of dendrites could not be traced confidently in GFP+ cells, Vglut1+ / BDA+ (or Vglut1+ / tdTomato+) puncta on dendrites were not assessed in this study. As CS contacts on dendrites were excluded from the analyses, the percentages and contact synaptic numbers would underestimate CST inputs onto interneurons. The number of neurons counted and animals used were: Atoh1+ (D; 141 cells for motor CST, n = 2; 210 cells for sensory CST, n = 2; 111 cells for whole CST, n = 2: V; 94 cells for motor CST, n = 2; 145 cells for sensory CST, n = 2; 62 cells for whole CST, n = 2), Olig3+ (113 cells for motor CST, n = 2; 144 cells for sensory CST, n = 3; 96 cells for whole CST, n = 2), Isl1+ (241 cells for motor CST, n = 2; 98 cells for sensory CST, n = 2; 79 cells for whole CST, n = 2), Ptf1a+ (114 cells for motor CST, n = 2; 161 cells for sensory CST, n = 2; 85 cells for whole CST, n = 2), Lmx1b+ (142 cells for motor CST, n = 2; 196 cells for sensory CST, n = 2; 156 cells for whole CST, n = 2), Dbx1+ (90 cells for motor CST, n = 2; 190 cells for sensory CST, n = 2; 104 cells for whole CST, n = 2), Chat+ (M; 57 cells for motor CST, n = 2; 102 cells for sensory CST, n = 2; 77 cells for whole CST, n = 2), En1+ (173 cells for motor CST, n = 3; 102 cells for sensory CST, n = 2; 265 cells for whole CST, n = 2), Chx10+ (98 cells for motor CST, n = 2; 385 cells for sensory CST, n = 2; 188 cells for whole CST, n = 2), Nkx2.2+ (40 cells for motor CST, n = 2; 33 cells for sensory CST, n = 2; 41 cells for whole CST, n = 2), and Vglut3+ neurons (D; 130 cells for motor CST, n = 2; 193 cells for sensory CST, n = 2; 206 cells for whole CST, n = 2: M; 58 cells for motor CST, n = 2; 69 cells for sensory CST, n = 2; 79 cells for whole CST, n = 2).
Number of PRV+ INs in the cervical cord
Serial 50 μm thick spinal cord sections of from cervical levels C1–7 were immunostained and images were acquired of every other transverse section using a Zeiss microscope. The number of PRV-RFP+ and GFP+ cells were then counted. Locations of the cells were plotted by ImageJ software (Point picker, NIH). The X, Y origin (0, 0) was set to the position of the central canal. The following numbers of animals were analyzed: Chx10-Cre; CC-EGFP,n= 4; Ptf1a-Cre; CC-EGFP,n= 3; Vglut3-Cre; CC-EGFP,n= 3.
Area of cortical lesions and hM4Di-mCherry+ neurons
Serial 50 μm thick sections were stained and images of every other cortical section were acquired by an Olympus or Zeiss micro-scope. Edges of lesions or hM4Di-mCherry+ neurons in layer V were plotted along an XY axis (X = 0 at the midline, and Y = 0 at the bregma), with ImageJ software (Point picker, NIH). For the mean coordinates of lesion area, the maximum anterior, posterior, medial, and lateral positions were selected and averaged in 3 animals.
Whole cell patch clamp recordings and optogenetic stimulation to identify CST-to-IN connections
AAV1-CAG-ChR2(H134R)-mCherry (6.0–6.69 × 10¹² GC/ml, 0.4 μL / site; Penn vector core) was injected into the cerebral cortex (0.8 mm lateral, 0 and 1.0 mm rostral, 0.4 mm depth) at P3. P14–16 cervical cords spanning levels C4–7 were then isolated in a dissection solution (250 mM sucrose, 2.5 mM KCl, 25 mM NaHCO3, 1 mM NaH2PO4, 6 mM MgCl2, 0.5 mM CaCl2, and 25 mM glucose) bubbled with 95% O2 / 5% CO2, embedded in 3% low-melting-point agarose (Invitrogen), and cut into transverse slices (300 μm) using a Vibroslice tissue slicer (Campden Instruments). The slices were then immersed in NMDG-HEPES recovery solution (92 mM NMDG, 2.5 mM KCl, 30 mM NaHCO3, 1.2 mM NaH2PO4, 20 mM HEPES, 10 mM MgSO4, 0.5 mM CaCl2, 25 mM glucose, 5 mM sodium ascorbate, 2 mM thiourea, and 3 mM sodium pyruvate) for 20 min, and incubated in artificial CSF (125 mM NaCl, 2.5 mM KCl, 25 mM NaHCO3, 1 mM NaH2PO4, 1 mM MgCl2, 2 mM CaCl2, and 25 mM glucose) for 50 min. Whole-cell patch clamp recordings were obtained using a Multiclamp 700B amplifier and data acquisition system (Digidata 1440A with pClamp 10.4 software; Molecular Devices). Patch electrodes were filled with an intracellular solution (130 mM K-gluconate, 10 mM KCl, 10 mM HEPES, 10 mM Na-phosphocreatine, 4 mM MgATP, 0.3 mM Na2-GTP, pH 7.2, 295–305 mOsm) and had resistances ranging from 4–6 MΩ. EPSCs were evoked at a holding potential of −70 mV with a blue laser (473 nm, 400 μm in diameter; ~350 mW/mm2; Opto Engine) applied onto the slice at 0.5 Hz. As reported in prior studies using electrical (Li and Perl, 1994) or optogenetic (Hachisuka et al., 2016) stimulation of spinal synapses, EPSCs were classified as monosynaptic based on the ability to follow repetitive stimulation (10 Hz in the present experiments) with both a stable onset latency (jitter < 3.5 ms in the current study) and an absence of synaptic failures. However, given that monosynaptic connections are also potentially subject to transmission failure, it should be noted that the above classification system likely underestimates the prevalence of monosynaptic inputs onto our sampled population.
ICMS and EMG recording
ICMS and EMG recordings were conducted as previously reported (Gu et al., 2017b). Mice were anesthetized with ketamine / xylazine (100 mg/kg, 10 mg/kg, i.p.) and placed in a stereotaxic apparatus. A region of the skull, approximately 4 mm in diameter, was opened with a surgical drill, and the sensorimotor region of the cortex was exposed. A tungsten microelectrode (Microprobe; 1–2 μm tip diameter) was inserted into the forelimb area of the sensorimotor cortex. ICMS was carried out with 45 ms stimuli at 333 Hz (14 pulses), 0.2 ms biphasic; every 2 s duration, 10–100 μA by using a current stimulator (Model 2100; A-M Systems). Based on an anatomical map of CSNs (Figures 1G–1N), stimulation sites were decided as AP 0.5 mm, ML 0.5, 1.0, 1.5, 2.0, 2.5, 3.0 mm, and AP 1.0 mm, ML 0.5, 1.0, 1.5, 2.0, 2.5, 3.0 mm. For EMGs, electrical responses of the biceps muscle contralateral to the cortical stimulation site were detected by inserting percutaneous Ni-chrome wire electrodes (deinsulated 1 mm from the tip). EMG was recorded with a differential AC amplifier with low- and high-pass filtration (Model 1700; A-M Systems), and signals were acquired using an analog-to-digital converter (CED) and processed using Signal software (version 6.03; CED). The lowest current that produced an EMG response was defined as the threshold. The amplitudes of EMG responses by ICMS at threshold currents were calculated as mV × ms.
Optogenetic cortical stimulation and EMG recording
Thy1-ChR2 mice (line 18) (Arenkiel et al., 2007) were used to stimulate layer V neurons (Ayling et al., 2009). Optical stimulation and EMG recordings were conducted under anesthesia with ketamine / xylazine (100 mg/kg, 10 mg/kg, i.p.). The skull was opened with a surgical drill (approximately 4 mm in diameter centered at AP 0, ML 2.0 mm) and the sensorimotor region of the cortex was exposed. A blue laser (477 nm, 400 μm in diameter, Opto Engine) was applied onto positions where motor and sensory CSNs are located (ML 0.5–3.0 mm, AP 0.5 and 1.0; Figures 1G–1N). To find the threshold laser intensities required to evoke EMG responses, 10 ms duration light pulses at 0.5 Hz were applied with incremental increases in laser intensity (changing by 0.1 dial scales of the laser). The amplitude of the laser at each dial position was measured by an optical power meter (Thorlabs) after each experiment. We recorded EMG responses of the biceps muscle using 50 mm-diameter Teflon-coated tungsten wires (A-M systems; deinsulated 1 mm from the tip) with a separate ground, in response to stimulation of layer V neurons. Responses were recorded with a Multiclamp 700B amplifier with low- and high-pass filtration and data acquisition system (Digidata 1440A with pClamp 10 software; Molecular Devices). The lowest current that produced an EMG response was defined as a threshold.
To test the involvement of Chx10+ spinal interneurons in CS–muscle circuits, Thy1-ChR2 mice and Thy1-ChR2; Chx10-Cre mice were first injected with AAV8-Syn-DIO-hM4Di-mCherry (AAV8-hSyn-DIO-hM4D(Gi)-mCherry; 6.4 × 10¹² vg/ml; UNC Vector Core) into 4 spots at C4–7 (0.8 μL for each spot, 0.4 mm lateral, 0.5 mm depth, 0.6–0.8 mm rostrocaudal distance, right side) at P14. Optical stimulation and EMG recordings were then performed at 8~weeks old. Following stimulation and recording under control conditions as described above, CNO (5.0 mg/kg body weight, i.p.; Sigma) was injected and a second set of stimulation and recording was conducted 30 min later. In pilot experiments, we noticed that long duration experiments (with 30 min of waiting time post-injection) increased the arousal status in mice. To shorten the duration of each experiment, stimulated spots were restricted to 4 locations, where strong EMG responses were observed in control experiments (AP 0.5 and 1.0 mm, ML 1.5 and 2.0 mm; Figures 6E–6G). One tenth of a dose of ketamine / xylazine was additionally injected 7 min after CNO injections, which kept the mice in appropriate anesthetic condition during the subsequent recordings.
Single-pellet reaching test
The single-pellet reaching test was performed as previously reported (Gu et al., 2017b) with some modifications. Five weeks-old mice were food-restricted to maintain 90% of their free feeding weight before the training. The training chamber was made with a clear Plexiglas with 0.5 cm wide slits on the left, center, and right sides of the front wall. Millet seeds were placed in front of the slit for mice to reach, grasp, and retrieve through the slit. A one week training period was determined by pilot studies, in which success rates of the test reached a plateau within 1 week in most of the mice. During the initial 3 days of training, we placed the seeds in front of the center slit and allowed mice to make approximately 50 reach attempts per day to learn the test. Their preferred forelimb was determined at that time. The seeds were then placed in front of the left or right slit based on their preferred paw, and we recorded 20 reaches per day for 4 more days. The success rates of the test were then assessed. When the mouse successfully retrieved the seed and put it into its mouth, the attempt was considered a success.
During the reaching test, ~14 videos of 14.0 s duration were acquired with two high-speed digital cameras (200 fps, Grasshopper, Point Grey), placed diagonally behind and in front of the test slit. The KinemaTracer system was used to acquire and analyze videos, and the quality of each reach attempt (typically 10~30 reaches) was assessed using Whishaw’s score of reaching with some modifications (Whishaw, 1996). Each reaching task was subdivided into 10 components of motion, and abnormalities in each motion were qualified in frame-by-frame analyses of the video (Figure S6C). The 10 behavioral components in a typical reach attempt were defined as follows. (1) Limb lift: the reaching limb is lifted from the floor and targeted to the slit. (2) Digits close: as the limb is lifted, the digits are flexed. (3) Aim: during the upper arm movement, the elbow is adducted to the midline while the forearm is aligned along the midline. (4) Advance: the limb is advanced in a forward direction through the slit to the target pellet. (5) Digits extend: the digits are extended and opened during the advance. (6) Pronation: the elbow is abducted and the paw pronates when the paw is over the target. (7) Grasp: as the palm or digits touch the pellet, the digits flex over the pellet and grasp it. (8) Supination I: as the paw is withdrawn, it supinates in almost 90° through wrist movement and adduction of the elbow. (9) Supination II: once the paw is withdrawn from the slit, the paw is further supinated to present the food to the mouth. (10) Food release: the digits are opened to release the pellet to the mouth. Each component was given a score in a 3 points scale, where 0 represented movement appeared normal, 1 represented cases where the movement was incomplete or slightly abnormal, and 2 referred to movements that were either absent or replaced by other compensatory movements. When an observer felt ambiguity in scoring, an intermediate score (0.5) was given. To ensure objective scoring, we created a sub-scoring system in movements (1) Limb lift, (4) Advance, and (7) Grasp. (1) Limb lift was sub-classified into (1–1) Existence of lift (0, present; 1, incomplete or slightly abnormal; 2, absent), (1–2) Initiation (0, smooth; 1, rotating once; 1.5, rotating twice or more), (1–3) Advance (0, smooth; 1, rotating once; 1.5, rotating twice or more), (1–4) Target to the slit (0, smooth; 1, stop at the slit; 1.5, stop in front of the slit or hit the wall), and the highest score among them was given in (1) Limb lift. (4) Advance was subdivided into (4–1) Existence of advance (0, present; 1, incomplete or slightly abnormal; 2, absent), (4–2) Vibration I (0, smooth; 1, slightly move horizontally; 1.5, move horizontally), (4–3) Vibration II (0, smooth; 1, stopped slightly during movement; 1.5, stopped and retracted during advance), (4–4) Reach direction I (0, toward the pellet; 1, slightly misdirected horizontally; 1.5, misdirected horizontally), (4–5) Reach direction II (0, toward the pellet; 1, slightly misdirected upward; 1.5, misdirected upward), (4–6) Reach distance (0, normal; 1, short; 1.5, very short), (4–7) Reach distance (0, normal; 1, slightly long beyond the pellet; 1.5, long), and the highest score among them was assigned to (4) Advance. (7) Grasp was subdivided into (7–1) Existence of grasp (0, present; 1, incomplete or slightly abnormal; 2, absent), (7–2) Timing I (0, smooth; 1, slightly late in grasping when touching the pellet; 1.5, late in grasping), (7–3) Timing II (0, smooth; 1, slightly early in grasping before touching the pellet; 1.5, early in grasping) (7–4) Digits coupling (0, appeared normal; 1, slightly uncoupled; 1.5, uncoupled), and the highest score was given to (7) Grasp. Because we realized that precise assessment of (3) Aim required video-recordings from the midline and bottom directions, we excluded the evaluation of this component from the study.
The releasing time of food was assessed when the reach attempts were successful. Once mice successfully grabbed the seed, they typically brought it through the slit ((8) Supination I) toward their mouths ((9) Supination II), bit the seed, and quickly released their paw to adjust the position (Figure 7V). The time from biting to adjusting their paw was defined as the releasing time of food (Figure 7W).
DREADD experiment
For Chx10-Cre, Vglut3-Cre and control C57BL/6J mice, AAV8-Syn-DIO-hM4Di-mCherry (4.6–6.7 × 10¹² vg/ml; UNC Vector Core) was injected into the cervical spinal cords of P14 mice at 4 locations all within levels C4–7 (0.8 μL / location, 0.4 mm lateral, 0.5 mm depth for Chx10-Cre and control, 0.4 mm depth for Vglut3-Cre, 0.6–0.8 mm rostrocaudal distance, right side). Training of single-pellet reaching test was started at 5 weeks of age for 1 week, and only right-handed mice were used for the following experiment. At 8 weeks of age, reaching tests were again conducted for 3 days. On the last test day, reaching tests were done before and 30 min after CNO injections (5.0 mg/kg body weight, i.p.; Sigma).
For Rbp4-Cre mice, reaching test training was also started at 5 weeks of age for 1 week. Then, AAV8-Syn-DIO-hM4Di-mCherry (4.6–6.7 × 10¹² vg/ml; UNC Vector Core) was injected into the cortex at 6 weeks of age (0.6 μl/site, AP 0 mm, ML 1.5 mm, 0.5 mm in depth). The virus was injected into the contralateral cortical side of the preferred forelimb. hM4Di-mcherry was introduced broadly in layer V neurons of medial and lateral cortical areas (ML 0.37 ± 0.07 – 2.56 ± 0.17 mm, AP 1.50 ± 0.25 – −1.53 ± 0.27 mm, n= 3, Figures S6K and S6L). Most of the hM4Di-mcherry+ neurons were positive for layer V marker Ctip2 (94.36%), and 85.98% of CSNs retrogradely labeled with retrobeads were also hM4Di-mcherry+ (Figure S6M). Two weeks later, the tests were again conducted for 3 days. On the last day, reaching tests were done before and 30 min after CNO injections (5.0 mg/kg body weight, i.p.).
Photothrombotic stroke
Male C57BL/6J mice were trained with single-pellet reaching test for 1 week, started at 5 weeks of age. At 8 weeks of age, reaching tests were again conducted for 3 days. Mice were subsequently subjected to a focal cortical lesion in the medial or lateral cortex by using a photothrombotic stroke model (Labat-gest and Tomasi, 2013). We selected this lesion model because of its focal accessibility by light without the tissue damage caused by craniotomies. Mice were placed on a stereotaxic frame under anesthesia with isoflurane, and the skull was exposed with a midline incision of the scalp. A small piece of foil with a square opening targeting the lesion site was attached on the skull (ML 1.0–2.0 mm, AP —1.0–1.0 mm in square for medial cortex lesion; first exposure in ML 2.25–3.25 mm, AP 0.0–1.5 mm square and second in ML 2.25–3.25 mm, AP —1.5–0.0 mm, for lateral cortical lesion). Rose bengal solution (5 mg/ml in saline, 50 mg/kg BW, i.p.) was then injected. Five minutes later, light from a cold light source (KL1500 LCD, Zeiss) was applied to the exposed area of the skull for 15 min for a medial lesion, or for 12 min + 12 min (anterior and posterior parts, respectively) for lateral lesions. After the illumination treatment, the scalp was sutured. Reaching tests were again conducted 7 days later.
Pyramidotomy
Five week-old male C57BL/6J mice were trained for the single-pellet reaching test for 1 week, then at 8 weeks of age, reaching tests were again conducted for an additional 3 days. A CST transection was then performed with a lateral hemisection of the pyramid in the medulla oblongata (pyramidotomy) (Starkey et al., 2005; Ueno et al., 2012). For the pyramidotomy, the animals were anaesthetized with isoflurane, placed on their backs, and the skin of the ventral midline between the forelimbs and jaw was incised. The esophagus, trachea, and muscles were displaced, the ventrocaudal side of the occipital bone was targeted, and the medullary pyramid was exposed. The dura was first cut, and the pyramidal tract in the contralateral side of the preferred forelimb was transected with a 30-gauge needle and a surgical knife with a width of 0.5 mm and a depth of 0.25 mm. The esophagus, trachea, and muscles were returned to their original locations and configurations, and the skin was sutured. Reaching tests were again conducted 7 days later.
Kinematic analyses
Kinematic features of forelimb during reaching behaviors were assessed with high-speed cameras and a KinemaTracer system (Kissei Comtec) (Ueno and Yamashita, 2011). In this system, three-dimensional video recordings were made with two high-speed digital cameras (200 fps, Grasshopper, Point Grey) placed diagonally behind and front of the test slit, to trace and analyze wrist movements during each behavior. Recordings were acquired by the KinemaTracer software, and the movements of the back of the paw were traced manually to determine their coordinates. Before each session, the precise coordinates were calibrated by recording a cube of known size [5 × 10 × 10 cm (x × y × z)]. The far distal positions of the reaching paw at the time that grasping was initiated were plotted and relative positions to the pellet were analyzed in the x-y-z axis. Then their spatial probabilities were represented in heatmaps (bottom panels in Figures 7P–7T and S6P–S6T). For left-handed mice, the coordinates of x axis were multiplied by –1.0 so that the inner side of the body was set to the left side of the figure. Since frame by frame analyses of motion components revealed abnormalities in the advancement step in experimental groups involving lesions of the medial cortex and inhibition of Chx10+ neurons, various parameters (velocity (cm/s), acceleration (cm/s2), xyz coordinates (cm), etc.) were compared in 6 representative reaches (3 success + 3 missed reaches) in each control or treated mouse. Average values of acceleration (cm/s2) between the periods showing minimum and maximum velocities through the slit toward the seed (advancement step) were obtained (Figure 7U).
QUANTIFICATION AND STATISTICAL ANALYSIS
All statistical details are described in figure legends. Quantitative data are expressed as the mean ± SEM. Statistical analyses were performed using GraphPad Prism 7 (GraphPad Software). Differences among groups were statistically analyzed by one-way ANOVA followed by Tukey’s test or Kruskal-Wallis test followed by Dunn’s test. Differences among matched groups were statistically analyzed by repeated-measures ANOVA followed by Tukey’s test. Normality and equality of variances among the groups were analyzed with D’Agostino-Pearson normality test and Brown-Forsythe test, respectively. Differences between paired groups were analyzed with paired t test or Wilcoxon matched-pairs signed rank test. Normality was analyzed with D’Agostino-Pearson normality test or Shapiro-Wilk normality test. A P-value less than 0.05 was considered significant.
Supplementary Material
| REAGENT or RESOURCE | SOURCE | IDENTIFIER |
|---|---|---|
| Antibodies | ||
| Sheep polyclonal anti-GFP | AbD Serotec | 4745–1051; RRID:AB_619712 |
| Rabbit polyclonal anti-GFP | Invitrogen | A11122; RRID: AB_221569 |
| Rat monoclonal anti-GFP | Nacalai | 04404–84; RRID: AB_10013361 |
| Rabbit polyclonal anti-RFP | Rockland | 600–401-379; RRID: AB_2209751 |
| Rabbit polyclonal anti-DsRed | Clontech | 632496; RRID: AB_10013483 |
| Rabbit polyclonal anti-PKCγ | Santa cruz | sc-211; RRID: AB_632234 |
| Rat monoclonal anti-Ctip2 | Abcam | ab18465; RRID: AB_10015215 |
| Mouse monoclonal anti-NeuN | Millipore | MAB377; RRID: AB_2298772 |
| Guinea pig polyclonal anti-Vglut1 | Millipore | AB5905; RRID: AB_2301751 |
| Bacterial and Virus Strains | ||
| PRV152 | L. Enquist (Princeton Univ) | N/A |
| PRV614 | L. Enquist (Princeton Univ) | N/A |
| AAV1-Syn-EGFP-Cre | Penn vector core | AV-1-PV1848 |
| AAV1-CAG-tdTomato | Penn vector core | AV-1-PV3365 |
| EnvA-SADΔG-mcherry | E. Callaway and Gene Transfer, Targeting and Therapeutics Core (Salk Inst; Osakada et al., 2011) | Addgene #32636 |
| AAV1-Syn-FLEX-TVA-2A-EGFP-2A-RVG | UNC vector core | Addgene #52473 |
| AAV1-CAG-ChR2(H134R)-mCherry | Penn vector core | AV-1–20938M |
| AAV8-hSyn-DIO-hM4D(Gi)-mCherry | UNC vector core | Addgene #44362 |
| Chemicals, Peptides, and Recombinant Proteins | ||
| Green Retrobeads IX | Lumafluor | N/A |
| Biotinylated dextran amine (10,000MW) | Invitrogen | D-1956 |
| Fluorogold | Fluorochrome | N/A |
| Clozapine-N-oxide | Sigma-Aldrich | C0832–5MG |
| Experimental Models: Organisms/Strains | ||
| Mouse: Rbp4-Cre | GENSAT, MMRRC | MMRRC:031125-UCD; MGI:4367067 |
| Mouse: En1-Cre | A. Joyner (Memorial Sloan Kettering Cancer Center; Kimmel et al., 2000) | MGI:2446434 |
| Mouse: Chx10-Cre | Azim et al., 2014 | N/A |
| Mouse: Chat-Cre | The Jackson Laboratory | JAX# 006410; MGI: 5475195 |
| Mouse: Ptf1a-Cre | C. Wright(Vanderbilt Univ.; Kawaguchi et al., 2002) | MGI:2387804 |
| Mouse: Isl1-Cre | The Jackson Laboratory | JAX# 024242; MGI:3623159 |
| Mouse: Vglut3-Cre | The Jackson Laboratory | JAX# 018147; MGI:5316477 |
| Mouse: Dbx1-Cre | A. Pierani (Institut Jacques Monod; Bielle et al., 2005) | MGI:3757955 |
| Mouse: Atoh1-Cre | The Jackson Laboratory | JAX# 011104; MGI:3775845 |
| Mouse: Olig3-Cre | Y. Nakagawa (Univ Minnesota; (Vue et al., 2009) | MGI:3841452 |
| Mouse: Nkx2.2-Cre | L. Sussel (Columbia Univ.; (Balderes et al., 2013) | MGI:5538250 |
| Mouse: Lmx1b-Cre | R. Johnson (Univ Texas; Li et al., 2010) | N/A |
| Mouse: CAG-lox-CAT-lox-EGFP | J. Robbins (Cincinnati Children’s Hospital Medical Center; Nakamura et al., 2006) | MGI:3849685 |
| Mouse: CAG-lox-stop-lox-tdTomato (Ai14) | The Jackson Laboratory | JAX# 007914; MGI:3809524 |
| Mouse: CAG-lox-stop-lox-synaptophysin-tdTomato (Ai34D) | The Jackson Laboratory | JAX# 012570; MGI:4947243 |
| Mouse: Thy1-ChR2 | G. Feng (MIT; Arenkiel et al., 2007) | MGI:3719486 |
| Mouse: lox-stop-lox-histone GFP-2A-TVA-2A-G | Bourane et al., 2015 | N/A |
| Software and Algorithms | ||
| ImageJ software | NIH | https://imagej.nih.gov/ij/ |
| Graph-R software | S-NEXT | https://www.graph-project.com/ |
| pClamp 10.4 | Molecular Devices | https://www.moleculardevices.com/ |
| Signal software | CED | http://ced.co.uk/us/products/sigovin |
| KinemaTracer | Kissei Comtec | https://www.kicnet.co.jp/solutions/biosignal/3d/kinematracer/ |
Highlights.
Mouse CS axons from motor and sensory cortices project to distinct spinal regions
We map connectivity between CS neurons and various spinal interneurons
CS neurons in motor cortex control reaching via spinal Chx10+ interneurons
CS neurons in sensory cortex control food release via spinal Vglut3+ interneurons
ACKNOWLEDGMENTS
We would like to thank L. Enquist and the Center for Neuroanatomy with Neurotropic Viruses (CNNV; NIH grant P40RR018604) at Princeton University for providing PRVs; E. Callaway for rabies viruses; A. Joyner, C. Wright, A. Pierani, Y. Nakagawa, L. Sussel, R. Johnson, A. Kania, J. Robbins, and G. Feng for providing mice; J. Martin, N. Serradj, and J. Kalambogias (CUNY School of Medicine) for instruction on ICMS; K. Katayama, F. Imai, P. Thanh, A. Epstein, and M. Sandy (CCHMC) for their technical assistance; M. Masujima (NRIFS) for helping with heatmap analyses; M. Kamoshita, J. Ito (Azabu Univ), X. Sun (CCHMC), and T. Daikoku (Kanazawa University) for help in sperm cryopreservation; T. Yamashita (Osaka University), K. Shibuki, and O. Onodera (Niigata University) for supporting materials; and J. Martin for critical reading of the manuscript. This work was supported by NINDS-NS093002 (Y.Y.); PRESTO (JST; JPMJPR13M8); JSPS KAKENHI 17H04985, 17H05556, and 17K19443; JSPS Postdoctoral Fellowships for Research Abroad; the KANAE Foundation for the Promotion of Medical Science; the Kato Memorial Bioscience Foundation; Grant-in-Aid from the Tokyo Biochemical Research Foundation; the Narishige Neuroscience Research Foundation; and a Japan Heart Foundation Research Grant (M.U.).
Footnotes
DECLARATION OF INTERESTS
The authors declare no competing interests.
SUPPLEMENTAL INFORMATION
Supplemental Information includes seven figures and six videos and can be found with this article online at https://doi.org/10.1016/j.celrep.2018.03.137.
SUPPORTING CITATIONS
The following references appear in the Supplemental Information: Alvarez et al. (2005); Bermingham et al. (2001); Briscoe et al. (1999); Bui et al. (2013); Gross et al. (2002); Lee et al. (1998); Müller et al. (2002); Müller et al. (2005); Pierani et al. (2001); Sapir et al. (2004); Stepien et al. (2010); Yuengert et al. (2015); Zagoraiou et al. (2009); Zhang et al. (2008).
REFERENCES
- Abraira VE, Kuehn ED, Chirila AM, Springel MW, Toliver AA, Zimmerman AL, Orefice LL, Boyle KA, Bai L, Song BJ, et al. (2017). The cellular and synaptic architecture of the mechanosensory dorsal horn. Cell 168, 295–310.e19. [DOI] [PMC free article] [PubMed] [Google Scholar]
- Alaynick WA, Jessell TM, and Pfaff SL (2011). SnapShot: spinal cord development. Cell 146, 178–178.e1. [DOI] [PMC free article] [PubMed] [Google Scholar]
- Alstermark B, and Isa T (2012). Circuits for skilled reaching and grasping. Annu. Rev. Neurosci 35, 559–578. [DOI] [PubMed] [Google Scholar]
- Alvarez FJ, Jonas PC, Sapir T, Hartley R, Berrocal MC, Geiman EJ, Todd AJ, and Goulding M (2005). Postnatal phenotype and localization of spinal cord V1 derived interneurons. J. Comp. Neurol 493, 177–192. [DOI] [PMC free article] [PubMed] [Google Scholar]
- Arenkiel BR, Peca J, Davison IG, Feliciano C, Deisseroth K, Augustine GJ, Ehlers MD, and Feng G (2007). In vivo light-induced activation of neural circuitry in transgenic mice expressing channelrhodopsin-2. Neuron 54, 205–218. [DOI] [PMC free article] [PubMed] [Google Scholar]
- Asante CO, and Martin JH (2013). Differential joint-specific corticospinal tract projections within the cervical enlargement. PLoS ONE 8, e74454. [DOI] [PMC free article] [PubMed] [Google Scholar]
- Ayling OG, Harrison TC, Boyd JD, Goroshkov A, and Murphy TH (2009). Automated light-based mapping of motor cortex by photoactivation of channelrhodopsin-2 transgenic mice. Nat. Methods 6, 219–224. [DOI] [PubMed] [Google Scholar]
- Azim E, Jiang J, Alstermark B, and Jessell TM (2014). Skilled reaching relies on a V2a propriospinal internal copy circuit. Nature 508, 357–363. [DOI] [PMC free article] [PubMed] [Google Scholar]
- Balderes DA, Magnuson MA, and Sussel L (2013). Nkx2.2:Cre knock-in mouse line: a novel tool for pancreas- and CNS-specific gene deletion. Genesis 51, 844–851. [DOI] [PMC free article] [PubMed] [Google Scholar]
- Bareyre FM, Haudenschild B, and Schwab ME (2002). Long-lasting sprouting and gene expression changes induced by the monoclonal antibody IN-1 in the adult spinal cord. J. Neurosci 22, 7097–7110. [DOI] [PMC free article] [PubMed] [Google Scholar]
- Bermingham NA, Hassan BA, Wang VY, Fernandez M, Banfi S, Bellen HJ, Fritzsch B, and Zoghbi HY (2001). Proprioceptor pathway development is dependent on Math1. Neuron 30, 411–422. [DOI] [PubMed] [Google Scholar]
- Betley JN, Wright CV, Kawaguchi Y, Erdélyi F, Szabó G, Jessell TM, and Kaltschmidt JA (2009). Stringent specificity in the construction of a GABAergic presynaptic inhibitory circuit. Cell 139, 161–174. [DOI] [PMC free article] [PubMed] [Google Scholar]
- Bielle F, Griveau A, Narboux-Nême N, Vigneau S, Sigrist M, Arber S, Wassef M, and Pierani A (2005). Multiple origins of Cajal-Retzius cells at the borders of the developing pallium. Nat. Neurosci 8, 1002–1012. [DOI] [PubMed] [Google Scholar]
- Bourane S, Grossmann KS, Britz O, Dalet A, Del Barrio MG, Stam FJ, Garcia-Campmany L, Koch S, and Goulding M (2015). Identification of a spinal circuit for light touch and fine motor control. Cell 160, 503–515. [DOI] [PMC free article] [PubMed] [Google Scholar]
- Briscoe J, Sussel L, Serup P, Hartigan-O’Connor D, Jessell TM, Rubenstein JL, and Ericson J (1999). Homeobox gene Nkx2.2 and specification of neuronal identity by graded Sonic hedgehog signalling. Nature 398, 622–627. [DOI] [PubMed] [Google Scholar]
- Brown AR, and Teskey GC (2014). Motor cortex is functionally organized as a set of spatially distinct representations for complex movements. J. Neurosci 34, 13574–13585. [DOI] [PMC free article] [PubMed] [Google Scholar]
- Bui TV, Akay T, Loubani O, Hnasko TS, Jessell TM, and Brownstone RM (2013). Circuits for grasping: spinal dI3 interneurons mediate cutaneous control of motor behavior. Neuron 78, 191–204. [DOI] [PMC free article] [PubMed] [Google Scholar]
- Catsman-Berrevoets CE, and Kuypers HG (1976). Cells of origin of cortical projections to dorsal column nuclei, spinal cord and bulbar medial reticular formation in the rhesus monkey. Neurosci. Lett 3, 245–252. [DOI] [PubMed] [Google Scholar]
- Chakrabarty S, and Martin JH (2010). Postnatal development of a segmental switch enables corticospinal tract transmission to spinal forelimb motor circuits. J. Neurosci 30, 2277–2288. [DOI] [PMC free article] [PubMed] [Google Scholar]
- Coulter JD, and Jones EG (1977). Differential distribution of corticospinal projections from individual cytoarchitectonic fields in the monkey. Brain Res 129, 335–340. [DOI] [PubMed] [Google Scholar]
- Crone SA, Quinlan KA, Zagoraiou L, Droho S, Restrepo CE, Lundfald L, Endo T, Setlak J, Jessell TM, Kiehn O, and Sharma K (2008). Genetic ablation of V2a ipsilateral interneurons disrupts left-right locomotor coordination in mammalian spinal cord. Neuron 60, 70–83. [DOI] [PubMed] [Google Scholar]
- Darian-Smith I, Galea MP, Darian-Smith C, Sugitani M, Tan A, and Burman K (1996). The anatomy of manual dexterity. The new connectivity of the primate sensorimotor thalamus and cerebral cortex. Adv. Anat. Embryol. Cell Biol 133, 1–140. [PubMed] [Google Scholar]
- Dum RP, and Strick PL (1991). The origin of corticospinal projections from the premotor areas in the frontal lobe. J. Neurosci 11, 667–689. [DOI] [PMC free article] [PubMed] [Google Scholar]
- Fink AJ, Croce KR, Huang ZJ, Abbott LF, Jessell TM, and Azim E (2014). Presynaptic inhibition of spinal sensory feedback ensures smooth movement. Nature 509, 43–48. [DOI] [PMC free article] [PubMed] [Google Scholar]
- Fogassi L, Gallese V, Buccino G, Craighero L, Fadiga L, and Rizzolatti G (2001). Cortical mechanism for the visual guidance of hand grasping movements in the monkey: A reversible inactivation study. Brain 124, 571–586. [DOI] [PubMed] [Google Scholar]
- Gross MK, Dottori M, and Goulding M (2002). Lbx1 specifies somatosensory association interneurons in the dorsal spinal cord. Neuron 34, 535–549. [DOI] [PubMed] [Google Scholar]
- Gu Z, Kalambogias J, Yoshioka S, Han W, Li Z, Kawasawa YI, Pochareddy S, Li Z, Liu F, Xu X, et al. (2017a). Control of species-dependent cortico-motoneuronal connections underlying manual dexterity. Science 357, 400–404. [DOI] [PMC free article] [PubMed] [Google Scholar]
- Gu Z, Serradj N, Ueno M, Liang M, Li J, Baccei ML, Martin JH, and Yoshida Y (2017b). Skilled movements require non-apoptotic Bax/Bak pathway-mediated corticospinal circuit reorganization. Neuron 94, 626–641.e4. [DOI] [PMC free article] [PubMed] [Google Scholar]
- Hachisuka J, Baumbauer KM, Omori Y, Snyder LM, Koerber HR, and Ross SE (2016). Semi-intact ex vivo approach to investigate spinal somatosensory circuits. eLife 5, e22866. [DOI] [PMC free article] [PubMed] [Google Scholar]
- Hantman AW, and Jessell TM (2010). Clarke’s column neurons as the focus of a corticospinal corollary circuit. Nat. Neurosci 13, 1233–1239. [DOI] [PMC free article] [PubMed] [Google Scholar]
- Hikosaka O, Tanaka M, Sakamoto M, and Iwamura Y (1985). Deficits in manipulative behaviors induced by local injections of muscimol in the first somatosensory cortex of the conscious monkey. Brain Res 325, 375–380. [DOI] [PubMed] [Google Scholar]
- Hira R, Ohkubo F, Ozawa K, Isomura Y, Kitamura K, Kano M, Kasai H, and Matsuzaki M (2013). Spatiotemporal dynamics of functional clusters of neurons in the mouse motor cortex during a voluntary movement. J. Neurosci 33, 1377–1390. [DOI] [PMC free article] [PubMed] [Google Scholar]
- Iwamura Y, and Tanaka M (1991). Organization of the first somatosensory cortex for manipulation of objects: an analysis of behavioral changes induced by muscimol injection into identified cortical loci of awake monkeys. In Information Processing in the Somatosensory System, Franzén O and Westman J, eds. (Springer; ), pp. 371–380. [Google Scholar]
- Kawaguchi Y, Cooper B, Gannon M, Ray M, MacDonald RJ, and Wright CV (2002). The role of the transcriptional regulator Ptf1a in converting intestinal to pancreatic progenitors. Nat. Genet 32, 128–134. [DOI] [PubMed] [Google Scholar]
- Kimmel RA, Turnbull DH, Blanquet V, Wurst W, Loomis CA, and Joyner AL (2000). Two lineage boundaries coordinate vertebrate apical ectodermal ridge formation. Genes Dev 14, 1377–1389. [PMC free article] [PubMed] [Google Scholar]
- Kinoshita M, Matsui R, Kato S, Hasegawa T, Kasahara H, Isa K, Watakabe A, Yamamori T, Nishimura Y, Alstermark B, et al. (2012). Genetic dissection of the circuit for hand dexterity in primates. Nature 487, 235–238. [DOI] [PubMed] [Google Scholar]
- Kuypers HG, and Brinkman J (1970). Precentral projections to different parts of the spinal intermediate zone in therhesus monkey. Brain Res 24, 29–48. [DOI] [PubMed] [Google Scholar]
- Labat-gest V, and Tomasi S (2013). Photothrombotic ischemia: a minimally invasive and reproducible photochemical cortical lesion model for mouse stroke studies. J. Vis. Exp (76), 50370. [DOI] [PMC free article] [PubMed] [Google Scholar]
- Lee KJ, Mendelsohn M, and Jessell TM (1998). Neuronal patterning by BMPs: a requirement for GDF7 in the generation of a discrete class of commissural interneurons in the mouse spinal cord. Genes Dev 12, 3394–3407. [DOI] [PMC free article] [PubMed] [Google Scholar]
- Lemon RN (2008). Descending pathways in motor control. Annu. Rev. Neurosci 31, 195–218. [DOI] [PubMed] [Google Scholar]
- Lemon RN, and Griffiths J (2005). Comparing the function of the corticospinal system in different species: organizational differences for motor specialization? Muscle Nerve 32, 261–279. [DOI] [PubMed] [Google Scholar]
- Levine AJ, Lewallen KA, and Pfaff SL (2012). Spatial organization of cortical and spinal neurons controlling motor behavior. Curr. Opin. Neurobiol 22, 812–821. [DOI] [PMC free article] [PubMed] [Google Scholar]
- Levine AJ, Hinckley CA, Hilde KL, Driscoll SP, Poon TH, Montgomery JM, and Pfaff SL (2014). Identification of a cellular node for motor control pathways. Nat. Neurosci 17, 586–593. [DOI] [PMC free article] [PubMed] [Google Scholar]
- Li J, and Perl ER (1994). Adenosine inhibition of synaptic transmission in the substantia gelatinosa. J. Neurophysiol 72, 1611–1621. [DOI] [PubMed] [Google Scholar]
- Li Y, Qiu Q, Watson SS, Schweitzer R, and Johnson RL (2010). Uncoupling skeletal and connective tissue patterning: conditional deletion in cartilage progenitors reveals cell-autonomous requirements for Lmx1b in dorsal-ventral limb patterning. Development 137, 1181–1188. [DOI] [PMC free article] [PubMed] [Google Scholar]
- Maier MA, Armand J, Kirkwood PA, Yang HW, Davis JN, and Lemon RN (2002). Differences in the corticospinal projection from primary motor cortex and supplementary motor area to macaque upper limb motoneurons: an anatomical and electrophysiological study. Cereb. Cortex 12, 281–296. [DOI] [PubMed] [Google Scholar]
- Manita S, Suzuki T, Homma C, Matsumoto T, Odagawa M, Yamada K, Ota K, Matsubara C, Inutsuka A, Sato M, et al. (2015). A top-down cortical circuit for accurate sensory perception. Neuron 86, 1304–1316. [DOI] [PubMed] [Google Scholar]
- Martin JH (1996). Differential spinal projections from the forelimb areas of the rostral and caudal subregions of primary motor cortex in the cat. Exp. Brain Res 108, 191–205. [DOI] [PubMed] [Google Scholar]
- Mathis MW, Mathis A, and Uchida N (2017). Somatosensory cortex plays an essential role in forelimb motor adaptation in mice. Neuron 93, 1493–1503.e6. [DOI] [PMC free article] [PubMed] [Google Scholar]
- Moreno-López Y, Pérez-Sánchez J, Martínez-Lorenzana G, Condés-Lara M, and Rojas-Piloni G (2013). Cortical presynaptic control of dorsal horn C-afferents in the rat. PLoS ONE 8, e69063. [DOI] [PMC free article] [PubMed] [Google Scholar]
- Moreno-López Y, Olivares-Moreno R, Cordero-Erausquin M, and Rojas-Piloni G (2016). Sensorimotor Integration by Corticospinal System. Front. Neuroanat 10, 24. [DOI] [PMC free article] [PubMed] [Google Scholar]
- Müller T, Brohmann H, Pierani A, Heppenstall PA, Lewin GR, Jessell TM, and Birchmeier C (2002). The homeodomain factor lbx1 distinguishes two major programs of neuronal differentiation in the dorsal spinal cord. Neuron 34, 551–562. [DOI] [PubMed] [Google Scholar]
- Müller T, Anlag K, Wildner H, Britsch S, Treier M, and Birchmeier C (2005). The bHLH factor Olig3 coordinates the specification of dorsal neurons in the spinal cord. Genes Dev 19, 733–743. [DOI] [PMC free article] [PubMed] [Google Scholar]
- Murray EA, and Coulter JD (1981). Organization of corticospinal neurons in the monkey. J. Comp. Neurol 195, 339–365. [DOI] [PubMed] [Google Scholar]
- Nakamura K, Matsumura K, Hübschle T, Nakamura Y, Hioki H, Fujiyama F, Boldogköi Z, König M, Thiel HJ, Gerstberger R, et al. (2004). Identification of sympathetic premotor neurons in medullary raphe regions mediating fever and other thermoregulatory functions. J. Neurosci 24, 5370–5380. [DOI] [PMC free article] [PubMed] [Google Scholar]
- Nakamura T, Colbert MC, and Robbins J (2006). Neural crest cells retain multipotential characteristics in the developing valves and label the cardiac conduction system. Circ. Res 98, 1547–1554. [DOI] [PubMed] [Google Scholar]
- Olivares-Moreno R, Moreno-Lopez Y, Concha L, Martıńez-Lorenzana G, Condés-Lara M, Cordero-Erausquin M, and Rojas-Piloni G (2017). The rat corticospinal system is functionally and anatomically segregated. Brain Struct. Funct 222, 3945–3958. [DOI] [PubMed] [Google Scholar]
- Osakada F, Mori T, Cetin AH, Marshel JH, Virgen B, and Callaway EM (2011). New rabies virus variants for monitoring and manipulating activity and gene expression in defined neural circuits. Neuron 71, 617–631. [DOI] [PMC free article] [PubMed] [Google Scholar]
- Paxinos G, and Franklin KBJ (2001). The mouse brain in stereotaxic coordinates, Second Edition (Academic press; ). [Google Scholar]
- Peirs C, Williams SP, Zhao X, Walsh CE, Gedeon JY, Cagle NE, Goldring AC, Hioki H, Liu Z, Marell PS, and Seal RP (2015). Dorsal horn circuits for persistent mechanical pain. Neuron 87, 797–812. [DOI] [PMC free article] [PubMed] [Google Scholar]
- Pierani A, Moran-Rivard L, Sunshine MJ, Littman DR, Goulding M, and Jessell TM (2001). Control of interneuron fate in the developing spinal cord by the progenitor homeodomain protein Dbx1. Neuron 29, 367–384. [DOI] [PubMed] [Google Scholar]
- Ralston DD, and Ralston HJ 3rd. (1985). The terminations of corticospinal tract axons in the macaque monkey. J. Comp. Neurol 242, 325–337. [DOI] [PubMed] [Google Scholar]
- Russ JB, Verina T, Comer JD, Comi AM, and Kaltschmidt JA (2013). Corticospinal tract insult alters GABAergic circuitry in the mammalian spinal cord. Front. Neural Circuits 7, 150. [DOI] [PMC free article] [PubMed] [Google Scholar]
- Sapir T, Geiman EJ, Wang Z, Velasquez T, Mitsui S, Yoshihara Y, Frank E, Alvarez FJ, and Goulding M (2004). Pax6 and engrailed 1 regulate two distinct aspects of renshaw cell development. J. Neurosci 24, 1255–1264. [DOI] [PMC free article] [PubMed] [Google Scholar]
- Seki K, and Fetz EE (2012). Gating of sensory input at spinal and cortical levels during preparation and execution of voluntary movement. J. Neurosci 32, 890–902. [DOI] [PMC free article] [PubMed] [Google Scholar]
- Seki K, Perlmutter SI, and Fetz EE (2003). Sensory input to primate spinal cord is presynaptically inhibited during voluntary movement. Nat. Neurosci 6, 1309–1316. [DOI] [PubMed] [Google Scholar]
- Starkey ML, Barritt AW, Yip PK, Davies M, Hamers FP, McMahon SB, and Bradbury EJ (2005). Assessing behavioural function following a pyramidotomy lesion of the corticospinal tract in adult mice. Exp. Neurol 195, 524–539. [DOI] [PubMed] [Google Scholar]
- Stepien AE, Tripodi M, and Arber S (2010). Monosynaptic rabies virus reveals premotor network organization and synaptic specificity of cholinergic partition cells. Neuron 68, 456–472. [DOI] [PubMed] [Google Scholar]
- Tennant KA, Adkins DL, Donlan NA, Asay AL, Thomas N, Kleim JA, and Jones TA (2011). The organization of the forelimb representation of the C57BL/6 mouse motor cortex as defined by intracortical microstimulation and cytoarchitecture. Cereb. Cortex 21, 865–876. [DOI] [PMC free article] [PubMed] [Google Scholar]
- Tosolini AP, Mohan R, and Morris R (2013). Targeting the full length of the motor end plate regions in the mouse forelimb increases the uptake of fluorogold into corresponding spinal cord motor neurons. Front. Neurol 4, 58. [DOI] [PMC free article] [PubMed] [Google Scholar]
- Ueno M, and Yamashita T (2011). Kinematic analyses reveal impaired locomotion following injury of the motor cortex in mice. Exp. Neurol 230, 280–290. [DOI] [PubMed] [Google Scholar]
- Ueno M, Hayano Y, Nakagawa H, and Yamashita T (2012). Intraspinal rewiring of the corticospinal tract requires target-derived brain-derived neurotrophic factor and compensates lost function after brain injury. Brain 135, 1253–1267. [DOI] [PubMed] [Google Scholar]
- Ueno M, Ueno-Nakamura Y, Niehaus J, Popovich PG, and Yoshida Y (2016). Silencing spinal interneurons inhibits immune suppressive autonomic reflexes caused by spinal cord injury. Nat. Neurosci 19, 784–787. [DOI] [PMC free article] [PubMed] [Google Scholar]
- Vue TY, Bluske K, Alishahi A, Yang LL, Koyano-Nakagawa N, Novitch B, and Nakagawa Y (2009). Sonic hedgehog signaling controls thalamic progenitor identity and nuclei specification in mice. J. Neurosci 29, 4484–4497. [DOI] [PMC free article] [PubMed] [Google Scholar]
- Wang X, Liu Y, Li X, Zhang Z, Yang H, Zhang Y, Williams PR, Alwahab NSA, Kapur K, Yu B, et al. (2017). Deconstruction of corticospinal circuits for goal-directed motor skills. Cell 171, 440–455.e14. [DOI] [PMC free article] [PubMed] [Google Scholar]
- Watson C, Paxinos G, Kayalioglu G, and Heise C (2009). Atlas of the mouse spinal cord, First Edition (Academic Press; ). [Google Scholar]
- Whishaw IQ (1996). An endpoint, descriptive, and kinematic comparison of skilled reaching in mice (Mus musculus) with rats (Rattus norvegicus). Behav. Brain Res 78, 101–111. [DOI] [PubMed] [Google Scholar]
- Whishaw IQ, Pellis SM, Gorny B, Kolb B, and Tetzlaff W (1993). Proximal and distal impairments in rat forelimb use in reaching follow unilateral pyramidal tract lesions. Behav. Brain Res 56, 59–76. [DOI] [PubMed] [Google Scholar]
- Wolpert DM, Ghahramani Z, and Flanagan JR (2001). Perspectives and problems in motor learning. Trends Cogn. Sci 5, 487–494. [DOI] [PubMed] [Google Scholar]
- Yuengert R, Hori K, Kibodeaux EE, McClellan JX, Morales JE, Huang TP, Neul JL, and Lai HC (2015). Origin of a non-Clarke’s column division of the dorsal spinocerebellar tract and the role of caudal proprioceptive neurons in motor function. Cell Rep 13, 1258–1271. [DOI] [PMC free article] [PubMed] [Google Scholar]
- Zagoraiou L, Akay T, Martin JF, Brownstone RM, Jessell TM, and Miles GB (2009). A cluster of cholinergic premotor interneurons modulates mouse locomotor activity. Neuron 64, 645–662. [DOI] [PMC free article] [PubMed] [Google Scholar]
- Zhang Y, Narayan S, Geiman E, Lanuza GM, Velasquez T, Shanks B, Akay T, Dyck J, Pearson K, Gosgnach S, et al. (2008). V3 spinal neurons establish a robust and balanced locomotor rhythm during walking. Neuron 60, 84–96. [DOI] [PMC free article] [PubMed] [Google Scholar]
Associated Data
This section collects any data citations, data availability statements, or supplementary materials included in this article.