

SUMMARY
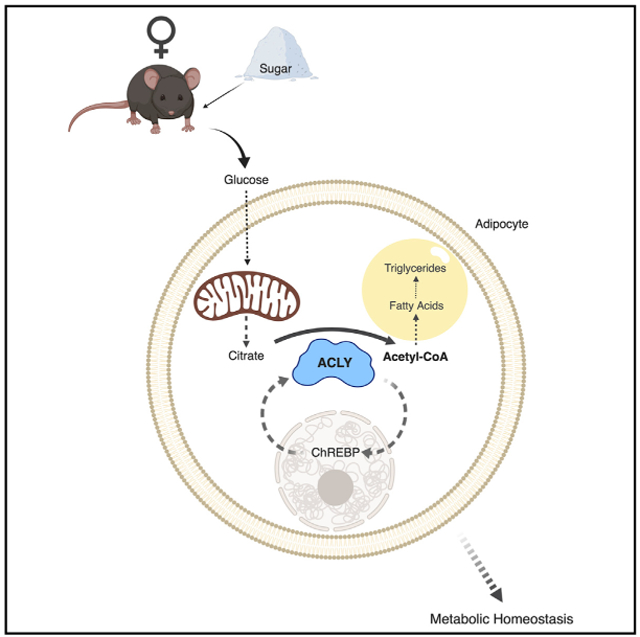
Sugars and refined carbohydrates are major components of the modern diet. ATP-citrate lyase (ACLY) is upregulated in adipocytes in response to carbohydrate consumption and generates acetyl-coenzyme A (CoA) for both lipid synthesis and acetylation reactions. Here, we investigate the role of ACLY in the metabolic and transcriptional responses to carbohydrates in adipocytes and unexpectedly uncover a sexually dimorphic function in maintaining systemic metabolic homeostasis. When fed a high-sucrose diet, AclyFAT−/− females exhibit a lipodystrophy-like phenotype, with minimal fat accumulation, insulin resistance, and hepatic lipid accumulation, whereas AclyFAT−/− males have only mild metabolic phenotypes. We find that ACLY is crucial for nutrient-dependent carbohydrate response element-binding protein (ChREBP) activation in adipocytes and plays a key role, particularly in females, in the storage of newly synthesized fatty acids in adipose tissue. The data indicate that adipocyte ACLY is important in females for the systemic handling of dietary carbohydrates and for the preservation of metabolic homeostasis.
Graphical Abstract
In Brief
Sugar is a major component of the modern diet. Fernandez et al. identify ATP-citrate lyase (ACLY) as a key facilitator of transcriptional and metabolic responses to dietary carbohydrates in adipocytes. Lack of adipocyte ACLY disrupts proper storage of lipids in adipose versus liver and promotes insulin resistance, particularly in females.
INTRODUCTION
The prevalence of obesity has increased dramatically in recent decades along with associated metabolic diseases, such as type 2 diabetes (González-Muniesa et al., 2017). Numerous insights into the molecular mechanisms linking obesity and diabetes have been gained through studies of diet-induced obesity in mice, although these studies have frequently been limited to males and to diets high in fat. Consumption of refined carbohydrates and sugar-sweetened beverages, a risk factor for diabetes, has risen dramatically in recent decades and is associated with an elevated relative risk of overall mortality (DeFronzo et al., 2015; Dehghan et al., 2017). However, the mechanisms that govern the handling of dietary carbohydrates, and particularly how such mechanisms might differ between males and females, remain poorly understood.
Acetyl-coenzyme A (CoA) is a central metabolite with key roles in bioenergetics, lipid biosynthesis, and signaling (Campbell and Wellen, 2018; Pietrocola et al., 2015). It is a building block for de novo synthesis of fatty acids and cholesterol, as well as the essential acetyl donor for lysine acetylation, a reversible post-translational modification with key roles in regulating protein stability, localization, and function (Choudhary et al., 2014; Pietrocola et al., 2015). The enzyme ATP-citrate lyase (ACLY) cleaves citrate to produce acetyl-CoA outside of mitochondria for glucose-dependent de novo lipogenesis (DNL). In addition to its role in DNL, ACLY is also a key regulator of histone acetylation levels in mammalian cells, including in adipocytes (Wellen et al., 2009). ACLY’s expression is potently regulated by nutrient availability in adipocytes, with its levels increased upon carbohydrate consumption and suppressed by dietary fat (Carrer et al., 2017; Fukuda et al., 1992; Herman et al., 2012; Jiang et al., 2009), suggesting that ACLY might be important for the cellular response to dietary carbohydrates.
Our prior work has implicated ACLY in the regulation of histone acetylation and gene expression in adipocytes (Carrer et al., 2017; Wellen et al., 2009; Zhao et al., 2016). Global histone acetylation levels increase during adipocyte differentiation of 3T3-L1 cells, in a manner dependent on ACLY, and specific genes, such as Slc2a4 (hereafter denoted Glut4), encoding the insulin-responsive glucose transporter GLUT4, are suppressed in the absence of ACLY (Wellen et al., 2009). Furthermore, upon genetic deletion of Acly from adipocytes in vivo (AclyFAT−/− mice), both adipose tissue histone acetylation levels and Glut4 mRNA levels are reduced (Zhao et al., 2016). Adipocyte GLUT4 has been shown to play an important role in the maintenance of systemic metabolic homeostasis, at least in part through promoting de novo synthesis of lipid species that exert insulin-sensitizing effects (Abel et al., 2001; Herman et al., 2012; Shepherd et al., 1993; Yore et al., 2014). On a chow diet, however, male AclyFAT−/− mice exhibited only a mild metabolic phenotype, despite lower Glut4 mRNA levels and reduced DNL (Zhao et al., 2016). Nevertheless, these data hinted that ACLY might play a role in regulating systemic metabolic health through gene regulation in a context-dependent manner (Sivanand et al., 2018).
Using conditional Acly knockout preadipocytes, we analyzed the role of ACLY in gene expression during adipocyte differentiation, finding that glucose and fatty acid metabolism gene expression signatures were strikingly suppressed in the absence of ACLY. Expression of the constitutively active β isoform of the glucose-responsive transcription factor carbohydrate response element binding protein (ChREBP) and ChREBP target genes was markedly suppressed in the absence of ACLY, suggesting that ACLY might modulate the transcriptional response to dietary carbohydrate via ChREBP. These data prompted us to examine ACLY’s role in the handling of chronic high carbohydrate consumption in vivo. The absence of ACLY in adipocytes elicited striking sexually dimorphic phenotypes. Female AclyFAT−/− mice fed a high-sucrose, zero-fat diet (ZFD) develop a lipodystrophy-like phenotype, exhibiting extreme leanness, hepatic steatosis, and insulin resistance. On the same diet, male AclyFAT−/− mice are leaner than their wild-type (WT) littermates but maintain insulin sensitivity and do not overtly accumulate excess lipid in the liver. In response to ZFD feeding, adipocytes of WT females as compared to males express higher levels of ChREBPβ and its target genes, and expression of ChREBPβ is nearly abolished in the absence of ACLY. Consistently, female as compared to male mice are more dependent on adipocyte ACLY for the storage of de novo synthesized fatty acids in subcutaneous white adipose tissue (SWAT). Levels of monomethyl branched-chain fatty acids (mmBCFAs), thought to be synthesized predominantly in adipose tissue (Wallace et al., 2018), are profoundly reduced in AclyFAT−/− mice, consistent with a drastic impairment in adipocyte DNL. When fed matched high- and low-glycemic index (HGI and LGI, respectively) diets containing some fat, female AclyFAT−/− mice remain very lean and insulin resistant on both diets compared to WT littermates, indicating the robustness of the phenotype across diets. These data suggest that ACLY and ChREBP engage in a positive feedback regulatory loop to enable glucose uptake and DNL in adipocytes, a mechanism that appears to play a particularly important role in facilitating proper lipid storage in adipose tissue versus liver and in preserving metabolic homeostasis in females. The findings identify a role for ACLY in adipocytes in regulating the complex interaction between diet, sex, and systemic metabolic homeostasis.
RESULTS
Establishment of a Genetic Model to Study the Role of ACLY in Gene Regulation in Adipocytes
We previously reported that ACLY regulates the expression of Glut4 and other glucose metabolism genes in 3T3-L1 adipocytes (Wellen et al., 2009). Using Aclyf/f preadipocytes isolated from the stromal-vascular fraction of SWAT of Aclyf/f mice (Carrer et al., 2017), we aimed to comprehensively define the role of ACLY in the regulation of gene expression during adipocyte differentiation. First, to validate the model, we characterized the effects of Acly deletion on adipogenesis. Adenoviral administration of Cre recombinase to Aclyf/f preadipocytes resulted in loss of Acly mRNA and ACLY protein (Figures S1A and S1B). We previously showed in mouse embryonic fibroblasts (MEFs) that ACSS2 is upregulated in the absence of ACLY (Zhao et al., 2016), and consistently, Acss2 was upregulated in preadipocytes upon Acly deletion (Figure S1B). After differentiation, Glut4 and Adipoq expression were markedly suppressed in ACLY-deficient adipocytes, in contrast to Fabp4 and Pparg1, which were impacted only modestly (Figure S1C). As expected, lipid accumulation and glucose-dependent fatty acid synthesis were suppressed in the absence of ACLY (Figures S1D and S1E), and global histone acetylation levels increased during adipocyte differentiation in an ACLY-dependent manner (Figure S1F). Altogether, these findings broadly recapitulate our prior findings using RNAi to silence ACLY during 3T3-L1 adipocyte differentiation (Wellen et al., 2009), suggesting that these cells are a robust tool to evaluate the role of ACLY in gene regulation.
ChREBPβ Expression in White Adipocytes Is ACLY Dependent
We conducted RNA sequencing to comprehensively define the genes that are responsive to ACLY during adipocyte differentiation (Figure S2A). ACLY deficiency altered gene expression in adipocytes, with 336 genes more highly expressed in Aclyf/f (WT) versus Acly−/− (knockout [KO]) adipocytes and 314 genes more highly expressed in KO versus WT adipocytes, using a log2 fold change > 1.5 cutoff (Figure 1A; Table S1). Of genes induced during adipocyte differentiation, ~20% (210/1,011) were suppressed in the absence of ACLY, suggesting that their induction during adipogenesis is ACLY dependent (Figure 1A; Table S1). In contrast, very few genes (only 7) were induced more strongly during differentiation in the absence of ACLY (Figure 1A; Table S1). Gene set enrichment analysis of Hallmarks gene sets revealed that an “adipogenesis” signature was suppressed in KO adipocytes (Figure 1B). However, expression of several canonical markers of differentiated adipocytes (i.e., Plin2 and Fabp4) and transcriptional regulators of adipogenesis (Pparg and Cebpa) within the RNA sequencing (RNA-seq) dataset revealed comparable or only moderately reduced mRNA expression in KO versus WT adipocytes (Figure 1C). These data suggest that specific components of the adipogenesis program, rather than the program in its entirety, might be responsive to ACLY (Figure 1C). We noted that metabolic genes, including those involved in glucose and fatty acid metabolism, were among those gene sets upregulated during differentiation in an ACLY-dependent manner (Figures 1B and 1C). Reciprocally, inflammatory genes were prominently upregulated in ACLY-deficient adipocytes, although the majority of these genes were not differentiation induced (Figures S2B and 1C). Thus, expression of many genes involved in glucose and lipid metabolism are upregulated during adipogenesis in an ACLY-dependent manner.
Figure 1. Metabolic Gene Expression Is Regulated during Adipocyte Differentiation in an ACLY-Dependent Manner.

(A–C) RNA sequencing was performed on biological triplicates of each Aclyf/f (WT) and Acly−/− (KO) day 0 preadipocytes and day 4 adipocytes.
(A) Venn diagram of adipogenesis-induced genes (higher expression in WT adipocytes [Ads] than WT preadipocytes [Preads]), ACLY-dependent genes in adipocytes (higher expression in WT Ads than KO Ads), and ACLY-suppressed genes in adipocytes (higher expression in KO Ads than WT Ads). All comparisons employ a log2 fold change (FC) > 1.5.
(B) Gene set enrichment analysis (GSEA) analysis of Hallmarks gene sets enriched in WT Ads versus KO Ads.
(C) Graphing of RNA-seq data (fragments per kilobase million; FPKM): select adipocyte markers (left); fatty acid and glucose metabolism genes (middle); and inflammatory genes (right), q < 0.05.
See also Figures S1 and S2 and Table S1.
Next, to test whether ACLY deficiency functionally impacts glucose metabolism in adipocytes, we monitored rates of glucose consumption and lactate production during adipocyte differentiation, finding that both increased significantly over the first 4 days of differentiation (Figure 2A). In contrast, in the absence of ACLY, neither glucose consumption nor lactate production increased during differentiation. Furthermore, insulin-stimulated glucose uptake was markedly impaired in KO adipocytes, even though insulin-stimulated AKT phosphorylation was largely intact (Figures 2B and 2C). Targeted metabolite analysis in preadipocytes and adipocytes was performed to assess the levels of glycolytic intermediates during adipocyte differentiation. Some glycolytic intermediates, including fructose-bisphosphate (FBP) (F1,6BP and F2,6BP were not distinguished), were suppressed in KO adipocytes (Figure 2D). We also analyzed levels of glycolytic intermediates after acute insulin stimulation and again found that the abundance of FBP was strongly reduced in the absence of ACLY (Figure 2E). This result suggests that phosphofructokinase (PFK) activity may be reduced in KO cells. Although this could possibly due to allosteric inhibition of PFK by citrate (Garland et al., 1963), ACLY’s substrate, we did not observe accumulation of citrate in KO cells (Figures 2D and 2E). Because Pfkfb3 is suppressed in KO adipocytes (Figure 1C), a more likely explanation is reduced abundance of the PFK allosteric activator F2,6BP (Hers and Van Schaftingen, 1982). Acetyl-CoA levels were found to be higher in KO as compared to WT adipocytes (Figures 2D and 2E), which is consistent with our prior findings in MEFs that substantial compensatory acetyl-CoA production from acetate can occur in the absence of ACLY, resulting in elevated acetyl-CoA abundance (Zhao et al., 2016). Together, these findings indicate that ACLY facilitates glucose metabolism in cultured adipocytes.
Figure 2. ChREBP Activation Is ACLY Dependent during Adipocyte Differentiation.

(A) Rates of glucose consumption and lactate production were analyzed using a YSI Bioanalyzer.
(B) Insulin-stimulated uptake of 3H-2-deoxyglucose; Ins, insulin; CytoB, cytochalasin B.
(C) Cells were differentiated, serum starved overnight, and treated with indicated doses of insulin for 10 min. Day indicates day after induction of differentiation. Insulin signaling was analyzed by western blot.
(D and E) Metabolite levels were quantified by LC-MS in day 0 preadipocytes and day 4 adipocytes under standard culture conditions (D) and in day 4 adipocytes after 15 min after insulin stimulation (E). The 3 PPP intermediates, ribulose-5-phosphate, xylulose-5-phosphate, and ribose-5-phosphate, share the same exact mass, which was quantified in 2 separate peaks designated as PPP1 and PPP2.
(F) qPCR analysis of Chrebpα and Chrebpβ expression.
(G and H) Correlation of relative mRNA expression of ACLY with ChREBPα (G) and GLUT4 (H) in human adipose tissue samples. S, subcutaneous; V, visceral depots. All bar graphs depict mean ± SEM of biological triplicates. Statistics by two-tailed t test, *p < 0.05; **p < 0.01; ***p < 0.001.
ChREBP is a transcription factor that regulates expression of fatty acid synthesis genes in a glucose-responsive manner (Abdul-Wahed et al., 2017). Activation of the ChREBPα isoform and subsequent expression of constitutively active ChREBPβ occurs in a manner dependent on GLUT4-dependent glucose uptake in adipocytes (Herman et al., 2012). Considering that glucose uptake is reduced and fatty acid synthesis genes are suppressed in the absence of ACLY, we hypothesized that ACLY might play a role in promoting ChREBP activation in adipocytes. Indeed, differentiation-induced ChREBPα expression was blunted and ChREBPβ expression essentially abolished in ACLY-deficient adipocytes (Figure 2F). ChREBPβ expression correlates closely with expression of its target genes (Herman et al., 2012), suggesting that mRNA levels of ChREBPβ reflect the activity of ChREBP. Indeed, ChREBP target genes, such as Acaca, Fasn, Thrsp, and Scd1, were also potently suppressed in ACLY-deficient adipocytes (Figure 1C). Moreover, expression of genes occupied by ChREBP in white adipocytes (Poungvarin et al., 2015) was strongly enriched in WT compared to KO adipocytes (Figure S2C), further confirming that ChREBP activity is dependent on ACLY in adipocytes. Because Acly is also a transcriptional target of ChREBP, ACLY and ChREBP may together potentiate a positive feedback loop to promote glucose uptake and fatty acid synthesis.
Given these findings, we next investigated whether ACLY expression correlates with GLUT4 and ChREBP expression in human adipose tissue. Although available samples were from obese individuals in which the ChREBP axis is expected to be strongly suppressed (Eissing et al., 2013), a strong correlation was nonetheless observed between ACLY and both GLUT4 and ChREBPα (ChREBPβ was undetectable in these samples; Figures 2G and 2H), consistent with the notion that GLUT4, ACLY, and ChREBP expression are co-regulated in human adipose tissue.
Adipocyte ACLY Deficiency Results in Mild Insulin Resistance in Young Female Chow-Fed Mice
White adipocyte ChREBPβ expression is positively associated with insulin sensitivity in both mice and humans (Eissing et al., 2013; Herman et al., 2012; Tang et al., 2016; Vijayakumar et al., 2017). We previously found that, although Glut4 levels and adipose DNL are suppressed in male AclyFAT−/− mice, the animals exhibited normal adipose histology and body weights (Zhao et al., 2016). To more comprehensively analyze the effects of adipocyte ACLY deficiency on systemic metabolism, we placed male and female AclyFAT−/− and Aclyf/f littermate controls onto a standard chow diet upon weaning and studied them over 16 weeks (to 20 weeks of age). Female AclyFAT−/− mice initially exhibited slightly slower weight gain but later caught up to WT controls, and no differences in body composition between genotypes were observed at 20 weeks of age (Figures S3A and S3B). No differences in body weight or body composition were noted between genotypes in males (Figures S3A and S3B). In male mice, no significant differences in insulin or glucose tolerance were detected throughout the study (Figures S3C-S3E). In contrast, young female AclyFAT−/− mice (after 4 weeks of chow feeding) were insulin resistant as determined by insulin tolerance test (Figure S3D). Interestingly, in somewhat older female mice, no significant differences in glucose or insulin tolerance were detected between genotypes (Figures S3C and S3E). Consistent with our prior findings in male adipose tissue (Zhao et al., 2016), we observed that Acss2 and Fasn were upregulated in both male and female AclyFAT−/− mice (Figure S3F). Together, the data indicate that mild insulin resistance develops in young female, but not male, AclyFAT−/− animals on a chow diet.
Female AclyFAT−/− Mice Are Lipodystrophic and Insulin Resistant on a High-Sucrose Diet
Given that ACLY is upregulated by dietary carbohydrate consumption (Fukuda et al., 1992; Herman et al., 2012) and promotes ChREBP activity, at least in vitro (Figure 2), we hypothesized that adipocyte ACLY might play a larger role in the maintenance of metabolic homeostasis in response to chronic high-carbohydrate consumption. To test this, we placed male and female WT and AclyFAT−/− littermate mice on a zero-fat high (60%)-sucrose diet (ZFD) upon weaning and monitored them over 16 weeks. Surprisingly, male mice were relatively unperturbed by the lack of adipocyte ACLY, even on this highly lipogenic diet. In male mice, body weight and blood glucose were not significantly different between genotypes, although analysis of body composition revealed that the AclyFAT−/− males had a lower percentage of body fat than their WT counterparts (Figures 3A and 3B). In contrast to the males, females consuming ZFD were severely impacted by the absence of ACLY in adipocytes. Among females, body weight differences emerged within 2 weeks of beginning the ZFD (Figure 3A). Female AclyFAT−/− mice were extremely lean with a mean of <5% body fat at the end of the study and only ~1 g of total body fat per animal, a marked reduction as compared to their WT littermates (Figure 3B). Leptin levels were significantly reduced in female AclyFAT−/− mice and strongly trending toward reduced in male AclyFAT−/− mice, reflecting the lower adiposity (Figure 3C).
Figure 3. Female AclyFAT−/− Mice Are Very Lean and Insulin Resistant on a High-Sucrose, Zero-Fat Diet.

(A–G) Upon weaning, male and female AclyFAT−/− mice were fed a high-sucrose, zero-fat diet (ZFD) and monitored for 16 weeks.
(A) Body weights in females (left panel) and males (right panel), analyzed by two-way ANOVA.
(B) Body composition measure by MRI after 16 weeks on ZFD.
(C) Serum leptin levels at 16 weeks on ZFD.
(D) Blood glucose levels (6 h fasting) in females (left panel) and males (right panel).
(E) Glucose tolerance test (GTT) after 12 weeks on ZFD in females (left panel) and males (right panel).
(F) Insulin levels (ad lib fed).
(G) Insulin tolerance test (ITT) after 14 weeks on ZFD in females (left panel) and males (right panel).
For all panels except ELISAs, n = 6 female Aclyf/f, n = 7 female AclyFAT−/−, n = 6 male Aclyf/f, n = 7 male Aclyf/f. For leptin ELISA, n = 5 female Aclyf/f, n = 6 female AclyFAT−/−, n = 4 male Aclyf/f, n = 4 male AclyFAT−/−. For insulin ELISA, n = 4 female Aclyf/f, n = 5 female AclyFAT−/−, n = 4 male Aclyf/f, n = 4 AclyFAT−/−. Error bars depict mean ± SEM for all panels. Statistics by two-tailed t test, unless ANOVA is indicated for panel. *p < 0.05; **p < 0.01; ***p < 0.001. See also Figure S3.
We also investigated the effects of ACLY deficiency on glucose homeostasis. AclyFAT−/− females, but not males, displayed a mild increase in blood glucose levels (Figure 3D). Glucose tolerance tests revealed that mice fed a ZFD adapt to the chronic high load of sugars, and WT male and female animals displayed only a mild rise in blood glucose levels when injected with 2 mg/kg glucose (Figure 3E), as compared to that on chow diet (Figure S3C). AclyFAT−/− male mice exhibited no differences in glucose tolerance from WT males, and AclyFAT−/− females displayed higher blood glucose levels at baseline and almost no response at all to the bolus injection of glucose compared to their WT counterparts (Figure 3E). Insulin levels were elevated in both male and female AclyFAT−/− mice (Figure 3F), and female, but not male, AclyFAT−/− mice were markedly insulin resistant on ZFD, as assessed by insulin tolerance test (Figure 3G). Thus, ZFD feeding revealed strong sexual dimorphism in metabolic phenotypes in the absence of adipocyte ACLY. These data suggest that adipocyte ACLY plays a key role in coordinating systemic handling of dietary carbohydrates, particularly in females.
Sex Differences in ChREBPβ Levels and Dependence on ACLY for Deposition of De Novo Synthesized Fatty Acids in Adipose Tissue
To gain insight into the mechanisms that might account for the differential sensitivity of females to adipocyte ACLY deficiency, we examined gene expression patterns. In vitro analysis in cultured adipocytes had suggested that ACLY plays a role in suppressing inflammatory gene expression and in promoting lipogenic gene expression (Figure 1). Inflammation within WAT can contribute to metabolic dysfunction (Hotamisligil, 2017), and we noted that adipocyte size was more heterogeneous in ACLY-deficient SWAT and pgWAT and that there was evidence for increased presence of non-adipocyte cell types (Figure 4A). Inflammatory gene expression indeed tended to be elevated in the absence of ACLY in WAT, although sex did not obviously modify this phenotype (Figure 4B), suggesting that differences in chronic inflammation are unlikely to account for the sex differences in metabolic responses. On the other hand, ChREBPβ expression was strikingly higher in WT female than male mouse WAT, and in both males and females, expression was nearly undetectable in the AclyFAT−/− SWAT and pgWAT (Figures 4C and 4D). Consistently, ChREBP targets, including Fasn, Acly, and Thrsp, were more highly expressed in WT females than males in SWAT, and expression of each was severely reduced in AclyFAT−/− animals (Figures 4C and 4D). Notably, the effect of Acly deletion on fatty acid metabolism genes was opposite on ZFD (Figure 4D) to that observed on chow diet (Figure S3F), likely reflecting the fact that ChREBPβ is lowly expressed on chow diet (Vijayakumar et al., 2017). Interestingly, the impact of ACLY on fatty acid metabolism gene expression on ZFD closely recapitulated that observed in cultured adipocytes grown under high-glucose conditions (Figure 1). Acss2 showed a distinct pattern, in that it was suppressed in female, but not male, AclyFAT−/− mice on ZFD (Figure 4D). Together, the data indicate that, in response to chronic high-sucrose feeding, the ChREBP pathway is more strongly activated in females than in males and that its activation in WAT is dependent on ACLY.
Figure 4. Females Exhibit Greater Dependence on Adipocyte ACLY for Deposition of Newly Synthesized Fatty Acids in Adipose Tissue Than Males.

(A–D) Analysis of Aclyf/f and AclyFAT−/− mice after 16 weeks on ZFD.
(A) Representative histology of female pgWAT and SWAT; scale bars represent 25 μm.
(B) Inflammatory gene expression in pgWAT by qPCR.
(C) ChREBP gene expression in pgWAT.
(D) ChREBP and target gene expression in SWAT.
(E–H) Analysis of Aclyf/f and AclyFAT−/− mice after 4 weeks on ZFD.
(E) Fractional synthesis of fatty acids in SWAT after D2O labeling of mice for 1 week.
(F) Abundance of saponified fatty acids in SWAT per mg tissue.
(G) Abundance of saponified fatty acids in serum.
(H) Abundance of saponified fatty acids in liver.
Error bars depict mean ± SEM for all panels. For all panels, n = 6 female Aclyf/f, n = 7 female AclyFAT−/−, n = 6 male Aclyf/f, n = 7 male AclyFAT−/−. Statistics by two-tailed t test; asterisks depict analysis between genotypes: *p < 0.05; **p < 0.01; ***p< 0.001; number symbols depict analysis between sexes: #p < 0.05; ##p < 0.01; ###p < 0.001. See also Figure S4.
Female adipose tissue has been previously shown to be more lipogenic than male adipose tissue in mice (Macotela et al., 2009), and ChREBP expression in human adipose tissue is higher in females than males (Eissing et al., 2013), consistent with our findings in mice. We therefore investigated whether adipocyte ACLY deficiency differentially impacts de novo fatty acid synthesis in males and females in vivo. To do this, mice were administered 2H2O via bolus intraperitoneal (i.p.) injection and addition to drinking water for 1 week, and incorporation of deuterium atoms into de novo synthesized fatty acids was analyzed within WAT. The presence of de novo synthesized fatty acids in WAT represents that synthesized within WAT along with that synthesized elsewhere (i.e., in the liver) and transported to fat. When comparing WT males and females, despite the differences in ChREBP activation between the sexes, we did not observe a sex difference in either the total pool sizes of fatty acids per gram tissue or the fraction of de novo synthesized fatty acids in SWAT (Figures 4E and 4F). This could possibly reflect a greater contribution from fatty acids made in the liver and transported to fat in male mice, which could obscure sex differences in WAT DNL. Regardless, ACLY deficiency in SWAT markedly reduced the presence of de novo synthesized fatty acids, and the reduction in fractional synthesis of major fatty acid species in ACLY-deficient SWAT was greater in female than male mice, indicating that, on ZFD, female mice are more dependent on adipocyte ACLY for accumulation of newly synthesized fatty acids in WAT than male mice (Figure 4E). This could reflect either less transport of fatty acids from liver or lesser ability to compensate for ACLY deficiency within adipocytes in females.
We therefore next investigated whether compensation for ACLY deficiency in males occurs intrinsically within adipose tissue. Monomethyl branched chain fatty acids (mmBCFAs) are synthesized predominantly in adipose tissue and thus may provide a signature for adipocyte DNL (Wallace et al., 2018). Total abundance and fractional synthesis of the mmBCFA isoC16:0 were strikingly and comparably suppressed in males and females in the absence of ACLY in SWAT (Figures 4E, 4F, S4A, and S4B). In serum and in liver, mmBCFA abundance was also potently suppressed in the AclyFAT−/− animals (Figures 4G and 4H), supporting the model that mmBCFAs present in serum and liver were originally synthesized in fat (Wallace et al., 2018). Thus, in the context of high-sucrose feeding, both sexes rely on ACLY for DNL within adipocytes, but males may store more hepatic synthesized fatty acids within SWAT, potentially rendering them less dependent on adipocyte ACLY for metabolic health.
In examining the livers, male AclyFAT−/− mice exhibited upregulation of FASN at both the mRNA and protein levels in liver as compared to WT males, suggesting that male liver may upregulate DNL to compensate for reduced adipose DNL (Figures 5A and 5B). ChREBPβ and DNL genes were more highly expressed in female as compared to male ZFD-fed animals (Figures 5A and 5B), and females also accumulated more hepatic lipid than males on ZFD (Figure 5C). Together, these data indicate that, in females, ACLY-dependent DNL in adipocytes plays a key role in ensuring proper lipid storage in adipose rather than liver.
Figure 5. Female, but Not Male, AclyFAT−/− Mice Develop Hepatic Steatosis on ZFD.

(A–C) Analysis of livers of Aclyf/f and AclyFAT−/− mice after 16 weeks on ZFD.
(A) qPCR analysisof expression of fatty acid synthesis genes in liver; error bars represent mean ± SEM n = 6 female Aclyf/f, n = 7 female AclyFAT−/−, n = 6 male Aclyf/f, n = 7 male AclyFAT−/−. Statistics by two-tailed t test; asterisks depict analysis between genotypes: *p < 0.05; **p < 0.01; ***p < 0.001; number symbols depict analysis between sexes: #p < 0.05; ##p < 0.01; ###p < 0.001.
(B) Western blot analysis of protein levels in liver.
(C) Representative histology of livers; scale bars represent 75 μm.
Matched High- and Low-Glycemic-Index Diets Reveal a Key Role of Adipocyte ACLY in Systemic Metabolic Homeostasis in Females that Is Accentuated by Consumption of High-Glycemic-Index Carbohydrates
Refined diets as compared to natural diets have been shown to have diverse effects on metabolism (Dalby et al., 2017). Thus, use of appropriately matched control diets is crucial for assessing the roles of specific nutrients in contributing to metabolic phenotypes. To test the robustness of the role of adipocyte ACLY in metabolic regulation in females, as well as the role of glycemic load in contributing to metabolic phenotypes, we used high- and low-glycemic-index diets matched for total protein (21.1% kcal), carbohydrate (62.2% kcal), and fat (16.6% kcal) content (Coate and Huggins, 2010). Carbohydrates in the HGI diet were from the easily digested starch amylopectin, and the LGI diet contained high amylose starch that is resistant to digestion (Coate and Huggins, 2010). On both diets, body fat was very low in the absence of adipocyte ACLY, and total body weight was significantly lower in AclyFAT−/− mice on the HGI diet (Figures 6A-6D). Glucose tolerance on the HGI diet was comparable to that observed on ZFD, with only a minimal response to bolus glucose injection (Figure 6E). In contrast, LGI-fed mice exhibited a spike in blood glucose levels in response to glucose injection, similar to that on chow diet, and modestly impaired glucose clearance was observed in the AclyFAT−/− mice (Figure 6F). On both diets, AclyFAT−/− females exhibited impaired response to insulin (Figures 6G and 6H). Liver histology revealed marked steatosis on HGI as compared to LGI, along with elevated expression of DNL gene expression (Figures 6I-6K). Hepatic lipid accumulation was further enhanced in the absence of ACLY (Figures 6I and 6J). On all three refined diets tested (ZFD, HGI, and LGI), AclyFAT−/− females are very lean and insulin resistant and accumulate hepatic lipid, reminiscent of a lipodystrophic phenotype. The data indicate that adipocyte ACLY plays a robust role in mediating the proper storage of lipid in adipose tissue versus in the liver in females and in preserving metabolic homeostasis.
Figure 6. Female AclyFAT−/− Mice Are Insulin Resistant on Both LGI and HGI Diets but Accumulate More Hepatic Lipid when Consuming HGI Carbohydrates.

(A–K) Upon weaning, female Aclyf/f and AclyFAT−/− mice were fed matched high- or low-glycemic-index (HGI or LGI, respectively) diets for 16 weeks.
(A and B) Body weights on HGI (A) and LGI (B) diet, respectively, analyzed by two-way ANOVA.
(C and D) Body composition measure by MRI after 16 weeks on HGI (C) and LGI diets (D).
(E and F) GTT after 11 weeks on HGI (E) and LGI (F) diets.
(G and H) ITT after 14 weeks on HGI (G) and LGI (H) diets.
(I) Representative liver histology; scale bars represent 50 μm.
(J) Triglyceride levels in HGI-fed mice.
(K) qPCR gene expression analysis in liver.
For HGI diet, n = 8 female Aclyf/f, n = 8 female AclyFAT−/−. For LGI diet, n = 7 female Aclyf/f, n = 8 AclyFAT−/−. For all panels, error bars indicate mean ± SEM. Statistics by two-tailed t test unless ANOVA is indicated for panel. *p < 0.05; **p < 0.01; ***p < 0.001.
DISCUSSION
In this study, we identify a sexually dimorphic role for adipocyte ACLY in the regulation of systemic metabolic homeostasis. On three different carbohydrate-rich defined diets (ZFD, HGI, and LGI), ACLY deficiency in adipocytes results in extreme leanness, as well as insulin resistance and hepatic lipid accumulation in female mice. Although male AclyFAT−/− mice fed ZFD are also somewhat leaner than their WT littermates, they are largely protected from insulin resistance and hepatic steatosis. Mechanistically, we observe that ChREBP is more potently activated in the adipose tissue of female as compared to male mice in response to high sucrose consumption and that expression of ChREBPβ is severely blunted in the absence of ACLY. Consistently, female adipose tissue is more dependent on adipocyte ACLY and DNL for storage of de novo synthesized fatty acids than male adipose tissue. Because Acly is also a transcriptional target of ChREBP, the findings suggest that an ACLY-ChREBP positive feedback loop in adipocytes plays an important role in the handling of dietary carbohydrates to allow proper synthesis and storage of lipids in adipose tissue and to preserve systemic metabolic homeostasis, particularly in females.
Although it is well known that sex differences exist in glucose and lipid metabolism (Karastergiou and Fried, 2017; Link and Reue, 2017; Varlamov et al., 2015), the molecular players remain relatively poorly defined. The identification of ACLY as a participant in sexually dimorphic metabolic phenotypes represents a step toward understanding the sex differences in glucose and lipid metabolism and could potentially inform therapeutic strategies, because ACLY is being investigated as a therapeutic target for metabolic diseases (Pinkosky et al., 2017; Ray et al., 2019; Wei et al., 2019). Females generally favor lipid storage over oxidation (Link and Reue, 2017; Varlamov et al., 2015), and there is evidence in both humans and mice that lipid synthesis is higher in adipose tissue in females (Edens et al., 1993; Macotela et al., 2009). Furthermore, familial partial lipodystrophy in humans more profoundly perturbs metabolism in females than in males (Garg, 2000; Haque et al., 2003; Savage, 2009; Vigouroux et al., 2000), consistent with the notion that proper lipid storage in adipose tissue is particularly crucial in females for metabolic health, potentially driven by an evolutionary need for females to maintain adequate fat storage for survival and/or reproduction. Sex hormones are major, although not the only, mediators of sex differences in metabolism (Link and Reue, 2017). Estradiol (E2) has been shown to protect against HFD-induced insulin resistance (Camporez et al., 2013). On the other hand, female sex hormones were reported to account for only a small proportion of gene expression differences in WAT between male and female mice (Grove et al., 2010). Glut4 expression, for example, is higher in female WAT and not altered by ovariectomy (Grove et al., 2010). Moreover, although adipose DNL was reduced by ovariectomy in female mice, this seemed to be secondary to weight gain rather than through direct effects of E2 on adipose tissue (Macotela et al., 2009). Androgens could also potentially participate in the phenotypes observed, as reduced testosterone levels are associated with increased hepatic lipid accumulation (Jia et al., 2018; Nikolaenko et al., 2014; Senmaru et al., 2013). Thus, an important but also complicated direction for the future investigation will be to define the roles of androgens and estrogens in mediating sex differences in metabolism and gene regulation in adipose and liver.
A related question is why females are more dependent than males on ACLY for the storage of de novo synthesized fatty acids in adipose tissue. Interestingly, although synthesis of mmBCFAs (which are thought to be synthesized only in adipose tissue; Wallace et al., 2018) is comparably suppressed in both male and female knockout mice, the presence of other newly synthesized fatty acids (which can be made in fat or liver) in adipose tissue is more strongly suppressed in female than male knockout animals. These data suggest that females may conduct a greater percentage of whole-body de novo lipogenesis within adipocytes than males in the context of high carbohydrate feeding. This model could be further tested through genetic approaches that interfere with hepatic de novo lipogenesis and/or innovative isotope tracing approaches that distinguish adipose and liver DNL.
Another intriguing observation made in the course of this work is that, although female AclyFAT−/− mice were very lean and insulin resistant on three different refined diets, on a natural ingredient chow diet with similar carbohydrate and fat content as the LGI and HGI diets, they were at least partially protected from adverse metabolic phenotypes. Numerous differences exist between natural and refined diets. Refined diets have been shown, for example, to profoundly influence the gut microbiota (Dalby et al., 2017), potentially impacting levels of microbial products, such as acetate. In addition, the natural chow diet contains high amounts of soy, and it is conceivable that soy phytoestrogens might modify sexually dimorphic phenotypes. The chow diet also contains animal-derived fat, and it is also possible that ingestion of bioactive lipid species, potentially including mmBCFAs, could also modify these phenotypes. These possibilities will be investigated in future studies.
In sum, these findings identify adipocyte ACLY as an upstream regulator of ChREBP activity in adipocytes and, particularly in females, in promoting the proper distribution of lipid storage in adipose tissue versus the liver and in maintaining metabolic homeostasis. Sex differences in glucose and lipid metabolism have been understudied to date, and the findings of this study advance knowledge of the complex interaction between diet, sex, and systemic metabolism.
STAR★METHODS
CONTACT FOR REAGENT AND RESOURCE SHARING
Information and requests for reagents may be addressed to the Lead Contact, Kathryn E. Wellen (wellenk@upenn.edu).
EXPERIMENTAL MODEL AND SUBJECT DETAILS
Mice and diets
All animal studies were carried out in accordance with the IACUC guidelines of the University of Pennsylvania. Adipocyte specific knock out (KO) of Acly (Adiponectin-Cre; Aclyf/f mice) were reported previously (Zhao et al., 2016), and were backcrossed at least 8 times to C57Bl6/J. Male and female mice were both used in experiments, as indicated in each study. Mice were weaned between 3-4 weeks of age, genotyped, and started on the indicated diets (chow, ZFD, HGI or LGI) diets between 4-5 weeks of age. The LGI and HGI diets were prepared by Envigo using Hi-Maize ® 260 resistant starch (LGI) and Amoica ® starch (HGI) starches provided by Ingredion Incorporated. Mice were group housed in a temperature controlled environment (22°C) on a 12h light/12h dark cycle. Mice were maintained on specified diets for the entirety of the study (16 weeks), after which they were sacrificed and tissues collected. Mice had ad libitum access to food and water and were monitored routinely for health status. Weight for each mouse was monitored throughout the study, and blood glucose in 6-hour fasted animals measured by glucometer at indicated time points. Two-way ANOVA analysis was performed to assess differences in body weight between genotypes.
Cells lines
Aclyf/f preadipocytes (5A cells) were previously reported (Carrer et al., 2017). Acly−/− pre-adipocytes were generated by infecting the 5A Aclyf/f cells with Adeno-Cre virus. Deletion was confirmed by western blotting.
Human Adipose Samples
Abdominal subcutaneous or omental adipose tissue biopsies were obtained from individuals undergoing surgery with informed consent obtained after the nature and possible consequences of the studies were explained under protocols approved by the Institutional Review Boards of the Perelman School of Medicine at the University of Pennsylvania. These samples were collected by the Human Metabolic Tissue Bank and provided in a de-identified manner for these studies. Patient data for the samples used are provided below.
| Subject # | Sex | Adipose Depot | Age | BMI |
| 3 | M | SQ | 37 | 53.16 |
| 3 | M | V | 37 | 53.16 |
| 24 | M | SQ | 38 | 53.81 |
| 24 | M | V | 38 | 53.81 |
| 42 | F | SQ | 34 | 44 |
| 42 | F | V | 34 | 44 |
| 139 | F | SQ | 43 | 62.92 |
| 139 | F | V | 43 | 62.92 |
| 143 | F | SQ | 51 | 37.57 |
| 143 | F | V | 51 | 37.57 |
| 146 | F | SQ | 38 | 46.48 |
| 146 | F | V | 38 | 46.48 |
| 172 | M | SQ | 45 | 60.6 |
| 172 | M | V | 45 | 60.6 |
| 181 | M | SQ | 50 | 39.04 |
| 181 | M | V | 50 | 39.04 |
| 189 | F | SQ | 39 | 46.15 |
| 189 | F | V | 39 | 46.15 |
| 204 | M | SQ | 37 | 43.58 |
| 204 | M | V | 37 | 43.58 |
METHOD DETAILS
Glucose tolerance test
Mice were individually housed, fasted overnight for 16 h and weighed to determine the amount of glucose needed for a 2.0 g/kg injection. D-glucose (Sigma Aldrich, G8270) solution for injection was prepared at concentration of 200 mg/ml in advance using sterilized water. The blood glucose each mouse was determined by glucometer at time 0 from the tail vein. 2.0 g/kg glucose was injected intraperitoneally into each mouse, staggering injections at 1 mouse per minute. Blood glucose was then measured at 15, 30, 60, 90, and 120 min after the initial glucose injection for each mouse.
Insulin tolerance test
Mice were individually housed overnight to allow acclimation and fasted for 4 h the morning of test. Each mouse was weighed and insulin dose (0.75 U/kg body weight) was calculated. Insulin was prepared at 0.1 U/ml in advance in PBS. Blood glucose for each mouse was measured at time 0 by glucometer from the tail vein. 0.75 IU/kg insulin solution was injected intraperitoneally of each mouse, staggering injections at 1 mouse per minute. Blood glucose was measured at 30, 60, and 120 min after insulin injection with glucometer.
Body Composition
Body composition was measured via NMR at the Mouse Phenotyping, Physiology and Metabolism Core at the University of Pennsylvania.
Serum Insulin and Leptin
Serum leptin and insulin levels were measured using mouse leptin 96-well plate assay (Millipore, EZML-82K) and the ultra-sensitive mouse insulin ELISA kit (Crystal Chemical, 90080) respectively, following manufacturers’ instructions.
Triglyceride Assay
Triglyceride levels in the liver were measured using the colorimetric 96-well plate assay (Cayman Chemical, Item # 10010303) following the manufactures’ instructions.
Histology
Tissue was fixed overnight in 10% formalin phosphate (Fisher Chemical, SF100). Liver, subcutaneous and perigonadal white adipose tissue samples was processed, embedded, and sectioned (5 μm) at the Pathology Core Laboratory at the Research Institute at Children’s Hospital of Philadelphia. Sections were stained with H&E and imaged using a light microscope.
cDNA Synthesis and Quantitative PCR
1 μg of mRNA was retrotranscribed using High Capacity RNA-to-cDNA (Applied Biosystems, 4387406). cDNA samples were diluted 1:20 and used as a template in Power SYBR Master Mix (ABI4367659), and DNA was amplified using the ViiA-7 real-time PCR system. All primers anneal at 60°C. Primer sequences used are listed Table S2.
Western Blots
Snap-frozen tissue (about 100 mg) was mechanically dissociated in RIPA buffer using TissueLyser (QIAGEN). Cultured cells were lysed in RIPA buffer. The lysates were sonicated at 30% duty cycle and an output control setting of 3– 4 as previously described (Carrer et al., 2017). The sonicated samples were pelleted for 5 min and 16,000 relative centrifugal force, and the supernatant was collected and quantified by BCA assay (Thermo Scientific). Samples were prepared for western blotting analysis through Invitrogen NuPAGE and BOLT gel systems.
Adipocyte Differentiation
5A cells were differentiated as previously described with a few modifications (Carrer et al., 2017). 5A Aclyf/f and Acly−/− cells were seeded at 2 × 10⁵ cells/well in 12-well plates in DMEM/F12 media with 10% heat inactivated fetal bovine serum (hiFBS). Culture medium was replaced with induction medium (DMEM/F12, 10% hiFBS, 0.05 mM isobutylmethylxanthine (IBMX), 10 μm dexamethasone, 5 μm troglitazone, 5 μg/ml insulin 4 days after seeding. 3 days after induction, Induction Medium was replaced with Maintenance Medium (DMEM/F12, 10% hiFBS, 5 μg/ml insulin).
Oil Red O
Cells (4 days after induction of differentiation) were washed in PBS then fixed in 4% paraformaldehyde at room temperature for 30 min. Cells were then washed 3 times in dH2O then washed once in 60% isopropanol. Cells were stained for 30 min in Oil Red O, incubating at 37°C. Stain was removed by washing with dH2O 4 times. Pictures of the wells were then taken. For quantification, cells were washed 3 times in 60% isopropanol, with gentle rocking in between washes. Oil Red O was extracted in 0.5 mL 100% Isopropanol. Absorbance was measured at 492 nm.
Histone Analysis
Cells were differentiated to day 3 and histones prepared by acid extraction, as previously described (Lee et al., 2014). Protein was quantified and histones analyzed by western blot.
RNA-sequencing
RNA was isolated using Trizol as per manufacturer instruction. RNA was then prepared for sequencing with the Illumina TruSeq Kit and the high sample protocol on the TruSeq stranded mRNA sample preparation guide. Sequencing was performed using the NextSeq 500/550 mid Output kit v2 (150 cycles).
Heatmap Analysis and Clustering
All genes that had a q-value < 0.05 and an average FPKM log2 Fold Change > 1.5 when comparing between any two conditions were included in the heatmap. Gene Cluster 3.0 (http://bonsai.hgc.jp/~mdehoon/software/cluster/cluster3.pdf) was used to cluster genes and Java Tree Viewer to generate the heatmap shown in Figure S2A. The log2 values for each gene were “centered” by subtracting the mean value for each gene across all samples. Genes and samples were then clustered using average linkage. Average linkage computes the “distance” between two genes or samples as the mean of all pairwise differences between all genes or samples contained in that item. The distance metric selected to compute the similarity between genes and samples was “correlation (uncentered).” Clustering and values were visualized using Java Tree Viewer.
GSEA
All genes satisfying the parameters described for heatmap inclusion were queried for enrichment against Hallmark gene sets using the Broad Institute molecular signatures database (MSigDB) gene set enrichment (GSEA) desktop application (Subramanian et al., 2005). The ChREBP gene set containing the top 1000 loci at which ChREBP was found by ChIP-seq to bind in WAT (Poungvarin et al., 2015) was kindly provided by the corresponding author Dr. L. Chan. The input file for GSEA contained the described genes along with FPKM values. GSEA permutation type was set to “Gene Set,” which is the setting recommended if there are less than 7 samples within each phenotype.
Venn Diagram Analysis
Adipogenesis induced genes were defined as genes that were increased in WT Ad versus WT Pre-Ad based on a log2 Fold change > 1.5 and q-value < 0.25. ACLY-dependent and ACLY-suppressed genes were defined as genes that were increased or decreased, respectively, in WT Adipocytes versus KO Adipocytes, based on log2 fold change > 1.5 and q value < 0.25.
YSI Metabolite Analysis
Cells were differentiated to day 4 as described above. Media was collected on day 0, day 2, and day 4 for analysis. Glucose and lactate measurements were compared to wells plated with no cells to calculate metabolic consumption, as previously described (Lee et al., 2014). Data were normalized to endpoint protein content.
Insulin Stimulation
5A Aclyf/f and Acly−/− cells were differentiated to day 4 and then serum starved overnight before being stimulated with insulin, at indicated doses. Cell media was replaced with fresh serum starve DMEM/F12 media containing insulin for 10 min and then lysed with RIPA buffer for analysis.
Metabolite quantification
Polar metabolites were quantified by mass spectrometry using the ion-pairing reversed-phase ultra-high performance liquid chromatography (IP-RP-UPLC)-MS method, as previously described (Guo et al., 2016). To compare pre and post differentiation, cells were harvested before addition of differentiation media (day 0) or at day 4 post-differentiation induction. For insulin stimulation, cells (day 3 post-differentiation) were serum starved overnight before stimulation with fresh DMEM F12 media (without serum) containing the indicated doses of insulin for 10 min. At harvest, dishes were placed on ice, medium was aspirated thoroughly, and cells were immediately scraped into 1 mL 80:20 methanol:water pre-chilled to −80°C. Samples were transferred to 1.5 mL tubes and equal amounts of internal standard mixture (see Key Resources Table) was added to every sample. Samples were pulse-sonicated for 20 0.5 s pulses with a probe tip sonicator and centrifuged at 17,000 × g at 4°C for 10 min. The supernatant was transferred to glass tubes and dried under nitrogen. All samples were resuspended in 100 μL of 5% w/v sulfosalicylic acid in water and 5 μL was injected by an Ultimate 3000 UHPLC system coupled to Orbitrap Q Exactive HF mass spectrometer (Thermo). Data were analyzed using XCalibur software (Thermo). Analyte AUC values were normalized to those of the appropriate internal standards. Analytes not matched to internal standards were normalized to the internal standard closest in retention time. In parallel to cell harvest, additional replicate dishes were trypsinized and total cell number and cell volume was determined by Coulter counter (Beckman-Coulter). Metabolite levels were normalized to total cell volume.
KEY RESOURCES TABLE
| REAGENT or RESOURCE | SOURCE | IDENTIFIER |
|---|---|---|
| Antibodies | ||
| p-AKT-S473 | Cell Signaling | S473-(D9E) XP Cat# 4060; RRID: AB_2315049 |
| AKT | Cell Signaling | Cat# 9272; RRID: AB_329827 |
| pS6 | Cell signaling | Cat#9205S; RRID: AB_330944 |
| S6 | Cell signaling | 5G10 Cat. No. 2217; RRID: AB_331355 |
| pACLY-S455 | Cell Signaling | Ser455 #4331; RRID: AB_2257987 |
| ACLY | ProteinTech | Cat. No. 15421-1-AP; RRID: AB_2223741 |
| ACSS2 | Cell Signaling | Cat#3658; RRID: AB_2222710 |
| FASN | Cell Signaling | Cat#3189; RRID: AB_2100798 |
| C/EBPβ | Santa Cruz | sc-150; RRID: AB_2260363 |
| PPARγ | Cell Signaling | Cat# 2430; RRID: AB_823599 |
| TUBA1A | Sigma Aldrich | T6199; RRID: AB_477583 |
| H3K9-ac | Active motif | Cat#61251; RRID: AB_2793569 |
| H3K27-ac | Abcam | Cat# Ab4729; RRID: AB_2118291 |
| H4K5-ac | Millipore | Cat# 07-327; RRID: AB_310523 |
| H4K8-ac | Millipore | Cat# 07-328; RRID: AB_11213282 |
| H4K12-ac | Active Motif | Cat# 39165; RRID: AB_2615075 |
| H3 | Millipore | Cat# 06-599; AB_2115283 |
| Biological Samples | ||
| Male and female subcutaneous and visceral adipose tissue samples | Penn DRC Human Adipose Resource | See table in Experimental Model and Subject Details |
| Adeno-CRE virus | University of Pennsylvania Vector Core | N/A |
| Chemicals, Peptides, and Recombinant Proteins | ||
| Aspartic Acid | Cambridge Isotope Labs | CNLM-544-H-PK |
| Glutamic Acid | Sigma-Aldrich | 607851 |
| Fumaric Acid | Cambridge Isotope Labs | CLM-1529-PK |
| Succinic Acid | Sigma-Aldrich | 491985 |
| Malonic Acid | TRC Canada | M158009 |
| Fructose 6-Phosphate | TRC Canada | F792577 |
| Citric Acid | Sigma-Aldrich | 606081 |
| Fructose 1,6-Bisphosphate | TRC Canada | F792571 |
| DMEM/F12 media | GIBCO | 11320-033 |
| 10% heat inactivated fetal bovine serum (hiFBS) | GIBCO | 10438-018 |
| 0.05 mM isobutymethylxanthine | Sigma-Aldrich | I-7018 |
| 10 μm dexamethasone (Sigma-Aldrich,), | Sigma-Aldrich | D-1881 |
| 5 μm troglitazone (Sigma-Aldrich,), | Sigma-Aldrich | T-2573 |
| 5 μg/ml insulin (Sigma-Aldrich,) | Sigma-Aldrich | I-5500 |
| Critical Commercial Assays | ||
| Mouse Leptin 96-Well Plate Assay | Millipore | EZML-82K |
| The Ultra-Sensitive Mouse Insulin ELISA kit | Crystal Chemical | Catalog #90080 |
| Triglyceride Colorimetric Assay Kit | Cayman Chemical | Item No 10010303 |
| Deposited Data | ||
| Acly f/f and Acly −/− preadipocytes & adipocytes RNA-seq | This study | GEO: GSE120504 |
| Experimental Models: Cell Lines | ||
| Acly f/f preadipocytes isolated from male mice | Carrer et al., 2017 | N/A |
| Experimental Models: Organisms/Strains | ||
| Aclyf/f and Adiponectin-Cre;Aclyf/f (AclyFAT−/−) mice | Zhao et al., 2016 | Aclyf/f and AclyFAT−/− |
| Oligonucleotides | ||
| Q-PCR Primers see Table S2 | N/A | N/A |
| Software and Algorithms | ||
| Microsoft Excel | Microsoft | Version 2016 |
| Prism | GraphPad Software | Version 7 |
| Adobe Illustrator | Adobe | Version 6 and CC |
| Microsoft Word | Microsoft | Version 2016 |
| Gene Cluster 3.0 | de Hoon et al., 2004 | Version 3.0 http://bonsai.hgc.jp/~mdehoon/software/cluster/ |
| Java TreeView | Saldanha, 2004 | http://jtreeview.sourceforge.net |
| GSEA | Subramanian et al., 2005 | http://software.broadinstitute.org/gsea/index.jsp |
| Mootha et al., 2003 | ||
| Other | ||
| 62% Sucrose Diet (No Fat) | Envigo | TD.0331 |
| Low Glycemic: 50% Hi-Maize Diet (Resistant) | Envigo | TD.06138 |
| High Glycemic: 50% Amioca Diet (Amylopectin) | Envigo | TD.06136 |
| Laboratory Autoclavable Rodent Diet 5010 | LabDiet | 0001326 |
Insulin Stimulation Glucose Uptake
Cells were serum starved O/N on day 4 of differentiation. The next day, cells were washed with warm Krebs Ringer HEPES (KRH) buffer (pH 7.4; 115mM NaCl, 5mM KCl, 1mM KH2PO4, 25mM HEPES, 1mM CaCl2) and then 100 nM insulin in KRH buffer was added to cells for 20 min. 50 nM cytochalasin B was added to some wells for the final 10 min of insulin stimulation. After 20 min of insulin stimulation, all wells were provided 1uCi 3H-2-deoxyglucose for 10 min. Cells were then washed twice with ice cold KRH Buffer. 500 μL of 0.1% SDS was added to collect cells. 400 μL of the cell suspension was added to scintillation vial for counting. Control cells were plated and differentiated to Day 4 then serum starved O/N and collected for protein quantification on Day 5.
2H2O administration to mice
7 days prior to termination, mice were I.P injected with 0.035 mls/g body weight 0.9% NaCl 2H2O and drinking water was replaced with 8% 2H2O enriched water. Mice were fasted for 6 h prior to plasma and tissue collection and samples were immediately snap frozen in liquid nitrogen.
Plasma 2H2O enrichment analysis
The 2H labeling of water from samples or standards was determined via deuterium acetone exchange. 5 μL of sample or standard was reacted with 4 μL of 10N NaOH and 4 μL of a 5% (v/v) solution of acetone in acetonitrile for 24 h. Acetone was extracted by the addition of 600 μL chloroform and 0.5 g Na2SO4 followed by vigorous mixing. 100 μL of the chloroform was then transferred to a GC/MS vial. Acetone was measured using an Agilent DB-35MS column (30 m 3 0.25 mm i.d. × 0.25 μm, Agilent J&W Scientific) installed in an Agilent 7890A gas chromatograph (GC) interfaced with an Agilent 5975C mass spectrometer (MS) with the following temperature program: 60°C initial, increase by 20°C/min to 100°C, increase by 50°C/min to 220°C, and hold for 1 min. The split ratio was 40:1 with a helium flow of 1 mL/min. Acetone eluted at approximately 1.5 min. The mass spectrometer was operated in the electron impact mode (70 eV). The mass ions 58 and 59 were integrated and the % M1 (m/z 59) calculated. Known standards were used to generate a standard curve and plasma % enrichment was determined from this. All samples were analyzed in triplicate.
In vivo de novo lipogenesis calculations
Calculation of the fraction of newly synthesized fatty acids (FNS) was based on the method described by Lee et al. (1994), where FNS is described by the following equation:
Where ME is the average number of deuterium atoms incorporated per molecule (ME = 1 × m1 + 2 × m2+3 × m3 …), p is the deuterium enrichment in water and n is the maximum number of hydrogen atoms from water incorporated per molecule. N was determined using the equation:
As described by Lee et al. (1994) where q is the fraction of hydrogen atoms and p + q = 1.The molar amount of newly synthesized fatty acids (MNS) was determined by: MNS = FNS × total fatty acid amount (nmoles/mg tissue).
QUANTIFICATION AND STATISTICAL ANALYSIS
Statistics
Specific statistical analysis and SEM specified in figure legends. Statistical comparisons were done using unpaired, two-tailed Student’s t test with equal variance, unless otherwise indicated. 2-way ANOVA was used for analysis of body weight differences between genotypes over time. GraphPad Prism was used for statistical analysis and graphing. Data considered significant are indicated as follows: *, p < 0.05; **, p < 0.01; ***, p < 0.001.
DATA AND SOFTWARE AVAILABILITY
The accession number for the RNA-sequencing data reported in this paper is GEO: GSE120504.
Supplementary Material
Highlights.
ACLY promotes glucose-induced ChREBP activation in white adipocytes
Sex impacts the ACLY-dependent storage of lipids in adipose tissue
Adipocyte ACLY deficiency results in insulin resistance in females
Female dependence on adipocyte ACLY is enhanced with a high-glycemic-index diet
ACKNOWLEDGMENTS
This work was supported by NIH grant R01DK116005 to K.E.W. and D.A.G., as well as American Diabetes Association Junior Faculty Award 7-12-JF-59, a Linda Pechenik Montague Investigator Award, NIH grant R01-CA174761, and NIH grant R01-CA228339 to K.E.W. C.M.M. acknowledges NIH grant R01-CA188652 and a Camille and Henry Dreyfus Teacher-Scholar Award. N.W.S. is supported by grant K22-ES026235, R03-HD092630, and instrumentation through P30-ES013508. S.F. and A.M.T. are supported by Penn-PORT IRACDA grant K12 GM081259. S.T. is supported by American Diabetes Association postdoctoral fellowship no. 1-18-PDF-144. S.Z. is supported by F99CA222741. H.C.A. is supported by 4K00CA212455-03. We thank Ingredion Incorporated for donating the HGI starch Amoica starch and LGI starch Hi-Maize 260 resistant starch used to prepare the HGI and LGI diets. We would like to thank Jessica Flowers from Envigo for discussion regarding the diets used in the study. We would like to acknowledge William Quinn and the MPPM core for the MRI body composition analysis. Human adipose tissue samples were provided by Julian Hernandez, Gary Korus, and Raymond Soccio of the Human Metabolic Tissue Bank at Penn’s Institute for Diabetes, Obesity, and Metabolism and Diabetes Research Center (P30-DK19525). We are grateful to Scott Appel of the Penn Biostatistics Analysis Center for statistical advice. We also thank Irfan Asangani for use of the Illumina NextSeq500 instrument and Dhruv Pant for data demultiplexing. We thank Sydney Campbell for help with the YSI metabolite analysis and Anthony Mancuso from the Quantitative Metabolomics Core for GC-MS analysis of palmitate labeling. We would like to thank Patrick Seale, Mark Herman, Paul M. Titchenell, and K.E.W. lab members for helpful discussions during the course of this study.
Footnotes
DECLARATION OF INTERESTS
C.M.M. is a consultant for Nimbus Therapeutics and Rheos Medicines.
SUPPLEMENTAL INFORMATION
Supplemental Information can be found online at https://doi.org/10.1016/j.celrep.2019.04.112.
REFERENCES
- Abdul-Wahed A, Guilmeau S, and Postic C (2017). Sweet sixteenth for ChREBP: established roles and future goals. Cell Metab. 26, 324–341. [DOI] [PubMed] [Google Scholar]
- Abel ED, Peroni O, Kim JK, Kim YB, Boss O, Hadro E, Minnemann T, Shulman GI, and Kahn BB (2001). Adipose-selective targeting of the GLUT4 gene impairs insulin action in muscle and liver. Nature 409, 729–733. [DOI] [PubMed] [Google Scholar]
- Campbell SL, and Wellen KE (2018). Metabolic signaling to the nucleus in cancer. Mol. Cell 71, 398–408. [DOI] [PubMed] [Google Scholar]
- Camporez JP, Jornayvaz FR, Lee HY, Kanda S, Guigni BA, Kahn M, Samuel VT, Carvalho CR, Petersen KF, Jurczak MJ, and Shulman GI (2013). Cellular mechanism by which estradiol protects female ovariectomized mice from high-fat diet-induced hepatic and muscle insulin resistance. Endocrinology 154, 1021–1028. [DOI] [PMC free article] [PubMed] [Google Scholar]
- Carrer A, Parris JL, Trefely S, Henry RA, Montgomery DC, Torres A, Viola JM, Kuo YM, Blair IA, Meier JL, et al. (2017). Impact of a high-fat diet on tissue Acyl-CoA and histone acetylation levels. J. Biol. Chem 292, 3312–3322. [DOI] [PMC free article] [PubMed] [Google Scholar]
- Choudhary C, Weinert BT, Nishida Y, Verdin E, and Mann M (2014). The growing landscape of lysine acetylation links metabolism and cell signalling. Nat. Rev. Mol. Cell Biol 15, 536–550. [DOI] [PubMed] [Google Scholar]
- Coate KC, and Huggins KW (2010). Consumption of a high glycemic index diet increases abdominal adiposity but does not influence adipose tissue pro-oxidant and antioxidant gene expression in C57BL/6 mice. Nutr. Res 30, 141–150. [DOI] [PubMed] [Google Scholar]
- Dalby MJ, Ross AW, Walker AW, and Morgan PJ (2017). Dietary uncoupling of gut microbiota and energy harvesting from obesity and glucose tolerance in mice. Cell Rep. 21, 1521–1533. [DOI] [PMC free article] [PubMed] [Google Scholar]
- de Hoon MJ, Imoto S, Nolan J, and Miyano S (2004). Open source clustering software. Bioinformatics 20, 1453–1454. [DOI] [PubMed] [Google Scholar]
- DeFronzo RA, Ferrannini E, Groop L, Henry RR, Herman WH, Holst JJ, Hu FB, Kahn CR, Raz I, Shulman GI, et al. (2015). Type 2 diabetes mellitus. Nat. Rev. Dis. Primers 1, 15019. [DOI] [PubMed] [Google Scholar]
- Dehghan M, Mente A, Zhang X, Swaminathan S, Li W, Mohan V, Iqbal R, Kumar R, Wentzel-Viljoen E, Rosengren A, et al. ; Prospective Urban Rural Epidemiology (PURE) study investigators (2017). Associations of fats and carbohydrate intake with cardiovascular disease and mortality in 18 countries from five continents (PURE): a prospective cohort study. Lancet 390, 2050–2062. [DOI] [PubMed] [Google Scholar]
- Edens NK, Fried SK, Kral JG, Hirsch J, and Leibel RL (1993). In vitro lipid synthesis in human adipose tissue from three abdominal sites. Am. J. Physiol 265, E374–E379. [DOI] [PubMed] [Google Scholar]
- Eissing L, Scherer T, Tödter K, Knippschild U, Greve JW, Buurman WA, Pinnschmidt HO, Rensen SS, Wolf AM, Bartelt A, et al. (2013). De novo lipogenesis in human fat and liver is linked to ChREBP-β and metabolic health. Nat. Commun 4, 1528. [DOI] [PMC free article] [PubMed] [Google Scholar]
- Fukuda H, Katsurada A, and Iritani N (1992). Effects of nutrients and hormones on gene expression of ATP citrate-lyase in rat liver. Eur. J. Biochem 209,217–222. [DOI] [PubMed] [Google Scholar]
- Garg A (2000). Gender differences in the prevalence of metabolic complications in familial partial lipodystrophy (Dunnigan variety). J. Clin. Endocrinol. Metab 85, 1776–1782. [DOI] [PubMed] [Google Scholar]
- Garland PB, Randle PJ, and Newsholme EA (1963). Citrate as an intermediary in the inhibition of phosphofructokinase in rat heart muscle by fatty acids, ketone bodies, pyruvate, diabetes, and starvation. Nature 200, 169–170. [DOI] [PubMed] [Google Scholar]
- González-Muniesa P, Mártinez-González MA, Hu FB, Després JP, Matsuzawa Y, Loos RJF, Moreno LA, Bray GA, and Martinez JA (2017). Obesity. Nat. Rev. Dis. Primers 3, 17034. [DOI] [PubMed] [Google Scholar]
- Grove KL, Fried SK, Greenberg AS, Xiao XQ, and Clegg DJ (2010). A microarray analysis of sexual dimorphism of adipose tissues in high-fat-diet-induced obese mice. Int. J. Obes 34, 989–1000. [DOI] [PMC free article] [PubMed] [Google Scholar]
- Guo L, Worth AJ, Mesaros C, Snyder NW, Glickson JD, and Blair IA (2016). Diisopropylethylamine/hexafluoroisopropanol-mediated ion-pairing ultra-high-performance liquid chromatography/mass spectrometry for phosphate and carboxylate metabolite analysis: utility for studying cellular metabolism. Rapid Commun. Mass Spectrom 30, 1835–1845. [DOI] [PMC free article] [PubMed] [Google Scholar]
- Haque WA, Oral EA, Dietz K, Bowcock AM, Agarwal AK, and Garg A (2003). Risk factors for diabetes in familial partial lipodystrophy, Dunnigan variety. Diabetes Care 26, 1350–1355. [DOI] [PubMed] [Google Scholar]
- Herman MA, Peroni OD, Villoria J, Schön MR, Abumrad NA, Blüher M, Klein S, and Kahn BB (2012).A novel ChREBP isoform in adipose tissue regulates systemic glucose metabolism. Nature 484, 333–338. [DOI] [PMC free article] [PubMed] [Google Scholar]
- Hers HG, and Van Schaftingen E (1982). Fructose 2,6-bisphosphate 2 years after its discovery. Biochem. J 206, 1–12. [DOI] [PMC free article] [PubMed] [Google Scholar]
- Hotamisligil GS (2017). Inflammation, metaflammation and immunometabolic disorders. Nature 542, 177–185. [DOI] [PubMed] [Google Scholar]
- Jia Y, Yee JK, Wang C, Nikolaenko L, Diaz-Arjonilla M, Cohen JN, French SW, Liu PY, Lue Y, Lee WP, and Swerdloff RS (2018). Testosterone protects high-fat/low-carbohydrate diet-induced nonalcoholic fatty liver disease in castrated male rats mainly via modulating endoplasmic reticulum stress. Am. J. Physiol. Endocrinol. Metab 314, E366–E376. [DOI] [PMC free article] [PubMed] [Google Scholar]
- Jiang L, Wang Q, Yu Y, Zhao F, Huang P, Zeng R, Qi RZ, Li W, and Liu Y (2009). Leptin contributes to the adaptive responses of mice to high-fat diet intake through suppressing the lipogenic pathway. PLoS ONE 4, e6884. [DOI] [PMC free article] [PubMed] [Google Scholar]
- Karastergiou K, and Fried SK (2017). Cellular mechanisms driving sex differences in adipose tissue biology and body shape in humans and mouse models. Adv. Exp. Med. Biol 1043, 29–51. [DOI] [PubMed] [Google Scholar]
- Lee WN, Bassilian S, Ajie HO, Schoeller DA, Edmond J, Bergner EA, and Byerley LO (1994). In vivo measurement of fatty acids and cholesterol synthesis using D2O and mass isotopomer analysis. Am. J. Physiol 266, E699–E708. [DOI] [PubMed] [Google Scholar]
- Lee JV, Carrer A, Shah S, Snyder NW, Wei S, Venneti S, Worth AJ, Yuan ZF, Lim HW, Liu S, et al. (2014). Akt-dependent metabolic reprogramming regulates tumor cell histone acetylation. Cell Metab. 20, 306–319. [DOI] [PMC free article] [PubMed] [Google Scholar]
- Link JC, and Reue K (2017). Genetic basis for sex differences in obesity and lipid metabolism. Annu. Rev. Nutr 37, 225–245. [DOI] [PMC free article] [PubMed] [Google Scholar]
- Macotela Y, Boucher J, Tran TT, and Kahn CR (2009). Sex and depot differences in adipocyte insulin sensitivity and glucose metabolism. Diabetes 58, 803–812. [DOI] [PMC free article] [PubMed] [Google Scholar]
- Mootha VK, Lindgren CM, Eriksson KF, Subramanian A, Sihag S, Lehar J, Puigserver P, Carlsson E, Ridderstråle M, Laurila E, et al. (2003). PGC-1alpha-responsive genes involved in oxidative phosphorylation are coordinately downregulated in human diabetes. Nat. Genet 34, 267–273. [DOI] [PubMed] [Google Scholar]
- Nikolaenko L, Jia Y, Wang C, Diaz-Arjonilla M, Yee JK, French SW, Liu PY, Laurel S, Chong C, Lee K, et al. (2014). Testosterone replacement ameliorates nonalcoholic fatty liver disease in castrated male rats. Endocrinology 155, 417–428. [DOI] [PMC free article] [PubMed] [Google Scholar]
- Pietrocola F, Galluzzi L, Bravo-San Pedro JM, Madeo F, and Kroemer G (2015). Acetyl coenzyme A: a central metabolite and second messenger. Cell Metab. 27,805–821. [DOI] [PubMed] [Google Scholar]
- Pinkosky SL, Groot PHE, Lalwani ND, and Steinberg GR (2017). Targeting ATP-citrate lyase in hyperlipidemia and metabolic disorders. Trends Mol. Med. 23, 1047–1063. [DOI] [PubMed] [Google Scholar]
- Poungvarin N, Chang B, Imamura M, Chen J, Moolsuwan K, Sae-Lee C, Li W, and Chan L (2015). Genome-wide analysis of ChREBP binding sites on male mouse liver and white adipose chromatin. Endocrinology 156,1982–1994. [DOI] [PMC free article] [PubMed] [Google Scholar]
- Ray KK, Bays HE, Catapano AL, Lalwani ND, Bloedon LT, Sterling LR, Robinson PL, and Ballantyne CM; CLEAR Harmony Trial (2019). Safety and efficacy of bempedoic acid to reduce LDL Cholesterol. N. Engl. J. Med 380, 1022–1032. [DOI] [PubMed] [Google Scholar]
- Saldanha AJ (2004). Java Treeview–extensible visualization of microarray data. Bioinformatics 20, 3246–3248. [DOI] [PubMed] [Google Scholar]
- Savage DB (2009). Mouse models of inherited lipodystrophy. Dis. Model. Mech 2, 554–562. [DOI] [PubMed] [Google Scholar]
- Senmaru T, Fukui M, Okada H, Mineoka Y, Yamazaki M, Tsujikawa M, Hasegawa G, Kitawaki J, Obayashi H, and Nakamura N (2013). Testosterone deficiency induces markedly decreased serum triglycerides, increased small dense LDL, and hepatic steatosis mediated by dysregulation of lipid assembly and secretion in mice fed a high-fat diet. Metabolism 62, 851–860. [DOI] [PubMed] [Google Scholar]
- Shepherd PR, Gnudi L, Tozzo E, Yang H, Leach F, and Kahn BB (1993). Adipose cell hyperplasia and enhanced glucose disposal in transgenic mice overexpressing GLUT4 selectively in adipose tissue. J. Biol. Chem 268, 22243–22246. [PubMed] [Google Scholar]
- Sivanand S, Viney I, and Wellen KE (2018). Spatiotemporal control of acetyl-CoA metabolism in chromatin regulation. Trends Biochem. Sci 43, 61–74. [DOI] [PMC free article] [PubMed] [Google Scholar]
- Subramanian A, Tamayo P, Mootha VK, Mukherjee S, Ebert BL, Gillette MA, Paulovich A, Pomeroy SL, Golub TR, Lander ES, and Mesirov JP (2005). Gene set enrichment analysis: a knowledge-based approach for interpreting genome-wide expression profiles. Proc. Natl. Acad. Sci. USA 102, 15545–15550. [DOI] [PMC free article] [PubMed] [Google Scholar]
- Tang Y, Wallace M, Sanchez-Gurmaches J, Hsiao WY, Li H, Lee PL, Vernia S, Metallo CM, and Guertin DA (2016). Adipose tissue mTORC2 regulates ChREBP-driven de novo lipogenesis and hepatic glucose metabolism. Nat. Commun. 7, 11365. [DOI] [PMC free article] [PubMed] [Google Scholar]
- Varlamov O, Bethea CL, and Roberts CT Jr. (2015). Sex-specific differences in lipid and glucose metabolism. Front. Endocrinol. (Lausanne) 5, 241. [DOI] [PMC free article] [PubMed] [Google Scholar]
- Vigouroux C, Magré J, Vantyghem MC, Bourut C, Lascols O, Shackleton S, Lloyd DJ, Guerci B, Padova G, Valensi P, et al. (2000). Lamin A/C gene: sex-determined expression of mutations in Dunnigan-type familial partial lipodystrophy and absence of coding mutations in congenital and acquired generalized lipoatrophy. Diabetes 49, 1958–1962. [DOI] [PubMed] [Google Scholar]
- Vijayakumar A, Aryal P, Wen J, Syed I, Vazirani RP, Moraes-Vieira PM, Camporez JP, Gallop MR, Perry RJ, Peroni OD, et al. (2017). Absence of carbohydrate response element binding protein in adipocytes causes systemic insulin resistance and impairs glucose transport. Cell Rep. 21, 1021–1035. [DOI] [PMC free article] [PubMed] [Google Scholar]
- Wallace M, Green CR, Roberts LS, Lee YM, McCarville JL, Sanchez-Gurmaches J, Meurs N, Gengatharan JM, Hover JD, Phillips SA, et al. (2018). Enzyme promiscuity drives branched-chain fatty acid synthesis in adipose tissues. Nat. Chem. Biol 14, 1021–1031. [DOI] [PMC free article] [PubMed] [Google Scholar]
- Wei J, Leit S, Kuai J, Therrien E, Rafi S, Harwood HJ Jr., DeLaBarre B, and Tong L (2019). An allosteric mechanism for potent inhibition of human ATP-citrate lyase. Nature 568, 566–570. [DOI] [PubMed] [Google Scholar]
- Wellen KE, Hatzivassiliou G, Sachdeva UM, Bui TV, Cross JR, and Thompson CB (2009). ATP-citrate lyase links cellular metabolism to histone acetylation. Science 324, 1076–1080. [DOI] [PMC free article] [PubMed] [Google Scholar]
- Yore MM, Syed I, Moraes-Vieira PM, Zhang T, Herman MA, Homan EA, Patel RT, Lee J, Chen S, Peroni OD, et al. (2014). Discovery of a class of endogenous mammalian lipids with anti-diabetic and anti-inflammatory effects. Cell 159, 318–332. [DOI] [PMC free article] [PubMed] [Google Scholar]
- Zhao S, Torres A, Henry RA, Trefely S, Wallace M, Lee JV, Carrer A, Sengupta A, Campbell SL, Kuo YM, et al. (2016). ATP-citrate lyase controls a glucose-to-acetate metabolic switch. Cell Rep. 17, 1037–1052. [DOI] [PMC free article] [PubMed] [Google Scholar]
Associated Data
This section collects any data citations, data availability statements, or supplementary materials included in this article.
Supplementary Materials
Data Availability Statement
The accession number for the RNA-sequencing data reported in this paper is GEO: GSE120504.