

Abstract
Voltage-gated sodium (Nav) channels play a central role in gastrointestinal physiology because they transmit depolarizing impulses in enteric neurons, thereby enabling the coordination of intestinal motility. However, little is known about the ion channel machinery that specifies firing pattern of enteric neurons. Here, we used in situ patch-clamp recording of myenteric neurons from mice to define functionally the Nav channel subtypes responsible for the electrical signature of myenteric neurons. We found that mouse myenteric neurons exhibit two types of tetrodotoxin-resistant Na+ currents: an early inactivating Na+ current (INaT) and a persistent Na+ current (INaP). INaT was encountered in all myenteric neurons, whereas INaP was preferentially found in Dogiel type II sensory neurons. Knock-out mouse studies, in combination with pharmacological assays, indicate that INaT is carried by the Scn5a-encoded “cardiac” Nav1.5, whereas INaP is attributed to the Scn11a-encoded Nav1.9. Current-clamp experiments show that Nav1.9 flows at subthreshold voltages, generating tonic firing. In addition, action potential (AP) clamp reveals that Nav1.5 contributes to the upstroke velocity of APs, whereas Nav1.9, which remains active during the falling phase, opposes AP repolarization. We developed a computational model of a Dogiel type II myenteric neuron that successfully reproduces all experimentally observed phenomena and highlights the differential roles of Nav1.5 and Nav1.9 in the control of excitability. Our data illustrate how excitability can be finely tuned to provide specific firing templates by the selective deployment of Nav1.5 and Nav1.9 isoforms. We propose that Nav-dependent ENS disorders of excitability may play important roles in the pathogenesis of digestive diseases.
Keywords: action potentials, enteric neurons, excitability, gastrointestinal disease, in situ patch clamp, sodium channels
Introduction
The enteric nervous system (ENS) extends the length of the gastrointestinal (GI) tract and regulates digestive functions including peristalsis, secretion, and detection of luminal stimuli (Grundy et al., 2006; Furness, 2012). The importance of the ENS is emphasized by the life-threatening consequences of certain ENS neuropathies, including Hirschsprung disease and Chagas disease. Alteration of the ENS also occurs in inflammatory bowel disease such as Crohn's disease or ulcerative colitis (Galligan, 2004; Furness, 2012).
The ENS can function reflexively without input from the CNS. It is organized in two major plexuses: the submucosal plexus, located between the mucosa and the circular muscle, and the myenteric plexus, located between the circular and longitudinal muscle layers (Grundy et al., 2006). Enteric neurons include intrinsic primary afferent neurons (IPANs) and a variety of interneurons and motor neurons (Kunze et al., 1995; Furness et al., 1998, 2004). The central elements in this network are IPANs, which have been characterized as sensory neurons that provide input to local intramural reflex loops to optimize gut function. Inflammation enhances excitability of IPANs (Palmer et al., 1998), which makes them major targets for drug therapies directed at gut disorders.
Sodium channels play a central role in GI physiology because they transmit depolarizing impulses in the ENS network. Previous studies have established that myenteric neurons from rat and guinea pig duodenum express a TTX-resistant (TTX-R) Na+ current, possibly carried by the Nav1.9 α-subunit (Rugiero et al., 2003; Padilla et al., 2007). A property that distinguishes the Nav1.9 channel from other isoforms is its propensity to generate a “persistent” Na+ current (Cummins et al., 1999; Dib-Hajj et al., 2002; Coste et al., 2004). The Nav1.9 channel is a target for inflammatory mediators and gut neurotransmitters (Baker et al., 2003; Rush and Waxman, 2004; Maingret et al., 2008; Copel et al., 2009) and contributes to somatic and visceral pain behaviors accompanying inflammation (Priest et al., 2005; Amaya et al., 2006; Leo et al., 2010; Lolignier et al., 2011). Recent findings also support a role for Nav1.9 in the regulation of gut neural reflexes, because mice lacking Nav1.9 show motility disturbances (Copel et al., 2013).
A major breakthrough was the development of patch-clamp recordings from intact myenteric ganglia in mice, opening the way for the use of transgenic mouse technology in the study of ENS physiology (Mao et al., 2006; Osorio and Delmas, 2010). Accordingly, in the present study, we made patch-clamp recordings from mouse myenteric neurons maintained in the longitudinal muscle myenteric plexus preparation (LMMP; Osorio and Delmas, 2010). We used a combination of electrophysiological characterization of myenteric neurons in mutant mice and computer modeling methods to determine Na+ channel contribution to enteric neurons' excitability. We demonstrate that Nav1.9 critically regulates excitability and action potential (AP) waveform of IPANs, making of Nav1.9 a key player at both subthreshold and above-threshold voltages. Moreover, we demonstrate that IPANs, motor neurons, and interneurons express the “cardiac” Nav1.5 channel. Nav1.5 contributes to the upstroke velocity of APs of enteric neurons, suggesting that this channel is crucial for impulse propagation through the ENS. Therefore, Nav1.9 and Nav1.5 serve different electrophysiological functions in mouse myenteric neurons and provide potential neuronal targets for modifying digestive function.
Materials and Methods
Animals.
Young male mice (2–4 months old) were used in this study. All animals were used in accordance with the European Community guidelines for the care and use of animals (86/609/EEC). WT mice (C57BL/6J, 2–4 months old) were purchased from Janvier. Nav1.9−/− mice were generated by GlaxoSmithKline and have been described previously (Maingret et al., 2008). Homozygous Nav1.9-null (Nav1.9−/−), heterozygous (Nav1.9+/−) and WT (Nav1.9+/+, C57BL/6J strain) mice were maintained and genotyped by PCR from tail biopsy samples. Mice colonies were genotyped by PCR from tail biopsy samples. PCR amplification of the WT Scn11a allele used the FW (5′-tgctttgtagatacgtcttcattgg-3′) and RW (5′-accatactgtgactagcattaatcctc-3′) primer pairs and resulted in a 490 bp amplicon. PCR amplification of the disrupted Scn11a allele used the FM (5′-aatgggctgaccgcttcctcgtg-3′) and RM (5′-caaagctggacaagactcagctatg-3′) primer pairs and yielded a 380 bp fragment product. Mice were killed by cervical dislocation and decapitation.
Preparation.
Experiments were performed on nondissociated myenteric neurons of mouse duodenum. The LMMP preparation of mouse duodenum has been detailed previously (Osorio and Delmas, 2010). In brief, a 2 cm segment of duodenum was removed from dead mice. The tissue was opened along the mesentery line and pinned mucosal side up on the silicon elastomer basis (Sylgard; Dow Corning) of a recording dish containing oxygenated standard Krebs' solution. The myenteric plexus was exposed by dissecting away the mucosa, the submucosal plexus, and the circular muscle layer. The recording dish was then placed on an inverted microscope stage and the LMMP preparation was continuously superfused with Krebs' solution gassed with 95% O2-5% CO2 (Fig. 1). The upper surface of a ganglion was exposed to 0.02% protease type XIV (Sigma) for 3–5 min and the surface of neurons was cleaned by sweeping over the ganglion with a hair fixed at the tip of a microelectrode.
Figure 1.

In situ patch clamping of mouse myenteric neurons. A, Schematic illustration of the recording chamber for patch clamping mouse myenteric neurons maintained in situ in the LMMP preparation. The LMMP is continuously superfused with gazed Krebs' solution to provide steady oxygenation of the tissue. A local superfusion device is positioned near the selected myenteric ganglion to ensure rapid application of drugs. B, Whole-mount mouse myenteric plexus labeled with an anti-peripherin antibody. Some ganglia (arrowheads) and connective bundles (arrows) of the myenteric plexus are indicated.
The standard Krebs' solution used to bath the LMMP preparation consisted of the following (in mm): 118 NaCl, 4.8 KCl, 1 NaH2PO4, 25 NaHCO3, 1.2 MgCl2, 2.5 CaCl2, and 11 glucose and was equilibrated with 95% O2-5% CO2, pH 7.4. Atropine (2 μm) and nicardipine (6 μm) were present throughout the experiments to prevent spontaneous muscle movement.
Whole-cell patch-clamp recordings from intact mouse myenteric ganglia.
Whole-cell patch-clamp recordings were conducted at room temperature (RT). Extracellular solutions containing drugs were locally applied via a gravity superfusion system directly onto the myenteric ganglion under study. The standard extracellular solution consisted of the following (in mm): 140 NaCl, 4 KCl, 2.5 CaCl2, 1 MgCl2, 10 HEPES, 11 glucose, and 0.5 CdCl2, pH 7.3. For recording of TTX-resistant Na+ currents, 4-AP (1 mm), TEA-Cl (5 mm), CsCl (2 mm), and TTX (300 nm) were added to the extracellular solution.
Patch pipettes were pulled from thick-walled borosilicate glass capillaries (Harvard Apparatus) and had a resistance of 2–3 MΩ. Intracellular solutions for voltage-clamp and current-clamp experiments are listed in Table 1. All recordings were made using an Axopatch 200B amplifier (Molecular Devices), low-pass filtered at 2 kHz, and digitized at 25 kHz. The series resistance measured in the whole-cell mode was 5–8 MΩ and was compensated by 70–80%. Transient and leakage currents were digitally subtracted using a standard P/6 protocol unless otherwise stated.
Table 1.
Composition of IM
| CsCl | CsF | KCl | KF | CaCl2 | EGTA | MgCl2 | NaCl | HEPES | |
|---|---|---|---|---|---|---|---|---|---|
| IM 1 | 140 | 0 | 0 | 0 | 1 | 2 | 2 | 4 | 10 |
| IM 2 | 110 | 30 | 0 | 0 | 1 | 2 | 2 | 4 | 10 |
| IM 3 | 0 | 0 | 110 | 30 | 1 | 2 | 2 | 4 | 10 |
Concentrations are expressed in mm. pH was adjusted to 7.4 with CsOH or KOH; ∼300 mOsm/L.
Data acquisition and analysis.
Data were analyzed using pCLAMP 9.2 (Molecular Devices) and PRISM 4.0 (GraphPad) software. The I–V curve was fitted by a modified Boltzmann function: I = Gmax(V − ENa)/(1 + exp(V0.5 − V)/k), where V is the test pulse potential, Gmax is the maximum conductance, V0.5 is the potential of half-maximum activation, and k is the steepness factor. Conductance-voltage curves were calculated from the peak current according to the equation GNa = INa/(V − ENa) where ENa is the reversal potential extrapolated from the I–V curve. The activation curve (G–V) was fitted using the Boltzmann function: G/Gmax = 1/[1 + exp(V0.5 − V/k)], where G/Gmax is the normalized conductance. Inactivation curves were constructed from normalized currents and fitted according to the Boltzmann function: I/Imax = 1/[1 + exp(V − V0.5/k)], where V is the conditioning pulse potential and V0.5 is the membrane potential at which half of the channels are inactivated. For the study of slow inactivation, which required long-lasting recordings, the measured INa was corrected for run-down (estimated periodically from a Vh of −120 mV). The concentration-inhibition curves for TTX were fitted with the Hill equation of the form Y = Ymax [TTX]nH/(IC50nH + [TTX]nH), where Y is the percentage inhibition (e.g., 100 × I/I[TTX] = 0.1 μm), IC50 the TTX concentration that produces half-maximal inhibition, and nH the Hill coefficient.
Results are presented as mean ± SEM and n represents the number of cells examined. When data were normally distributed (Shapiro–Wilk test), statistical differences between groups were tested using the two-tailed Student's t test (unless otherwise stated). p < 0.05 was considered significant.
Immunostaining of LMMP and confocal imaging.
The LMMP preparation was prepared as described in Preparation, above. Once achieved, the tissues were bathed in PBS containing 4% sucrose for 30 min and then incubated for at least 1 h in PBS plus 20% sucrose. LMMP preparations were transferred to SuperFrostPlus slides (Fisher Scientific), frozen, and stored at −80°C until processed. Slides with the LMMP preparation were thawed at RT, washed in PBS, and then incubated for 40 min at RT in blocking solution containing 3% BSA and 0.1% Triton X-100. Primary antibodies were diluted in blocking solution and applied to tissues to be incubated overnight at 4°C in sealed humidified chambers. Primary antibodies used and dilutions were as follows: anti-Nav1.9 L23, 1/100 (rabbit polyclonal; Padilla et al., 2007); anti-neurofilament-200, 1/400 (mouse monoclonal; Sigma); anti-peripherin 1/400 (mouse monoclonal; Millipore); and anti-HuC/D 1/400 (mouse monoclonal; Invitrogen). Donkey anti-rabbit and donkey anti-mouse secondary antibodies coupled to TRITC (Jackson ImmunoResearch) or Alexa Fluor 488 (Invitrogen) were used at 1/400 for visualization of the corresponding primary antibodies. The anti-Nav1.5 antibody was a gift from Dr PJ Mohler (Davis Heart and Lung Research Institute, the Ohio State University Wexner Medical Center, Columbus). Staining with the anti-Nav1.9 L23 antibody was abolished in myenteric plexus from Nav1.9−/− mice (data not shown; see also Padilla et al., 2007).
Slices were then washed three times for 15 min in PBS. Secondary antibodies were applied in 3% BSA-containing PBS for 40 min at RT in the dark. After six washes in PBS, sections were mounted in PBS 50% glycerol. Images were acquired using a TCS SP2 laser-scanning confocal microscope (Leica Microsystems), initially processed using LCS Lite Confocal Software (Leica), and later exported into Adobe Photoshop for final processing. No staining was detected in tissues incubated with the secondary antibodies alone.
Morphology of neurons was examined by intracellular dialysis of biocytin (0.2%) during whole-cell recording. After overnight fixation in PBS containing 4% paraformaldehyde, the tissue was cleared by two washes in DMSO followed by three changes of PBS. Visualization of biocytin was performed with streptavidin–Alexa Fluor 488 (1/100; Invitrogen) overnight at 4°C.
RT-PCR.
Total RNA was extracted from heart, DRGs, and LMMP preparation with Tri-Reagent (Sigma) according to the manufacturer's recommendation. Reverse transcription reactions with oligo(dT)20 primers were performed with the cloned AMV reverse transcriptase following the manufacturer's protocol (Invitrogen) using 3 μg of total RNA. PCR on reverse-transcribed cDNA was performed with specific primers to mouse TTX-R Nav channels. Nav1.5 primers were 5-for1 (5′-AAACACGGTTCGAGGAAGACAAGC) and 5-rev1 (5′-GGAGGTCTGCGGTGTTGGTCATG)m which give a PCR product of 380 or 220 bp, corresponding to the Nav1.5 or Nav1.5a isoforms, respectively (Kerr et al., 2004). Nav1.8 primers were SNS-for3 (5′-TGCCGGTTCCGTTGGCCCAAGGT) and SNS-rev3 (5′-GATCTCCTCTGGGTCCGGGCAGT), which give a PCR product of 490 bp (Kerr et al., 2004). Nav1.9 primers were m4+ (5′-GTCTTCAGCATGTTCATTATCTGC) and m8− (5′-CCACACATTATGAAGTCCTCGC) spanning exons 4–8, which give a PCR product of 550 bp.
Computer simulation of mouse myenteric neurons.
The myenteric neuron was represented by a single-compartment model containing the channels conducting passive leakage current Ileak and six voltage-gated currents described by Hodgkin-Huxley-type equations: three Nav currents (TTX-sensitive current INa-TTX and the TTX-resistant currents INav1.5 and INav1.9), the N-type calcium current (ICa-N), and two Kv currents (delayed rectifier IKdr-Kv1.1/1.2 and IKM-Kv7.2/7.3). The reversal potentials for the leakage, Ca2+, Na+, and K+ currents were, respectively, EL = −75 mV, ECa = +132 mV, ENa = +62 mV, and EK = −89 mV. A temperature factor in the equations for voltage-dependent kinetic variables below was Q10 = 3(t − 22.0)/10.0 (= 1 at temperature t = 22°C); Cm = 1 μF/cm2.
Simulations were performed using NEURON software (Carnevale and Hines, 2006). These provided numerical solution to the differential equation relating the current densities per unit membrane area and the transmembrane voltage E as follows:
 |
where Cm = 1 μF/cm2 is the membrane capacitance and Istim is the stimulating current generated by extrinsic source. The partial currents with corresponding parameters and equations for the activation/inactivation kinetic variables are listed below.
Passive leakage current (GL = 0.08 mS/cm2):
 |
TTX-sensitive sodium current (G̱Na−TTX = 4.7748 mS/cm2):
Activation variable m : dm/dt = (m∞ − m)/τm; τm = 1/(αm + βm); m∞ = αm · τm:
 |
Inactivation variable h : dh/dt = (h∞ − h)/τh; τh = 1/(αh + βh); h∞ = αh · τh:
Nav1.5 sodium current (G̱Na1.5 = 4.7748 mS/cm2):
Activation variable m : dm/dt = (m∞ − m)/τm; τm = 1/(αm + βm); m∞ = αm · τm:
 |
Inactivation variable h : dh/dt = (h∞ − h)/τh; τh = 1/(αh + βh); h∞ = αh · τh:
Nav1.9 sodium current (G̱Na−1.9 = 1.0 mS/cm2):
Activation variable m : dm/dt = (m∞ − m)/τm; τm = 1/(αm + βm); m∞ = αm · τm:
Fast inactivation variable h : dh/dt = (h∞ − h)/τh; τh = 1/(αh + βh); h∞ = αh · τh:
Slow inactivation variable s : ds/dt = (s∞ − s)/τs; τs = 1/(αs + βs)
The parameters of αs, βs, and s∞ were determined by applying the “Fitting/Parametrized Function” tool of NEURON to our experimental data.
N-type calcium current (GCa−N = 0.47 mS/cm2):
Activation variable m : dm/dt = (m∞ − m)/τm; τm = 1/(αm + βm); m∞ = αm · τm:
Inactivation variable h : dh/dt = (h∞ − h)/τh; τh = 1/(αh + βh); h∞ = αh · τh:
Delayed rectifier potassium current (G̱Kdr = 0.25 S/cm2):
 |
Activation variable n : dn/dt = (n∞ − n)/τn; n∞ = αn · τn;τn = 1/(αn + βn):
 |
IKM-Kv7 current (G̱KM = 0.03 S/cm2):
 |
Activation variable n : dn/dt = (n∞ − n)/τn; τn = 1/(αn + βn)
Stimuli were delivered in the current-clamp or dynamic voltage-clamp mode. In the latter case, the experimentally recorded AP waveforms were used as the command voltages.
Results
TTX-R Na+ currents define different types of myenteric neurons in mice
In situ patch-clamp recordings of mouse duodenal myenteric neurons were made from the LMMP preparation (Fig. 1; Osorio and Delmas, 2010). Almost all (n = 89/91, 97%) myenteric neurons from C57BL/6J mice expressed a large TTX-sensitive Na+ current with amplitude ranging from 2 to 4 nA. TTX-R Na+ currents were further isolated using TTX (300 nm) and Cd2+ (500 μm) in the extracellular solution to block TTX-sensitive Na+ and Ca2+currents, respectively. The properties of TTX-R Na+ currents were typically determined 11–13 min after achieving the whole-cell recording mode; that is, once dialysis of internal milieu (IM) had stabilized (IM2; Table 1).
In marked contrast to guinea pig duodenal myenteric neurons (Rugiero et al., 2003), nearly all (92%) duodenal mouse myenteric neurons (n = 74 of 81) exhibited TTX-R Na+ currents. However, two types of TTX-R Na+ currents could be encountered and distinguished by their voltage-dependent kinetics. Type 1 TTX-R Na+ current had rapid and complete inactivation (Fig. 2A,C). We refer to this current hereafter as INaT, which stands for transient TTX-R Na+ current. Analysis of the I–V relationship showed that INaT had a threshold for activation at ∼−45 mV and a half-potential of activation (V0.5) of −27.1 ± 1.0 mV. Mean INaT density measured at the peak was −16.4 ± 1.7 pA/pF (n = 20; Fig. 2F). Pure INaT was encountered in 34% (25 of 74) of mouse myenteric neurons having a mean membrane capacitance of 15.3 ± 0.8 pF (n = 25; Fig. 2E).
Figure 2.

Mouse myenteric neurons express two types of TTX-R Na+ currents. A, B, Representative recordings of TTX-R Na+ currents in two different mouse myenteric neurons expressing either pure INaT (A) or mixed Na+ currents constituted of INaP and INaT (B). TTX-R Na+ currents were evoked by 100 ms test pulses from a holding potential of −80 mV. Note the prominent persistent Na+ current component at relatively negative voltages in B. All currents were measured isochronally ∼11 min after breakthrough. C, D, I–V relationships for INaT (C) and mixed TTX-R Na+ currents (INaP + INaT; D). Current amplitudes were measured either at peak (filled circles) or isochronally at the end of voltage steps (I90ms, filled squares). I–V curves were fitted by a modified Boltzmann function of the form: I = Gmax(V − ENa)/(1 + exp(V0.5-V)/k). Fits yield V0.5 of −27.1 ± 1.0 mV (n = 5) and −36.7 ± 1.4 mV (n = 25) for INaT and INaP + INaT, respectively. Data points are mean ± SEM. E, Distribution of the membrane capacitance of cells expressing pure INaT or mixed TTX-R Na+ currents (INaP + INaT). Means ± SEM are indicated. F, Current density distribution of INaT and INaP + INaT. Currents were measured at peak. Means ± SEM are indicated.
A distinct TTX-R Na+ current (Type 2) was observed in the 66% of the remaining mouse myenteric neurons (n = 49 of 74; Fig. 2B,D). In these cells, a feature of Type 2 TTX-R Na+ current was its slow inactivation and prominent persistent component, which was detectable as a steady inward current at the end of the depolarizing voltage steps. Type 2 TTX-R Na+ current was dubbed INaP, which stands for persistent current. INaP activated at relatively negative potentials (∼−70 mV) had a V0.5 of −36.7 ± 1.4 mV (n = 25; Fig. 2D) and a mean density of −50.3 ± 3.6 pA/pF (n = 39; Fig. 2F).
A detailed exploration of step-evoked currents, however, showed that INaP-expressing cells also displayed a rapidly inactivating Na+ component, mostly manifest at relatively positive potentials (Fig. 2B). Therefore, these cells exhibited a mixed TTX-R Na+ current composed of a slowly inactivating/persistent component (INaP) and a rapidly inactivating component (INaT). The mean capacitance of myenteric neurons having mixed TTX-R Nav currents was 17.6 ± 0.8 pF (n = 48; Fig. 2E), indicating that these neurons displayed slightly larger cell bodies than those expressing only INaT (p < 0.05).
INaP and INaT distribute differentially in Dogiel type I and Dogiel type II neurons
Myenteric plexus comprises several types of neurons morphologically classified as Dogiel type I (unipolar motoneurons and interneurons with filamentous cell bodies) and Dogiel type II (pseudo-unipolar and multipolar “sensory” IPANs; Furness et al., 2004). Morphologies of neurons expressing the different types of TTX-R Na+ currents were revealed by biocytin-dye filling (n = 14; Fig. 3). Most of the neurons (80%) expressing only INaT possessed Dogiel type I morphology with filamentous somas and one single neurite (Fig. 3A,C). In contrast, TTX-R Na+ currents composed of INaP and INaT were preferentially (75%) encountered in neurons with Dogiel type II morphology; that is, with smooth oval somas and multiaxonal or pseudo-unipolar projections (Fig. 3B,D,E).
Figure 3.

Differential distribution of INaT and INaP in myenteric neurons. A, B, Top, Na+ current traces elicited by depolarizing voltage steps in myenteric neurons exhibiting either pure INaT (A) or mixed Na+ currents composed of INaP and INaT (B). Whole-cell recordings were made with intracellular biocytin (0.2%) added to the patch pipette solution for further morphological characterization. Bottom, Morphology of neurons revealed using streptavidin–Alexa Fluor 488. Note that the neuron expressing only INaT (A) has a Dogiel type I morphology with a single long axon, whereas the neuron with prominent INaP has a Dogiel type II morphology with multiple and ramified axons (B). C, D, Examples of morphologies of myenteric neurons with pure INaT (C) or mixed Na+ current (INaP and INaT; D). E, Percentage of cells with Dogiel type I and Dogiel type II morphologies expressing either INaT or INaP + INaT.
Nav1.5 and Nav1.9, but not Nav1.8, transcripts are expressed in mouse myenteric plexus
We determined which genes encoding TTX-R Na+ channel α-subunits are expressed in the myenteric plexus from mouse duodenum. We first investigated the presence of Nav1.5 transcripts in mouse LMMP using an assay that uses primers spanning exons 16–18 of mouse Nav1.5, which allowed amplification of full-length Nav1.5 and the alternatively spliced Nav1.5a with a deletion of 159 bp equivalent to exon 18. The amplified fragments span multiple exon-intron boundaries so that the amplicons cannot be mistaken for amplified genomic sequence. As a test of primers and reactions, PCR amplification was also run from mouse heart mRNA. RT-PCR from mouse LMMP preparations revealed the smaller Nav1.5a isoform (220 bp), whereas both Nav1.5 transcripts were found in heart (Fig. 4A). Because LMMP preparations contained smooth muscle cells known to express Nav1.5 and Nav1.5a, we cannot make a conclusion about the expression of Nav1.5 transcripts in myenteric neurons. Therefore, we stained LMMP preparations with an anti-mNav1.5 antibody that labels intercalated disks, t-tubular membrane and Z-lines of cardiomyocytes in longitudinal sections of ventricular muscle (data not shown). Somas of myenteric neurons and most fibers passing through the ganglion were immunoreactive for the anti-Nav1.5 antibody (Fig. 4B).
Figure 4.
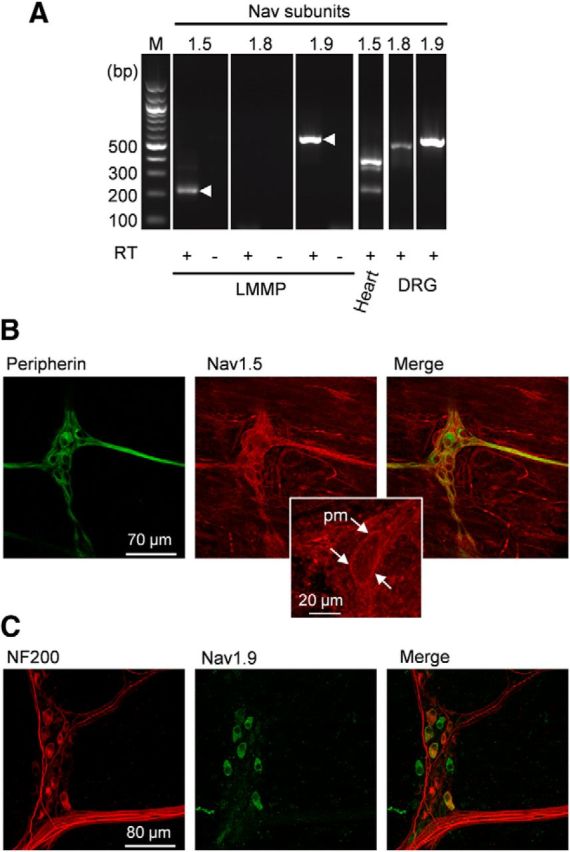
Nav1.5 and Nav1.9, but not Nav1.8, are expressed in mouse myenteric plexus. A, RT-PCR reveals transcripts for Nav1.9 and Nav1.5. cDNAs isolated from mouse LMMP, heart, and DRGs were amplified using primers to mouse Nav1.5, Nav1.8, and Nav1.9. Products of the expected sizes for Nav1.5a (220 bp) and Nav1.9 (550 bp) cDNAs were amplified from the LMMP preparation. Amplification of reverse-transcribed RNA from mouse heart and DRGs was used as a positive control. As expected, Nav1.5 (380bp) and Nav1.5a amplicons were present in heart and Nav1.8 (480 bp) and Nav1.9 amplicons were detected in DRGs. Contamination from genomic DNA was routinely tested by omitting the reverse transcriptase in the templates (RT−). M, 100 bp-ladder DNA size standard. B, The LMMP preparation was double-labeled with peripherin (green) and anti-Nav1.5 (red) antibodies. Images are projections of 59 consecutive optical sections spanning 6 μm. Middle, inset, Expanded view of a myenteric neuron with Nav1.5 plasma membrane (pm) labeling. C, The LMMP preparation was double-labeled with anti-NF200 (red) and anti-Nav1.9 (green) antibodies. Images are projections of 41 consecutive optical sections spanning 8 μm.
RT-PCR on LMMP preparations from mouse duodenum revealed mRNA for Nav1.9 but not Nav1.8, although both transcripts were amplified from mouse DRGs (Fig. 4A). We have sought evidence for the expression of Nav1.9 subunit protein using a specific polyclonal antibody raised against the II-III intracellular linker of mouse Nav1.9 (Padilla et al., 2007). Immunolabeling was done on nonfixed, frozen tissues. Immunoreactivity for Nav1.9 was detected in 28% of neurons (27 of 97) present in myenteric ganglia as estimated from the Hu-positive population. Nav1.9 labeling was mainly restricted to the soma of myenteric neurons. Measures of cell bodies gave averaged long axis of 24 ± 1 μm and short axis of 13 ± 1 μm versus 17 ± 1 μm and 10 ± 1 μm for Nav1.9-negative cells, respectively. Eighteen of 27 Nav1.9-positive somas of myenteric neurons were found to be immunoreactive for NF200 (Fig. 4C).
Properties of TTX-R Na+ currents in Nav1.8−/− and Nav1.9−/− mouse myenteric neurons
We pursued the molecular identity of TTX-R Na+ currents by recording from mice in which the Scn11a gene coding for the Nav1.9 α subunit had been inactivated (Maingret et al., 2008; Lolignier et al., 2011). Using CsF/CsCl-containing IM2 and TTX (0.3 μm) in the bath, we compared the amplitude and occurrence of INaT and INaP in KO mice and their WT littermates. INaP was undetectable in 26 of 26 myenteric neurons recorded from Nav1.9−/− mice (Fig. 5A,B). INaP density (I90ms) measured at −40 mV in WT neurons averaged −9.3 ± 1.7 pA/pF (n = 19), whereas it could not be discriminated against noise in Nav1.9−/− neurons (−0.2 ± 0.1 pA/pF, 15.5 ± 1 pF, n = 25; p < 0.001; Fig. 5B). Therefore, only INaT was observed in Nav1.9−/− myenteric neurons, yielding isolation of pure INaT in otherwise Nav1.9-expressing neurons (Fig. 5C,D). INaT was found in 92% (23 of 25) of myenteric neurons from Nav1.9−/− mice. In agreement with the lack of Nav1.8 transcripts in the mouse LMMP preparation, no significant changes in either INaT or INaP properties could be seen in myenteric neurons from Nav1.8−/− mice (data not shown). Therefore, these data identify the molecular basis of INaP as Nav1.9 channels, whereas INaT, which is present in myenteric neurons genetically deprived of Nav1.9 subunits, may be carried by Nav1.5 subunits.
Figure 5.

Lack of INaP in Scna11-deficient mouse myenteric plexus. A, TTX-R Na+ currents recorded from WT and Nav1.9−/− mouse myenteric neurons. Current traces were evoked at −40 mV and −20 mV from a holding potential of −80 mV. B, Scatterplot showing the amplitude of the peak (INaPeak, circle, test pulse to −20 mV) and persistent (I90ms, squares, test pulse to −40 mV) components of the TTX-R Na+ currents. INaPeak density averaged −43.7 ± 4.8 pA/pF in WT myenteric neurons (n = 19) and −20.2 ± 2.3 pA/pF in Nav1.9−/− myenteric neurons (n = 25). The persistent I90ms component averaged −9.2 ± 1.7 pA/pF in WT myenteric neurons (n = 19) and −0.1 ± 0.1 pA/pF in Nav1.9−/− myenteric neurons (n = 25). Open symbols represent individual values and bars indicate the mean amplitude ± SEM. ***p < 0.001. C, Families of current traces elicited in a Dogiel type II Nav1.9−/− myenteric neuron evoked by 100 ms depolarizing voltage steps from −55 to 0 mV in 5 mV increments from a holding potential of −80 mV. Inset, Current trace expanded to highlight the rapid kinetics of inactivation. D, I–V relationships for INaPeak (circles) and I90ms (squares) recorded in WT (filled symbols) and Nav1.9−/− (open symbols) mouse myenteric neurons. Data points represent mean amplitude ± SEM for 25 (WT) and 7 (Nav1.9−/−) cells.
INaT displays biophysical and pharmacological attributes of Nav1.5
We studied INaT in Nav1.9−/− myenteric neurons in the presence of 300 nm TTX to help assign it to its cloned counterpart. The voltage dependence of activation was measured by plotting the normalized conductance against membrane potential and fitting the activation curve with Boltzmann equation (Fig. 6A). The membrane potential at half-maximal activation (V0.5) was −30.1 ± 0.4 mV and the steepness factor (k) of the curve was 5.4 ± 0.4 mV (n = 7). The voltage dependence of the fast inactivation was investigated by holding the cells at prepulse potentials between −100 and 0 mV before stepping to the test potential (typically −10 mV; Fig. 6A, inset). Preconditioning pulses (100 ms) were used to promote entry of Na+ channels into fast inactivation. Data fitted to a single Boltzmann function gave a midpoint of fast inactivation of −44.9 ± 0.5 mV and a steepness factor of 6.4 ± 0.4 mV (n = 10). To determine the extent of slow inactivation, entry into slow inactivated states was promoted by long depolarizations (60 s) followed by a 50 ms-step to −100 mV, during which time recovery from fast inactivation is achieved (recovery time constant from fast inactivation, τ = 4.8 ± 0.8 ms at −100 mV, n = 8, data not shown; Fig. 6A, inset). INaT amplitude evoked at −10 mV after conditioning voltage pulses was thus inversely related to the number of channels accumulated in the slow inactivated state. The normalized available INaT was plotted against conditioning potential and could be fitted by a Boltzmann function with midpoint of −72.8 ± 1.9 mV and slope factor of 8 ± 2 mV (n = 5–9; Fig. 6A).
Figure 6.

INaT in Nav1.9−/− myenteric neurons shows properties of Nav1.5. A, Normalized peak currents (I/Imax, circles) and relative conductance (G/Gmax, diamonds) of INaT in Nav1.9−/− myenteric neurons were plotted against membrane potential and fitted to single Boltzmann functions. V0.5 for activation was −30.1 ± 0.4 mV (n = 7). V0.5 for fast and slow inactivations were −44.9 ± 0.5 mV (n = 10) and −72.8 ± 1.9 mV (n = 5–9), respectively. Right insets, Protocols for fast and slow inactivations. Fast inactivation of Na+ currents was obtained using a 100 ms conditioning voltage pulse immediately followed by a 100 ms test pulse to −10 mV. The conditioning voltage was varied from −100 to −10 mV. For slow inactivation, the cell was held at different conditioning potentials for 1 min and stimulated by a test sequence comprising a 50 ms step to −100 mV (to allow recovery from fast inactivation) and a 100 ms test pulse to −10 mV. B, INaT recorded in a Nav1.9−/− mouse myenteric neuron during application of increasing concentrations of TTX (0.1–30 μm). Na+ currents were evoked every 5 s by applying 100 ms voltage steps to −10 mV. C, Dose–response analysis of TTX inhibition of INaT recorded either in Nav1.9−/− myenteric neurons (filled circles) or in WT myenteric neurons (open circles). The Hill equation was used to fit data and yielded IC50 values of 4.1 ± 1.1 μm (n = 5–10) and 4.9 ± 1 μm (n = 9–13), respectively.
The biophysical properties of INaT are reminiscent of those of the Nav1.5 current in cardiac cells. Nav1.5 is known to be inhibited by TTX with an IC50 of ∼5 μm (Brown et al., 1981; Renganathan et al., 2002), which is 40- to 50-fold lower than the IC50 for Nav1.8 and Nav1.9 channels (Coste et al., 2007). We therefore investigated the sensitivity of INaT to TTX in Nav1.9−/− myenteric neurons. INaT evoked at −10 mV was inhibited by increasing concentrations of TTX, giving an IC50 of 4.1 ± 1.1 μm (n = 5–10; Fig. 6B,C). We confirmed that TTX block of INaT was comparable in WT myenteric neurons (Fig. 6C). The calculated IC50 was indistinguishable from that in Nav1.9−/− myenteric neurons, with a mean value of 4.9 ± 1 μm (n = 9–13). Altogether, our results suggest that INaT in mouse myenteric neurons is mediated by the “cardiac” Nav1.5 α-subunit.
Nav1.9-null myenteric neurons have altered firing pattern
To gain information about the contribution of Nav1.9 to the excitability of mouse myenteric neurons, we performed a series of current-clamp experiments from WT and Nav1.9−/− mice using KF/KCl-based intracellular solution (IM3) and no TTX added. In a first set of experiments, we compared AP waveforms using brief depolarizing current injections from resting potential. Figure 7A shows superimposed representative APs obtained from WT and Na1.9−/− myenteric neurons. AP threshold and overshoot were indistinguishable in WT and Nav1.9−/− neurons (Table 2). In addition, the current required to reach firing threshold (rheobase) was not significantly different in WT and Na1.9−/− myenteric neurons (9.4 ± 1.7 vs 10.0 ± 1.13 pA/pF, respectively; Table 2). However, AP half-width was significantly reduced in Nav1.9−/− myenteric neurons (1.09 ± 0.09 ms) compared with that of WT neurons (1.59 ± 0.07 ms; Fig. 7B, Table 2). Moreover, a significant enhancement of the postspike fast AHP was characteristically observed in Nav1.9−/− compared with WT myenteric neurons (Fig. 7A, Table 2). When considering the most negative potential that followed the spike in response to the minimum injected current that evoked AP, fast AHP amplitude was at −67.3 ± 2.1 mV in WT myenteric neurons versus −80.6 ± 2.6 mV in Nav1.9−/− myenteric neurons (Fig. 7B, Table 2).
Figure 7.

Scn11a gene inactivation shortens AP duration and impairs firing discharge. A, Superimposed APs from WT (black line) and Nav1.9−/− (gray line) myenteric neurons. AP parameters were measured as indicated and the values are reported in Table 2. Fast AHP (fAHP) amplitude was measured as the difference between the most negative potential attained on spike repolarization and the resting potential. B, AP half-width (hW) and fAHP amplitude recorded in myenteric neurons from WT mice (hW: 1.59 ± 0.07 ms, n = 17 and fAHP: −11.1 ± 2.1 mV, n = 11) and Nav1.9−/− mice (hW: 1.09 ± 0.09 ms, n = 10 and fAHP: −4.1 ± 2.3 mV, n = 9). Open circles indicate individual values and bars indicate the mean amplitude ± SEM. ***p < 0.001. C, Representative firing responses of myenteric neurons from WT (top traces) and Nav1.9−/− (bottom traces) mice to current injections (10 pA step increments). D, Firing rate plotted against current intensity for 11 WT myenteric neurons (top) and 10 Nav1.9−/− myenteric neurons (bottom).
Table 2.
Intrinsic membrane properties and AP characteristics measured in WT and Nav1.9−/− mouse myenteric neurons
| WT mice |
Nav1.9−/− mice |
p | |||
|---|---|---|---|---|---|
| Mean ± SEM | n | Mean ± SEM | n | ||
| Membrane capacitance (pF) | 14.5 ± 1.3 | 17 | 13.2 ± 1.8 | 10 | 0.55 |
| Input resistance (MΩ) | 576 ± 40 | 17 | 675 ± 75 | 10 | 0.21 |
| Holding membrane potential (mV) | −78.2 ± 0.9 | 17 | −75.7 ± 1.9 | 10 | 0.18 |
| Holding current (pA) | −71 ± 17 | 17 | −78 ± 12 | 10 | 0.73 |
| Current threshold (pA/pF) | 9.4 ± 1.7 | 9 | 10.0 ± 1.1 | 10 | 0.76 |
| AP threshold (mV) | −24.9 ± 1.1 | 17 | −22.1 ± 1.1 | 10 | 0.11 |
| AP overshoot (mV) | 44.6 ± 5 | 17 | 38.6 ± 4.8 | 10 | 0.43 |
| AP half-width (ms) | 1.59 ± 0.07 | 17 | 1.09 ± 0.09 | 10 | 0.0001 |
| AHP amplitude (mV) | −11.1 ± 2.1 | 11 | 4.1 ± 2.3 | 9 | 0.0009 |
Statistical comparisons were made applying the Student's t test for unpaired data.
In a second set of experiments, we examined the ability of myenteric neurons to fire APs in response to long duration depolarizing current injection (500 ms). Figure 7C shows representative examples of firing patterns in response to increasing amounts of injected current in WT and Nav1.9−/− myenteric neurons. WT myenteric neurons fired either tonically (8 of 11) or phasically (3 of 11). Almost no tonically active myenteric neurons were observed in Nav1.9−/− mice (Fig. 7C,D). On average, there was a 3- to 5-fold decrease in the gain of the frequency–stimulation relationships in Nav1.9−/− myenteric neurons compared with WT neurons. It is therefore concluded that Nav1.9 tunes the AP waveform and provides a depolarizing drive in mouse myenteric neurons.
AP clamp reveals differential contribution of Nav1.5 and Nav1.9 in AP upstroke and repolarization
The contribution of Nav1.5 and Nav1.9 currents to the AP was investigated using the AP clamp technique, in which the cell is voltage clamped using a previously recorded AP waveform as the command voltage. We first recorded a single AP in a Dogiel type II myenteric neuron by using short (5 ms) current injection to generate APs free of the effect of the injected current. We then used the AP waveform as a voltage command in neurons in which TTX-R Na+ currents have been pharmacologically isolated (IM2 and external TTX and Cd2+). Figure 8 illustrates the TTX-R Na+ current flowing during the prerecorded AP in a neuron in which only Nav1.5 was present (blue trace) and in a neuron in which both Nav1.5 and Nav1.9 were manifest (red trace). INaT activated during the AP upstroke of the AP. In contrast, INaP (Nav1.9) made little contribution to the rising phase of the AP because its activation kinetics were slower than those of Nav1.5 channels (n = 5). Nav1.9 channels typically begin to be activated below the threshold of AP and are largest during the falling phase, when channels have been opened and the driving force on sodium increases. We confirmed that the inward current flowing during the prerecorded AP was entirely carried by Na+ ions because it was abolished by substitution of external Na+ by sucrose ([Na+]o = 0 mm, Fig. 8, black trace).
Figure 8.
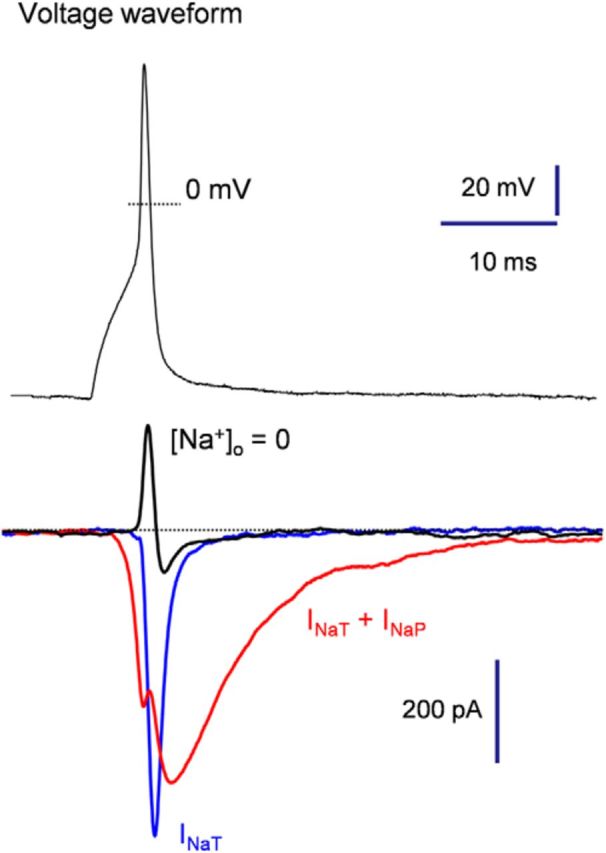
AP clamp reveals differential activation of Nav1.5 and Nav1.9 during AP. Myenteric neurons expressing either INaP and INaT (red trace) or only INaT (blue trace). Neurons were subjected to the AP voltage command for recording of spike-elicited sodium currents. A substantial fraction of INaP (Nav1.9) was activated during membrane repolarization, whereas INaT (Nav1.5) flowed essentially during the upstroke. Note that all inward currents were abolished by iso-osmotic substitution of Na+ by sucrose ([Na+]o = 0, black trace).
Investigation of Nav1.5 and Nav1.9 functions using a virtual mouse myenteric neuron
To gain further insight into the membrane dynamics responsible for AP, we ran computational simulations of mouse myenteric neurons. We developed a single-compartment model of a Dogiel-type 2 mouse myenteric neuron based on our experimental data. In doing so, we can make experimentally testable predictions that are specific to the Na+ channel subtypes in myenteric neurons and define the role for each subtype in AP. The passive properties used for the model were chosen to approximate the input resistance and membrane time constant observed experimentally (see Materials and Methods). The model incorporates accurate representations of conductances identified in mouse myenteric neurons, including the leak conductance, the TTX-S Na+ conductance, the Nav1.5 conductance, the Nav1.9 conductance, the N-type Ca2+ conductance, the voltage-gated outwardly rectifying K+ conductance (IKDr), and the KCNQ-like K+ conductance (IKM; unpublished data). The natural AP was then used as voltage-clamp command in the simulated neuron to study specific channel function in AP electrogenesis. Dynamic voltage-clamp mode in Figure 9A shows that Na+ entry through Nav1.5 channels constituted the main fraction of the total Na+ influx during the abrupt initial rising phase of the AP. The Nav1.9 current rather flowed at subthreshold voltages, which speeds the approach to threshold and thereby influences the spike rate and pattern of firing. This Nav1.9 current activates with a voltage dependence (e-fold for 5–7 mV) that is as steep as the voltage dependence of activation of Nav1.5, but with a midpoint ∼20 mV below that of Nav1.5. By producing a regenerative depolarizing current in the voltage range between the resting potential and spike threshold, the Nav1.9 current has a major role in determining the pattern of firing of enteric neurons. The model also established that the contribution of Nav1.9 channels was typically greatest in the later stages of the AP repolarization phase (Fig. 9A). Because of this persistent Nav1.9-dependent Na+ current flowing during the AP falling phase, blocking Nav1.9 channels resulted in a shortening of the simulated AP, which is expected from a reduced entry of positively charged ions (Fig. 9B). This trend is consistent with experimental recordings in which Nav1.9 opposes repolarization at the end of the spike. Therefore, the model reproduces a range of experimentally observed phenomena and supports the view that Nav1.5 and Nav1.9 have distinct functions in myenteric neuron AP electrogenesis.
Figure 9.
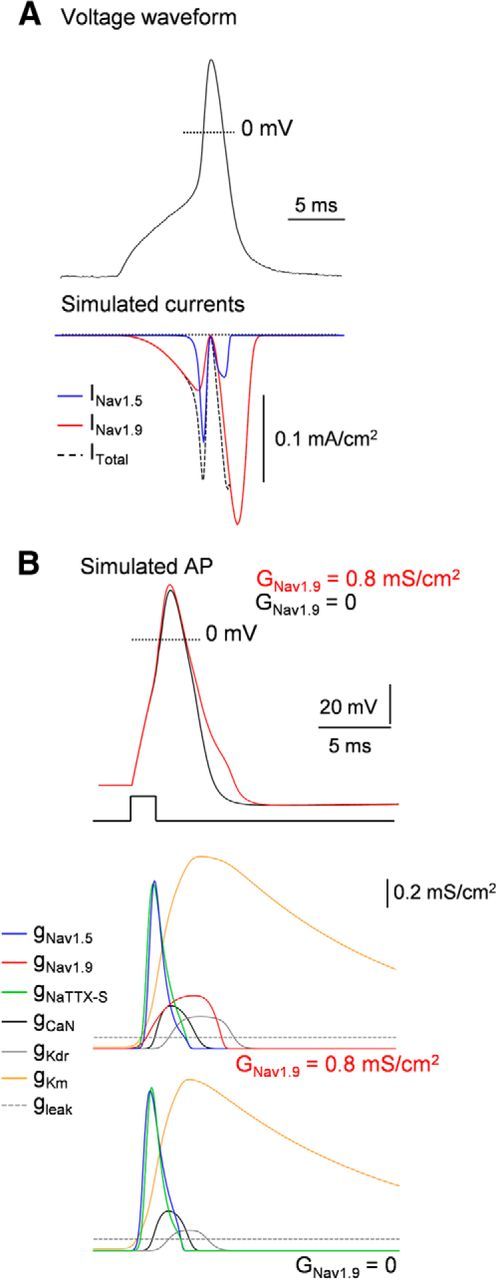
Dissection of AP electrogenesis using computer simulation of Dogiel type II neurons. A, Nav1.5 and Nav1.9 currents evoked in a computational model of a Dogiel type II neuron by a prerecorded AP waveform (top). Sodium current through Nav1.5 flows during the upstroke and reaches a maximum shortly before the peak of the AP. Nav1.9 current was present at subthreshold voltages. This is followed by a massive second phase of Na+ entry on the downstroke, reflecting the increase in driving force during repolarization while Nav1.9 channels remain open. B, Dynamic clamp test in a simulated Dogiel type II neuron containing gNav1.5, gNav1.9, gNaTTX-S, gCaN, gKDr, gKM, and gleak. Top, APs are elicited by injection of a 2 ms depolarizing current step with maximum Nav1.9 conductivity (GNav1.9) of = 0.8 mS/cm2 (red line) or 0 mS/cm2 (black line). Bottom, Conductivity transients for the partial conductances during the APs. Note that gNav1.5 maximally activates during the abrupt initial rising phase of the AP, similarly to gNaTTX-S. In contrast, gNav1.9 reaches a maximum during the falling phase of the AP. Its termination is due to deactivation of channels that are not still inactivated as the falling phase progresses. Note that activation of gNav1.9 alters the repolarizing phase of the AP.
Discussion
Our work offers a detailed understanding of how the expression of particular Na+ channel isoforms underlies the diverse firing behaviors of myenteric neurons. Mouse myenteric neurons express two TTX-R Na+ currents with different biophysical signatures. This collection of Nav channels allows myenteric neurons to encode specific information by generating APs with different shapes, frequencies, and patterns.
Two types of TTX-R Na+ currents are expressed in mouse myenteric neurons
The development of patch-clamp methodology applied to whole-mount myenteric plexus preparations of transgenic mice left us well poised for the characterization of individual ion channels that regulate excitability of myenteric neurons. We defined the properties and distribution of TTX-R Na+ currents in mouse myenteric neurons in an intact ENS using whole-cell patch-clamp recording. Our work has led to the identification of two types of TTX-R Na+ currents that distribute differentially in duodenal myenteric neurons. Using mice with a disrupted Scn11a gene, we unambiguously identified INaP as being mediated by the Nav1.9 subunit. INaP had relatively negative activation threshold and persistent kinetics at negative test potentials, which is consistent with the properties of Nav1.9 previously characterized in mouse nociceptors (Dib-Hajj et al., 2002; Coste et al., 2004; Maingret et al., 2008) and guinea-pig myenteric neurons (Rugiero et al., 2003). INaP/Nav1.9 was detected in all Dogiel type II neurons, which are characterized by polyaxonal morphology, and very occasionally in Dogiel type I neurons, which have a single long process (Furness et al., 1998). We cannot exclude the possibility that the few Nav1.9-expressing Dogiel type I neurons identified as such here are actually pseudounipolar Dogiel type II neurons with a truncated axon that branches at a distance from the cell body. Nevertheless, our data establish that expression of Nav1.9 current is mainly restricted to Dogiel type II neurons in mice. Mao et al. (2006) have provided evidence that mouse Dogiel type II neurons may be intrinsic sensory neurons. Therefore, Nav1.9 is a molecular marker of IPANs in mouse duodenum and may provide a functional benefit for integrating and encoding sensory information.
Conversely, we found that INaT was broadly expressed in the different types of myenteric neurons, including Dogiel type II neurons and uniaxonal neurons that comprise multiple types of interneurons and motor neurons (Furness et al., 2004). Four pieces of evidence support the view that Nav1.5 channels are key determinants of INaT. First, INaT was still present in myenteric neurons deficient for Nav1.9 or Nav1.8 subunits. Second, both Nav1.5a mRNA and immunoreactivity for the Nav1.5 α-subunit were present in mouse LMMP preparations. Third, INaT has a midpoint of activation (−29 mV) identical to that of Nav1.5 reconstituted in expression systems (Sottas et al., 2013). Last, the IC50 for TTX (4.3 μm) was characteristic of Nav1.5 recorded in DRG neurons (2–6 μm, Renganathan et al., 2002) or in native cardiac myocytes (6 μm, Brown et al., 1981). Together, these data support the conclusion that INaT is produced by the Nav1.5 α-subunit in mouse myenteric neurons. It is the first demonstration that the Scn5a-encoded “cardiac” Nav1.5 channel is present in myenteric neurons.
Contribution of Nav1.5 and Nav1.9 to myenteric neuron excitability
Nav1.9 is characterized by relatively hyperpolarized voltage dependence and a broad area of overlap between activation and steady-state inactivation that promotes a persistent activation at potentials close to rest (Herzog et al., 2001; Coste et al., 2004; Maingret et al., 2008). Experiments with Nav1.9−/− mice demonstrate that persistent Nav1.9 channels give rise to a tonic depolarizing drive that promotes repetitive firing in Dogiel type II neurons. The combination of persistent current (Nav1.9) at voltages −60 to −45 mV, together with significant availability of transient currents (Nav1.5 and possibly Nav1.7; Sage et al., 2007) at these same voltages, constitutes an intrinsic system for sustained firing. Therefore, Nav1.9, together with other intrinsic, voltage-dependent conductances, may endow Dogiel type II neurons with the capacity for persistent firing as long as the sensory stimulus is maintained.
Both modeling and direct AP clamp experiments provide evidence that the Nav1.9-depolarizing envelope regulates spike waveform. AP duration was significantly shortened, whereas fAHP was significantly enhanced in Scn11a KO myenteric neurons. This effect occurs because Nav1.9 channel inactivation is incomplete during the falling phase of the spike. If inactivation of Na+ channels is incomplete, the current flowing through noninactivated channels during AP repolarization is larger. Therefore, the balance between inward currents and K+ currents will move toward the former, causing AP broadening and reduced fAHP. It is well documented that Dogiel type II neurons have broad APs (Nurgali et al., 2003, 2004), which is due to a component of AP carried by an inward current resistant to TTX (Furukawa et al., 1986). Our data therefore indicate that noninactivating Nav1.9 channels contribute to AP broadening of Dogiel type II neurons. Given that Nav1.9 is potentiated by synaptic transmitters and inflammatory mediators, this raises the possibility that the APs of Dogiel type II neurons may show some sort of plasticity during inflammation or pathological conditions of the GI tract (Nurgali, 2009).
In striking contrast to Nav1.9, we found that Na+ entry from Nav1.5 channels was nearly completely confined to the rising phase of the AP. Nav1.5 current reaches a maximum during the upstroke shortly before the peak of the AP. There was very little Nav1.5-dependent Na+ current flowing after the peak of the AP, because nearly all Nav1.5 channels are inactivated during the downstroke. We conclude that, under physiological conditions, Nav1.5, along with other TTX-S Na+ channels (Nav1.7; Sage et al., 2007), contribute to the upstroke of APs but have little influence on AP width.
Implications for human GI diseases
Nav1.9 channelopathies have been described recently in humans (Leipold et al., 2013; Zhang et al., 2013). Specific de novo missense mutations in Scn11a have been identified in individuals with the congenital inability to experience pain (Leipold et al., 2013). Mutant Nav1.9 channels displayed excessive activity at rest, causing continued depolarization of nociceptors and inactivation of other pain transmitting ion channels. Importantly, the clinical history of affected individuals also involves GI disturbances, including diarrhea, constipation, and reduced peristaltic waves in the small intestine (Leipold et al., 2013). Although the functional impact of Nav1.9 mutation on enteric neuron excitability remains to be determined, these findings strongly support a role for Nav1.9 in the regulation of gut neural reflexes in humans. These data are also consistent with the observation that mice lacking enteric Nav1.9 have intestinal dysmotility with altered colonic migrating motor complexes (Copel et al., 2013).
Mutations in Nav1.5 cause a range of human diseases including type-3 QT syndrome (LQT3) due to gain-of-function mutations and type 1 Brugada syndrome (BrS1) due to loss-of-function mutations (Ackerman et al., 2004). In the heart, Nav1.5 channels allow a fast inward flux of Na+ ions through the plasma membrane of cardiomyocytes that underlies the initiation and propagation of cardiac APs. LQT3 syndrome is characterized by defective fast inactivation, enhanced “persistent” Na+ current, prolonged AP duration, and arrhythmogenic early afterdepolarizations. This indicates that alterations in the stability of the fast- or slow-inactivated states of Nav1.5 are the underlying cause of the congenital disorders. Importantly, it has been shown that LQT3 subjects with Nav1.5 mutations were much more likely to have abdominal pain and other GI symptom complexes than controls (Locke at al., 2006). More recent data also suggest that Nav1.5 mutations are found in patients with irritable bowel syndrome and could therefore potentially cause GI pathology (Saito et al., 2009). These observations raise the possibility that Nav1.5 channelopathies may contribute to the pathogenesis of GI symptoms. GI symptoms in humans may be linked to the expression of the “cardiac” Nav1.5 in interstitial cells of Cajal (ICC) and circular smooth muscle cells in the GI tract (Holm et al., 2002; Strege et al., 2003). Sodium influx through the Nav1.5 channel is known to regulate membrane potential and slow-wave frequency in ICC, which are required for coordinated motility (Strege et al., 2003). However, our data raise the possibility that neuronal Nav1.5 may play a role in the pathogenesis of GI motility disorders. Given that Nav1.5 is broadly expressed in enteric neurons, together with the fact that many mutations involved in cardiac diseases caused impaired inactivation of Nav1.5, one may conjecture that Nav1.5 dysfunction influences the entire ENS activity. Based on our data, we propose that Nav1.5-dependent neuronal disorders of excitability may play important and previously unrecognized roles in the pathogenesis of digestive diseases.
Conclusion
Our results provide insights into how electrogenesis is specified in different populations of mouse enteric neurons. The presence of Nav1.9 in Dogiel type II neurons provides an ideal environment for tonic firing and amplification of incoming signals, whereas Nav1.5 contributes to fast transmission throughout the ENS. Channelopathy-associated mutations in Nav1.5 and Nav1.9 are linked to GI symptom complexes, providing evidence that these channels are appealing targets for the development of therapeutic treatments.
Footnotes
This work is supported by the Centre National de la Recherche Scientifique, Agence Nationale de la Recherche (Grants ANR-08-MNPS-025-02 and ANR-09-MNPS-037-01), and the Fondation pour la Recherche Médicale (Grant FRM 2013 DEQ20130326482).
The authors declare no competing financial interests.
References
- Ackerman MJ, Splawski I, Makielski JC, Tester DJ, Will ML, Timothy KW, Keating MT, Jones G, Chadha M, Burrow CR, Stephens JC, Xu C, Judson R, Curran ME. Spectrum and prevalence of cardiac sodium channel variants among black, white, Asian, and Hispanic individuals: implications for arrhythmogenic susceptibility and Brugada/long QT syndrome genetic testing. Heart Rhythm. 2004;1:600–607. doi: 10.1016/j.hrthm.2004.07.013. [DOI] [PubMed] [Google Scholar]
- Amaya F, Wang H, Costigan M, Allchorne AJ, Hatcher JP, Egerton J, Stean T, Morisset V, Grose D, Gunthorpe MJ, Chessell IP, Tate S, Green PJ, Woolf CJ. The voltage-gated sodium channel Na(v)1.9 is an effector of peripheral inflammatory pain hypersensitivity. J Neurosci. 2006;26:12852–12860. doi: 10.1523/JNEUROSCI.4015-06.2006. [DOI] [PMC free article] [PubMed] [Google Scholar]
- Baker MD, Chandra SY, Ding Y, Waxman SG, Wood JN. GTP-induced tetrodotoxin-resistant Na+ current regulates excitability in mouse and rat small diameter sensory neurones. J Physiol. 2003;548:373–382. doi: 10.1113/jphysiol.2003.039131. [DOI] [PMC free article] [PubMed] [Google Scholar]
- Brown AM, Lee KS, Powell T. Sodium current in single rat heart muscle cells. J Physiol. 1981;318:479–500. doi: 10.1113/jphysiol.1981.sp013879. [DOI] [PMC free article] [PubMed] [Google Scholar]
- Carnevale NT, Hines ML. The NEURON book. Cambridge: Cambridge UP; 2006. [Google Scholar]
- Copel C, Osorio N, Crest M, Gola M, Delmas P, Clerc N. Activation of neurokinin 3 receptor increases Na(v)1.9 current in enteric neurons. J Physiol. 2009;587:1461–1479. doi: 10.1113/jphysiol.2009.169409. [DOI] [PMC free article] [PubMed] [Google Scholar]
- Copel C, Clerc N, Osorio N, Delmas P, Mazet B. The Nav1.9 channel regulates colonic motility in mice. Front Neurosci. 2013;7:58. doi: 10.3389/fnins.2013.00058. [DOI] [PMC free article] [PubMed] [Google Scholar]
- Coste B, Osorio N, Padilla F, Crest M, Delmas P. Gating and modulation of presumptive NaV1.9 channels in enteric and spinal sensory neurons. Mol Cell Neurosci. 2004;26:123–134. doi: 10.1016/j.mcn.2004.01.015. [DOI] [PubMed] [Google Scholar]
- Coste B, Crest M, Delmas P. Pharmacological dissection and distribution of NaN/Nav1.9, T-type Ca2+ currents, and mechanically activated cation currents in different populations of DRG neurons. J Gen Physiol. 2007;129:57–77. doi: 10.1085/jgp.200609665. [DOI] [PMC free article] [PubMed] [Google Scholar]
- Cummins TR, Dib-Hajj SD, Black JA, Akopian AN, Wood JN, Waxman SG. A novel persistent tetrodotoxin-resistant sodium current in SNS-null and wild-type small primary sensory neurons. J Neurosci. 1999;19:RC43. doi: 10.1523/JNEUROSCI.19-24-j0001.1999. [DOI] [PMC free article] [PubMed] [Google Scholar]
- Dib-Hajj S, Black JA, Cummins TR, Waxman SG. NaN/Nav1.9: a sodium channel with unique properties. Trends Neurosci. 2002;25:253–259. doi: 10.1016/S0166-2236(02)02150-1. [DOI] [PubMed] [Google Scholar]
- Furness JB. The enteric nervous system and neurogastroenterology. Nat Rev Gastroenterol Hepatol. 2012;9:286–294. doi: 10.1038/nrgastro.2012.32. [DOI] [PubMed] [Google Scholar]
- Furness JB, Kunze WA, Bertrand PP, Clerc N, Bornstein JC. Intrinsic primary afferent neurons of the intestine. Prog Neurobiol. 1998;54:1–18. doi: 10.1016/S0301-0082(97)00051-8. [DOI] [PubMed] [Google Scholar]
- Furness JB, Jones C, Nurgali K, Clerc N. Intrinsic primary afferent neurons and nerve circuits within the intestine. Prog Neurobiol. 2004;72:143–164. doi: 10.1016/j.pneurobio.2003.12.004. [DOI] [PubMed] [Google Scholar]
- Furukawa K, Taylor GS, Bywater RA. An intracellular study of myenteric neurons in the mouse colon. J Neurophysiol. 1986;55:1395–1406. doi: 10.1152/jn.1986.55.6.1395. [DOI] [PubMed] [Google Scholar]
- Galligan JJ. 5-hydroxytryptamine, ulcerative colitis, and irritable bowel syndrome: molecular connections. Gastroenterology. 2004;126:1897–1899. doi: 10.1053/j.gastro.2004.04.028. [DOI] [PubMed] [Google Scholar]
- Grundy D, Al-Chaer ED, Aziz Q, Collins SM, Ke M, Taché Y, Wood JD. Fundamentals of neurogastroenterology: basic science. Gastroenterology. 2006;130:1391–1411. doi: 10.1053/j.gastro.2005.11.060. [DOI] [PubMed] [Google Scholar]
- Herzog RI, Cummins TR, Waxman SG. Persistent TTX-resistant Na+ current affects resting potential and response to depolarization in simulated spinal sensory neurons. J Neurophysiol. 2001;86:1351–1364. doi: 10.1152/jn.2001.86.3.1351. [DOI] [PubMed] [Google Scholar]
- Holm AN, Rich A, Miller SM, Strege P, Ou Y, Gibbons S, Sarr MG, Szurszewski JH, Rae JL, Farrugia G. Sodium current in human jejunal circular smooth muscle cells. Gastroenterology. 2002;122:178–187. doi: 10.1053/gast.2002.30346. [DOI] [PubMed] [Google Scholar]
- Kerr NC, Holmes FE, Wynick D. Novel isoforms of the sodium channels Nav1.8 and Nav1.5 are produced by a conserved mechanism in mouse and rat. J Biol Chem. 2004;279:24826–24833. doi: 10.1074/jbc.M401281200. [DOI] [PMC free article] [PubMed] [Google Scholar]
- Kunze WA, Bornstein JC, Furness JB. Identification of sensory nerve cells in a peripheral organ (the intestine) of a mammal. Neuroscience. 1995;66:1–4. doi: 10.1016/0306-4522(95)00067-S. [DOI] [PubMed] [Google Scholar]
- Leipold E, Liebmann L, Korenke GC, Heinrich T, Giesselmann S, Baets J, Ebbinghaus M, Goral RO, Stödberg T, Hennings JC, Bergmann M, Altmüller J, Thiele H, Wetzel A, Nürnberg P, Timmerman V, De Jonghe P, Blum R, Schaible HG, Weis J, Heinemann SH, Hübner CA, Kurth I. A de novo gain-of-function mutation in SCN11A causes loss of pain perception. Nat Genet. 2013;45:1399–1404. doi: 10.1038/ng.2767. [DOI] [PubMed] [Google Scholar]
- Leo S, D'Hooge R, Meert T. Exploring the role of nociceptor-specific sodium channels in pain transmission using Nav1.8 and Nav1.9 knockout mice. Behav Brain Res. 2010;208:149–157. doi: 10.1016/j.bbr.2009.11.023. [DOI] [PubMed] [Google Scholar]
- Locke GR, 3rd, Ackerman MJ, Zinsmeister AR, Thapa P, Farrugia G. Gastrointestinal symptoms in families of patients with an SCN5A-encoded cardiac channelopathy: evidence of an intestinal channelopathy. Am J Gastroenterol. 2006;101:1299–1304. doi: 10.1111/j.1572-0241.2006.00507.x. [DOI] [PubMed] [Google Scholar]
- Lolignier S, Amsalem M, Maingret F, Padilla F, Gabriac M, Chapuy E, Eschalier A, Delmas P, Busserolles J. Nav1.9 channel contributes to mechanical and heat pain hypersensitivity induced by subacute and chronic inflammation. PLoS One. 2011;6:e23083. doi: 10.1371/journal.pone.0023083. [DOI] [PMC free article] [PubMed] [Google Scholar]
- Maingret F, Coste B, Padilla F, Clerc N, Crest M, Korogod SM, Delmas P. Inflammatory mediators increase Nav1.9 current and excitability in nociceptors through a coincident detection mechanism. J Gen Physiol. 2008;131:211–225. doi: 10.1085/jgp.200709935. [DOI] [PMC free article] [PubMed] [Google Scholar]
- Mao Y, Wang B, Kunze W. Characterization of myenteric sensory neurons in the mouse small intestine. J Neurophysiol. 2006;96:998–1010. doi: 10.1152/jn.00204.2006. [DOI] [PubMed] [Google Scholar]
- Nurgali K. Plasticity and ambiguity of the electrophysiological phenotypes of enteric neurons. Neurogastroenterol Motil. 2009;21:903–913. doi: 10.1111/j.1365-2982.2009.01329.x. [DOI] [PubMed] [Google Scholar]
- Nurgali K, Furness JB, Stebbing MJ. Correlation of electrophysiology, shape and synaptic properties of myenteric AH neurons of the guinea pig distal colon. Auton Neurosci. 2003;103:50–64. doi: 10.1016/S1566-0702(02)00212-6. [DOI] [PubMed] [Google Scholar]
- Nurgali K, Stebbing MJ, Furness JB. Correlation of electrophysiological and morphological characteristics of enteric neurons in the mouse colon. J Comp Neurol. 2004;468:112–124. doi: 10.1002/cne.10948. [DOI] [PubMed] [Google Scholar]
- Osorio N, Delmas P. Patch clamp recording from enteric neurons in situ. Nat Protoc. 2010;6:15–27. doi: 10.1038/nprot.2010.172. [DOI] [PubMed] [Google Scholar]
- Padilla F, Couble ML, Coste B, Maingret F, Clerc N, Crest M, Ritter AM, Magloire H, Delmas P. Expression and localization of the Nav1.9 sodium channel in enteric neurons and in trigeminal sensory endings: implication for intestinal reflex function and orofacial pain. Mol Cell Neurosci. 2007;35:138–152. doi: 10.1016/j.mcn.2007.02.008. [DOI] [PubMed] [Google Scholar]
- Palmer JM, Wong-Riley M, Sharkey KA. Functional alterations in jejunal myenteric neurons during inflammation in nematode-infected guinea pigs. Am J Physiol. 1998;275:G922–G935. doi: 10.1152/ajpgi.1998.275.5.G922. [DOI] [PubMed] [Google Scholar]
- Priest BT, Murphy BA, Lindia JA, Diaz C, Abbadie C, Ritter AM, Liberator P, Iyer LM, Kash SF, Kohler MG, Kaczorowski GJ, MacIntyre DE, Martin WJ. Contribution of the tetrodotoxin-resistant voltage-gated sodium channel NaV1.9 to sensory transmission and nociceptive behavior. Proc Natl Acad Sci U S A. 2005;102:9382–9387. doi: 10.1073/pnas.0501549102. [DOI] [PMC free article] [PubMed] [Google Scholar]
- Renganathan M, Dib-Hajj S, Waxman SG. Na(v)1.5 underlies the ‘third TTX-R sodium current’ in rat small DRG neurons. Brain Res Mol Brain Res. 2002;106(1–2):70–82. doi: 10.1016/s0169-328x(02)00411-4. [DOI] [PubMed] [Google Scholar]
- Rugiero F, Mistry M, Sage D, Black JA, Waxman SG, Crest M, Clerc N, Delmas P, Gola M. Selective expression of a persistent tetrodotoxin-resistant Na+ current and NaV1.9 subunit in myenteric sensory neurons. J Neurosci. 2003;23:2715–2725. doi: 10.1523/JNEUROSCI.23-07-02715.2003. [DOI] [PMC free article] [PubMed] [Google Scholar]
- Rush AM, Waxman SG. PGE2 increases the tetrodotoxin-resistant Nav1.9 sodium current in mouse DRG neurons via G-proteins. Brain Res. 2004;1023:264–271. doi: 10.1016/j.brainres.2004.07.042. [DOI] [PubMed] [Google Scholar]
- Sage D, Salin P, Alcaraz G, Castets F, Giraud P, Crest M, Mazet B, Clerc N. Na(v)1.7 and Na(v)1.3 are the only tetrodotoxin-sensitive sodium channels expressed by the adult guinea pig enteric nervous system. J Comp Neurol. 2007;504:363–378. doi: 10.1002/cne.21450. [DOI] [PubMed] [Google Scholar]
- Saito YA, Strege PR, Tester DJ, Locke GR, 3rd, Talley NJ, Bernard CE, Rae JL, Makielski JC, Ackerman MJ, Farrugia G. Sodium channel mutation in irritable bowel syndrome: evidence for an ion channelopathy. Am J Physiol Gastrointest Liver Physiol. 2009;296:G211–G218. doi: 10.1152/ajpgi.90571.2008. [DOI] [PMC free article] [PubMed] [Google Scholar]
- Sottas V, Rougier JS, Jousset F, Kucera JP, Shestak A, Makarov LM, Zaklyazminskaya EV, Abriel H. Characterization of 2 genetic variants of Na(v) 1.5-arginine 689 found in patients with cardiac arrhythmias. J Cardiovasc Electrophysiol. 2013;24:1037–1046. doi: 10.1111/jce.12173. [DOI] [PubMed] [Google Scholar]
- Strege PR, Ou Y, Sha L, Rich A, Gibbons SJ, Szurszewski JH, Sarr MG, Farrugia G. Sodium current in human intestinal interstitial cells of Cajal. Am J Physiol Gastrointest Liver Physiol. 2003;285:G1111–1121. doi: 10.1152/ajpgi.00152.2003. [DOI] [PubMed] [Google Scholar]
- Zhang XY, Wen J, Yang W, Wang C, Gao L, Zheng LH, Wang T, Ran K, Li Y, Li X, Xu M, Luo J, Feng S, Ma X, Ma H, Chai Z, Zhou Z, Yao J, Zhang X, Liu JY. Gain-of-function mutations in SCN11A cause familial episodic pain. Am J Hum Genet. 2013;93:957–966. doi: 10.1016/j.ajhg.2013.09.016. [DOI] [PMC free article] [PubMed] [Google Scholar]