

PET targeting a mutated PSMA enabled serial imaging of CAR T cell activity in a murine model of ALL.
Abstract
Chimeric antigen receptor (CAR) T cell therapy for hematologic malignancies is fraught with several unknowns, including number of functional T cells that engage target tumor, durability and subsequent expansion and contraction of that engagement, and whether toxicity can be managed. Non-invasive, serial imaging of CAR T cell therapy using a reporter transgene can address those issues quantitatively. We have transduced anti-CD19 CAR T cells with the prostate-specific membrane antigen (PSMA) because it is a human protein with restricted normal tissue expression and has an expanding array of positron emission tomography (PET) and therapeutic radioligands. We demonstrate that CD19-tPSMA(N9del) CAR T cells can be tracked with [18F]DCFPyL PET in a Nalm6 model of acute lymphoblastic leukemia. Divergence between the number of CD19-tPSMA(N9del) CAR T cells in peripheral blood and bone marrow and those in tumor was evident. These findings underscore the need for non-invasive repeatable monitoring of CAR T cell disposition clinically.
INTRODUCTION
Chimeric antigen receptor (CAR) T cell therapy has revolutionized the treatment of hematologic malignancies refractory to conventional methods (1–4). CAR T cells, a “living drug,” traffic throughout the body and undergo dynamic expansion and contraction kinetics (5). The CAR is composed of a tumor antigen binding domain, such as a single-chain variable fragment (scFv), which serves as the targeting element, fused to transmembrane, costimulatory, and essential signaling domains (Fig. 1A) (6). Unlike native T cell receptor–mediated antigen recognition, CAR T cell recognition is not major histocompatibility complex restricted. CAR T cell activation, expansion, and effector function are dependent on the ability to access the cognate tumor antigen target. There is increasing evidence for a positive relationship between CAR T cell exposure and clinical efficacy (7–9). This new, robust cellular therapy on occasion has led to lethal adverse effects, including neurotoxicity, suggesting the need for careful monitoring (10, 11). The dynamic behavior of CAR T cells limits the utility of traditional blood pharmacokinetic analyses that only partially capture CAR T cell temporal and spatial distributions relative to those of tumor. Accordingly, strategies to track CAR T cells serially in vivo have been attempted to understand whether and to what extent they engage target and then expand, whether they remain functional, and for how long they persist. In addition, the ability to monitor quantitatively the infused CAR T cells will enable active surveillance for unwanted targeting of the CAR T cells and determining a patient-specific dosing plan.
Fig. 1. Engineered expression of PSMA variants on CD19 CAR T cells.
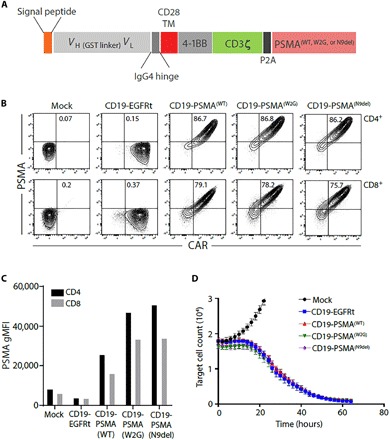
(A) CAR construct illustration demonstrating the CD19-targeting domain, costimulatory domain, and the location of the PSMA expression tag. Three different molecular constructs of PSMA were produced: WT, W2G, and N9del. VH, heavy chain variable domain; VL, light chain variable domain; GST, glutathione S-transferase; IgG4, immunoglobulin G4. (B) CD19-EGFRt or CD19-PSMA CAR T cells were generated, and flow cytometry was performed to identify CAR+ and PSMA+ CD4 or CD8 T cells. Gating was based on the mock transduction control. (C) Surface expression of PSMA was assessed by flow cytometry. Geometric mean fluorescent intensity (gMFI) is reported after gating on PSMA+ cells. (D) Mock, CD19-EGFRt, or CD19-PSMA CAR T cells were incubated with K562-CD19-NLR target cells at a ratio of 4:1. Target cells were analyzed every 2 hours using an IncuCyte live cell imaging system. TM, transmembrane; NLR, NucLight Red.
A wide variety of methods for tracking T cells has been attempted, including ex vivo labeling with radionuclides such as 111In, transfection with nanoparticles or emulsions that can be visualized with magnetic resonance (MR) imaging through radiolabeled antibody-based targeting, or introduction of imaging reporter transgenes (12–16). That latter technique has likewise used a variety of imaging modalities, including optical, MR, and radionuclide-based [single-photon emission computed tomography (SPECT) and positron emission tomography (PET)] methods. The key is to have a reporter–imaging probe pair suitable for the indication (e.g., preclinical cell trafficking), clonal expansion, and clinical translation. Specific reporters include firefly luciferase (fLuc), a mutated version of the herpes simplex virus type 1 thymidine kinase (HSV1-sr39tk), type 2 somatostatin receptors (SSTR2), the human sodium-iodide symporter (hNIS), the D2 dopamine receptor, or the prostate-specific membrane antigen (PSMA) (17). At least one such method has been translated to clinical use (15), but each has its drawbacks. For example, cells that incorporate a nanoparticle or emulsion will have the reporter diluted as their population expands, diminishing sensitivity of detection. Some cannot be translated, such as fLuc, which must also be used with care preclinically, as activated T cells may not be reliably quantified by the adenosine triphosphate–dependent reaction on which fLuc detection relies (18). Immunogenicity is an issue for repeated use of HSV-based reporter systems, and the corresponding PET imaging probes have substantial normal tissue uptake and overall poor pharmacokinetics for imaging in the periphery. In practice, PET imaging is at least an order of magnitude more sensitive than SPECT, suggesting that PET/computed tomography (CT) (or PET/MR) is the desired modality by which to track cells in vivo. PET imaging probes such as [124I]NaI are not readily available and, because of the long physical half-life of 124I, can provide a high dose of radiation for use with hNIS, although new agents are under development (19). SSTR2 can be detected with [68Ga]DOTATATE, which is now commercially available. SSTR2 is, however, expressed in various normal tissues, which could provide nonspecific signal (20).
We have focused on the reporter-probe pair of PSMA and [18F]DCFPyL (21). PSMA is a human protein and has normal tissue expression restricted to a few organs (22, 23). [18F]DCFPyL provides highly sensitive, high-contrast clinical images in a predictable pattern of normal tissue distribution, the interpretation of which has been systematized for structured reporting (24–28). PSMA can also be mutated so as not to internalize upon ligand binding. [18F]DCFPyL is currently undergoing phase 3 clinical trials, will be widely available soon, and can be synthesized in high quantities and at high specific radioactivity, which is important for imaging targets of potentially low concentration such as cells (29). Here, we describe serial imaging of CD19-tPSMA(N9del) T cells in a Nalm6 model of acute lymphoblastic leukemia using preclinical [18F]DCFPyL PET.
RESULTS
Engineering PSMA expression on CD19 CAR T cells
We began by designing molecular constructs that encoded a CD19-directed CAR with a 4-1BB costimulatory domain and a wild-type (WT) or modified variant of human PSMA, separated by a self-cleaving P2A sequence to drive coexpression of the CAR and PSMA tag from a single promoter (Fig. 1A). N-terminally modified PSMA variants [PSMA(W2G) and tPSMA(N9del)] were designed to prevent receptor internalization and to increase PSMA surface expression (30). We hypothesized that would increase PET probe binding and overall imaging sensitivity. In addition, the tPSMA(N9del) variant lacks the putative intracellular signaling motifs, making it less likely to affect normal T cell function. As a functional benchmark for these studies, we used an identical CD19 CAR but replaced PSMA with the commonly used truncated epidermal growth factor receptor (EGFRt) tag (31).
Human T cells were transduced with lentiviral vectors encoding CD19-EGFRt, CD19-PSMA(WT), CD19-PSMA(W2G), or CD19-tPSMA(N9del). After enrichment for CAR-expressing T cells, surface expression of WT PSMA or N-terminally modified PSMA variants was assessed by flow cytometry. PSMA and N-terminally modified variants were detected on the surface of transduced CD4+ and CD8+ cells and expressed colinearly with the CAR (Fig. 1B). We observed no expression of PSMA in nontransduced cells (mock) or cells transduced with the CD19-EGFRt construct (Fig. 1B). PSMA(W2G) and tPSMA(N9del) had higher surface expression compared to PSMA(WT) (Fig. 1C). Expression of WT PSMA or N-terminally modified PSMA variants did not affect the cytotoxic function of the CAR T cells (Fig. 1D). Given the high surface expression and equivalent cytotoxic activity, the CD19-tPSMA(N9del) construct was selected for further functional characterization.
Functional validation of CD19 CAR T cells
To be a viable imaging reporter gene, it was critical that the addition of tPSMA(N9del) did not affect the antitumor activity of CD19-directed CAR T cells. Using CD19-EGFRt CAR T cells as a benchmark, CD19-tPSMA(N9del) CAR T cells demonstrated similar in vitro cytotoxic function against a CD19-expressing target cell line (Fig. 2A), and this was observed across a range of effector:target ratios (Fig. 2B). We also assessed whether the PET probe DCFPyL affected CD19-tPSMA(N9del) CAR T cell function. Even at doses as high as 10 μM, DCFPyL did not decrease the cytotoxic function or cytokine production of CD19-tPSMA(N9del) CAR T cells (fig. S1).
Fig. 2. CD19 CAR T cells expressing tPSMA maintain function in vitro and in vivo.
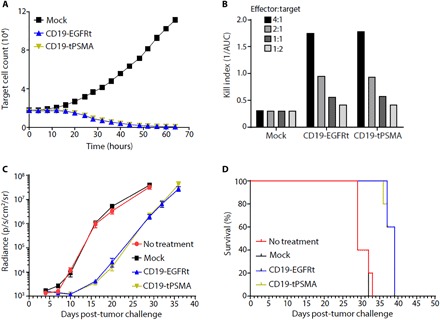
(A) Mock or CD19-tPSMA CAR T cells were incubated with K562-CD19-NLR target cells at a ratio of 4:1. Target cells were analyzed every 2 hours using an IncuCyte live cell imaging system. (B) A kill index [1/area under the curve (AUC)] was calculated at the indicated effector:target ratio. (C and D) Nalm6-GFP-fLuc tumor cells were injected intravenously into female NOD scid (nonobese diabetic severe combined immunodeficient) gamma (NSG) mice (n = 8 per group) on day 0, and 1 × 10⁶ mock or CAR T cells were injected on day 4. Whole-body bioluminescence imaging (BLI) was performed to determine tumor burden, with data displayed as average radiance for each group (C), and survival events were recorded (D).
We then transferred a noncurative dose of mock, CD19-EGFRt, or CD19-tPSMA(N9del) CAR T cells into CD19+ tumor-bearing mice. Previous studies have described using suboptimal CAR T cell dosing as a way to pressure test for differences between CAR constructs (32). Following the adoptive transfer of mock T cells, tumors continued to grow over the course of the study, while both CD19-EGFRt and CD19-tPSMA(N9del) CAR T cells demonstrated similar control of tumor burden (Fig. 2C). Furthermore, the survival of mice treated with CD19-EGFRt or CD19-tPSMA(N9del) CAR T cells was similar and, in each case, greater when compared to the mice administered mock-transduced cells or left untreated (Fig. 2D). Together, these results demonstrate that CD19-directed CAR T cells, whether expressing EGFRt or tPSMA(N9del), exhibit similar in vitro and in vivo antitumor function.
Detection of CD19 CAR T cells via PET
We chose [18F]DCFPyL, a high-affinity radiotracer targeting PSMA, for the detection of CD19-tPSMA(N9del) CAR T cells (33). [18F]DCFPyL has exhibited high sensitivity for detecting PSMA-positive metastatic prostate cancer, favorable pharmacokinetic properties in human trials, and high signal-to-noise ratio on PET imaging (24, 34, 35). An in vitro phantom study using preclinical PET visualized CD19-tPSMA(N9del) CAR T cells incubated with [18F]DCFPyL in a 384-well plate (Fig. 3A). The detection limit was 2000 cells. The PET signal was directly proportional to the number of CD19-tPSMA(N9del) CAR T cells in each well. To test the feasibility and sensitivity for detecting CD19-tPSMA(N9del) CAR T cells in vivo, we subcutaneously transplanted varying numbers of CD19-tPSMA(N9del) CAR T cells mixed with Matrigel in both shoulders of immunocompromised NOD scid (nonobese diabetic severe combined immunodeficient) gamma (NSG) mice. The mice were injected with 14.8 MBq of [18F]DCFPyL through the tail vein and were imaged 1 hour after injection of the radiotracer. The PET signal strengths were proportional to the number of cells injected (Fig. 3B), with a limit of detection of 2000 CD19-tPSMA(N9del) CAR T cells per 50 μl by in vivo imaging.
Fig. 3. PET detects CD19-tPSMA CAR T cells with high sensitivity in vitro and in vivo.
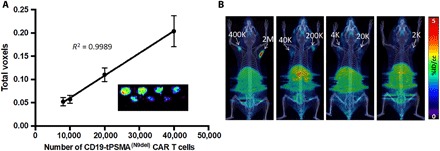
(A) Standard curve demonstrating a linear relationship between the PET signal and the number of CD19-tPSMA(N9Del) CAR T cells. Inset: In vitro phantom from which the standard curve was derived. The in vitro phantom used varying numbers of CD19-tPSMA(N9del) CAR T cells incubated with 37 MBq of [18F]DCFPyL, a high affinity, positron-emitting ligand targeting PSMA, in a 384-well plate. Plates were scanned using the SuperArgus small-animal PET/CT device at 1 hour after beginning the incubation. There were three rows and eight columns of wells presented in a checkerboard pattern: (top row) 40,000, 20,000, 10,000, and 8000 cells; (middle row) 6000, 4000, 2000, and 1000 cells; and (bottom row) 800, 600, 400, and 200 cells. Detection limit was at or near 2000 cells. Images from one of eight separate plates are shown. Error bars, SD; n = 8. (B) Representative images of NSG mice injected with the indicated number (K = 1000; M = 1 × 10⁶) of CD19-tPSMA(N9del) CAR T cells in 50 μl (50% Matrigel) in the shoulders (white arrows); n = 5. Mice were imaged on the SuperArgus small-animal PET/CT at 1 hour after injection of 14.8 MBq of [18F]DCFPyL. PET data are expressed in percentage of injected dose per cubic centimeter of tissue imaged (%ID/cc). To improve the display contrast of the in vivo images, relatively high renal radiotracer uptake was masked using a thresholding method.
Visualization of CD19 CAR T cells in an experimental model of leukemia
We next asked whether we could detect CD19-tPSMA(N9del) CAR T cells infused and expanded in animals harboring CD19-expressing human B cell leukemia. We injected CD19-expressing Nalm6-eGFP-fLuc cells in the left flank of NSG mice. When the tumors reached ~125 mm3, we confirmed the stable engraftment of live tumors via bioluminescence imaging (BLI) at day 0 (Fig. 4, A to C). Metastases formed in different patterns in different mice. We infused 2 × 10⁶ CD19-tPSMA(N9del) CAR T cells via the tail vein on day 1 and imaged the animals on day 5. Mice without lesions within the bone marrow did not have detectable CAR T cells at that early time point (Fig. 4, A and C), whereas those with these lesions quickly demonstrated an expanded population of CAR T cells in the bone marrow (Fig. 4B). Additional BLI and PET imaging sessions were performed at days 11 and 12, respectively, by which time most of the CD19-tPSMA(N9del) CAR T cells clearly infiltrated the original tumor sites. BLI on day 11 confirmed a substantial reduction in the number of viable cells within the original tumors, and these tumors were ultimately eradicated from the mice. We also noticed that the CD19-tPSMA(N9del) CAR T cells that originally infiltrated within the bone marrow on day 5 migrated to the original tumor site after successfully eliminating the metastases within the bone marrow (Fig. 4B). Untreated mice and mice infused with the mock T cells did not have detectable T cells by PET (Fig. 4C), indicating that the PET signal demonstrated in Fig. 4 (A, B, and D) originated specifically from the infused CD19-tPSMA(N9del) CAR T cells. Immunohistochemistry (IHC) confirmed the presence of infiltrated CD19-tPSMA(N9del) CAR T cells in the central portion of the tumors harvested (Fig. 4D).
Fig. 4. PSMA PET/CT enables visualization of CD19-tPSMA(N9del) CAR T cell infiltration into local and metastatic tumors.
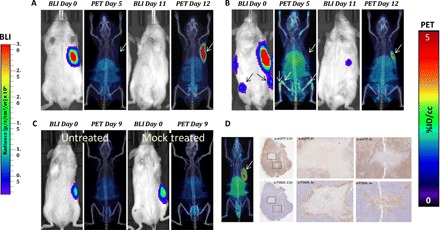
Tumors were derived from Nalm6-eGFP-fLuc cells. (A and B) Mice were infused with 2 × 10⁶ CD19-tPSMA(N9del) CAR T cells; n = 5. (C) Untreated (left mouse) and treated (right mouse) with infusion of 2 × 10⁶ mock T cells. Mice were imaged on the SuperArgus small-animal PET/CT at 1 hour after injection of 14.8 MBq of [18F]DCFPyL and were evaluated at various times (in days) after infusion of the CAR T cells, as indicated. Images alternate between fLuc-tagged bioluminescence (BLI, radiance) for visualization of tumor cells and PET/CT for T cells, with each mouse undergoing both imaging studies; n = 2. (D) Tumor was dissected and stained with anti-PSMA antibody for CD19-tPSMA(N9del) CAR T cells and anti–enhanced green fluorescent protein (eGFP) antibody for tumor cells. CAR T cells infiltrated into the center of the tumor (magnification boxes). Regions where CD19-tPSMA(N9del) CAR T cells infiltrated stained negative with anti-eGFP antibody, indicating tumor cell death. This is a representative example of n = 8. PET data are expressed in percentage of injected dose per cubic centimeter of tissue imaged (%ID/cc). To improve the display contrast of the in vivo images, the relatively high renal radiotracer uptake was masked using a thresholding method. Arrows demonstrate tumor, where indicated. Images are scaled to the same maximum value within each modality.
CD19 CAR T cell numbers in mouse: Clinical relevance
We sought to determine whether the CAR T cell densities, which are readily detected by PET/CT within lesions in the animal model, are comparable to that found in clinical specimens. We monitored the dynamic changes in CD19-tPSMA(N9del) CAR T cells after infusion to animals bearing CD19-expressing Nalm6-eGFP-fLuc tumors and compared these to the CAR T densities measured from lymphoma biopsy specimens obtained from patients in an ongoing CD19 CAR T cell clinical trial. Patients in the TRANSCEND (Telmisartan Randomised AssessmeNt Study in ACE iNtolerant subjects with cardiovascular Disease) NHL-001 trial (NCT02631044) received autologous T cells expressing the same CAR as the research construct in the current study (see Materials and Methods) but expressing an EGFRt tag rather than tPSMA(N9del). Animal images were obtained over a period of time after CAR T cell infusion that overlapped with when biopsy specimens were obtained from patients enrolled in the TRANSCEND trial.
By day 10, BLI indicated that viable tumor was eradicated in all mice, but CD19-tPSMA(N9del) CAR T cells persisted at the inoculation site, as previously demonstrated (Figs. 5 and 6). Animals were euthanized, tumors were removed, IHC was performed, and PSMA-expressing cell numbers were determined. The CAR T cell density values of tumors harvested from mice were within the same order of magnitude as those measured from the lymphoma biopsies in the human trial (Fig. 5).
Fig. 5. CD19-tPSMA(N9del) CAR T cell numbers in mouse and human.
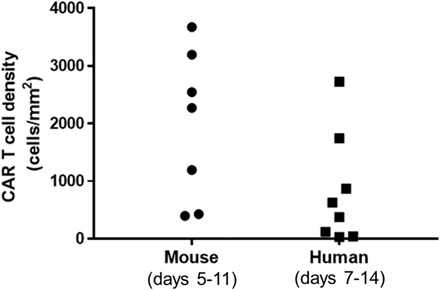
Values were obtained from tumor biopsies, with the human samples derived from the TRANSCEND NHL-001 trial. TRANSCEND uses the same CAR construct but an EGFRt rather than tPSMA tag. Note that CD19-tPSMA(N9del) CAR T cell numbers in mouse versus human biopsy samples are on the same order of magnitude.
Current clinical practice dictates that CAR T cell numbers are serially assessed in the peripheral blood. We explored whether the number of circulating CAR T cells could be inferred directly from the PET images. We performed PET scans in five mice on day 11 or 12 after inoculation of CD19-tPSMA(N9del) CAR T cells (Fig. 6A). Using the standard curve of Fig. 3A, we calculated the number of CAR T cells that infiltrated within each tumor. The calculated numbers of total CD19-tPSMA(N9del) CAR T cells were plotted against the number of PSMA+/CAR+ double-positive cells found in the peripheral blood and the bone marrow (Fig. 6B). We found that the number of CAR T cells derived from the PET images did not correlate with the T cell counts in the blood or the bone marrow, suggesting that the peripheral blood may not reflect the degree to which tumors are infiltrated with CAR T cells and that more clinically relevant information can be determined by PET.
Fig. 6. The number of CD19-tPSMA(N9del) cells in the peripheral blood and the bone marrow does not correlate with the total number of the CD19-tPSMA(N9del) cells localized to the tumors.
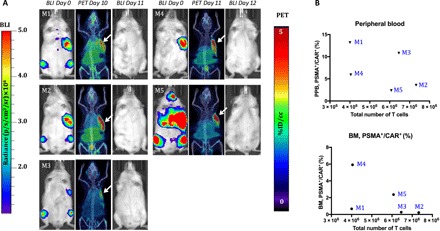
(A) PET/CT and BLI images of five mice. Days are marked from the day of infusion of CD19-tPSMA(N9del) CAR T cells. Mice were imaged on the SuperArgus small-animal PET/CT at 1 hour after injection of 14.8 MBq of [18F]DCFPyL and were scanned at various times after injection, as indicated. Images alternate between fLuc-tagged bioluminescence (BLI, radiance) for visualization of tumor cells and PET/CT for CAR T cells, with each mouse undergoing both imaging studies. PET data are expressed in percentage of injected dose per cubic centimeter of tissue imaged (%ID/cc), with arrows designating accumulation of CAR T cells. To improve the display contrast of the in vivo images, the relatively high renal radiotracer uptake was masked using a thresholding method. Images are scaled to the same maximum value within each modality. (B) Quantified numbers of the CD19-tPSMA(N9del) cells in the region of interest drawn to cover the entire tumor area were plotted with the percentage number of PSMA+/CAR+ cell populations in the peripheral blood (PPB) and the bone marrow (BM). Each data point (M) represents each mouse; n = 5.
DISCUSSION
Treatment of B cell malignancies, particularly those that express the CD19 surface marker, has been transformed by the appearance of CAR T cell therapy. According to ClinicalTrials.gov, there are currently 720 clinical trials under way that use CAR T cells, with objective response rates exceeding 70% for relapsed or refractory large B cell lymphoma (36). Significant effort is also under way to enable treatment of solid tumors using CAR T cells (37). Nevertheless, many questions remain not only as to how this therapy can be improved and extended but also regarding how it can be monitored and optimized clinically in real time. For example, in the peripheral blood, CAR T cells can be rapidly depleted by approximately 3 months after administration. But are they still present at the tumor and viable and, if so, in what numbers? Information about the disposition of CAR T cells at the intended site of action will enable more precise and effective therapy and will help to combat off-target effects, which can be achieved using a suitable in vivo and translational reporter system with a built-in off switch, such as PSMA.
The ideal translational molecular genetic reporter system will have several attributes, including (i) the capacity to generate high signal-to-noise ratios using widely available clinical imaging devices, (ii) the lack of immunogenicity, (iii) a high specificity for target tissues, (iv) a readily available imaging method or agent, and (v) an absent biological effect. We have chosen PSMA-[18F]DCFPyL as a reporter-probe system to mark and follow CAR T cells, as most of those attributes are fulfilled (21). PSMA, a human gene, is currently a target for imaging agents that use a variety of modalities, including PET, SPECT, optical, and MR imaging. Clinical trials—and patient management—are now being dictated by radiopharmaceuticals and optical agents that target PSMA. PSMA PET using [68Ga]PSMA-11 (38) or [18F]DCFPyL is being used worldwide to detect prostate cancer in a variety of clinical scenarios, with the latter in phase 3 trials in the United States (NCT03739684). Very high standardized uptake values and tiny lesions are identified at high sensitivity, in patients with prostate-specific antigen levels as low as 0.1 ng/ml, with those PET agents. The reasons that the PSMA radiotracers are so effective include the high number of target sites per cell (on the order of 1 × 10⁶) and the hydrophilicity of the agents minimizing off-target, soft tissue uptake and predominant renal excretion. Accordingly, we transduced this reporter to CD19 CAR T cells, enabling the visualization of clusters of cells as small as 2000 per well or in vivo (Fig. 3). A mutated version of PSMA, namely, tPSMA(N9del), did not hamper activity of the cells in vitro or in vivo (Fig. 2 and fig. S1).
An unexpected finding in this study was the heterogeneity of CAR T cell kinetics demonstrated by the genetically identical animals that received the cells. In most animals, we could visualize the CAR T cells at the location of the fLuc-tagged tumor cells by day 12 after injection of the T cells (Fig. 4). However, in some animals, no cells could be seen at the tumor site initially, but cells could be seen very early (day 5) within the bone marrow, only to migrate later to the tumor (Fig. 4). These animals developed tumors in the bone marrow visualized by BLI, and the infused CAR T cells showed preference to infiltrate into these bone marrow tumors. Although the reason for that preference is presently unclear, one can imagine even greater heterogeneity in the clinical setting, which, if monitored in real time, could be used to tune the therapy to the individual T cell kinetics of the patient.
Speaking to the clinical relevance of our findings in the murine model, the number of CAR T cells within mouse tumors, which were readily visualized by PET/CT, was similar to that found in human biopsy specimens from the TRANSCEND trial (Fig. 5). This finding is also reflected in the fact that the CD19-tPSMA(N9del) CAR T cells proved very effective in this experimental model when a full complement of CAR T cells was infused rather than the subcurative test dose shown in Fig. 2, which was administered to stress the system, i.e., to prove that, at even low doses of CAR T cells, the tumor cell killing ability would not be compromised.
Companion diagnostics for cancer therapy, including blood biomarkers such as circulating tumor DNA or cells, lack in their ability to report on activity at the site of interest, namely, within the tumor. Imaging biomarkers not only enable visualization of target and/or effector drugs or cells but also allow for direct therapeutic intervention by other means, e.g., surgery or stereotactic radiation. The lack of correlation between CAR T cells extracted from the peripheral blood or the bone marrow and from those measured within the tumor further underscores the importance of directly imaging the administered T cells (Fig. 6). Peripheral markers of CAR T cell presence only enable inference as to activity at the tumor. Furthermore, the ability to image CAR T cells at the tumor indicates that the cells are alive and maintain the capacity for clonal expansion or that they could not be imaged by this genetically encoded reporter.
There are limitations to the PSMA reporter approach for cell tracking. First, despite being a cell surface enzyme, PSMA is imaged using high-affinity inhibitors, as if it were a receptor. The tPSMA(N9del) used here was developed specifically to eliminate the known cell internalization and turnover capability of PSMA to mitigate any potential effect on the biology of the CAR T cells. This places a theoretical limit on the sensitivity achievable, as PSMA will not concentrate the imaging agent within cells, i.e., amplify signal, as it is not an enzyme that turns over imaging substrate nor is it serving as a transporter in our instance. Nevertheless, we showed previously that it performed at least as well and even outperformed hNIS and the HSV1-sr39tk reporter systems when compared in vivo head to head (21). Second, because the PSMA-targeted imaging agents primarily undergo renal excretion, there is a strong signal in the kidneys unrelated to the presence of CAR T cells. CAR T cells in or near the kidneys may be missed using the PSMA reporter.
The clinical translation of the PSMA reporter system for CAR T cell imaging, particularly for CD19-expressing malignancies, would be relatively straightforward. The specificity of PSMA-targeted imaging agents is very high (>90%), pitfalls of imaging with these agents have been published, and systems of reporting imaging findings have appeared, clearing a path for translation. As noted above, these agents are now offered worldwide and are proliferating. CAR T cell therapy is likewise seeing increasing use clinically and in an expanding number of indications. Also proliferating worldwide in clinical trials are PSMA-targeted radiotherapeutics, such as [177]Lu-PSMA-617 (39), which are designed to kill PSMA-expressing cells and can be used as an off-switch if the CAR T cell therapy begins to prove toxic in a given patient, as has been demonstrated for some (10, 11, 40). Imbued with the positive attributes noted above, the PSMA reporter–probe system is ideal for translation to manage patients undergoing CAR T cell therapy, as well as for other indications that require cell tracking in vivo.
MATERIALS AND METHODS
CAR T cells
T cells were obtained from peripheral blood apheresis samples from consenting healthy donor adults. CD4+ and CD8+ T cell populations were isolated from the samples via immunoaffinity-based enrichment, activated in a ratio of 1:1, transduced with a lentiviral vector encoding the various CD19-specific CAR constructs, and then expanded. All CAR constructs used the CD19-directed fmc63 scFv on an IgG4 hinge, CD28 transmembrane domain, CD3ζ stimulatory domain, and 4-1BB costimulatory domain. Cells were then cryopreserved, stored at temperatures below −130°C, and thawed before use. To account for any variability in transduction efficiency, numbers of transduced cells were normalized across all experiments.
In vitro CAR T cell immunophenotyping
CAR T cells were stained with a Live/Dead Fixable Near-IR stain (Thermo Fisher Scientific, Waltham, MA, USA) for 15 min, followed by a phosphate-buffered saline (PBS) wash and incubation with a ChromPure Human IgG blocking solution (Jackson ImmunoResearch Laboratories, West Grove, PA, USA) for 5 min. An antibody cocktail containing anti-PSMA antibody (clone LNI-17; BioLegend, San Diego, CA, USA), anti-EGFRt (Erbitux; Lilly, Indianapolis, IN, USA), anti-CD4 (clone OKT4; BioLegend), anti-CD8 (clone RPA-T8; BioLegend), and an in-house–generated anti-idiotypic antibody to detect the CAR was added for 20 min. Cells were then washed twice with staining buffer (BioLegend) and analyzed on a NovoCyte cytometer (ACEA Biosciences, San Diego, CA, USA). Data analysis was performed using FlowJo v10.1 software (Tree Star, Ashland, OR, USA).
Ex vivo flow cytometric analysis
After euthanasia in a CO2 chamber, the peripheral blood was taken by cardiac puncture, and the bone marrow was taken from the femurs. Red blood cells (RBCs) were removed by RBC lysis buffer (BioLegend, San Diego, CA, USA). Cells were stained with α-PSMA antibody (catalog no. Ab77228, Abcam), α-hCD3 antibody (catalog no. 300330, BioLegend), α-CAR antibody (JRP0295, Juno Therapeutics), and 7-AAD (catalog no. 00-6993-50, eBioscience). Cells were analyzed with the BD LSR II Flow Cytometer using FACSDiva software (BD Biosciences). Obtained data were analyzed with FlowJo software (Tree Star).
In vitro cytotoxicity assay
K562 target cells were transduced with human CD19 and NucLight Red (Essen BioScience, Ann Arbor, MI, USA) and cocultured with various engineered T cells. Cytolytic activity was assessed by measuring the loss of viable target cells over a period of 3 days, as determined by red fluorescence signal (IncuCyte Live Cell Analysis System, Essen BioScience). The number of NLR+ target cells was determined every 2 hours. Normalized target cell numbers were generated by dividing target cell counts to cell counts at the start of each culture. To capture the cytolytic activity of CAR T cells against target cells over time, the area under the curve (AUC) was calculated. Where described, the “kill index” is the value.
Animal models
Animal studies were performed in strict accordance with the regulations of the Johns Hopkins Animal Care and Use Committee and Omeros’ Animal Care and Use Committee. NOD.Cg-PrkdcscidIL-2rgtm1Wjl/SzJ mice (NSG) (the Jackson Laboratory, Bar Harbor, ME, USA) mice were injected either intravenously or subcutaneously with CD19+ Nalm6 tumor cells (DSMZ, Braunschweig, Germany) that were engineered as per the manufacturer’s protocol to express enhanced green fluorescent protein (eGFP) and fLuc (PerkinElmer, Hopkinton, MA, USA) (Nalm6-eGFP-fLuc). In the Nalm6 intravenously administered model, tumor engraftment was allowed to occur for 4 days and verified using BLI. On day 4, mice received a single intravenous injection of mock, CD19-EGFRt, or CD19-tPSMA(N9del) CAR T cells. In the Nalm6 subcutaneously disseminated model, spontaneous metastatic lesions develop. Tumor engraftment was verified using BLI. On day 21 after tumor implantation, mice received a single intravenous injection of mock, CD19-EGFRt, or CD19-tPSMA(N9del) CAR T cells.
CAR T cell IHC and image analysis
Tumor biopsies were collected from patients enrolled in the TRANSCEND NHL-001 trial (NCT02631044) 7 to 14 days after JCAR017 administration. Biopsies were fixed, embedded, and sectioned following standard histology practices. Pathology review of hematoxylin and eosin (H&E) staining confirmed tissue quality and identified tumor areas. CAR T cells were identified as CD3+EGFR+ cells as part of a larger 5-plex immunofluorescence assay run on the Ventana Ultra. Antibodies used were anti-CD3 (clone 2GVF, Ventana) and anti-EGFR (clone 31G7, Invitrogen) stained at final slide concentrations of 0.4 and 0.3 μg/ml, respectively.
Whole slide images (40×) were acquired with a panorama scanner and analyzed using HALO software (Indica labs). Images were inspected and approved for image analysis. The full dataset was split into training and test sets for parameter setup. Parameter tuning and positive cell identification and detection were performed with a pathologist. Image analysis processing was performed on the test set and exported for data analysis in JMP (SAS).
In vitro phantom study
One million CD19-tPSMA(N9del) CAR T cells were incubated with 74 MBq of [18F]DCFPyL in 1 ml of PBS at 37°C for 30 min, followed by two washes with PBS. Stained CD19-tPSMA(N9del) CAR T cells were plated in 384-well plates with serial dilutions from 40,000 to 200 cells in 20 μl of PBS. The plate was scanned with the SuperArgus small-animal PET/CT scanner (Sedecal, Madrid, Spain) at an energy window of 250 to 700 keV for 5 min (n = 8). Images were processed with Amide software (Dice Holdings Inc., NY, USA). A standard curve was generated with total voxel values per number of cells. [18F]DCFPyL was obtained from the Johns Hopkins University PET Center as the residual tracer from the clinical preparation, the synthesis of which has been previously described (29).
In vivo (live mouse) phantom study
NOD/SCID mice were subcutaneously injected with the indicated number of CD19-tPSMA(N9del) CAR T cells in 50 μl (50% Matrigel, Corning) into upper flank regions bilaterally. Mice were injected with 14.8 MBq of [18F]DCFPyL 30 min after injection of the cells. A whole-body, two-bed position PET/CT scan was performed using the SuperArgus scanner (Sedecal) with PET acquisition time of 5 min per bed position. The PET/CT images were processed using PMOD (v3.7; PMOD Technologies Ltd., Zurich, Switzerland). The PET images were first registered to the corresponding CT images of each mouse. The signal in the images due to renal uptake and bladder concentration of [18F]DCFPyL was masked for display using a thresholding method, where voxels inside the kidneys and the bladder with intensities higher than 2 to 5% of the maximum intensity were set to zero. After this, maximum intensity projections of the processed images were then generated as shown in Figs. 3, 4, and 6.
In vivo tracking of CD19 CAR T cells in animal models of human CD19-expressing leukemia
NSG mice were subcutaneously injected with 1 × 10⁶ Nalm6-eGFP-fLuc cells. When tumor volumes reached ~350 mm3, mice were injected with 2 × 10⁶ CD19-tPSMA(N9del) CAR T cells. PET/CT imaging was performed as described above. Mice were euthanized on indicated dates, and the tumor, peripheral blood, and bone marrow were taken for further analyses.
IHC of Nalm6 tumors
Tumors were fixed in 10% formalin solution for 24 hours. Fixed tumors were embedded in paraffin blocks and cut on a glass slide as 4-μm sections. Slides were deparaffinized, rehydrated, and permeabilized in a target retrieval solution (Dako, Carpinteria, CA, USA). Slides were blocked for nonspecific binding by adding the Dual Endogenous Block (Dako). Slides were incubated with primary antibodies at 4°C overnight [α-PSMA (Dako), 1:50; α-eGFR (Rockland), 1:500]. Slides were incubated with EnVision+ Kits (Dako) and visualized with DAB Chromogen (Dako EnVision+ Kits) according to the manufacturer’s instructions. Last, slides were counterstained with H&E, dehydrated, and covered. Slides were scanned using ScanScope CS (Leica Biosystems Aperio, Buffalo Grove, IL, USA) with ×40 magnification, and images were processed with ImageScope software (Leica Biosystems Aperio).
Supplementary Material
Acknowledgments
We thank Juno Therapeutics Viral Vector Core for the production of lentiviral constructs. Funding: We thank Juno Therapeutics, NIH R01 CA134675, and NIH P41 EB024495 for the financial support. Author contributions: I.M. designed and performed the experiments, analyzed the data, and wrote and revised the manuscript. D.J.H. designed the experiments, analyzed the data, and wrote and revised the manuscript. H.-H.A., T.M.C., and A.P. performed the experiments and analyzed the data. J.J. performed the experiments, analyzed the data, and wrote the manuscript. M.B., S.P.R., and P.S.-S. performed the experiments. Y.D. performed the experiments and analyzed the data; H.I.L. conceived the study, designed the experiments, analyzed the data, and wrote and revised the manuscript. M.G.P. conceived the study, designed the experiments, analyzed the data, and wrote and revised the manuscript. Competing interests: D.J.H., I.M., H.I.L., and M.G.P. are listed as inventors on a pending patent application related to this work (PCT/US2018/026619, published 11 October 2018). M.G.P. is a co-inventor on a U.S. patent covering [18F]DCFPyL and as such is entitled to a portion of any licensing fees and royalties generated by this technology. This arrangement has been reviewed and approved by the Johns Hopkins University in accordance with its conflict-of-interest policies. All other authors declare that they have no competing interests. Data and materials availability: All data needed to evaluate the conclusions in the paper are present in the paper and/or the Supplementary Materials. Additional data related to this paper may be requested from the authors.
SUPPLEMENTARY MATERIALS
Supplementary material for this article is available at http://advances.sciencemag.org/cgi/content/full/5/7/eaaw5096/DC1
Fig. S1. DCFPyL does not affect CD19-tPSMA(N9del) CAR T cells in vitro.
REFERENCES AND NOTES
- 1.Kochenderfer J. N., Wilson W. H., Janik J. E., Dudley M. E., Stetler-Stevenson M., Feldman S. A., Maric I., Raffeld M., Nathan D.-A., Lanier B. J., Morgan R. A., Rosenberg S. A., Eradication of B-lineage cells and regression of lymphoma in a patient treated with autologous T cells genetically engineered to recognize CD19. Blood 116, 4099–4102 (2010). [DOI] [PMC free article] [PubMed] [Google Scholar]
- 2.Porter D. L., Levine B. L., Kalos M., Bagg A., June C. H., Chimeric antigen receptor-modified T cells in chronic lymphoid leukemia. N. Engl. J. Med. 365, 725–733 (2011). [DOI] [PMC free article] [PubMed] [Google Scholar]
- 3.Brentjens R. J., Davila M. L., Riviere I., Park J., Wang X., Cowell L. G., Bartido S., Stefanski J., Taylor C., Olszewska M., Borquez-Ojeda O., Qu J., Wasielewska T., He Q., Bernal Y., Rijo I. V., Hedvat C., Kobos R., Curran K., Steinherz P., Jurcic J., Rosenblat T., Maslak P., Frattini M., Sadelain M., CD19-targeted T cells rapidly induce molecular remissions in adults with chemotherapy-refractory acute lymphoblastic leukemia. Sci. Transl. Med. 5, 177ra38 (2013). [DOI] [PMC free article] [PubMed] [Google Scholar]
- 4.Grupp S. A., Kalos M., Barrett D., Aplenc R., Porter D. L., Rheingold S. R., Teachey D. T., Chew A., Hauck B., Wright J. F., Milone M. C., Levine B. L., June C. H., Chimeric antigen receptor-modified T cells for acute lymphoid leukemia. N. Engl. J. Med. 368, 1509–1518 (2013). [DOI] [PMC free article] [PubMed] [Google Scholar]
- 5.Milone M. C., Bhoj V. G., The Pharmacology of T cell therapies. Mol. Ther. Methods Clin. Dev. 8, 210–221 (2018). [DOI] [PMC free article] [PubMed] [Google Scholar]
- 6.Srivastava S., Riddell S. R., Engineering CAR-T cells: Design concepts. Trends Immunol. 36, 494–502 (2015). [DOI] [PMC free article] [PubMed] [Google Scholar]
- 7.Ali S. A., Shi V., Maric I., Wang M., Stroncek D. F., Rose J. J., Brudno J. N., Stetler-Stevenson M., Feldman S. A., Hansen B. G., Fellowes V. S., Hakim F. T., Gress R. E., Kochenderfer J. N., T cells expressing an anti–B-cell maturation antigen chimeric antigen receptor cause remissions of multiple myeloma. Blood 128, 1688–1700 (2016). [DOI] [PMC free article] [PubMed] [Google Scholar]
- 8.Mueller K. T., Maude S. L., Porter D. L., Frey N., Wood P., Han X., Waldron E., Chakraborty A., Awasthi R., Levine B. L., Melenhorst J. J., Grupp S. A., June C. H., Lacey S. F., Cellular kinetics of CTL019 in relapsed/refractory B-cell acute lymphoblastic leukemia and chronic lymphocytic leukemia. Blood 130, 2317–2325 (2017). [DOI] [PMC free article] [PubMed] [Google Scholar]
- 9.Kochenderfer J. N., Somerville R. P. T., Lu T., Yang J. C., Sherry R. M., Feldman S. A., McIntyre L., Bot A., Rossi J., Lam N., Rosenberg S. A., Long-duration complete remissions of diffuse large B cell lymphoma after anti-CD19 chimeric antigen receptor T cell therapy. Mol. Ther. 25, 2245–2253 (2017). [DOI] [PMC free article] [PubMed] [Google Scholar]
- 10.Hay K. A., Hanafi L.-A., Li D., Gust J., Liles W. C., Wurfel M. M., López J. A., Chen J., Chung D., Harju-Baker S., Cherian S., Chen X., Riddell S. R., Maloney D. G., Turtle C. J., Kinetics and biomarkers of severe cytokine release syndrome after CD19 chimeric antigen receptor–modified T-cell therapy. Blood 130, 2295–2306 (2017). [DOI] [PMC free article] [PubMed] [Google Scholar]
- 11.Gust J., Hay K. A., Hanafi L. A., Li D., Myerson D., Gonzalez-Cuyar L. F., Yeung C., Liles W. C., Wurfel M., Lopez J. A., Chen J., Chung D., Harju-Baker S., Ozpolat T., Fink K. R., Riddell S. R., Maloney D. G., Turtle C. J., Endothelial activation and blood–brain barrier disruption in neurotoxicity after adoptive immunotherapy with CD19 CAR-T cells. Cancer Discov. 7, 1404–1419 (2017). [DOI] [PMC free article] [PubMed] [Google Scholar]
- 12.Emami-Shahri N., Papa S., Dynamic imaging for CAR-T-cell therapy. Biochem. Soc. Trans. 44, 386–390 (2016). [DOI] [PubMed] [Google Scholar]
- 13.Chapelin F., Gao S., Okada H., Weber T. G., Messer K., Ahrens E. T., Fluorine-19 nuclear magnetic resonance of chimeric antigen receptor T cell biodistribution in murine cancer model. Sci. Rep. 7, 17748 (2017). [DOI] [PMC free article] [PubMed] [Google Scholar]
- 14.Emami-Shahri N., Foster J., Kashani R., Gazinska P., Cook C., Sosabowski J., Maher J., Papa S., Clinically compliant spatial and temporal imaging of chimeric antigen receptor T-cells. Nat. Commun. 9, 1081 (2018). [DOI] [PMC free article] [PubMed] [Google Scholar]
- 15.Keu K. V., Witney T. H., Yaghoubi S. S., Rosenberg J., Kurien A., Magnusson R., Williams J., Habte F., Wagner J. R., Forman S., Brown C., Allen-Auerbach M., Czernin J., Tang W., Jensen M. D., Badie B., Gambhir S. S., Reporter gene imaging of targeted T cell immunotherapy in recurrent glioma. Sci. Transl. Med. 9, eaag2196 (2017). [DOI] [PMC free article] [PubMed] [Google Scholar]
- 16.Vedyvas Y., Shevlin E., Zaman M., Min I. M., Amor-Coarasa A., Park S., Park S., Kwon K.-W., Smith T., Luo Y., Kim D., Kim Y., Law B., Ting R., Babich J., Jin M. M., Longitudinal PET imaging demonstrates biphasic CAR T cell responses in survivors. JCI Insight 1, e90064 (2016). [DOI] [PMC free article] [PubMed] [Google Scholar]
- 17.Wei W., Jiang D., Ehlerding E. B., Luo Q., Cai W., Noninvasive PET Imaging of T cells. Trends Cancer 4, 359–373 (2018). [DOI] [PMC free article] [PubMed] [Google Scholar]
- 18.Zhang Y., Bressler J. P., Neal J., Lal B., Bhang H.-E., Laterra J., Pomper M. G., ABCG2/BCRP expression modulates D-Luciferin–based bioluminescence imaging. Cancer Res. 67, 9389–9397 (2007). [DOI] [PubMed] [Google Scholar]
- 19.Lee S. B., Lee H. W., Lee H. J., Jeon Y. H., Lee S.-W., Ahn B.-C., Jeong S. Y., Tracking dendritic cell migration into lymph nodes by using a novel PET probe 18F-tetrafluoroborate for sodium/iodide symporter. EJNMMI Res. 7, 32 (2017). [DOI] [PMC free article] [PubMed] [Google Scholar]
- 20.Bhanat E., Koch C. A., Parmar R., Garia V., Vijayakumar V., Somatostatin receptor expression in non-classical locations—Clinical relevance? Rev. Endocr. Metab. Disord. 19, 123–132 (2018). [DOI] [PubMed] [Google Scholar]
- 21.Castanares M. A., Mukherjee A., Chowdhury W. H., Liu M., Chen Y., Mease R. C., Wang Y., Rodriguez R., Lupold S. E., Pomper M. G., Evaluation of prostate-specific membrane antigen as an imaging reporter. J. Nucl. Med. 55, 805–811 (2014). [DOI] [PMC free article] [PubMed] [Google Scholar]
- 22.Sweat S. D., Pacelli A., Murphy G. P., Bostwick D. G., Prostate-specific membrane antigen expression is greatest in prostate adenocarcinoma and lymph node metastases. Urology 52, 637–640 (1998). [DOI] [PubMed] [Google Scholar]
- 23.Silver D. A., Pellicer I., Fair W. R., Heston W. D., Cordon-Cardo C., Prostate-specific membrane antigen expression in normal and malignant human tissues. Clin. Cancer Res. 3, 81–85 (1997). [PubMed] [Google Scholar]
- 24.Szabo Z., Mena E., Rowe S. P., Plyku D., Nidal R., Eisenberger M. A., Antonarakis E. S., Fan H., Dannals R. F., Chen Y., Mease R. C., Vranesic M., Bhatnagar A., Sgouros G., Cho S. Y., Pomper M. G., Initial evaluation of [18F]DCFPyL for prostate-specific membrane antigen (PSMA)-targeted PET imaging of prostate cancer. Mol. Imaging Biol. 17, 565–574 (2015). [DOI] [PMC free article] [PubMed] [Google Scholar]
- 25.Rowe S. P., Macura K. J., Mena E., Blackford A. L., Nadal R., Antonarakis E. S., Eisenberger M., Carducci M., Fan H., Dannals R. F., Chen Y., Mease R. C., Szabo Z., Pomper M. G., Cho S. Y., PSMA-based [18F]DCFPyL PET/CT is superior to conventional imaging for lesion detection in patients with metastatic prostate cancer. Mol. Imaging Biol. 18, 411–419 (2016). [DOI] [PMC free article] [PubMed] [Google Scholar]
- 26.Werner R. A., Bundschuh R. A., Budndschuh L., Javadi M. S., Leal J. P., Higuchi T., Pienta K. J., Buck A. K., Pomper M. G., Gorin M. A., Lapa C., Rowe S. P., Interobserver agreement for the standardized reporting system PSMA-RADS 1.0 on 18F-DCFPyL PET/CT Imaging. J. Nucl. Med. 59, 1857–1864 (2018). [DOI] [PMC free article] [PubMed] [Google Scholar]
- 27.Rowe S. P., Pienta K. J., Pomper M. G., Gorin M. A., PSMA-RADS version 1.0: A step towards standardizing the interpretation and reporting of PSMA–targeted PET imaging studies. Eur. Urol. 73, 485–487 (2018). [DOI] [PMC free article] [PubMed] [Google Scholar]
- 28.Rowe S. P., Pienta K. J., Pomper M. G., Gorin M. A., Proposal for a structured reporting system for prostate-specific membrane antigen–targeted PET imaging: PSMA-RADS version 1.0. J. Nucl. Med. 59, 479–485 (2018). [DOI] [PMC free article] [PubMed] [Google Scholar]
- 29.Ravert H. T., Holt D. P., Chen Y., Mease R. C., Fan H., Pomper M. G., Dannals R. F., An improved synthesis of the radiolabeled prostate-specific membrane antigen inhibitor, [18F]DCFPyL. J. Labelled Comp. Radiopharm. 59, 439–450 (2016). [DOI] [PMC free article] [PubMed] [Google Scholar]
- 30.Rajasekaran S. A., Anilkumar G., Oshima E., Bowie J. U., Liu H., Heston W., Bander N. H., Rajasekaran A. K., A novel cytoplasmic tail MXXXL motif mediates the internalization of prostate-specific membrane antigen. Mol. Biol. Cell 14, 4835–4845 (2003). [DOI] [PMC free article] [PubMed] [Google Scholar]
- 31.Turtle C. J., Hanafi L.-A., Berger C., Gooley T. A., Cherian S., Hudecek M., Sommermeyer D., Melville K., Pender B., Budiarto T. M., Robinson E., Steevens N. N., Chaney C., Soma L., Chen X., Yeung C., Wood B., Li D., Cao J., Heimfeld S., Jensen M. C., Riddell S. R., Maloney D. G., CD19 CAR-T cells of defined CD4+:CD8+ composition in adult B cell ALL patients. J. Clin. Invest. 126, 2123–2138 (2016). [DOI] [PMC free article] [PubMed] [Google Scholar]
- 32.Zhao Z., Condomines M., van der Stegen S. J. C., Perna F., Kloss C. C., Gunset G., Plotkin J., Sadelain M., Structural design of engineered costimulation determines tumor rejection kinetics and persistence of CAR T cells. Cancer Cell 28, 415–428 (2015). [DOI] [PMC free article] [PubMed] [Google Scholar]
- 33.Chen Y., Pullambhatla M., Byun Y., Foss C. A., Nimmagadda S., Senthamizhchelvan S., Sgouros G., Mease R. C., Pomper M. G., 2-(3-{1carboxy-5-[(6-[18F]fluoro-pyridine-3-carbonyl)-amino]-pentyl}-ureido)-pentanedioic acid, [18F]DCFPyL, a PSMA-based PET imaging agent for prostate cancer. Clin. Cancer Res. 17, 7645–7653 (2011). [DOI] [PMC free article] [PubMed] [Google Scholar]
- 34.Dietlein M., Kobe C., Kuhnert G., Stockter S., Fischer T., Schomacker K., Schmidt M., Dietlein F., Zlatopolskiy B. D., Krapf P., Richarz R., Neubauer S., Drzezga A., Neumaier B., Comparison of [18F]DCFPyL and [68Ga]Ga-PSMA-HBED-CC for PSMA-PET imaging in patients with relapsed prostate cancer. Mol. Imaging Biol. 17, 575–584 (2015). [DOI] [PMC free article] [PubMed] [Google Scholar]
- 35.Robu S., Schmidt A., Eiber M., Schottelius M., Günther T., Hooshyar Yousefi B., Schwaiger M., Wester H.-J., Synthesis and preclinical evaluation of novel 18F-labeled Glu-urea-Glu-based PSMA inhibitors for prostate cancer imaging: A comparison with 18F-DCFPyl and 18F-PSMA-1007. EJNMMI Res. 8, 30 (2018). [DOI] [PMC free article] [PubMed] [Google Scholar]
- 36.Bouchkouj N., Kasamon Y. L., de Claro R. A., George B., Lin X., Lee S., Blumenthal G. M., Bryan W., McKee A. E., Pazdur R., FDA approval summary: Axicabtagene ciloleucel for relapsed or refractory large B-cell lymphoma. Clin. Cancer Res. 25, 1702–1708 (2018). [DOI] [PubMed] [Google Scholar]
- 37.Morgan M. A., Schambach A., Engineering CAR-T cells for improved function against solid tumors. Front. Immunol. 9, 2493 (2018). [DOI] [PMC free article] [PubMed] [Google Scholar]
- 38.Calais J., Fendler W. P., Eiber M., Gartmann J., Chu F. I., Nickols N. G., Reiter R. E., Rettig M. B., Marks L. S., Ahlering T. E., Huynh L. M., Slavik R., Gupta P., Quon A., Allen-Auerbach M. S., Czernin J., Herrmann K., Impact of 68Ga-PSMA-11 PET/CT on the management of prostate cancer patients with biochemical recurrence. J. Nucl. Med. 59, 434–441 (2018). [DOI] [PMC free article] [PubMed] [Google Scholar]
- 39.Emmett L., Crumbaker M., Ho B., Willowson K., Eu P., Ratnayake L., Epstein R., Blanksby A., Horvath L., Guminski A., Mahon K., Gedye C., Yin C., Stricker P., Joshua A. M., Results of a prospective phase 2 pilot trial of 177Lu–PSMA-617 therapy for metastatic castration-resistant prostate cancer including imaging predictors of treatment response and patterns of progression. Clin. Genitourin. Cancer (2018). [DOI] [PubMed] [Google Scholar]
- 40.Gust J., Taraseviciute A., Turtle C. J., Neurotoxicity associated with CD19-targeted CAR-T cell therapies. CNS Drugs 32, 1091–1101 (2018). [DOI] [PMC free article] [PubMed] [Google Scholar]
Associated Data
This section collects any data citations, data availability statements, or supplementary materials included in this article.
Supplementary Materials
Supplementary material for this article is available at http://advances.sciencemag.org/cgi/content/full/5/7/eaaw5096/DC1
Fig. S1. DCFPyL does not affect CD19-tPSMA(N9del) CAR T cells in vitro.