Abstract
Background/Aim: In 2016 in the United States, 7 of 10 patients were estimated to die following lung cancer diagnosis. This is due to a lack of a reliable screening method that detects early-stage lung cancer. Our aim is to accurately detect early stage lung cancer using algorithms and protein biomarkers. Patients and Methods: A total of 1,479 human plasma samples were processed using a multiplex immunoassay platform. 82 biomarkers and 6 algorithms were explored. There were 351 NSCLC samples (90.3% Stage I, 2.3% Stage II, and 7.4% Stage III/IV). Results: We identified 33 protein biomarkers and developed a classifier using Random Forest. Our test detected early-stage Non-Small Cell Lung Cancer (NSCLC) with a 90% accuracy, 80% sensitivity, and 95% specificity in the validation set using the 33 markers. Conclusion: A specific, non-invasive, early-detection test, in combination with low-dose computed tomography, could increase survival rates and reduce false positives from screenings.
Keywords: Early stage lung cancer, biomarkers, proteomics, immunoassay, detection, diagnosis, non-small cell lung cancer
According to the American Cancer Society, on a global scale, lung cancer is the leading cause of cancer-related incidence and death at 2.09 million cases and 1.76 million deaths in 2018 (1). By 2016, in the US, an estimated 538,243 living individuals were diagnosed with lung and bronchus cancer (2). An additional 228,150 new cases with an estimated 142,670 deaths are expected in 2019 (3).
Lung cancer originates in the lungs, but can metastasize to other organs in the body. It is classified based on the histological profile of the tumor cell and predominantly falls into two major categories: i) small cell lung cancer (SCLC, 13%) and ii) non-small cell lung cancer (NSCLC, 84%) (3). Detection at Stage I or II for NSCLC can offer good prognosis.
Symptoms and detection. Current methods of detecting lung cancer include a chest x-ray (CXR), computed tomography (CT) scan, magnetic resonance imaging (MRI), positron emission tomography (PET) scan, sputum analysis, and lung biopsy. Despite the advancement in technology and the extensive cancer research, 57% of lung cancer patients are diagnosed only after a tumor has metastasized to a different location. Under these circumstances, there is little chance of a cure, and the 5-year survival rate is less than 6% (2). Late diagnosis of lung cancer can be attributed to: i) primarily the lack of symptoms at early-stage lung cancer (4) ii) misdiagnosis of the disease since early symptoms (persistent cough, shortness of breath, chest pain, wheezing, and hemoptysis) are often misinterpreted (5) iii) the lack of proven benefit for lung cancer screening until recently (6), and iv) cost effect and limited access to state-of-the-art detection methods in indigent populations (7).
It is evident that the sooner lung cancer is diagnosed, the better the prognosis for the patient. However, only 16% of patients were diagnosed when the disease was still restricted to the lungs and even for these, only 57.4% survived 5 years (8). Based on the 2016 Cancer Statistics Review by SEER (8), the 5-year survival rate decreased to 30.8% and 5.2% for patients with regional and distant stage lung cancer, respectively. Only 19.4% of all diagnosed lung cancer patients from 2009-2015 survived 5 years.
NLST clinical trial. In 2010, a US clinical trial, sponsored by the National Lung Screening Trial (NLST), showed a 20% decrease in lung cancer deaths for high-risk patients who were screened with low-dose spiral computed tomography (LDCT scans) compared to standard chest x-ray (CXR). The NLST patient population consisted of 53,454 current or former smokers with a ≥30 pack-year smoking history between 55-74 years of age and no history or symptoms of lung cancer. The results of the NLST study (9,10) were:
i) patient adherence rate to screening was greater than 90%,
ii) the rate of positive screen tests was 24.2% with LDCT and 6.9% with radiography,
iii) false positive rates (lung mass) were 96.4% for the LDCT and 94.5% for the CXR screened group,
iv) the mortality rate from lung cancer was 20% lower with LDCT compared to the CXR screened group
v) the rate of death from any cause was 6.7% lower with LDCT compared to the CXR screened group.
We had a few caveats concerning the NLST study. First, due to the substantial pack history of the NLST participants, it was not known whether these findings were relevant to individuals who were non-smokers or those who smoked less. Second, screening using LDCT and radiography showed a high rate of false positives which can lead to unnecessary lung biopsy, surgery, other follow-up diagnostic tests, and stress. Additional factors associated with LDCT and radiography screening that warrants further exploration include: i) the economic implications of over diagnosis, ii) the radiation exposure from multiple scans may lead to development of other cancers, and iii) the access to high-quality screening in certain settings.
Based on the NLST study, there is clearly a need for an accurate, early-stage, non-invasive test to further stratify risk patients with small, indeterminate nodules primarily identified using CT scanning. Our study aimed to identify potential biomarkers and an algorithm to predict early stage NSCLC with high accuracy using human plasma samples for use as an adjunctive test for lung cancer screening.
Patients and Methods
The patients from our selected population for the Lung Cancer Detector Test-1 (LCDT1) were 40+ years old, long-term smokers, and had been diagnosed with indeterminate nodules in the lungs.
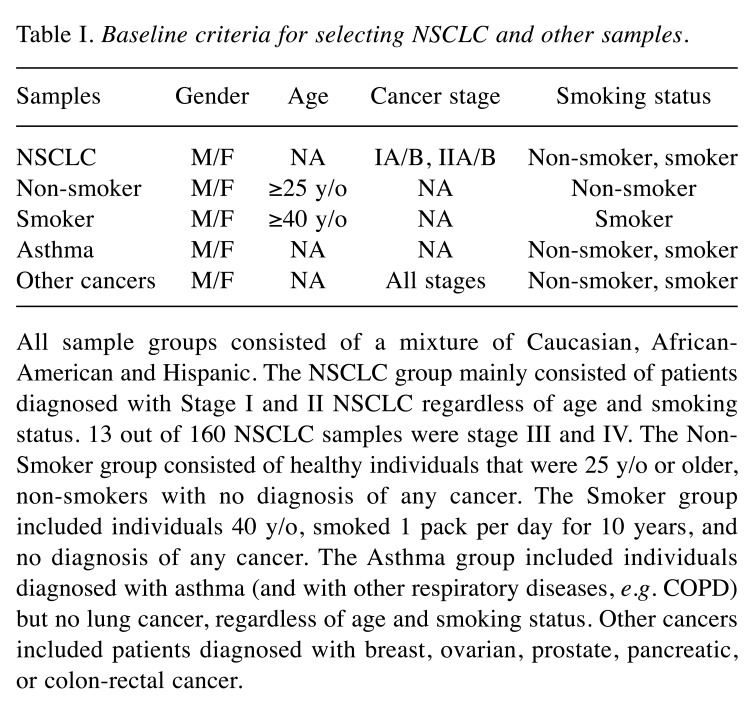
Study population. This study consisted of 1,479 subjects (2,958 samples) distributed in the following cohorts: i) asthma sufferers, ii) non-smokers, iii) smokers, iv) NSCLC, and v) other cancers. Asthma (also includes other respiratory diseases, e.g. chronic obstructive pulmonary disease (COPD)) was included in the study population as symptoms share similarities with early signs of lung cancer. Other cancers (e.g. breast, prostate, ovarian, pancreatic, and colorectal cancer) were included to evaluate specificity to lung cancer. Table I summarizes the main criteria used to select samples for each cohort. Samples originated from Bulgaria, Romania, Russia, Ukraine and the United States and consisted of a mixture of Caucasian, African-American, and Hispanic populations.
Table I. Baseline criteria for selecting NSCLC and other samples.
All sample groups consisted of a mixture of Caucasian, African-American and Hispanic. The NSCLC group mainly consisted of patients diagnosed with Stage I and II NSCLC regardless of age and smoking status. 13 out of 160 NSCLC samples were stage III and IV. The Non-Smoker group consisted of healthy individuals that were 25 y/o or older, non-smokers with no diagnosis of any cancer. The Smoker group included individuals 40 y/o, smoked 1 pack per day for 10 years, and no diagnosis of any cancer. The Asthma group included individuals diagnosed with asthma (and with other respiratory diseases, e.g. COPD) but no lung cancer, regardless of age and smoking status. Other cancers included patients diagnosed with breast, ovarian, prostate, pancreatic, or colon-rectal cancer.
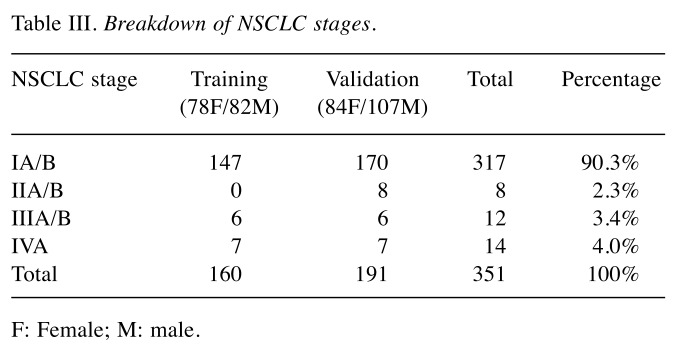
Training set. The training set consisted of 554 Subjects (1,108 samples) ran in duplicates to evaluate 82 biomarkers and 6 multivariate analysis methods and to train the selected algorithm. There were: i) 160 NSCLC which served as a positive control, ii) 140 healthy non-smokers which served as our negative control, iii) 33 asthma sufferers, iv) 131 high-risk smokers, and v) 90 other cancers. Protein biomarker concentrations, gender, and race were included in the analysis. Subjects ranged from 25-94 years old and were distributed between female and male cohorts as shown in Table II. Patient samples consisted predominantly of Caucasians and some African-Americans and Hispanics. Most NSCLC samples were Stage I (Table III). All samples were randomized and cohorts were distributed evenly across the total plates of the study using R and Python.
Table II. Age range and number of samples per cohort.
Table III. Breakdown of NSCLC stages.
F: Female; M: male.
Validation set. To verify the performance of the selected biomarkers and the final algorithm, a blind and independent sample set of 925 subjects (1,850 samples) was processed.
Sample collection and handling. Human plasma samples were obtained from five blood banks: Asterand, BioReclamation, BioSource, Geneticist, and Proteogenex. Clinical information, such as age, gender, pathology and stage, race, origin, smoking status, and sample collection dates, was obtained. Sample were collected and processed according the respective blood bank’s protocols. Plasma samples were transported on dry ice overnight to our storage site in Michigan City, Indiana, USA. Vials were inspected visually for damage upon receipt and were stored at –80˚C until analysis.
Selection of biomarkers. Eighty-two commercially available protein analytes were used for the initial screening. The list was narrowed down to 33 biomarkers with a diagnostic potential for early stage lung cancer: The 33 biomarkers were CA-125, CEA, CYFRA21-1, EGFR/HER1/ErBB1, Gro-Pan, HGF, IL-10, IL-12p70, IL-16, IL-2, IL-4, IL-5, IL-7, IL-8, IL-9, Leptin, LIF, MCP-1, MIF, MIG, MMP-7, MMP9, MPO, NSE, PDGF-BB, Rantes, Resistin, sFasL, SAA, sCD40-ligand, sICAM-1, TNFRI, and sTNFRII.
Our process in selecting these biomarkers included: i) a statistical importance as measured by the decrease in Gini impurity, ii) analysis of ratio of biomarker distribution between healthy and diseased states, iii) the biomarker’s overall patterns observed for specific cohorts, iv) a known biological relevance of these markers for NSCLC via a physio-pathological pathway and/or through literature, and v) the biomarkers’ performance in multiplexed system using the selected developed algorithm model.
Multiplexed immunoassay procedure. This study used a custom-made multiplexed immunoassay developed by Millipore (Billerica, MA, USA) to measure the concentration of selected biomarkers in human plasma samples. The reagent kits were designed on magnetic beads using a capture sandwich immunoassay format. The assay was performed according to the manufacturer’s protocol. Briefly, samples were thawed on ice or at 4˚C and were visually inspected for turbidity, hemolysis, lipaemia, and other signs of degradation. The plates were read using the FlexMap 3D (Luminex Technologies, Austin, TX, CA), which measures the fluorescence of the beads and of the bound SA-PE. The Bio-Plex Manager 6.1 (Bio-Rad Laboratories, Hercules, CA, USA) was used for data acquisition using a 5PL logistic curve to obtain analyte concentrations. Sample processing was performed by Eve Technologies Corporation (Calgary, Alberta, Canada).
Multivariate classification and analysis. The multivariate classification methods that were evaluated independently included the Support Vector Machine (SVM), Random Forest (RF), Penalized Regression (LASSO and Ridge Regression), Adaptive Boosting (AdaBoost), and decision rules found by Genetic Algorithms. These algorithms considered two independent measurements of 33 biomarkers from a single subject, their gender and smoking status, and classified each measurement as positive or negative for NSCLC. If any of the measurement for a plasma sample was classified as a subject with NSCLC by the algorithm, then the subject was considered positive for NSCLC. The algorithm that was selected had the best performance, as measured by its sensitivity and specificity, as well as the highest level of stability, as measured by bootstrap estimates of the algorithm’s performance.
The penalized logistic regression model. When developing predictive models based on many variables, such as the concentration of numerous biomarkers for NSCLC, logistic regression may fail due to non-convergence, (11) or it may be that regression coefficients for the parameter estimates have a large variance. By reducing the number of parameters, such as the number of biomarkers in the model, one can reduce the variance of the regression coefficients.
One way to effectively reduce the number of parameters in the model is to constrain the Lp-norm or L∞-norm of the parameter vector, β, of the model by some positive values, usually denoted as t. A form of penalized regression that allows such constraints is the least absolute shrinkage and selection operator (LASSO) model. The LASSO model adds the constraint that the L1-norm of the parameter vector, β, is no greater than some given value, t (i.e., p=1). Ridge regression is another form of penalized regression that adds the constraint that the L2-norm of the parameter vector, β, is no greater than some given value, t (e.g. t=2).
The naïve Bayes classifier. The set of Bayes classifiers are a set of classifiers based on Bayes’ theorem:
P(A/B)= P(B/A)P(A)/P(B)
All classifiers of this type seek to find the probability (P) that an observation belongs to a class (A or B) given the data for that observation. The class with the highest probability is the one to which each new observation is assigned. Theoretically, Bayes classifiers have the lowest error rates amongst the set of classifiers. In practice, however, this does not always occur due to violations of the assumptions made about the data when applying a Bayes classifier.
The naïve Bayes classifier is one example of a Bayes classifier. It simplifies the calculations of the probabilities used in classification by assuming that each class is independent of the other classes given the data. Naïve Bayes classifiers are used in many prominent anti-spam filters due to the ease of implantation and speed of classification but have the drawback that the assumptions required are rarely met in practice. Tools for implementing naïve Bayes classifiers as discussed herein are available for the statistical software computing language and environment, R. For example, the R package “e1071,” version 1.5-25, includes tools for creating, processing and using naïve Bayes classifiers.
Neural nets. One way to think of a neural net is as a weighted directed graph where the edges and their weights represent the influence each vertex has on the others to which it is connected. There are two parts to a neural net, the input layer (formed by the data) and the output layer (the values, which in this case are the classes to be predicted). Between the input layer and the output layer is a network of hidden vertices. There may be, depending on the way the neural net is designed, several vertices between the input layer and the output layer.
Neural nets are widely used in artificial intelligence and data mining, but there is the danger that the models the neural nets produce will over-fit the data (i.e. the model will fit the current data very well but will not fit future data well).
Tools for implementing neural nets as discussed herein are available for the statistical software computing language and environment, R. For example, the R package “e1071,” version 1.5-25, includes tools for creating, processing, and using neural nets.
k-Nearest neighbor classifiers. The nearest neighbor classifiers are a subset of memory-based classifiers. These are classifiers that must “remember” what is in the training set in order to classify a new observation. Nearest neighbor classifiers do not require a model to be fit. To create a k-nearest neighbor (knn) classifier, the following steps are taken:
i) Calculate the distance from the observation to be classified to each observation in the training set. The distance can be calculated using any valid metric, though Euclidian and Mahalanobis distances are often used.
ii) Count the number of observations amongst the k nearest observations that belong to each group. The group that has the highest count is the group to which the new observation is assigned.
Nearest neighbor algorithms have problems dealing with categorical data due to the requirement that a distance needs to be calculated between two points but that can be overcome by defining a distance arbitrarily between any two groups. This class of algorithm is also sensitive to changes in scale and metric. With these issues in mind, nearest neighbor algorithms can be very powerful, especially in large data sets.
Tools for implementing k-nearest neighbor classifiers as discussed herein are available for the statistical software computing language and environment, R. For example, the R package “e1071,” version 1.5-25, includes tools for creating, processing and using k-nearest neighbor classifiers.
Random forests. Classification trees are typically noisy. Random forests attempt to reduce this noise by taking the average of many trees. The result is a classifier whose error has reduced variance compared to a classification tree.
To grow a forest:
i) Use the algorithm
For b=1 to B, where B is the number of trees to be grown in the forest.
ii) Draw a bootstrap sample.
iii) Grow a classification tree, Tb on the bootstrap sample.
iv) Output the set {Tb}1 B. This set is the random forest.
To classify a new observation using the random forest, classify the new observation using each classification tree in the random forest. The class to which the new observation is classified most often amongst the classification trees is the class to which the random forest classifies the new observation. Random forests reduce many of the problems found in classification trees but at the price of interpretability.
Tools for implementing random forests as discussed herein are available for the statistical software computing language and environment, R. For example, the R package “randomForest,” version 4.6-2, includes tools for creating, processing, and using random forests.
Results
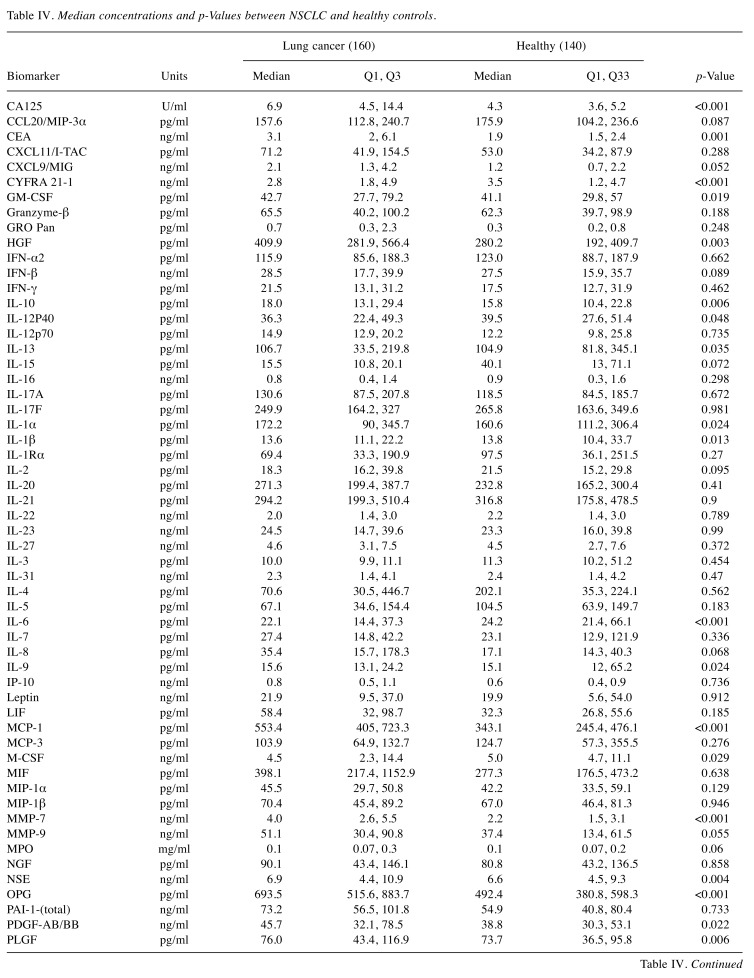
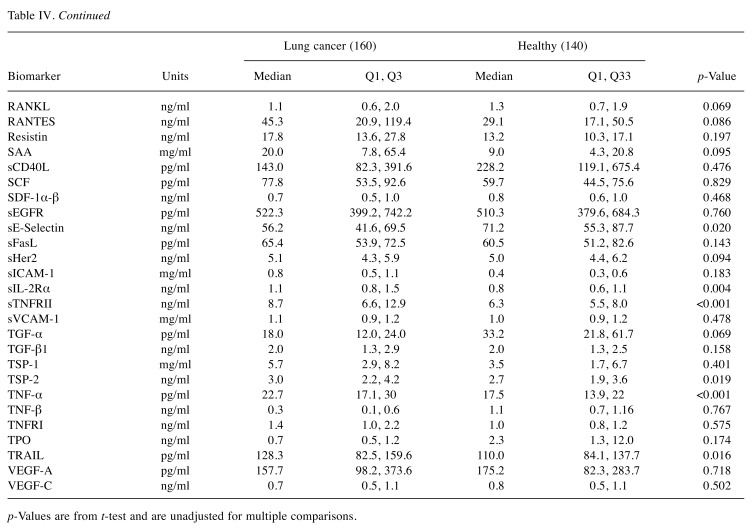
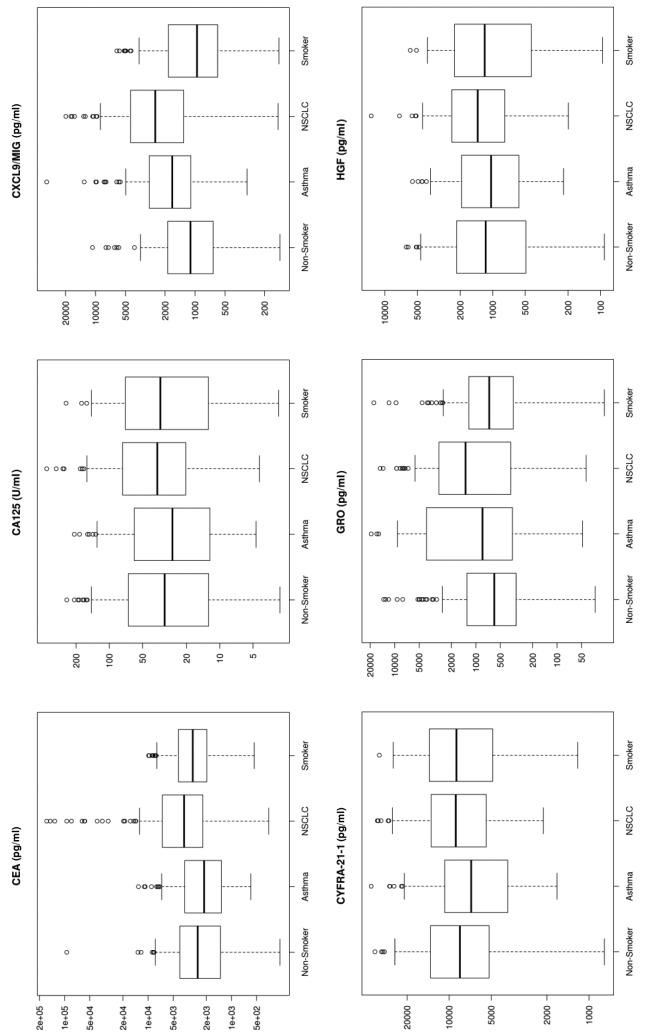
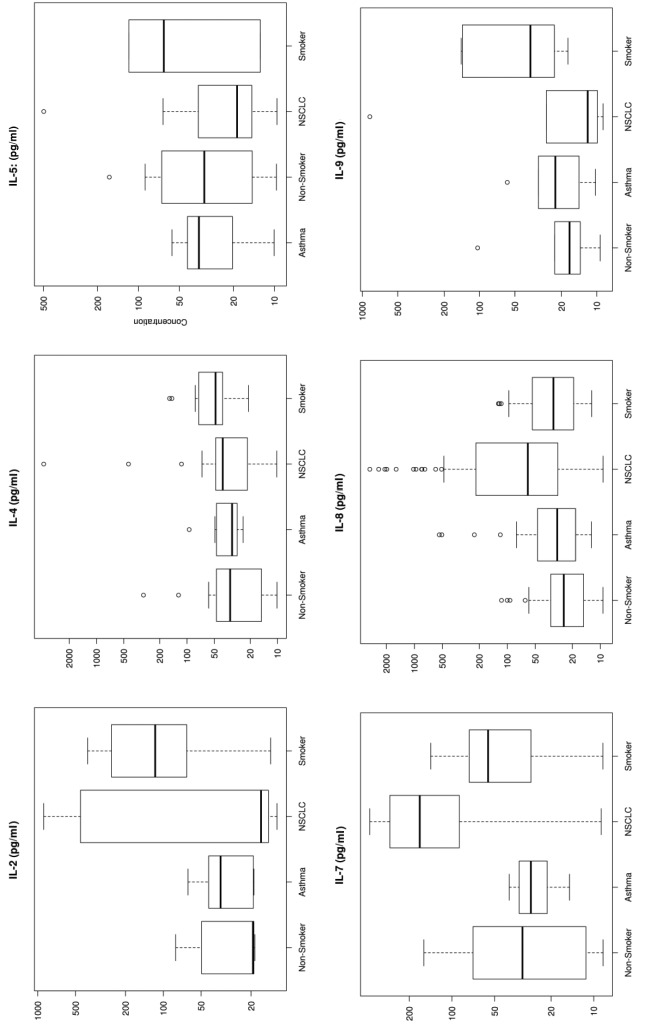
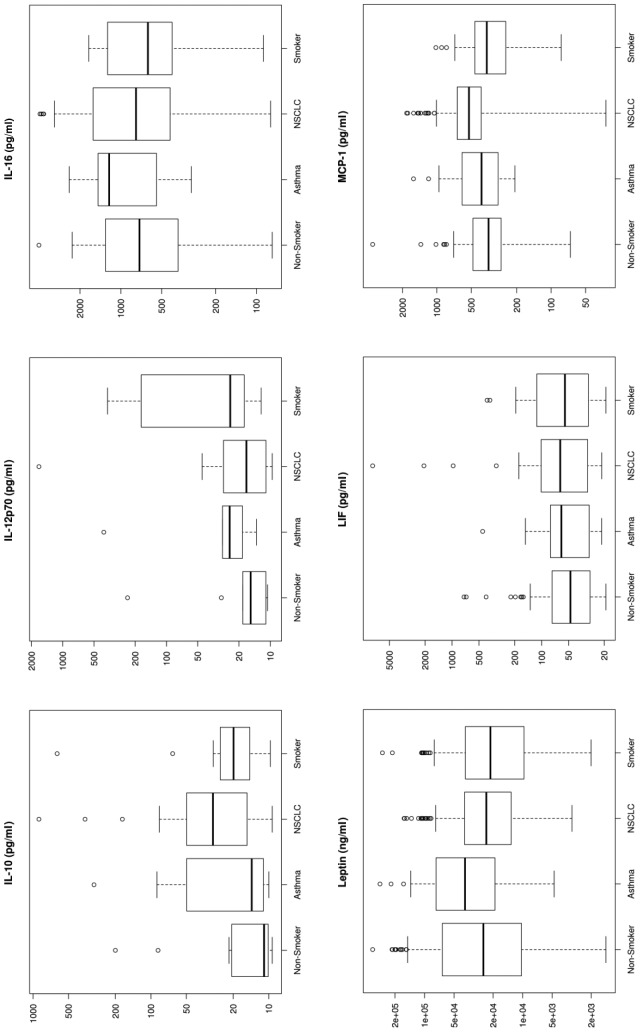
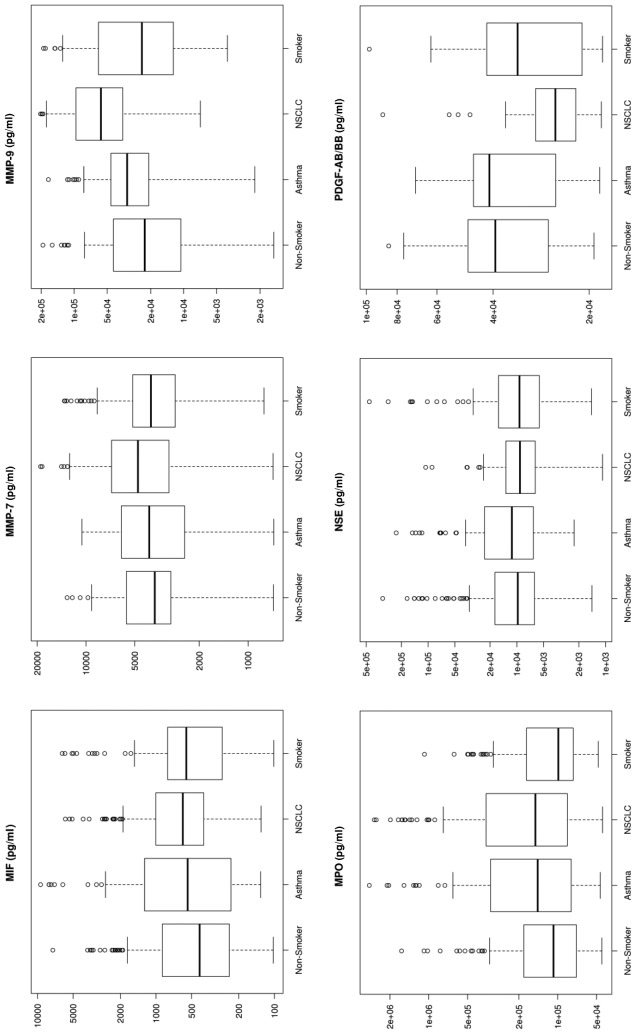
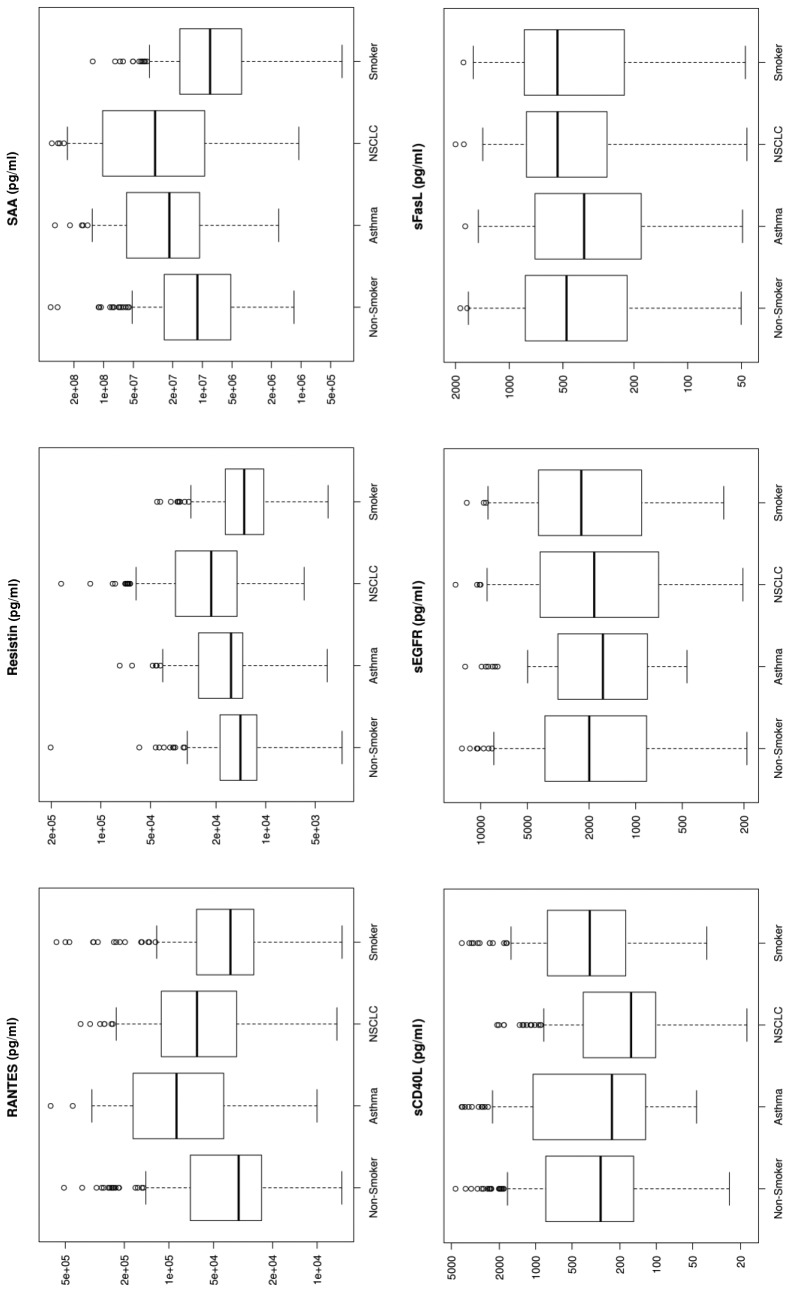
Biomarker characteristics. The median plasma concentrations for all biomarkers were used to represent the central tendency of the plasma concentrations to provide resistance to bias due to skewed distributions and outliers as shown on Table IV and Figure 1. The p-Values using the T-test, unadjusted for multiple comparisons, are statistically significant at a 0.05 level for 25 of 82 biomarkers (Table IV). From a univariate perspective, this indicates there are many biomarkers that discriminated NSCLC from other pathologies to a degree.
Table IV. Median concentrations and p-Values between NSCLC and healthy controls.
p-Values are from t-test and are unadjusted for multiple comparisons.
Figure 1. Box plots for each of the 33 analytes. These plots show the distribution of each pathology cohort’s biomarker concentration. Each box represents the interquartile range (from the 25th percentile to the 75th). The bar in the middle of the box is the median. The tails on either end of the box (if present) reach out to the minimum and maximum. If there are values greater than 1.5 times the interquartile range plus the 75th percentile (or less than the 25th percentile minus 1.5 times the interquartile range), they are represented by individual points.

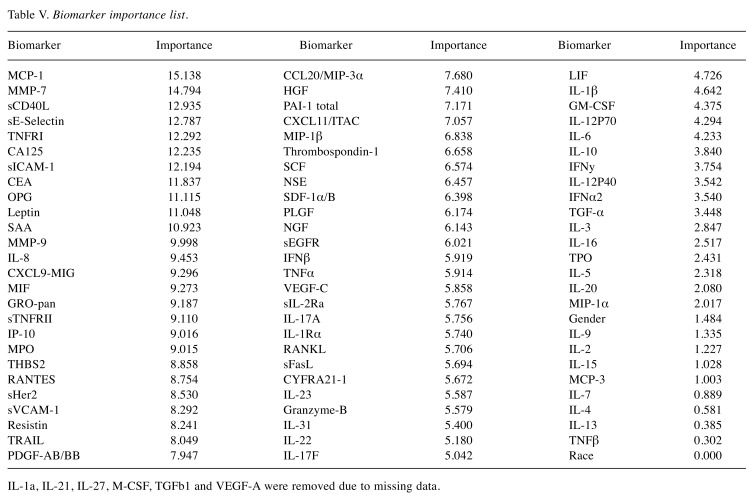
The biomarkers were ordered based on importance in the Random Forest model used to distinguish between NSCLC and non-NSCLC samples (Table V). A biomarker’s importance was defined as the decrease in Gini impurity (12) between a model, including the biomarker, and one without it. Thirty-three plasma proteins were selected based on statistical and biological significance. We conclude that gender is marginally significant, as otherwise shown in previous studies done by Izbicka et al. (13), and race is not an important factor.
Table V. Biomarker importance list.
IL-1a, IL-21, IL-27, M-CSF, TGFb1 and VEGF-A were removed due to missing data.
Multivariate analysis. To calculate the performance of the model, we used 10-fold cross validation. The data was divided into 10 partitions, using nine partitions to train and evaluate the model on the remaining partition. The process is repeated until all partitions are used to evaluate the model. The average of all results from each step represents an unbiased estimate of the model’s performance.
The results of the algorithm comparison indicated that the Random Forest was the best algorithm, in conjunction with the selected 33 biomarkers, to use for developing the LCDT1. This model has an accuracy of 89.9%, sensitivity of 98.2%, and specificity of 86.5% for NSCLC (Table VI) in the Training Set.
Table VI. 10-Fold cross-validation for 6 multivariate classification algorithms and 33 biomarkers.
NPV: Negative predictive value; PPV: positive predictive value; CI: 95% confidence interval; SVM: support vector machine; RF: random forest; RR: ridge regression; GA: genetic algorithms. All values for model performance are calculated using a 10-fold cross validation and are by subject results.
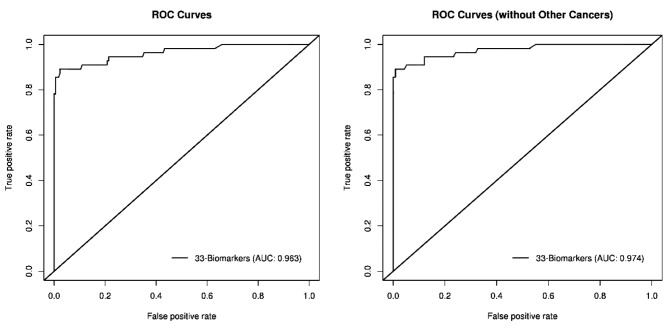
AUC/ROC curves. The ROC Curve (Figure 2) for the 33 biomarkers have an AUC of 0.963. When other non-NSCLC cancers were removed from analysis, the AUC improved to 0.974. This indicates potential for clinical use.
Figure 2. AUC/ROC graphs.
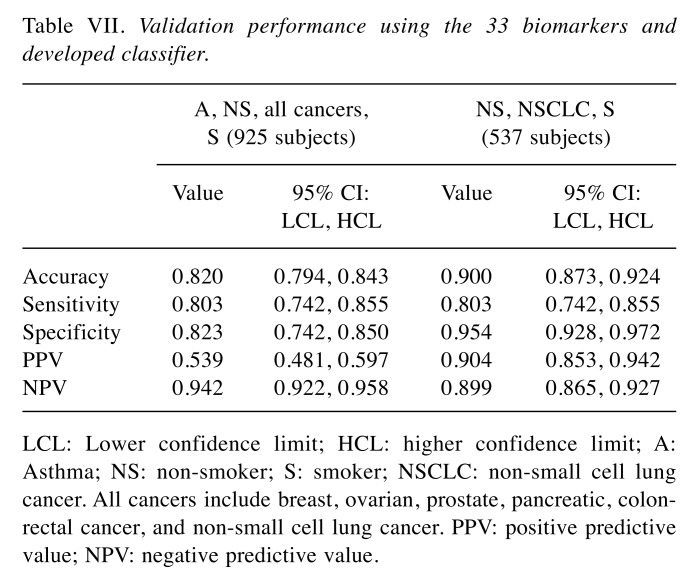
Validation performance. An independent sample set of 925 (N=1,850) subjects was processed using the selected 33 biomarkers and developed classifier. The validation results yielded 82% accuracy, 80.3% sensitivity, and 82.3% specificity (Table VII). The cohorts consisted of 74 asthma sufferers, 178 healthy non-smokers, 191 NSCLC, 168 high-risk smokers, and 314 other cancer patients. The majority of NSCLC samples were Stage I (Table III).
Table VII. Validation performance using the 33 biomarkers and developed classifier.
LCL: Lower confidence limit; HCL: higher confidence limit; A: Asthma; NS: non-smoker; S: smoker; NSCLC: non-small cell lung cancer. All cancers include breast, ovarian, prostate, pancreatic, colonrectal cancer, and non-small cell lung cancer. PPV: positive predictive value; NPV: negative predictive value.
The performance of the algorithm improved when the asthma and non-NSCLC cancers were removed from the data set. A total of 537 samples (178 non-smokers, 191 NSCLC, and 168 smokers) were included in this data set. The results yielded an increase in accuracy to 90% and specificity to 95.4% with the sensitivity consistent at 80.3% (Table VII).
Significant markers. Biomarkers that were upregulated by more than 50% using median concentration in lung cancer patients compared to healthy non-smokers included IL-7 (530%), IL-10 (272%), SAA (268%), MMP-9 (251%), IL-8 (247%), Gro (226%), MIG (226%), Rantes (191%), TNFRI (185%), and Resistin (150%). sCD40L and IL-5 showed a 56-57% down-regulation in NSCLC patients compared to healthy non-smokers (Figure 1).
The markers selected in our panel were a mixture of markers that may be significant for NSCLC, Non-Smokers (healthy), Smokers (high-risk, no cancer), and Asthma sufferers.
Assay precision. Inter-assay precision was determined using a low and high-quality control processed in duplicates over 24 plates, performed over 4 days by 4 different operators using 4 Luminex platforms. Biomarker inter-assay precision was between 2.8-5.5% and 3.8-7.9% for all analytes using MFI and concentration CV, respectively. Total plate %CV for each plate ran for all panels were between 3.4-6.5% and 5-11.4% for all analytes (using blanks, standards, QC and samples) using MFI and concentration CV, respectively. No cross-reactivity between analytes in each panel was observed.
Discussion
Multiplex assays have been evaluated as a potential diagnostic tool for lung cancer in numerous studies (13-19). Several biomarkers that can statistically discriminate lung cancer from healthy populations have been identified, and our results correlate with these findings. Examples for such biomarkers include (but are not limited to): i) CEA, ii) CYFRA21-1, iii) NSE, iv) VEGF-C, v) MMP7, and vi) MMP9. Independent lung tumor studies by Okamura et al., and Wieskopf et al., have shown a sensitivity range of 43% and 59% with specificity of 89% and 94%, respectively, for CYFRA21-1 in detecting LC (14,15). CEA has been shown to have a sensitivity of 69% and a specificity of 68% for LC (14). For NSE, an SCLC detection sensitivity as high as 74% has been reported (16). Tamura et al., (17) in 2004 showed elevated serum levels for VEGF-C, MMP-9, and VEGF in lung cancer patients with lymph node metastasis. These markers had individual sensitivities of 85%, 63%, 80%, and specificities of 68%, 75%, and 59%, respectively. The performance of a combination of these 3 markers was at 83% sensitivity and 76% specificity (17,18). Other studies have shown that Matrix Metallo-Proteinases expression is associated with lung cancer tissue growth (19) and MMP-9 as a prognostic indicator of relapse in patients with lung adenocarcinoma (20). Our results are consistent with previous literature reports which indicate an increased expression in MMP-7 (127%) and MMP-9 (251%) in lung cancer patients (Figure 1).
Naturally, attempts have been made to improve the diagnostic value of potential biomarkers using different combinations (of markers and algorithms), aiming to develop a product that would complement current gold standard diagnostic methods for lung cancer. Such an example is Paula’s Test (21), which uses 4 biomarkers (CEA, CYFRA21-1, CA125, and NY-ESO-1) in blood serum and has a sensitivity of 77% and a specificity of 80% using a validation set (N=150) that includes NSCLC and healthy cohorts. Another study performed by Somalogic (22,23) used 8 tissue homogenates and 1,326 serum NSCLC samples, which resulted in the development of a 12-protein panel (cadherin-1, CD30 ligand, endostatin, HSP90α, LRIG3, MIP-4, pleiotrophin, PRKCI, RGM-C, SCF-sR, sL-selectin, and YES). Somalogic’s panel could distinguish NSCLC (Stage I-III) from controls, concluding with a sensitivity of 89% and a specificity of 83% in their blind study. In our study, the LCDT1 used 33 biomarkers in blood plasma achieving a sensitivity of 80.3% and a specificity of 82.3% using a validation set of 925 subjects consisting of NSCLC, asthma sufferers, smokers, non-smokers, and other cancer patients. Notably, specificity increased to 95.4% when samples were restricted to NSCLC from healthy controls (e.g. smoker, non-smoker) (Table VII).
The enhanced performance in the algorithm when non-NSCLC cancers and asthma were removed may indicate that i) the number of non-NSCLC cancer and asthma samples were insufficient to create a model that distinguished the differences between these samples, and/or ii) other cancers and asthma may have a masking effect on the NSCLC population affecting the results. This phenomenon requires further investigation.
The combinations of biomarkers, algorithms, sample types, and platforms displayed varying results. We found that the number of proteins (too few), as well as selectivity of these protein markers (too general), in a panel can cause the test to become generic (or applicable) to many cancers rather than to a specific one. This effect can be attributed to the pleiotropic nature of many of these proteins and overlapping signal response pathways of the immune system. A combination of markers that are individually significant, or those that may even exhibit a pattern between cohorts, for asthma sufferers (or COPD), NSCLC, smokers, and non-smokers, may augment the discrimination effects of the algorithm.
From an overall set of 351 NSCLC samples, 90.3% were Stage I, 2.3% were Stage II, and 7.4% were Stage III/IV (Table III). Our validation results illustrate the algorithm’s ability to detect NSCLC, i.e., especially Stage I, with an 82% (95%CI: 79-84) accuracy, 80.3% (95%CI: 74-85) sensitivity, 82.3% (95%CI: 74-84) specificity, 53.9% (95%CI: 48-60) PPV, and 94.2% (95%CI: 92-96) NPV. The International Early Lung Cancer Action Program Investigators (24) showed that LC patients who were diagnosed at Stage I and underwent a surgical resection (e.g. lobectomy, wedge resection, segmentectomy, and bilobectomy) one-month post diagnosis had a 92% (95%CI: 88-95) 10-year survival rate.
Currently, Medicare covers the use of LDCT for lung cancer screening using the eligibility criteria for the NLST to define high-risk individuals. Ma et al., estimated that at least 8.6 million Americans qualified as high risk for lung cancer and were recommended to receive annual screening with low-dose CT scans in 2010 (25). A study by Brenner et al., have estimated that in individuals between the ages of 50-70 who undergo an annual CT screen for lung cancer, a total of 1,080 (230 males and 850 females) of 100,000 screened will develop a radiation-related cancer (26,27). About 2% (95% uncertainty limits, 1%-3%) of the 1.4 million cancers diagnosed in the United States in 2010 could be related to CT scans (27,28). Hence, a simple blood-based test could significantly reduce radiation-related cancers in the future.
Multiplex immunoassays have been evaluated as a potential diagnostic tool for lung cancer in numerous studies. However, the variability of commercially available protein assays due to the complex nature of proteins (i.e., structure, stability, interactions) has made the translation process of immunoassays into diagnostic tools challenging. A final product would necessitate the development of a consistent reagent kit using an optimal combination of biomarkers coupled with an algorithm that has been thoroughly validated and revalidated for functionality and clinical utility. At present, we have simplified our model by decreasing the number of variables to a subset of 21 biomarkers (from the 33) with promising results (Figure 1).
Conflicts of Interest
Thomas Long serves as the Chief Executive Officer and Chief Financial Officer for Lung Cancer Proteomics LLC. Cherylle Goebel and Chris Louden are consultants for Lung Cancer Proteomics LLC.
Authors’ Contributions
CG designed the study and performed result analysis. CLL provided statistical analysis and algorithm development. CG and CLL wrote the manuscript with contribution from the others. All authors read and approved the final manuscript.
Acknowledgements
This study was sponsored by Lung Cancer Proteomics LLC previously known as Cancer Prevention and Cure LLC.
References
- 1.American Cancer Society Global Cancer Facts & Figures 4th Edition. Atlanta: American Cancer Society. 2018. pp. 25–28. Available at: https://www.cancer.org/content/dam/cancer-org/research/cancer-facts-and-statistics/global-cancer-facts-andfigures/global-cancer-facts-and-figures-4th-edition.pdf. Last accessed on 8th May 2019.
- 2.SEER 18 2009-2015: All Races, Both Sexes by SEER Summary Stage 2000. Available at: https://seer.cancer.gov/statfacts/html/lungb.html. Last accessed on 8th May 2019.
- 3.American Cancer Society Facts & Figures 2019: Table 1. Estimated Number* of New Cancer Cases and Deaths by Sex, US, 2019. American Cancer Society. Atlanta. 2019. pp. 4–19. Available at: https://www.cancer.org/content/dam/cancerorg/research/cancer-facts-and-statistics/annual-cancer-facts-andfigures/2019/cancer-facts-and-figures-2019.pdf. Last accessed on 8th May 2019.
- 4.Birring SS, Peake MD. Symptoms and the early diagnosis of lung cancer. Thorax. 2005;60(4):268–269. doi: 10.1136/thx.2004.032698. PMID: 15790977. [DOI] [PMC free article] [PubMed] [Google Scholar]
- 5.Ellis PM, Vandermeer R. Delays in the diagnosis of lung cancer. J Thorac Dis. 2011;3(3):183–188. doi: 10.3978/j.issn.2072-1439.2011.01.01. PMID: 22263086. [DOI] [PMC free article] [PubMed] [Google Scholar]
- 6.Ten Haaf K, Jeon J, Tammemägi MC, Han SS, Kong CY, Plevritis SK, Feuer EJ, de Koning HJ, Steyerberg EW, Meza R. Risk prediction models for selection of lung cancer screening candidates: A retrospective validation study. PLoS Med. 2017;14(4):e1002277. doi: 10.1371/journal.pmed.1002277. PMID: 28376113. DOI: 10.1371/journal. pmed.1002277. [DOI] [PMC free article] [PubMed] [Google Scholar]
- 7.Pyenson BS, Tomicki SM. Lung cancer screening: A cost-effective public health imperative. Am J Public Health. 2018;108(10):1292–1293. doi: 10.2105/AJPH.2018.304659. PMID: 30207779. DOI: 10.2105/ AJPH.2018.304659. [DOI] [PMC free article] [PubMed] [Google Scholar]
- 8.SEER Cancer Statistics Review, 1975-2016: Table 15.14 Non-Small Cell Cancer of the Lung and Bronchus (Invasive). National Cancer Institute. Bethesda, MD. 2018. Available at:https://seer.cancer.gov/csr/1975_2016/results_single/sect_15_table.14.pdf. Last accessed on 8th May 2018.
- 9.National Lung Screening Trial Research Team The National Lung Screening Trial: overview and study design. Radiology. 2011;258:243–253. doi: 10.1148/radiol.10091808. DOI: 10.1148/radiol.10091808. [DOI] [PMC free article] [PubMed] [Google Scholar]
- 10.National Lung Screening Trial Research Team , Aberle DR, Adams AM, Berg CD, Black WC, Clapp JD, Fagerstrom RM, Gareen IF, Gatsonis C, Marcus PM, Sicks JD. Reduced lung-cancer mortality with low-dose computed tomographic screening. N Engl J Med. 2011;365(5):395–409. doi: 10.1056/NEJMoa1102873. PMID: 21714641. DOI: 10.1056/NEJMoa1102873. [DOI] [PMC free article] [PubMed] [Google Scholar]
- 11.Louppe G, Wehenkel L, Sutera A, Geurts P. Understanding variable importances in forests of randomized trees. In Advances in Neural Information Processing Systems 26 (NIPS 2013) 1987-2016: Neural Information Processing Systems Foundation, Inc. Available at: https://papers.nips.cc/paper/4928-understanding-variable-importances-in-forests-of-randomizedtrees.pdf. Last accessed on 8th May 2019.
- 12.Dupuy A, Simon RM. Critical review of published microarray studies for cancer outcome and guidelines on statistical analysis and reporting. J Natl Cancer Inst. 2007;99(2):147–157. doi: 10.1093/jnci/djk018. PMID: 17227998. DOI: 10.1093/jnci/djk018. [DOI] [PubMed] [Google Scholar]
- 13.Izbicka E, Streeper RT, Michalek JE, Louden CL, Diaz A 3rd, Campos DR. Plasma biomarkers distinguish non-small cell lung cancer from asthma and differ in men and women. Cancer Genomics Proteomics. 2012;9:27–35. PMID: 22210046. [PubMed] [Google Scholar]
- 14.Okamura K, Takayama K, Izumi M, Harada T, Furuyama K, Nakanishi Y. Diagnostic value of CEA and CYFRA 21-1 tumor markers in primary lung cancer. Lung Cancer. 2013;80(1):45–49. doi: 10.1016/j.lungcan.2013.01.002. PMID: 23352032. DOI: 10.1016/j.lungcan.2013.01.002. [DOI] [PubMed] [Google Scholar]
- 15.Wieskopf B, Demangeat C, Purohit A, Stenger R, Gries P, Kreisman H, Quoix E. Cyfra 21-1 as a biologic marker of non-small cell lung cancer. Evaluation of sensitivity, specificity, and prognostic role. Chest. 1995;108(1):163–69. doi: 10.1378/chest.108.1.163. PMID: 7541742. [DOI] [PubMed] [Google Scholar]
- 16.Ferrigno D, Buccheri G, Giordano C. Neuron-specific enolase is an effective tumour marker in non-small cell lung cancer (NSCLC) Lung Cancer. 2003;41(3):311–320. doi: 10.1016/s0169-5002(03)00232-0. PMID: 12928122. [DOI] [PubMed] [Google Scholar]
- 17.Tamura M, Oda M, Matsumoto I, Tsunezuka Y, Kawakami K, Ohta Y, Watanabe G. The combination assay with circulating vascular endothelial growth factor (VEGF)-C, matrix metalloproteinase-9, and VEGF for diagnosing lymph node metastasis in patients with non-small cell lung cancer. Ann Surg Oncol. 2004;11(10):928–933. doi: 10.1245/ASO.2004.01.013. PMID: 15383417. DOI: 10.1245/ ASO.2004.01.013. [DOI] [PubMed] [Google Scholar]
- 18.Ahn JM, Cho JY. Current serum lung cancer biomarkers. J Mol Biomark Diagn. 2013;S4:001. [Google Scholar]
- 19.Safranek J, Pesta M, Holubec L, Kulda V, Dreslerova J, Vrzalova J, Topolca n O, Pesek M, Finek J, Treska V. Expression of MMP-7, MMP-9, TIMP-1 and TI.MP-2 mRNA in lung tissue of patients with non-small cell lung cancer (NSCLC) and benign pulmonary disease. Anticancer Res. 2009;29(7):2513–2517. PMID: 19596921. [PubMed] [Google Scholar]
- 20.Lee CY, Shim HS, Lee S, Lee JG, Kim DJ, Chung KY. Prognostic effect of matrix metalloproteinase-9 in patients with resected Non-small cell lung cancer. J Cardiothorac Surg. 2015;10(1):44. doi: 10.1186/s13019-015-0248-3. PMID: 25888323. DOI: 10.1186/s13019-015-0248-3. [DOI] [PMC free article] [PubMed] [Google Scholar]
- 21.Doseeva V, Colpitts T, Gao G, Woodcock J, Knezevic V. Performance of a multiplexed dual analyte immunoassay for the early detection of non-small cell lung cancer. J Transl Med. 2015;13:55. doi: 10.1186/s12967-015-0419-y. PMID: 25880432. DOI: 10.1186/s12967-015-0419-y. [DOI] [PMC free article] [PubMed] [Google Scholar]
- 22.Ostroff RM, Bigbee WL, Franklin W, Gold L, Mehan M, Miller YE, Pass HI, Rom WN, Siegfried JM, Stewart A, Walker JJ, Weissfeld JL, Williams S, Zichi D, Brody EN. Unlocking biomarker discovery: large scale application of aptamer proteomic technology for early detection of lung cancer. PLoS One. 2010;5:e15003. doi: 10.1371/journal.pone.0015003. PMID: 21170350. DOI: 10.1371/ journal.pone.0015003. [DOI] [PMC free article] [PubMed] [Google Scholar]
- 23.Mehan MR, Ayers D, Thirstrup D, Xiong W, Ostroff RM, Brody EN, Walker JJ, Gold L, Jarvis TC, Janjic N, Baird GS, Wilcox SK. Protein signature of lung cancer tissues. PLoS One. 2012;7(4):e35157. doi: 10.1371/journal.pone.0035157. PMID: 22509397. DOI: 10.1371/ journal.pone.0035157. [DOI] [PMC free article] [PubMed] [Google Scholar]
- 24.International Early Lung Cancer Action Program Investigators , Henschke CI, Yankelevitz DF, Libby DM, Pasmantier MW, Smith JP, Miettinen OS. Survival of patients with stage I lung cancer detected on CT screening. N Engl J Med. 2006;355(17):1763–1771. doi: 10.1056/NEJMoa060476. PMID: 17065637. DOI: 10.1056/ NEJMoa060476. [DOI] [PubMed] [Google Scholar]
- 25.Ma J, Ward EM, Smith R, Jemal A. Annual number of lung cancer deaths potentially avertable by screening in the United States. Cancer. 2013;119(7):1381–1385. doi: 10.1002/cncr.27813. PMID: 23440730. DOI: 10.1002/cncr.27813. [DOI] [PubMed] [Google Scholar]
- 26.Brenner DJ. Radiation risks potentially associated with low-dose CT screening of adult smokers for lung cancer. Radiology. 2004;231(2):440–445. doi: 10.1148/radiol.2312030880. PMID: 15128988. DOI: 10.1148/ radiol.2312030880. [DOI] [PubMed] [Google Scholar]
- 27.Linet MS, Slovis TL, Miller DL, Kleinerman R, Lee C, Rajaraman P, Berrington de Gonzalez. Cancer risks associated with external radiation from diagnostic imaging procedures. CA Cancer J Clin. 2012;62(2):75–100. doi: 10.3322/caac.21132. PMID: 22307864. DOI: 10.3322/caac.21132. [DOI] [PMC free article] [PubMed] [Google Scholar]
- 28.Berrington de Gonzalez A, Mahesh M, Kim KP, Bhargavan M, Lewis R, Mettler F, Land C. Projected cancer risks from computed tomographic scans performed in the United States in 2007. Arch Intern Med. 2009;169:2071–2077. doi: 10.1001/archinternmed.2009.440. PMID: 20008689. DOI: 10.1001/archinternmed.2009.440. [DOI] [PMC free article] [PubMed] [Google Scholar]


