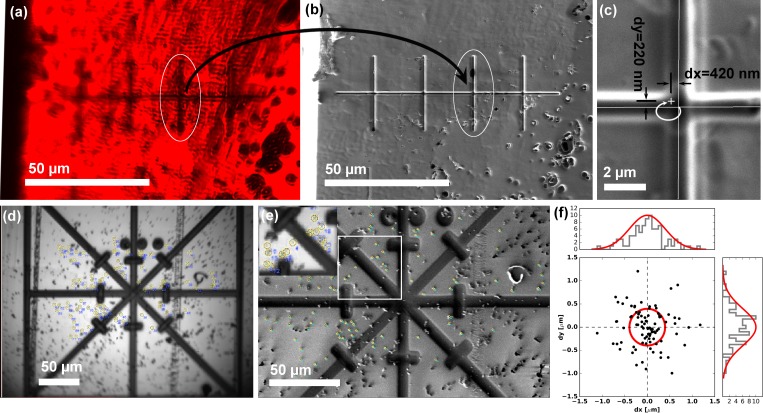
Figure 3. Translation and correlation precision of the integrated PIE-scope.
(a,b) Optical (a) and FIB (b) image of the same sample region, containing a series of pre-milled test patterns (crosses). After the stage translation calibration and targeting steps one can select the target feature using the optical microscope (a), and simply translate the same field of view under the FIB and the (b). (c) The precision of direct, unsupervised ROI targeting by simple sample translation is <420 nm for the X-axis (major axis of translation) and <300 nm for the orthogonal Y-axis. (d, e, f) The procedure used to quantify the mechanical correlation precision when moving between an optical (a) and FIB (b) images. Fiducial markers were identified in all modalities and the transformation to perform the correlation was calculated. In (f) a scatter plot describing the mean residual for all the measurements (n = 86), showing the precision is ~500 nm (±σ). For every measurement, we selected beads > 100 beads to eliminate/average out eventual fiducial selection errors.

