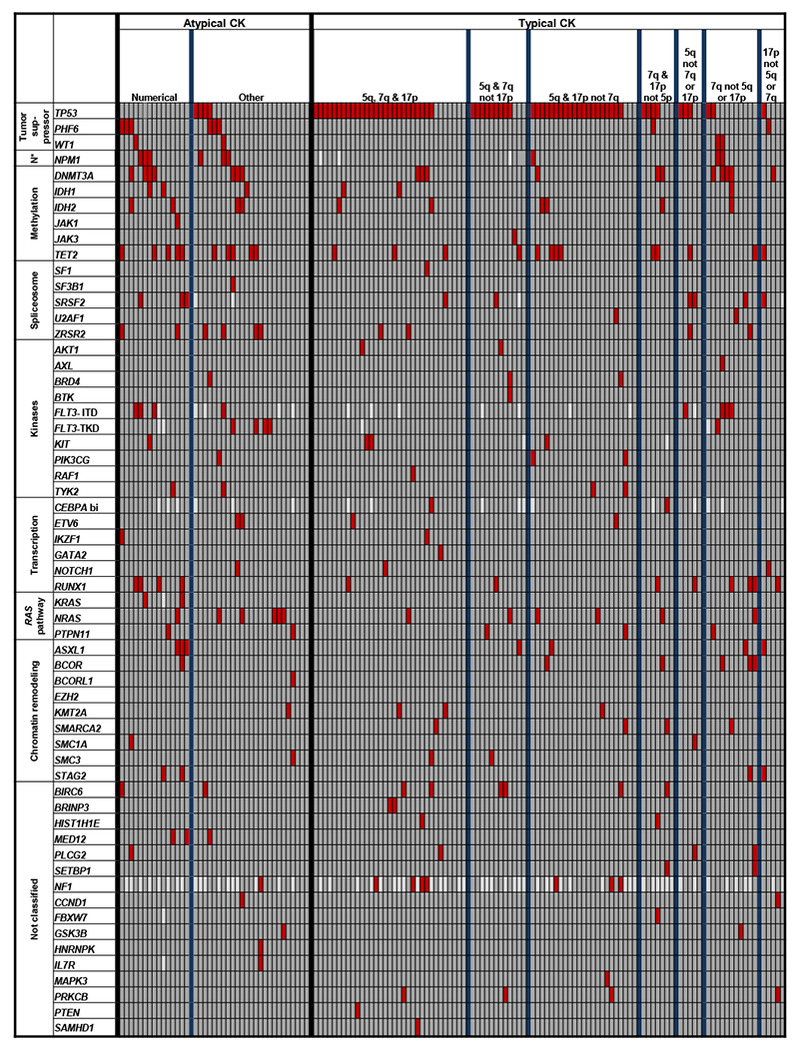
Figure 3.

Oncoprint of mutations detected in acute myeloid leukemia patients with atypical and those with typical complex karyotype (CK). Subsets identified within both atypical and typical CK are separated by thicker blue vertical lines. Each column represents an individual patient, and each row represents a single gene. The genes are clustered into the previously reported functional groups,18 with N* indicating “NPM1”. “CEBPA bi” indicates biallelic mutations of the CEBPA gene. Red color denotes gene mutation, darker grey, wild-type status of the gene, and lighter grey, mutation status not determined.
