

Abstract
Study Objective:
Newly diagnosed pediatric patients with type 1 diabetes mellitus (T1D) can be underweight, overweight, or normal weight at presentation. Study objectives were to determine if, across weight categories, admission body weight (ABW)-based initial insulin glargine dosing resulted in similar fasting blood glucose responses on day of discharge, how initial ABW-based doses differed from doses at outpatient follow-up, and whether an ideal body weight (IBW) would provide a better estimate of body weight after discharge.
Design:
Retrospective chart review.
Setting:
Urban tertiary academic medical center.
Patients:
Eighty-one pediatric patients newly diagnosed with T1D who started therapy with subcutaneous insulin glargine between October 2014 and October 2016; patients were categorized by weight using body mass index (BMI) percentiles (underweight, normal weight, overweight/obese).
Measurements and Main Results:
Data on patient parameters from hospitalization and outpatient physician follow-up were collected. The McLaren, Moore, and BMI IBW methods were used to calculate IBW for each patient; these IBWs were compared with weights at outpatient follow-up. Initial insulin glargine doses were similar among all weight groups: median (range) 0.299 (0.227–0.4), 0.297 (0.204–0.421), and 0.291 (0.194–0.394) units/kg/dose, respectively, for the underweight, normal weight, overweight/obese groups. No significant differences in discharge fasting glucose level or insulin glargine dose change from admission to first outpatient follow-up visit were noted. Underweight patients gained significantly more weight within 60 days after discharge compared with normal and overweight/obese patients, (median 16.3% vs 7.7% and 5.7%, respectively, p=0.002), aligning closest with the McLaren IBW. ABW was the best estimate of weight at outpatient follow-up in the overweight/obese patient group.
Conclusion:
For children who presented underweight, the McLaren IBW method was the best predictor of outpatient dose and body weight, whereas ABW was the best estimate in overweight and obese patients. Further investigation of the role of IBW or adjusted body weight–based dosing methods in underweight pediatric patients with T1D may assist in optimal dosing.
Keywords: insulin glargine, ideal body weight, pediatrics, type 1 diabetes mellitus
Type 1 diabetes mellitus (T1D) is caused by autoimmune destruction of pancreatic beta cells, resulting in insulin deficiency. Treatment of T1D requires lifelong monitoring of blood glucose levels and administration of exogenous insulin to prevent acute and late complications of diabetes.1,2 One challenge in treating children and adolescents with T1D is safely achieving and maintaining tight glycemic control without acute complications of hypoglycemia and hyperglycemia, particularly at the time of diagnosis. In pediatrics, initial insulin doses are weight based, with a typical range of 0.5–1 unit/kg/day, with variability in dosing based on clinical factors that affect insulin sensitivity such as age, pubertal status, and degree of illness.3 One retrospective analysis of children with a diagnosis of T1D for more than 2 years demonstrated a mean total daily insulin dose of 0.67 unit/kg/day at 3 years of age, 0.93 unit/kg/day at 13 years, and 0.7 unit/kg/day at 23 years.4 Although standard dosing protocols for insulin initiation are weight based, the child’s normal healthy weight may differ from the weight obtained at diagnosis, as symptoms of diabetes include weight loss and dehydration.
TID may occur in a pediatric patient of any weight or body habitus.5,6 Pediatric weight status is assessed in reference to the Centers for Disease Control and Prevention (CDC)’s body mass index (BMI) for age percentiles, which compare a child’s BMI (weight in kilograms/[height in meters]2) to national survey data from 1963–1994.7 Historically, T1D was associated with significantly lower BMI and percentage of body fat compared to healthy age-matched controls; however, recent analyses of newly diagnosed diabetes patients show that patients present with widely variable BMIs.8 To our knowledge, there are currently no published studies that have evaluated the impact of weight status, or use of ideal body weight (IBW), on initial insulin dosing in children, despite the fact that the one constant factor in determination of initial insulin doses is weight. Use of IBW in pediatric medication dosing is complicated by the lack of a single validated IBW equation. The most common methods of calculating IBW in children are the McLaren, Moore, and BMI methods.9 The McLaren method assumes that the weight-to-height ratio is constant, and involves plotting the child’s height for age, extending a line horizontally from the child’s height to the 50th percentile of height-for-age line, then extending a line vertically from the 50th percentile height-for-age line to the corresponding 50th percentile of weight, resulting in the ideal body weight.10,11 The Moore method assumes that IBW is the weight at the same standard deviation from the mean as the child’s height; thus, for a child with a height at the 75th percentile, the IBW would be the 75th percentile of weight for age.12 The BMI method can be calculated as IBW = (BMI at the 50th percentile for age x [height in meters]2).13 Due to the differences in calculation methods, IBWs calculated by various methods may disagree significantly, especially for patients in the highest and lowest percentiles of weight and height.
Insulin glargine is a long-acting human insulin analog commonly used in the treatment of T1D and usually accounts for half of the daily insulin dose. Retrospective data in 71 pediatric patients with T1D transitioned from insulin NPH to insulin glargine reported the mean dose of insulin glargine within the first month of initiating therapy was 0.5 ± 0.1 unit/kg/day.14 To our knowledge, there are currently no published studies that have investigated the impact of admission weight status on initial insulin glargine dosing in children. The purpose of this study was to determine if the initial insulin glargine dosing used at our institution resulted in similar fasting blood glucose response across pediatric patients of different weight categories and if all weight categories required similar insulin glargine dose titrations prior to first outpatient endocrinology physician follow-up appointment (within 60 days of discharge). We also compared weight at first outpatient follow-up to IBW calculated by three different methods (McLaren, Moore, and IBW).
Methods
A retrospective chart review was conducted at The Johns Hopkins Hospital (Baltimore, MD), an urban tertiary academic medical center, and included pediatric patients hospitalized with newly diagnosed T1D who were initiated on subcutaneous insulin glargine from October 2014 through October 2016. This study was approved by the Institutional Review Board through an expedited review.
Patients were identified through a search of an internal pediatric endocrinology patient database and were cross-referenced within the institution’s electronic medical record to determine eligibility. Patients were included in our analysis if they were admitted to the hospital for a new diagnosis of T1D, initiated on insulin glargine during admission, aged less than 18 years, and weighed 20–200 kg on admission. The selected weight criteria were based on the concern regarding the difficulty of long-acting insulin dose titrations in patients weighing less than 20 kg and the inability to accurately weigh patients exceeding 200 kg at the study institution. A minimum age for inclusion was not defined, as patients with T1D of any age may be considered insulin glargine candidates. Patients were excluded if they used corticosteroids within 14 days of admission, had a diagnosis of cystic fibrosis, or had a history of solid organ transplantation. Demographic characteristics of the initial sample were evaluated for distribution of weight categories as defined by the CDC growth chart percentiles.10 According to the CDC percentiles, children with a BMI-for-age less than the 5th percentile were classified as underweight; a BMI-for-age of the 5th–85th percentile were normal weight; a BMI-for-age of the 85th–95th percentile were overweight; and a BMI-for-age of greater than the 95th percentile were obese. For the purposes of this research, all patients with a BMI-for-age greater than the 85th percentile were assigned a category of overweight/obese. A priori, the investigators allowed for additional patients to be recruited if less than 10% of patients in the initial cohort were in the underweight category and if less than 20% of patients were overweight or obese. This was reflective of population weight prevalence of newly diagnosed pediatric patients with diabetes from previous studies.15
Initial and discharge doses of insulin glargine and point-of-care blood glucose values in the middle of the night (generally 2:00 AM) and prior to breakfast (fasting) on the day of discharge were collected to assess potential differences between weight groups during admission. Any occurrence of hypoglycemia (blood glucose <70 mg/dL) during the duration of hospitalization was recorded. The proportion of patients with a fasting point-of-care blood glucose level less than 250 mg/dL on day of discharge was used to assess adequacy of the empiric insulin regimen, as patients are typically not euglycemic on the date of discharge. This threshold was used due to concerns of poor outpatient detection of hypoglycemia in a child with newly diagnosed T1D. Initial insulin glargine doses were compared to doses at the first outpatient endocrinology physician appointment, which occurred between 14 and 60 days after hospital discharge. As a part of the site’s typical practice, patients met with a certified diabetes educator within 2 weeks of hospital discharge and followed up with an endocrinologist within 1 month of the educator visit. Patients also communicated frequently with endocrinology providers by telephone during the period between hospital discharge and outpatient follow-up appointments, and dose titrations occurred based on outpatient blood glucose level results. Insulin glargine doses were generally titrated in 10% increments, such that doses were adjusted by either 0.5- or 1-unit increments depending on if the patient was receiving a total glargine dose of less than or greater than 10 units per day.
Three distinct IBWs were calculated using the McLaren, Moore, and BMI methods with patient parameters from the time of admission. These were compared to the patient’s admission body weight (ABW) and weight at first outpatient follow-up visit to evaluate whether any of these IBWs provided a reliable estimate of a patient’s weight after treatment of T1D had begun.
Continuous and categorical variables were compared across weight categories by using the Kruskal-Wallis and χ2 or Fisher’s exact test, respectively. All tests were two-sided. Statistical analyses were performed by using STATA software version 13.1.16 A p value less than 0.05 was considered to indicate a significant difference.
Results
Demographic and Clinical Characteristics
A total of 202 patients were screened to achieve a sample of 81 patients meeting inclusion criteria (Figure 1). Underweight, normal weight, and overweight/obese patients were distributed at 17.3%, 53.1% and 29.6%, respectively, as defined by the CDC BMI-for-age percentiles (Table 1). There were no significant differences among median age, sex, pubertal status, or median length of stay in patients across weight categories. Significant differences among the weight categories were noted for race, bicarbonate level, pH, and anion gap on admission. Underweight patients had a higher anion gap, lower bicarbonate level, and lower pH than normal weight or overweight/obese patients. A greater percentage of underweight patients required an insulin infusion relative to normal and overweight/obese patients (71% vs 30%, and 38%, respectively, p=0.02); however, there was no significant difference in infusion duration among patients requiring the infusion. There was no significant difference in time to diabetic ketoacidosis resolution as defined by time to close the anion gap, but patients who received an insulin infusion had a longer median inpatient stay compared to patients who did not receive an insulin infusion (median 3 [range 1 – 8] days compared to 2 [range 1 – 3] days, p<0.001).
Figure 1.
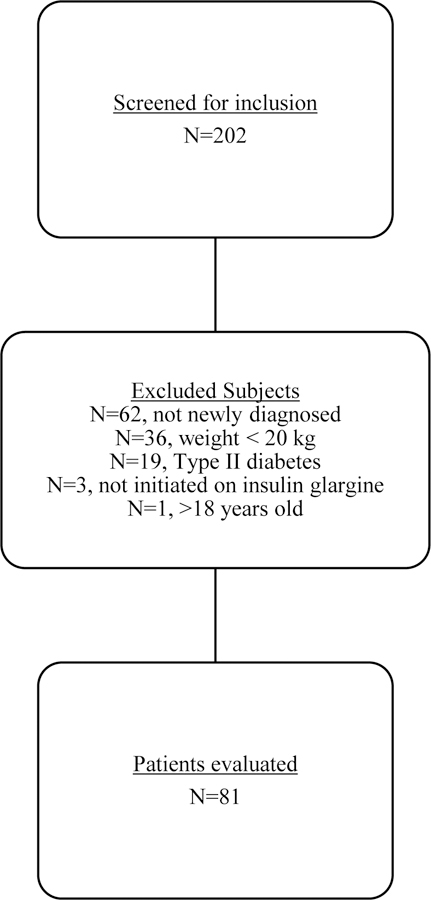
Flowchart of the patient selection process and reasons for exclusion.
Table 1.
Demographic and Clinical Characteristics of the Study Patients by Weight Category on Admission
| Characteristic | Underweight Patients (n=14) |
Normal Weight Patients (n=43) |
Overweight/Obese Patients (n=24) |
p Value |
|---|---|---|---|---|
| Age (yrs), median (range) | 13.5 (4 – 17) | 12 (4 – 18) | 10 (4 – 17) | 0.09 |
| Male, no. (%) | 7 (50) | 22 (51) | 13 (54) | 0.961 |
| Prepubertal, no. (%) | 7 (50) | 23 (53) | 16 (67) | 0.495 |
| Length of stay (days), median (range) | 3 (2 – 6) | 2 (1 – 4) | 2.5 (1 – 8) | 0.24 |
| African-American, no. (%) | 2 (14%) | 12 (28%) | 6 (25%) | 0.015 d,e |
| Glucose level on admission (mg/dL), median (range) | 498 (247 – 682) | 369 (144 – 1079) | 417 (93 – 700) | 0.06 |
| Bicarbonate level on admission (mEq/L), median (range) | 12 (4 – 24) | 22 (6 – 29) | 19 (3 – 27) | 0.03 d,e |
| Anion gap on admission (mEq/L), median (range) | 29 (18 – 47) | 21 (10 – 36) | 22 (14 – 35) | 0.009 d,e |
| Time to close the anion gap (hrs), median (range)a | 10 (5 – 22.5) | 8.75 (1.5 – 35) | 12 (4 – 63.5) | 0.37 |
| pH on admission, median (range)b | 7.18 (6.84 – 7.36) | 7.33 (7.13 – 7.43) | 7.32 (7 – 7.4) | 0.005 d,e |
| Need for insulin infusion, no. (%) | 10 (71) | 13 (30) | 9 (38) | 0.02 d,e |
| Duration of insulin infusion (hrs), median (range)c | 24 (24 – 48) | 20 (3 – 77) | 24 (7 – 79) | 0.24 |
| Initial insulin glargine dose (units/kg), median (range) | 0.299 (0.227 – 0.4) | 0.297 (0.204 – 0.421) | 0.291 (0.194 – 0.394) | 0.866 |
| Discharge insulin glargine dose (units/kg), median (range) | 0.326 (0.2 – 0.408) | 0.297 (0.171 – 0.457) | 0.302 (0.16 – 0.515) | 0.483 |
Patients in whom the anion gap was not elevated did not have data for this variable (n=42): 4 among underweight, 24 among normal weight, and 14 among overweight/obese patients.
Data on pH on admission were missing for 4 patients.
Data on insulin infusion were available for 32 patients.
The difference was significant for underweight patients vs normal weight patients.
The difference was significant for underweight patients vs overweight/obese patients.
Insulin Glargine Dosing and Glycemic Control during Hospitalization
No significant differences were observed among weight groups in the ABW-based insulin glargine dose at initiation or discharge (Table 1). A statistically significant difference, although not likely clinically significant, was observed in the doses initiated in patients who received an insulin infusion versus those who did not (0.302 units/kg vs 0.29 units/kg, respectively, p=0.032). No significant differences were noted in the magnitude of dose titration from admission to discharge among weight groups (median [range] 0.03 units/kg [−0.2 – 0.1] in underweight patients, 0 units/kg [−0.09 – 0.14] in normal weight patients, and 0 units/kg [−0.08 – 0.15] in overweight/obese patients, p=0.18). No significant differences were noted among weight groups in the early morning blood glucose levels (median [range] 248 mg/dL [87 – 312], 220 mg/dL [79 – 370], and 227 mg/dL [73 – 361]) or fasting blood glucose levels (median [range] 238 mg/dL [128 – 407], 222 mg/dL [65 – 502], and 220 mg/dL [93 – 450]) in underweight, normal weight, and overweight/obese patients, respectively, on the day of discharge. The proportion of patients with a morning blood glucose level less than 250 mg/dL on the day of discharge did not significantly differ (50%, 72%, and 79%, respectively, p=0.154); however, the trend of a lower proportion of patients with glucose levels less than 250 mg/dL in the underweight relative to normal and overweight/obese groups was observed. Twenty-four instances of hypoglycemia occurred in 16 patients, and no significant differences were observed in the frequency of hypoglycemia among weight categories.
Changes from Admission to First Outpatient Follow-up Visit
Outpatient follow up data were available for 71 (88%) of the 81 patients in the study (Table 2). Underweight patients had the largest weight change from admission to their first outpatient endocrinology appointment. Underweight patients gained a median 16.3% of their ABW (median 5.5 kg), compared to a gain of 7.7% (median 2.5 kg) in normal weight patients and 5.7% (median 2.3 kg) in overweight/obese patients (p=0.002). At the time of outpatient follow-up, none of the patients remained in the underweight weight category, 39 patients were categorized as normal weight, and 32 patients were considered overweight/obese according to the CDC BMI-for-age percentiles. No significant differences were observed in insulin glargine dose change from discharge to the first outpatient visit when evaluated as a dose in units or weight-based dose (units/kg) in all patient groups (median [range] 1 unit [−15 – 13] in underweight patients, −2 units [−15 – 13] in normal weight patients, and 0 units [−26 – 8] in overweight/obese patients, respectively, p=0.136).
Table 2.
Outpatient Follow-up Data
| All Patients (n=81) |
Underweight Patients (n=14) |
Normal Weight Patients (n=43) |
Overweight/Obese Patients (n=24) |
p Value | ||
|---|---|---|---|---|---|---|
| Patients with outpatient follow-up, no. (%) | 71 (88) | 13 (93) | 36 (84) | 22 (92) | ||
| Insulin glargine dose change from discharge to outpatient follow-up (units/kg), median (range) | −0.03 (−0.29 – 0.27) | 0.03 (−0.28 – 0.19) | −0.06 (−0.24 – 0.27) | 0 (−0.29 – 0.23) | 0.136 | |
| Insulin glargine dose change from discharge to outpatient follow-up (units), median (range) | −1 (−26 – 13) | 1 (−15 – 13) | −2 (−15 – 13) | 0 (−26 – 8) | 0.136 | |
| Outpatient weight – ABW (kg), median (range)c | 2.6 (−2.3 – 3.5) | 5.5 (2.1 – 19.9) | 2.5 (−2.3 – 7.8) | 2.3 (−0.8 – 8.4) | 0.002a,b | |
| Weight gained at outpatient follow-up (%), median (range) | 7.5 (−5 – 38) | 16.3 (5.5 – 38) | 7.7 (−5 – 26.2) | 5.7 (−1.7 – 14.7) | 0.002 a,b |
ABW = admission body weight.
The difference was significant for underweight patients vs normal weight patients.
The difference was significant for underweight patients vs overweight/obese patients.
Positive values represent weight gain between discharge and outpatient follow-up, whereas negative values represent weight loss during that period.
IBW as an Estimate of Weight and Insulin Glargine Dose at Outpatient Follow-up
Weight at outpatient follow-up was compared to ABW and IBW calculated using the three methods and patient parameters at the time of admission (Table 3). Positive weight values represent weight gain between discharge and outpatient follow-up, whereas negative values represent weight loss during that period. Values that are closest to zero represent the smallest magnitude of weight change during the period. When evaluating the full population, ABW was the closest estimate of weight at outpatient follow-up. In normal weight patients, the Moore IBW was the closest estimate (median [range] 0.6 kg (−16.6 – 14.1) when compared to outpatient weight), whereas in overweight/obese patients, ABW provided the closest estimate (median [range] 2.3 kg [−0.8 – 8.4]). All of the IBW equations underestimated outpatient weight in the overweight/obese patient population. In underweight patients, McLaren IBW was the closest estimate of follow-up body weight; use of either the Moore IBW or BMI IBW resulted in an overestimation of outpatient weight.
Table 3.
Estimated Weight Change using IBW Equations
| All Patients (n=81) |
Underweight Patients (n=14) |
Normal Weight Patients (n=43) |
Overweight/Obese Patients (n=24) |
p Value | ||
|---|---|---|---|---|---|---|
| Outpatient weight – ABW (kg), median (range)d | 2.6 (−2.3 – 3.5) | 5.5 (2.1 – 19.9) | 2.5 (−2.3 – 7.8) | 2.3 (−0.8 – 8.4) | 0.0019a,b | |
| Outpatient weight – McLaren IBW (kg), median (range)d | 6 (−13.5 – 38.6) | 1.9 (−13.5 – 16.3) | 4.5 (−9.8 – 29.7) | 15.1 (−0.5 −38.6) | <0.001a,b | |
| Outpatient weight – Moore IBW (kg), median (range)d | 3.6 (−17.4 – 37.4) | −7.1 (−17.4 – 2.5) | 0.6 (−16.6 – 14.1) | 9.1 (4.7 – 37.4) | <0.001a,b,c | |
| Outpatient weight – BMI IBW (kg), median (range)d | 4.6 (−7.4 – 33.2) | −2.5 (−7.4 – 6.7) | 3.7 (−5.5 – 17.8) | 14.7 (4.6 – 33.2) | <0.001001a,b,c |
ABW = admission body weight; IBW = ideal body weight; BMI = body mass index.
The difference was significant for underweight patients vs normal weight patients.
The difference was significant for underweight patients vs overweight/obese patients.
The difference was significant for normal weight patients vs overweight/obese patients.
Positive values represent weight gain between discharge and outpatient follow-up, whereas negative values represent weight loss during that period. Values that are closest to zero represent the smallest magnitude of weight change during the period.
Discussion
In this retrospective chart review, we characterized current practice at a single center and evaluated the impact of underweight, normal weight, or overweight/obese status on initial insulin glargine dosing, day of discharge glucose values, and postdischarge weight and insulin glargine dose changes. No significant differences were observed in the insulin glargine dose or blood glucose values at discharge, but underweight patients had numerically higher early morning and fasting blood glucose levels, suggesting higher insulin needs than prescribed. Overweight patients were most likely to have a morning blood glucose level < 250 mg/dL on the day of discharge, suggesting better control with their regimens (either initial or with small dose titrations during the short hospital stay). Initial weight-based insulin glargine doses were similar across weight groups, but higher doses were initially prescribed to patients who had previously required an insulin infusion (0.302 unit/kg vs 0.29 unit/kg). This may result in a difference of 0.5 – 1 unit of insulin glargine per day depending on patient weight. By discharge, median blood glucose levels of < 250 mg/dL (203–238 mg/dL) were observed in all weight categories. Based on current institutional practice of diabetes education beginning after cessation of insulin infusion, the discharge blood glucose levels in patients requiring an insulin infusion may be confounded by a longer hospital stay and greater opportunity to titrate insulin doses.
By the first outpatient follow-up appointment, patients in all weight categories had gained weight compared to the weight obtained at hospital admission, with the greatest weight gain noted in the underweight group (median 16.3% gain compared to 7.7% and 5.7% in the normal weight and overweight/obese groups, respectively). This is clinically relevant, as some acutely hyperglycemic patients may present significantly underweight as a result of dehydration and lipolysis, and these patients’ weights on admission may not reflect their hydrated weight. As patients in the underweight group also presented sicker, with a lower pH, low bicarbonate level, a larger anion gap, and a greater percentage requiring insulin infusions, the ABW may have been more greatly affected by dehydration and illness compared to the other weight categories. The McLaren IBW was the closest estimate of outpatient body weight in underweight patients. The McLaren method underestimated by a median of 1.9 kg, whereas ABW underestimated by 5.5 kg, compared to overestimations of outpatient weights by both the Moore and BMI methods (median overestimations of 7.1 kg and 2.5 kg, respectively). Further study of the McLaren IBW, or a similar adjustment of the constant in total daily insulin calculation for initial dosing, in underweight patients with T1D is needed to evaluate if this method could result in a better estimation of insulin glargine needs, both short and long term. These results, however, must be balanced with caution as use of an IBW that exceeds the patient’s current weight may result in an increased risk of hypoglycemia given the significant weight change during these patients’ postdischarge follow-up period. In normal weight patients, use of the Moore IBW was associated with the closest estimation of weight at follow-up (underestimated by a median of 0.6 kg); however, ABW resulted in the next closest value (underestimated by a median of 2.5 kg). ABW was most closely associated with outpatient follow-up weight in overweight/obese patients; in this patient population, use of any of the three IBW methods would result in significant underestimation of the patient’s weight and would not add value in empiric insulin glargine dose calculations.
There are several limitations of this study. This small retrospective study included only 14 non–randomly selected underweight patients, and there were differences observed among the weight groups at baseline, notably a lower proportion of African-American patients in the underweight group, and laboratory parameters in underweight patients indicating a more severe presentation at diagnosis. Other significant limitations include the exclusion of rapid-acting insulin regimens from the analysis and a short duration of hospitalization—therefore a limited opportunity for inpatient dose adjustment. Outpatient follow-up is not entirely documented in the electronic medical record, as endocrinologists communicate by telephone nearly daily with families during the first few weeks following diagnosis and hospital discharge; dose adjustments made by phone conversations may not be documented in the medical record. Although our institution’s endocrinology practice strives to schedule the first physician appointment with newly diagnosed patients within one month of hospital discharge, extending the window for first outpatient data to 60 days after discharge captured follow-up data for 71 (88%) of 81 patients.
Conclusion
Initial and discharge ABW-based insulin glargine doses did not significantly differ among underweight, normal weight, and overweight/obese patients, at approximately 0.3 unit/kg/day, and the dose at outpatient follow-up remained similar among groups. Underweight patients gained significantly more weight within 2 months of hospital discharge than normal weight and overweight/obese patients, and this weight may be best estimated by using the McLaren IBW method. Consideration of using the McLaren IBW method, or a similar adjustment, in future dose-optimization studies of newly diagnosed underweight patients with T1D may guide providers toward dosing that is closer to the patient’s ultimate insulin glargine requirement after discharge. Overweight/obese patients’ outpatient weights were best estimated using their weight at admission, which supports current initial body weight–based insulin glargine dosing practices.
Acknowledgments
We would like to acknowledge support for the statistical analysis from the National Center for Research Resources and the National Center for Advancing Translational Sciences (NCATS) of the National Institutes of Health through grant number 1UL1TR001079. We would like to acknowledge the assistance of Lisa Hutchins, LeAnn McNamara, and Risa Wolf in the development of this research and manuscript.
Footnotes
Declaration of Conflicting Interests
The authors report no relevant financial relationships and have no conflicts of interest to disclose.
Meeting Presentation
Preliminary findings from this study were presented at the Pediatric Pharmacy Advocacy Group Annual Meeting, Charlotte, North Carolina, May 3–7, 2017.
References
- 1.Chiang J, Maahs D, Garvey K et al. Type 1 Diabetes in Children and Adolescents: A Position Statement by the American Diabetes Association. Diabetes Care 2018;41(9):2026–2044. doi: 10.2337/dci18-0023 [DOI] [PMC free article] [PubMed] [Google Scholar]
- 2.Children and Adolescents: Standards of Medical Care in Diabetes. Diabetes Care 2019;42(Supplement 1):S148–S164. doi: 10.2337/dc19-s013 [DOI] [PubMed] [Google Scholar]
- 3.Bacha F, Klinepeter Bartz S. Insulin resistance, role of metformin and other non-insulin therapies in pediatric type 1 diabetes. Pediatr Diabetes 2015;17(8):545–558. [DOI] [PubMed] [Google Scholar]
- 4.Wiegand S, Raile K, Reinehr T, et al. Daily insulin requirement of children and adolescents with type 1 diabetes: effect of age, gender, body mass index and mode of therapy. European Journal of Endocrinology 2008;158(4):543–549. [DOI] [PubMed] [Google Scholar]
- 5.Statistics About Diabetes. American Diabetes Association 2018. Available at: http://www.diabetes.org/diabetes-basics/statistics/. Accessed April 3, 2019.
- 6.Copeland K, Silverstein J, Moore K, Prazar G, Raymer T, Shiffman R, et al. Clinical Practice Guideline: Management of Newly Diagnosed Type 2 Diabetes Mellitus (T2DM) in Children and Adolescents. Pediatrics 2013;131(2):364–382. [DOI] [PubMed] [Google Scholar]
- 7.About Child & Teen BMI. Centers for Disease Control and Prevention 2016. Available at: http://www.cdc.gov/healthyweight/assessing/bmi/childrens_bmi/about_childrens_bmi.html. Accessed September 13, 2016.
- 8.Davis N, Bursell J, Evans W, Warner J, Gregory J. Body composition in children with type 1 diabetes in the first year after diagnosis: relationship to glycaemic control and cardiovascular risk. Archives of Disease in Childhood 2012;97(4):312–315. [DOI] [PubMed] [Google Scholar]
- 9.Phillips S, Edlbeck A, Kirby M, Goday P. Ideal Body Weight in Children. Nutrition in Clinical Practice 2007;22(2):240–245. [DOI] [PubMed] [Google Scholar]
- 10.Clinical Growth Charts. Centers for Disease Control and Prevention 2016. Available at: http://www.cdc.gov/growthcharts/clinical_charts.htm. Accessed September 14, 2016.
- 11.McLaren DS, Read WWC. Classification of nutritional status in early childhood. Lancet 1972;2:146–148. [DOI] [PubMed] [Google Scholar]
- 12.Moore DJ, Durie PR, Forstner GG, Pencharz PB. The assessment of nutritional status in children. Nutr Res 1985;5:797–799. [Google Scholar]
- 13.Tokunaga K, Matsuzawa Y, Kotani K, Keno Y, Kobatake T, Fujioka S, et al. Ideal body weight estimated from the body mass index with the lowest morbidity. Int J Obes 1991;15:1–5. [PubMed] [Google Scholar]
- 14.Tan C, Wilson D, Buckingham B. Initiation of insulin glargine in children and adolescents with type 1 diabetes. Pediatric Diabetes 2004;5(2):80–86. [DOI] [PubMed] [Google Scholar]
- 15.Manyanga T, Sellers E, Wicklow B, Doupe M, Fransoo R. Not as skinny as we used to think: Body mass index in children and adolescents at diagnosis of type 1 diabetes mellitus. Journal of Diabetes and its Complications 2016;30(2):292–294. [DOI] [PubMed] [Google Scholar]
- 16.StataCorp. 2013. Stata Statistical Software: Release 13 College Station, TX: StataCorp LP. [Google Scholar]