

Abstract
Gastric cancer (GC) is a common cause of cancer‐related death worldwide. As a result of the lack of reliable diagnostic or prognostic biomarkers for GC, patient prognosis is still poor. Therefore, there is an urgent need for studies examining the underlying pathogenesis of GC in order to find effective biomarkers. LRRN1 (leucine‐rich repeat neuronal protein‐1) is a type I transmembrane protein that plays an important role in the process of nerve development and regeneration. However, its role in cancer, especially in GC, remains unclear. In the present study, we found that LRRN1 expression is upregulated in GC tissues and that high LRRN1 expression is associated with poor prognosis. siRNA and shRNA‐mediated knockdowns of LRRN1 expression promoted GC cell apoptosis and activation of the Fas/FasL pathway. LRRN1 knockdown also resulted in upregulation of JUN, a subunit of the transcription factor AP‐1 (activator protein‐1). This suggests that LRRN1 suppresses GC cell apoptosis by downregulating AP‐1, resulting in inhibition of the Fas/FasL pathway. These results confirm that LRRN1 plays a significant role in GC pathogenesis. Moreover, LRRN1 may be a potential prognostic biomarker and therapeutic target for GC.
Keywords: apoptosis, Fas/FasL, gastric cancer, LRRN1, prognostic
Abbreviations
- AP‐1
activator protein‐1
- EGFR
epidermal growth factor receptor
- GC
gastric cancer
- GSEA
Gene Set Enrichment Analysis
- IGFR
insulin‐like growth factor receptor
- KEGG
Kyoto Encyclopedia of Genes and Genomes
- LRRN1
leucine‐rich repeat neuronal protein‐1
- NC
negative control
- TCGA
The Cancer Genome Atlas
1. INTRODUCTION
Gastric cancer is the fourth most common cancer and is the second leading cause of cancer‐related death worldwide.1 As a result of a lack of characteristic early symptoms, most GC are already advanced when diagnosed. Despite numerous studies, no reliable diagnostic or prognostic indicators have yet been discovered, and the prognosis of advanced GC is poor. Therefore, investigation into the molecular mechanisms of GC pathogenesis is urgently needed in order to find effective biomarkers for early diagnosis and new treatments.
Leucine‐rich repeat neuronal protein‐1 is a type I transmembrane protein with extracellular leucine‐rich repeats. LRRN1 belongs to the mammalian leucine‐rich neuronal protein family (LRRN1‐LRRN5),2, 3, 4, 5 LRRN proteins are mainly expressed in nerve tissues, but they are also expressed to a lesser degree in the lungs, heart, liver, and kidneys. LRRN proteins have a high degree of homology. Studies have shown that LRRN proteins play an important role in the processes of nerve development and regeneration. In addition to their expression in normal tissues, LRRN family members are also expressed in tumors. LRRN2 is amplified and overexpressed in glioblastoma and anaplastic astrocytoma, and LRRN3 has been isolated and cloned from the overexpressed proto‐oncogene c‐Ha‐ras in rat fibrosarcoma cells.6 However, the role of the LRRN family in cancer, especially in GC, is not fully understood.
LRRN1, one of the members of the LRRN family, has been identified as a prognostic factor for high‐risk neuroblastoma (NB) and was found to promote tumor cell proliferation.7 LRRN1 is a direct transcriptional target of MYCN and it potentiates EGFR and IGFR signaling, which further promotes MYCN transcription.8 Moreover, LRRN1 also plays an important role in maintaining the stability of pluripotency‐related proteins through AKT phosphorylation, thus helping to maintain the pluripotency and self‐renewing capacities of human embryonic stem cells.9 MYCN, EGFR, IGFR, and AKT also participate in GC development, invasion, and metastasis. However, it is unknown whether LRRN1 plays a similar role in other tumors.
In the present study, we found that LRRN1 is upregulated in GC tissue samples and its expression is closely related to poor prognosis. Knocking down LRRN1 expression promoted GC cell apoptosis, accompanied by activation of the Fas/FasL pathway. These results show that LRRN1 suppresses GC cell apoptosis through inhibition of the Fas/FasL pathway.
2. MATERIALS AND METHODS
2.1. Bioinformatics analysis
Expression data of normal tissue and GC tissue datasets were downloaded from TCGA (https://cancergenome.nih.gov). GES62254 was downloaded from the Gene Expression Omnibus database (GEO) (https://www.ncbi.nlm.nih.gov/geo) to verify the results obtained from the TCGA datasets. Kaplan‐Meier Plotter (https://www.kmplot.com/analysis) was used to draw Kaplan‐Meier survival curves of patients with different expression levels of LRRN1. When survival analysis was carried out, the “Exclude GSE62254” option was checked because GSE62254 has markedly different characteristics than the other datasets. GSEA was carried out using GSEA Java software by comparing the expression of genes in the LRRN1‐high/low groups divided by the median expression level of LRRN1. KEGG signaling pathways were used as a reference in this step to evaluate the pathways that LRRN1 may modulate.
2.2. Cell cultures
Human GC cell line HGC‐27 (TCHu 22), SGC‐7901 (TCHu 46) and AGS (TCHu 232) cells were obtained from Chinese Academy of Sciences (Shanghai, China). SNU‐216 (00216) cells were obtained from the Korean Cell Line Bank (Seoul, Korea). Before cell experiments, these cell lines were authenticated on the cell micrograph compared with cell lines on ATCC. Cells were grown in RPMI‐1640 medium containing 10% heat‐inactivated FCS in a 37°C humidified incubator with a mixture of 95% air and 5% CO2. All cell lines were tested for Mycoplasma contamination.
2.3. siRNA transfection
Transfection was carried out according to the siRNA sequences transfection protocol for Lipofectamine 2000 (Invitrogen, Carlsbad, CA, USA). Sequence of the LRRN1‐specific siRNA was 5′‐UUGUGGACACUCACUAUUCTT‐3′, Fas‐specific siRNA was 5′‐CAAGGAUGUUUAAAAUCUATT‐3′, and JUN‐specific siRNA was 5′‐ GGCACAGCUUAAACAGAAA‐3. Nonsense RNAi (5′‐UUCUCCGAACGUGUCACGUTT‐3′) was used as NC. Transfection efficiency was identified at 48 hours after transfection.
2.4. rRNA‐depleted RNA‐Seq
Total RNA was extracted using the mirVana miRNA Isolation Kit (Ambion, Foster City, CA, USA) following the manufacturer's protocol. RNA integrity was evaluated using the Agilent 2100 Bioanalyzer (Agilent Technologies, Santa Clara, CA, USA). Samples with RNA integrity number ≥7 were subjected to the subsequent analysis. The libraries were constructed using TruSeq Stranded Total RNA with Ribo‐Zero Gold (San Diego, CA, USA) according to the manufacturer's instructions. These libraries were then sequenced on the Illumina sequencing platform (HiSeqTM 2500 or other platform) and 150 bp/125 bp paired‐end reads were generated.
2.5. Generation of stable LRRN1 knocked‐down cell line
Negative control or LRRN1‐shRNA lentiviral particles were obtained from OBiO Technology Corp., Ltd (Shanghai, China). HGC‐27 and SNU‐216 cells were infected with NC or LRRN1‐shRNA lentiviral particles following the manufacturer's instructions. Briefly, a cell density of 1.0 × 10⁵ cells/well were seeded in a six‐well plate on the day before infection. On day 2, 5 μL/mL polybrene and shRNA lentiviral particles (at 50 MOI) were added to the culture. The infected cells were incubated overnight in the CO2 incubator. The medium was refreshed at 24 hours post‐infection. Puromycin (2 μg/mL) was used for selection of cells with stable transfection. Knockdown efficiency of LRRN1 in cells was determined using real time‐PCR and western blotting.
2.6. Transfections of LRRN1 overexpression plasmid
A cell density of 1.5 × 10⁵ SGC‐7901 and AGS cells was plated in each well of a 6‐well plate 1 day prior to plasmid transfection. The following day, the cells were transfected with 2 μg LRRN1 overexpression plasmid or the empty vector control obtained from OBiO Technology Corp. by Lipofectamine 2000 reagent (Invitrogen). After transfections for 48 hours, the expression of LRRN1 was evaluated by real time‐PCR and western blotting.
2.7. Antibodies and reagents
Human LRRN1 antibody (catalog #AF4990) and FasL antibody (catalog #MAB126) were obtained from R&D Systems (Minneapolis, MN, USA). SP600125 was purchased from Selleck Chemicals (Houston, TX, USA). Primary antibodies against poly ADP ribose polymerase (PARP) (catalog #9542L), caspase 3 (catalog #9662S), caspase 8 (catalog #9746S), Fas (catalog #8023S), c‐jun (catalog #9165), phosphorylated c‐jun (catalog #9261P), AKT (catalog #9272S), phosphorylated AKT (catalog #9271L), ERK (catalog #9102) and phosphorylated ERK (catalog #4370S) were obtained from Cell Signaling Technology (Danvers, MA, USA). Anti‐β‐actin (catalog #sc‐47778) was obtained from Santa Cruz Biotechnology (Dallas, TX, USA), and anti‐FasL antibody (catalog #ab15285) was obtained from Abcam (Cambridge, UK).
2.8. Cell viability assays
MTT assay was used to measure cell viability. Two hundred μL per well cell suspension (5000 cells/mL) was added to 96‐well culture plates and transfected with either NC‐siRNA or LRRN1‐siRNA. After the indicated times (24, 48, 72, and 96 hours), 20 μL MTT solution (5 mg/mL; Sigma Chemical Co., St Louis, MO, USA) was added to each well and cultured for 4 hours. Then the solution in each well was discarded and 200 μL DMSO (Sigma) was added. Cell viability was expressed as optical density values which were assessed at 570 nm using a microplate reader (model 550; Bio‐Rad Laboratories, Inc., Hercules, CA, USA).
2.9. Colony formation assay
In order to detect the long‐term effects of the expression of LRRN1 on cell viability, 500 cells/well were added to 12‐well culture plates for 2 weeks. The cells were fixed with methanol and then stained with 0.5% crystal violet, and the colonies were counted using Image‐Pro Plus.10
2.10. Flow cytometry
Cells were trypsinized, washed in PBS, and resuspended in 200 μL binding buffer. Then, 5 μL Annexin V‐FITC (BD Biosciences, New York, NJ, USA) was added to the 195‐μL cell suspension. After mixing and incubating for 10 minutes at room temperature, the cells were washed with 200 μL binding buffer and resuspended in 190 μL binding buffer. Then 10 μL propidium iodide (20 μg/mL) was added, and the samples were measured by flow cytometry (BD Accuri C6 Flow Cytometer; BD Biosciences).
2.11. Reverse transcription‐polymerase chain reaction
Total RNA was extracted with TRIZOL (Invitrogen) reagent. For mRNA detection, reverse transcription was carried out using the PrimeScript RT Reagent Kit with gDNA Eraser (Takara Bio, Kusatsu, Japan). cDNA generated from 1000 ng total RNA using SYBR Premix EX TaqTM II (Tli RNaseH Plus; Takara). RT‐qPCR was run on Applied Biosystems 7500 Real‐Time PCR Systems (Thermo Fisher Scientific, Waltham, MA, USA). PCR conditions were 10 minutes at 95°C followed by 45 cycles at 95°C for 15 seconds and 58°C for 34 seconds. Data were analyzed using the Applied Biosystems 7500 software program (version 2.3) with the automatic Ct setting for adapting baseline and threshold for Ct determination. The threshold cycle and 2‐ΔΔCt method were used for calculating the relative amount of target RNA. Transcripts of 18s in the same incubations were used as internal control. Primer sequences for LRRN1 were: forward (5′‐GTCGATGTCCATGAATACAACCT‐3′) and reverse (5′‐CAAGGCTAATGACGGCAAAC‐3′); JUN: forward (5′‐GTTGAGCTCGGGCTGGATAA‐3′) and reverse (5′‐CTATACTGCCGACCTGGCTG‐3′); 18s: forward (5′‐CCCGGGGAGGTAGTGACGAAAAAT‐3′) and reverse (5′‐CGCCCGCCCGCTCCCAAGAT‐3′).
2.12. Western blot analysis
Cells were solubilized in 1% Triton lysis buffer (1% Triton X‐100, 50 mM Tris‐Cl pH 7.4, 150 mM NaCl, 10 mM EDTA, 100 mM NaF, 1 mM Na3VO4, 1 mM PMSF, 2 μg/mL aprotinin). For the preparation of total cell lysates, cell lysate proteins were separated by SDS‐PAGE and electrophoretically transferred to a PVDF membrane (Millipore, Bedford, MA, USA). The membranes were blocked with 5% skim milk in TBST buffer (10 mM Tris‐Cl pH 7.4, 150 mM NaCl, 0.1% Tween‐20) at room temperature and incubated overnight at 4°C with the indicated primary antibodies. After the appropriate secondary antibodies were added at room temperature, the proteins were detected with ECL reagent (SuperSignal West Pico Chemiluminescent Substrate; Pierce Biotechnology, Rockford, IL, USA) and visualized with the Electrophoresis Gel Imaging Analysis System (DNR Bio‐Imaging Systems, Neve Yamin, Israel).
2.13. Enzyme‐linked immunosorbent assay
Protein level of FasL in cell culture supernatants was measured by FasL ELISA kit (R&D Systems) according to the manufacturer's instructions.11
2.14. Subcutaneous tumorigenicity using mouse models
All in vivo experiments were approved by the Institutional Review Board of China Medical University. Athymic nude (nu/nu) mice, 4‐6 weeks of age, were purchased from Beijing Vital River Laboratory Animal Technology Co., Ltd. HGC‐27‐shNC and HGC‐27‐shLRRN1 cells (5 × 10⁶ in 200 μL PBS) were injected s.c. near the scapula of the nude mice. Tumors were measured with a caliper every 3 days, and tumor volume was calculated using the formula V = 1/2 (width 2 × length). Body weights were also recorded. Mice were killed by cervical dislocation when the tumor diameters reached 2.0 cm, according to the protocol filed with the Guidance of Institutional Animal Care and Use Committee of China Medical University.
2.15. TUNEL
TUNEL was used to detect apoptosis by a kit from BioTime Biotechnology (Alameda, CA, USA). The detection procedures were in accordance with the kit instructions as follows. Paraffin sections were dewaxed in xylene for 5 minutes. Change to fresh xylene and removal of wax for another 5 minutes, 5 minutes of anhydrous ethanol, 90% ethanol for 2 minutes, 70% ethanol for 2 minutes and distilled water for 2 minutes was carried out. Addition of 10 μM Tris‐HCl (pH 7.4‐7.8) to the paraffin sections, and incubation at 37°C for 30 minutes was done. The sections were washed in PBS three times. Then samples were then treated with TUNEL solution (5 μL 10× enzyme reagent and 45 μL 1× labeling substrate) for 60 min in the dark at 37°C. Finally, the samples were observed under a fluorescence microscope BX53 (Olympus, Tokyo, Japan).
2.16. Immunohistochemistry analysis
Immunohistochemical staining was carried out using a streptavidin‐peroxidase procedure. LRRN1, protein expression was investigated using antibodies as mentioned above. All other reagents were from Sigma. Specificity of all antibodies was confirmed by western blotting. For statistical analysis, immunostaining was considered positive when the tumor mass occupied more than 10% of the cross‐sectional core area and when 10% or more of the neoplastic cells were stained.
2.17. Statistical analysis
Experimental results were reported as mean ± standard deviation and analyzed by SPSS 16.0 software (SPSS Inc. Released 2007. SPSS for Windows, version 16.0. Chicago, IL, USA). One‐way ANOVA analysis of difference was used for comparisons among multiple groups. Student's t tests were used for comparisons between two groups. Multivariate analysis was carried out using the multivariate Cox proportional hazards model, which was fitted using all of the clinicopathological variables. Chi‐squared test was used to evaluate the correlation between LRRN1 expression levels and the clinical characteristics. All means were calculated from at least three independent experiments. P < 0.05 was considered statistically significant.
3. RESULTS
3.1. Leucine‐rich repeat neuronal protein‐1 is significantly upregulated in GC and is related to poor prognosis
To clarify the role of LRRN1 in GC, we compared 32 pairs of GC and corresponding non‐cancerous gastric samples from the same individuals using TCGA database (https://cancergenome.nih.gov). We found that LRRN1 was significantly upregulated in the GC samples (Figure 1A). To further confirm this, we measured LRRN1 mRNA and protein expression in seven GC cell lines and the normal gastric epithelial cell line GES1. LRRN1 was found to be upregulated significantly in the GC cell lines (Figure 1B,C). We then used Kaplan‐Meier analysis to examine the association between LRRN1 expression and patient prognosis. As shown in Figure 1D,E, high expression of LRRN1 was associated with shorter overall survival. Similar results were obtained when disease‐free survival (DFS) was analyzed (Figure 1F). For further analysis, the patients were divided into two groups: the LRRN1‐low expression group (n = 163) and the LRRN1‐high expression group (n = 164), split according to median expression value. Using the Kaplan‐Meier Plotter (https://www.kmplot.com/analysis), we found that the LRRN1‐high expression group had poorer overall survival compared to the LRRN1‐low expression group (hazard ratio [HR] = 1.51, 95% confidence interval [CI] = 1.15‐1.98, P < 0.0026) (Figure 1G).
Figure 1.
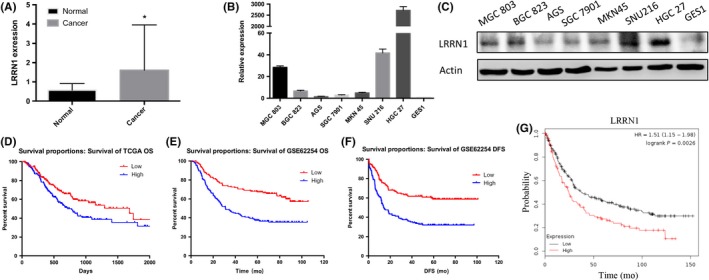
Leucine‐rich repeat neuronal protein‐1 (LRRN1) is upregulated in gastric cancer (GC) and closely related to poor prognosis. A, Differences in LRRN1 expression between normal and GC tissue samples from The Cancer Genome Atlas (TCGA) (P = 0.0372) datasets. B, LRRN1 mRNA expression in seven different GC cell lines and normal gastric epithelial cells (GES1). C, LRRN1 protein expression in seven different GC cell lines and normal gastric epithelial cells. D,E, Kaplan‐Meier survival analysis with TCGA (P = 0.019) and GSE62254 (P < 0.0001) datasets indicates that higher LRRN1 expression is associated with a worse overall survival in GC patients. F, Kaplan‐Meier survival analysis with GSE62254 (P < 0.0001) indicates that higher LRRN1 expression is associated with a worse disease‐free survival (DFS) in GC patients. G, Kaplan‐Meier survival analysis from Kaplan‐Meier Plotter indicates that higher expression is associated with a worse overall survival in GC patients (HR = 1.51, 95% CI = 1.15‐1.98, P = 0.026). Error bar = SEM, *P < 0.05, indicates statistically significant difference. OS, overall survival
In order to determine the clinical significance of LRRN1 in GC, 327 GC patients with complete clinical information in TCGA were selected for further analysis. A chi‐squared test indicated that high LRRN1 expression significantly correlated with more advanced T (P = 0.038), N (P = 0.008), and TNM stages (P = 0.040) (Table 1). Next, a Cox proportional hazards model was used to analyze the impact of various clinical and pathological parameters on patient prognosis. Univariate analysis showed that age (HR = 1.503, 95% CI = 1.009‐2.238, P = 0.045), N stage (HR = 1.661, 95% CI = 1.168‐2.631, P = 0.005), M stage (HR = 2.039, 95% CI = 1.123‐3.704, P = 0.019), TNM stage (HR = 2.131, 95% CI = 1.342‐3.385, P = 0.001), and LRRN1 expression level (HR = 1.531, 95% CI = 1.074‐2.182, P = 0.019) were risk factors for poor prognosis. Furthermore, multivariate analysis showed that age (HR = 1.776, 95% CI = 1.176‐2.682, P = 0.006), N stage (HR = 1.581, 95% CI = 1.101‐2.269, P = 0.013), and LRRN1 expression (HR = 1.452, 95% CI = 1.003‐2.102, P = 0.048) were independent risk factors for poor prognosis (Table 2). These results show that LRRN1 is upregulated in GC and that high LRRN1 expression is associated with poor prognosis.
Table 1.
Correlation between LRRN1 expression and clinical characteristics in TCGA GC dataset (n = 327)
| Variable | Number (%) | LRRN1 expression | P‐value | |
|---|---|---|---|---|
| Low (%) | High (%) | |||
| Total | 327 | 163 (49.8) | 164 (50.2) | |
| Gender | ||||
| Male | 205 (62.7) | 105 (32.1) | 100 (30.6) | 0.520 |
| Female | 122 (37.3) | 58 (17.7) | 64 (19.6) | |
| Age (years) | ||||
| >60 | 223 (68.2) | 118 (36.0) | 105 (32.1) | 0.104 |
| ≤60 | 104 (31.8) | 45 (13.8) | 59 (18.1) | |
| T stage | ||||
| 1, 2 and 3 | 238 (72.8) | 127 (38.8) | 111 (34.0) | 0.038a |
| 4 | 89 (27.2) | 36 (11.0) | 53 (16.2) | |
| N stage | ||||
| 0 and 1 | 189 (57.8) | 106 (32.4) | 83 (25.4) | 0.008a |
| 2 and 3 | 138 (42.2) | 57 (17.4) | 81 (24.8) | |
| M stage | ||||
| 0 | 303 (92.7) | 155 (47.4) | 148 (45.3) | 0.093 |
| 1 | 24 (7.3) | 8 (2.4) | 16 (4.9) | |
| TNM stage | ||||
| 1, 2 and 3 | 289 (88.4) | 150 (45.9) | 139 (42.5) | 0.040a |
| 4 | 38 (11.6) | 13 (4.0) | 25 (7.7) | |
| Grade | ||||
| 1 | 7 (2.1) | 3 (0.9) | 4 (1.2) | 0.926 |
| 2 | 111 (34.0) | 55 (16.8) | 56 (17.1) | |
| 3 | 209 (63.9) | 105 (32.1) | 104 (31.8) | |
P < 0.05.
GC, gastric cancer; LRNN1, leucine‐rich repeat neuronal protein‐1; TCGA, The Cancer Genome Atlas.
Table 2.
Cox regression analysis of overall survival in GC patients
| Variable | Univariate analysis | Multivariate analysis | ||
|---|---|---|---|---|
| Hazard ratio (95% CI) | P‐value | Hazard ratio (95% CI) | P‐value | |
| Gender | 0.719 (0.491‐1.053) | 0.09 | ||
| Age (years) | 1.503 (1.009‐2.238) | 0.045a | 1.776 (1.176‐2.682) | 0.006a |
| T stage | 1.184 (0.799‐1.754) | 0.4 | ||
| N stage | 1.661 (1.168‐2.631) | 0.005a | 1.581 (1.101‐2.269) | 0.013a |
| M stage | 2.039 (1.123‐3.704) | 0.019a | 1.701 (0.705‐4.103) | 0.237 |
| TNM stage | 2.131 (1.342‐3.385) | 0.001a | 1.443 (0.724‐2.874) | 0.297 |
| Grade | 1.412 (0.993‐2.008) | 0.055 | ||
| LRRN1 | 1.531 (1.074‐2.182) | 0.019a | 1.452 (1.003‐2.102) | 0.048a |
Features with a P < 0.05 in univariate analysis were taken into multivariate analysis.
P < 0.05.
GC, gastric cancer; LRNN1, leucine‐rich repeat neuronal protein‐1.
3.2. Leucine‐rich repeat neuronal protein‐1 suppresses GC cell apoptosis
To further investigate the role of LRRN1 in GC, GSEA was carried out. We found that DNA replication, apoptosis, and cell cycle pathways were significantly enriched when LRRN1 expression was low (Figure 2A). We next knocked down LRRN1 expression in HGC‐27 cells using siRNA (Figure 2B,C), and rRNA‐depleted RNA‐Seq was then carried out (Figure 2D). The apoptosis pathway was found to be significantly enriched after LRRN1 knockdown by both GSEA and differential gene KEGG enrichment analysis (Figure 2E). HGC‐27 and SNU‐216 cell lines were chosen for further investigation because of their high levels of LRRN1 expression (Figure 1B,C). To evaluate the function of LRRN1 in GC, siRNA and shRNA knockdowns of LRRN1 were carried out in HGC‐27 and SNU‐216 cells. The efficiency of LRRN1 silencing was measured by qRT‐PCR and western blot (Figure 3A,B). LRRN1 knockdown significantly decreased the proliferation of HGC‐27 and SNU‐216 cells (Figure 3C). Moreover, the LRRN1‐shRNA‐transfected group formed fewer colonies than the NC‐shRNA‐transfected group (Figure 3D). Knocking down LRRN1 also significantly inhibited the ERK and AKT pathways (Figure 3E). Flow cytometry indicated that knocking down LRRN1 significantly increased the apoptosis of HGC‐27 and SNU‐216 cells (HGC‐27 siNC vs siRNA, P = 0.024; SNU‐216 siNC vs siRNA, P = 0.018) (Figure 3F). To further validate these results, we next overexpressed LRRN1 in the SGC‐7901 and AGS cell lines which express a low level of LRRN1 (Figure 4A,B), and the results were opposite of those seen in the LRRN1 knockdown cells (Figure 4C,D). These results show that LRRN1 expression impacts apoptosis in GC cells.
Figure 2.
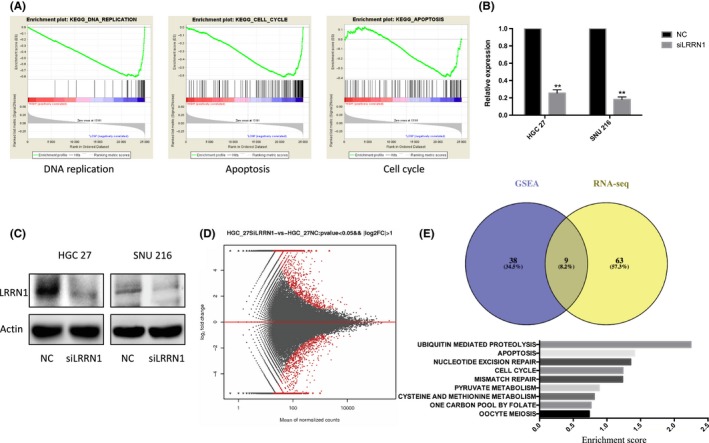
Leucine‐rich repeat neuronal protein‐1 (LRRN1) suppresses gastric cancer (GC) cells apoptosis. A, Gene Set Enrichment Analysis (GSEA) results showed that “DNA replication”, “apoptosis”, and “cell cycle” are significantly associated with LRRN1. B,C, HGC‐27 and SNU‐216 cells were transfected with either negative control (NC)‐siRNA or LRRN1‐siRNA. LRRN1 expression levels were detected by qRT‐PCR (B) and western blotting (C) analyses. D, MA plot of the differentially expressed genes using a cut‐off value of P < 0.05 and log2foldchange <−1 or >1. E, Kyoto Encyclopedia of Genes and Genomes (KEGG) pathway enrichment analysis was carried out on the differential genes, and the results obtained were compared with the GSEA pathway enrichment results. Error bar = SEM, **P < 0.01, indicates statistically significant difference
Figure 3.

Leucine‐rich repeat neuronal protein‐1 (LRRN1) knockdown inhibits proliferation and enhances apoptosis in gastric cancer (GC) cells. A,B, HGC‐27 and SNU‐216 cells were infected with negative control (NC) or LRRN1‐shRNA lentiviral particles. LRRN1 expression levels were detected by qRT‐PCR (A) and western blotting (B) analyses. C, Cell viability assays show that LRRN1 knockdown decreased GC cell proliferation. D, Number of colonies formed by GC cells transfected with LRRN1‐shRNA was fewer than those transfected with NC. E, Western blot shows that knocking down LRRN1 suppressed AKT and ERK pathways. F, Flow cytometry shows that apoptosis in the siLRRN1 group exceeded that in the NC group. Error bar = SEM, *P < 0.05, **P < 0.01 indicates statistically significant difference
Figure 4.
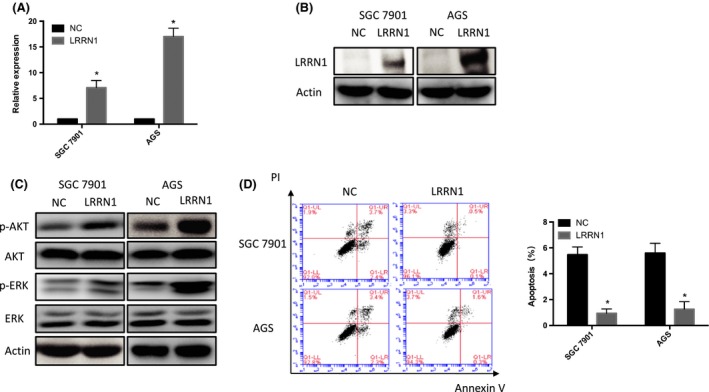
Leucine‐rich repeat neuronal protein‐1 (LRRN1) overexpression activates AKT and ERK pathways and inhibits apoptosis in gastric cancer (GC) cells. A,B, SGC‐7901 and AGS cells were infected with LRRN1 overexpression plasmid or the empty vector control. LRRN1 expression levels were detected by qRT‐PCR (A) and western blotting (B) analyses. C, Western blot shows that LRRN1 overexpression activated AKT and ERK pathways. D, Flow cytometry shows that apoptosis was lower in the LRRN1 overexpressed group than in the empty vector control group. Error bar = SEM, *P < 0.05, indicates statistically significant difference
3.3. Leucine‐rich repeat neuronal protein‐1 inhibits GC cell apoptosis by suppressing the Fas/FasL pathway
To further clarify the mechanism by which LRRN1 regulates the apoptosis of GC cells, we measured the expression levels of apoptotic pathway proteins that may be regulated downstream. As shown in Figure 5A, more evident activation of the extrinsic apoptotic pathway than the intrinsic pathway was observed. The Fas/FasL pathway, one of the most important components of the extrinsic apoptotic pathway, was significantly upregulated after LRRN1 knockdown (Figure 5A,B). We also found that either antibody‐mediated depletion of FasL or knockdown of Fas (Figure 5C) could eliminate the proapoptotic effect of LRRN1 knockdown (Figure 5D‐F). In conclusion, our results suggest that LRRN1 regulates the apoptosis of GC cells through the Fas/FasL pathway.
Figure 5.
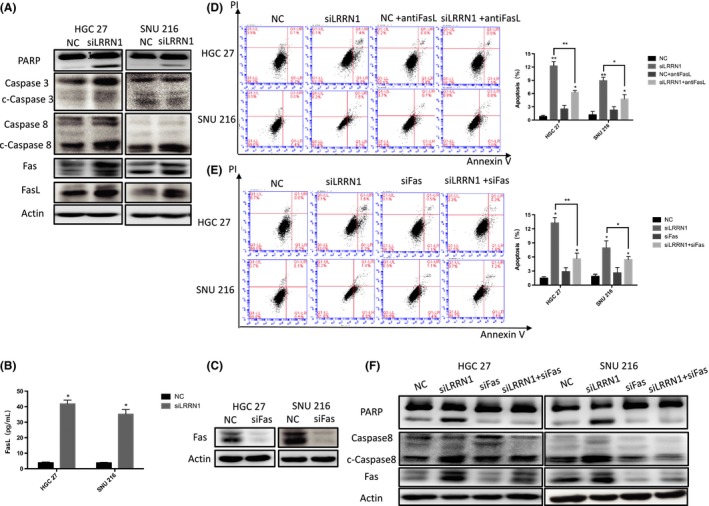
Knocking down leucine‐rich repeat neuronal protein‐1 (LRRN1) increases apoptosis by activating Fas/FasL. A, Western blot analysis shows that knocked down LRRN1 increased gastric cancer (GC) apoptosis by activating Fas/FasL. B, ELISA shows that FasL level increased in cell culture medium. C, Flow cytometry shows that adding FasL antibodies can reverse the apoptosis caused by knockdown of LRRN1. D,E, Flow cytometry shows that knocking down Fas can reverse the apoptosis caused by knockdown of LRRN1 and its western blot analysis (E). Error bar = SEM, *P < 0.05, **P < 0.01, indicates statistically significant difference
3.4. Leucine‐rich repeat neuronal protein‐1 inhibits the extrinsic apoptotic pathway in GC cells by inhibiting the activity of AP‐1
To determine how LRRN1 inhibits the Fas/FasL pathway and impacts extrinsic apoptosis, we selected the differentially expressed genes involved in apoptosis from the results of the rRNA‐depleted RNA‐Seq for further analysis (Figure 6A). One of these genes was JUN, a component of the classic apoptotic transcription factor AP‐1. We speculated that LRRN1 may impact the apoptosis of GC cells by regulating AP‐1. Our results showed that knocking down LRRN1 resulted in upregulation of both c‐jun and phosphorylated c‐jun (Figure 6B,C). Next, we investigated the role of JUN in suppressing GC cell apoptosis. We found that either knocking down JUN or treating the cells with JNKi (SP600125) downregulated Fas/FasL (Figure 6D,E) and eliminated the proapoptotic effect caused by knocking down LRRN1 (Figure 6F). These results suggest that LRRN1 suppresses GC cell apoptosis by inhibiting the activity of AP‐1 and the Fas/FasL pathway.
Figure 6.
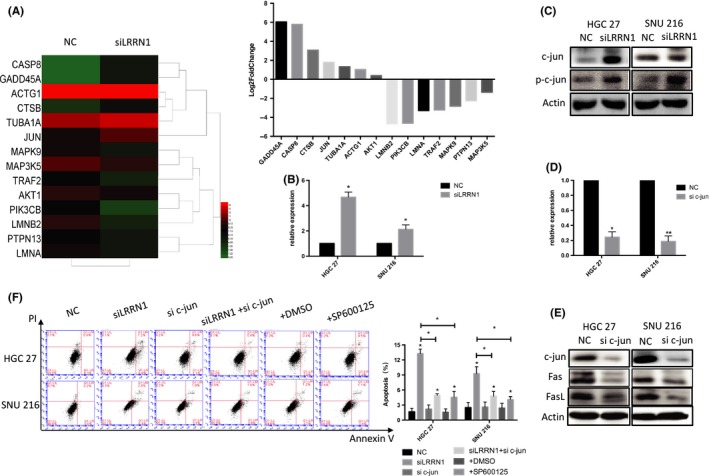
Knocking down leucine‐rich repeat neuronal protein‐1 (LRRN1) activating Fas/FasL by upregulating activator protein‐1 (AP‐1). A, Heat map and column chart of the differentially expressed genes in the apoptosis pathway. B, qRT‐PCR shows that knocking down LRRN1 upregulates c‐jun in mRNA level. C, Western blot analysis shows that knocking down LRRN1 upregulated both c‐jun and phosphorylated c‐jun. D, HGC‐27 and SNU‐216 cells were transfected with either negative control (NC)‐siRNA or JUN‐siRNA. JUN expression levels were detected by qRT‐PCR. E, Western blot analysis shows that knocking down JUN upregulates both c‐jun and phosphorylated c‐jun. F, Flow cytometry shows that knocking down c‐jun and JNKi treatment can reverse the apoptosis caused by knockdown of LRRN1. Error bar = SEM, *P < 0.05, **P < 0.01, indicates statistically significant difference
3.5. Leucine‐rich repeat neuronal protein‐1 suppresses GC cell apoptosis in vivo
To investigate whether LRRN1 can suppress the apoptosis of GC cells in vivo, HGC‐27‐shNC and HGC‐27‐shLRRN1 cells were injected into nude mice s.c. near the scapula. Xenograft tumors in which LRRN1 was knocked down grew more slowly than those that received the control shRNA (Figure 7A‐C). Using a TUNEL assay, we showed that LRRN1 knockdown promoted GC cell apoptosis in vivo (Figure 7D), which was consistent with our in vitro results. c‐jun, Fas, and FasL were upregulated in the HGC‐27‐shLRRN1 xenograft tumors compared to the HGC‐27‐shNC tumors, which was also consistent with the in vitro results (Figure 7E).
Figure 7.
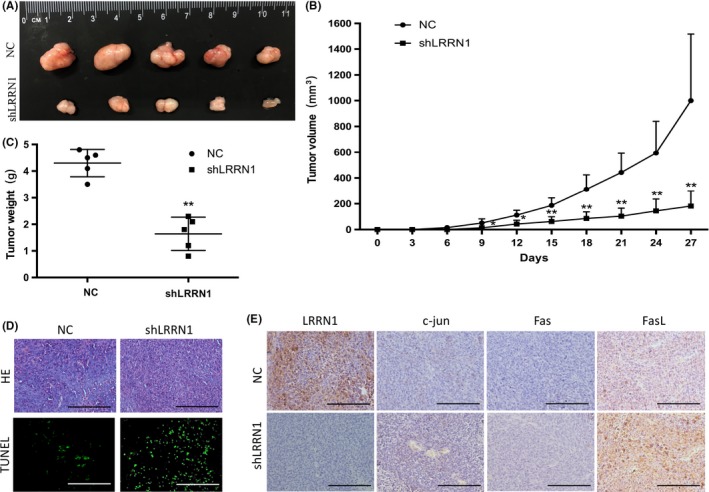
Leucine‐rich repeat neuronal protein‐1 (LRRN1) suppresses gastric cancer (GC) cell proliferation in vivo. A, HGC‐27 cells stably transfected with either LRRN1 shRNA (shLRRN1) or control shRNA (shNC) were s.c. injected into athymic nude mice (n = 5 per group). B, Tumor volume was evaluated every 3 d for 27 d. C, At day 27, mice were killed, and tumors were photographed and weighed. D, TUNEL staining of the paraffin sections of the xenograft tumors. E, Xenograft tumors with LRRN1, c‐jun, Fas and FasL was immunostaining. Error bar = SEM, *P < 0.05, **P < 0.01, indicates statistically significant difference. Scale bar, 200 μm
4. DISCUSSION
Gastric cancer causes a large number of deaths annually. Discovery of new diagnostic markers and new drug targets is essential to improve prognosis. LRRN1, one of the members of the leucine‐rich repeat neuronal family encoding type I transmembrane proteins, was previously shown to play an important role in embryonic development and stem cell differentiation.4 Many of the molecular pathways involved in embryonic development and stem cell differentiation are also involved in tumor development. Thus, it has been suggested that LRRN1 may play an important role in tumorigenesis and tumor development. However, its role in GC is unclear. The main results of the present study show that LRRN1 expression is an independent prognostic factor of GC associated with poor prognosis. Also, high expression level of LRRN1 suppresses GC cell apoptosis by inhibiting the Fas/FasL pathway.
Previously, LRRN1 was identified as a prognostic factor for high‐risk NB.7, 8 It was also reported that LRRN1 expression was higher in MYCN‐amplified primary neuroblastomas than in nonamplified ones, and that MYCN could upregulate LRRN1.7 It was also reported that LRRN1 positively regulates cell proliferation through activation of the extracellular signal‐regulated kinase mediated by EGF and IGF‐1.8 However, the significance and the role of LRRN1 in GC remain uncertain. In the present study, we showed that LRRN1 is widely upregulated in GC and that this correlates with poor prognosis and worsened clinicopathology. We then determined the prognostic value of LRRN1 in GC. Patients with higher LRRN1 expression had a poorer prognosis, whereas those with lower expression had a longer survival. Univariate and multivariate Cox regression analyses indicated that LRRN1 expression was an independent prognostic factor for GC. Based on these results, LRRN1 may be a potential biomarker for GC.
In order to elucidate the role of LRRN1 in the occurrence and development of GC, we knocked down LRRN1 in HGC‐27 GC cells. Bioinformatics analysis was used to determine which pathways LRRN1 may modulate, and apoptosis is one of these pathways. Apoptosis is an essential process for the homeostasis of multicellular organisms. Strict regulation of apoptosis plays a vital role in cancer.12 There are two main pathways of apoptotic cell death: one involves interactions of cell surface receptors, such as Fas and tumor necrosis factor‐α1, with their ligands, whereas the second pathway involves the mitochondria.13 We used flow cytometry to detect apoptosis in GC cell lines with knocked down LRRN1, and the results showed that knocking down LRRN1 enhanced the apoptosis of GC cells. We then examined changes to the apoptotic signaling pathways after knocking down LRRN1. The results suggest that the extrinsic apoptotic pathway, rather than the intrinsic pathway, is affected by LRRN1. The extrinsic apoptotic pathway is triggered by cell death ligands, leading to Fas‐associated death domain protein‐dependent caspase‐8 activation and mitochondrial‐independent cell death.14 Our results suggest that knocking down LRRN1 can activate the Fas/FasL pathway, and either knocking down Fas or adding anti‐FasL antibodies can reverse the proapoptotic effect caused by the LRRN1 knockdown. This shows that LRRN1 suppresses the apoptosis of GC cells by inhibiting the Fas/FasL pathway.
The transcription factor c‐jun, a component of AP‐1, is involved in the regulation of apoptosis and plays a vital role both in the extrinsic and intrinsic apoptotic pathways. The extrinsic pathway involves the interaction of death receptors with their ligands, and a recent report suggested that activation of c‐jun plays an important role in FasL expression.15, 16 Our results show that knocking down JUN or treating cells with JNKi downregulates Fas/FasL and eliminates the proapoptotic effect of knocking down LRRN1.
Overall, our results suggest that LRRN1 inhibits the Fas/FasL pathway and suppresses the apoptosis of GC cells by inhibiting AP‐1 activity. There are some limitations to the present study, and further comprehensive and in‐depth clinical analyses are needed to ensure that LRRN1 can be used as a biomarker. The mechanism by which LRRN1 regulates AP‐1 has not been elucidated fully and still needs further study. In this study, we confirmed that LRRN1 plays a significant role in GC. Importantly, LRRN1, an independent prognostic factor for GC, attenuates the apoptosis of GC cells and may serve as a potential prognostic biomarker and therapeutic target.
DISCLOSURE
Authors declare no conflicts of interest for this article.
ACKNOWLEDGMENTS
This work was supported by National Science and Technology Major Project of the Ministry of Science and Technology of China (No. 2017ZX09304025); National Natural Science Foundation of China (No. 81572374); National Natural Science Foundation of China (No. 81602098); Science and Technology Plan Project of Liaoning Province (No. 2016007010); The General Project of Liaoning Province Department of Education (No. LS201613); The General Projects of Liaoning Province Colleges and Universities (LFWK201706).
Liu B, Zhang Y, Fan Y, et al. Leucine‐rich repeat neuronal protein‐1 suppresses apoptosis of gastric cancer cells through regulation of Fas/FasL. Cancer Sci. 2019;110:2145–2155. 10.1111/cas.14042
Liu and Zhang contributed equally to this work.
Contributor Information
Yunpeng Liu, Email: ypliu@cmu.edu.cn.
Xiujuan Qu, Email: xiujuanqu@yahoo.com.
REFERENCES
- 1. Van Cutsem E, Sagaert X, Topal B, Haustermans K, Prenen H. Gastric cancer. Lancet. 2016;388:2654‐2664. [DOI] [PubMed] [Google Scholar]
- 2. Taguchi A, Wanaka A, Mori T, et al. Molecular cloning of novel leucine‐rich repeat proteins and their expression in the developing mouse nervous system. Brain Res Mol Brain Res. 1996;35:31‐40. [DOI] [PubMed] [Google Scholar]
- 3. Taniguchi H, Tohyama M, Takagi T. Cloning and expression of a novel gene for a protein with leucine‐rich repeats in the developing mouse nervous system. Brain Res Mol Brain Res. 1996;36:45‐52. [DOI] [PubMed] [Google Scholar]
- 4. Hamano S, Ohira M, Isogai E, Nakada K, Nakagawara A. Identification of novel human neuronal leucine‐rich repeat (hNLRR) family genes and inverse association of expression of Nbla10449/hNLRR‐1 and Nbla10677/hNLRR‐3 with the prognosis of primary neuroblastomas. Int J Oncol. 2004;24:1457‐1466. [PubMed] [Google Scholar]
- 5. Bando T, Sekine K, Kobayashi S, et al. Neuronal leucine‐rich repeat protein 4 functions in hippocampus‐dependent long‐lasting memory. Mol Cell Biol. 2005;25:4166‐4175. [DOI] [PMC free article] [PubMed] [Google Scholar]
- 6. Fukamachi K, Matsuoka Y, Kitanaka C, Kuchino Y, Tsuda H. Rat neuronal leucine‐rich repeat protein‐3: cloning and regulation of the gene expression. Biochem Biophys Res Comm. 2001;287:257‐263. [DOI] [PubMed] [Google Scholar]
- 7. Hossain MS, Ozaki T, Wang H, et al. N‐MYC promotes cell proliferation through a direct transactivation of neuronal leucine‐rich repeat protein‐1 (NLRR1) gene in neuroblastoma. Oncogene. 2008;27:6075‐6082. [DOI] [PubMed] [Google Scholar]
- 8. Hossain S, Takatori A, Nakamura Y, Suenaga Y, Kamijo T, Nakagawara A. NLRR1 enhances EGF‐mediated MYCN induction in neuroblastoma and accelerates tumor growth in vivo. Cancer Res. 2012;72:4587‐4596. [DOI] [PubMed] [Google Scholar]
- 9. Liao CH, Wang YH, Chang WW, et al. Leucine‐Rich Repeat Neuronal Protein 1 Regulates Differentiation of Embryonic Stem Cells by Post‐Translational Modifications of Pluripotency Factors. Stem Cells. 2018;36:1514‐1524. [DOI] [PubMed] [Google Scholar]
- 10. Deng M, Yu R, Wang S, et al. Limb‐bud and heart attenuates growth and invasion of human lung adenocarcinoma cells and predicts survival outcome. Cell Physiol Biochem. 2018;47:223‐234. [DOI] [PubMed] [Google Scholar]
- 11. Wang X, Che X, Liu C, et al. Cancer‐associated fibroblasts‐stimulated interleukin‐11 promotes metastasis of gastric cancer cells mediated by upregulation of MUC1. Exp Cell Res. 2018;368:184‐193. [DOI] [PubMed] [Google Scholar]
- 12. Mohamed MS, Bishr MK, Almutairi FM, Ali AG. Inhibitors of apoptosis: clinical implications in cancer. Apoptosis. 2017;22:1487‐1509. [DOI] [PubMed] [Google Scholar]
- 13. Vanden Berghe T, Kaiser WJ, Bertrand MJ, Vandenabeele P. Molecular crosstalk between apoptosis, necroptosis, and survival signaling. Mol Cell Oncol. 2015;2:e975093. [DOI] [PMC free article] [PubMed] [Google Scholar]
- 14. Savitskaya MA, Onishchenko GE. Mechanisms of apoptosis. Biochemistry (Mosc). 2015;80:1393‐1405. [DOI] [PubMed] [Google Scholar]
- 15. Saba‐El‐Leil MK, Fremin C, Meloche S. Redundancy in the world of MAP kinases: all for one. Front Cell Dev Biol. 2016;4:67. [DOI] [PMC free article] [PubMed] [Google Scholar]
- 16. Dong Y, Shen X, He M, et al. Activation of the JNK‐c‐Jun pathway in response to irradiation facilitates Fas ligand secretion in hepatoma cells and increases hepatocyte injury. J Exp Clin Cancer Res. 2016;35:114. [DOI] [PMC free article] [PubMed] [Google Scholar]