Abstract
Cholangiocarcinoma (CCA) is a malignant tumor originating from bile duct epithelium and its incidence is increasing year by year. In recent years, long noncoding RNAs (lncRNAs) have been found to play an important role in the occurrence and progression of malignant tumors. In the present study, for the first time, abnormal expression of lnc‐RNA component of mitochondrial RNA processing endoribonuclease (RMRP) and its possible role in CCA were found. We explored the effects of RMRP on various behaviors of CCA cells in vitro and in vivo. In addition, by second‐generation sequencing, we explored the microRNA expression profiles that RMRP may affect in the HCCC‐9810 cell line. We also validated and explored the role of microRNA‐217 (miR‐217) with high differential expression by in vitro experiments. Our findings indicated that RMRP can play a part in promoting cancer by regulating the expression of miR‐217. RMRP is involved in the progression of CCA and can be a novel indicator of poor prognosis in patients with CCA.
Keywords: cholangiocarcinoma, lncRNA, microRNA, miR‐217, RMRP
1. INTRODUCTION
Cholangiocarcinoma (CCA) is a highly heterogeneous malignant tumor that originates from bile duct epithelium.1 Clinically, CCA is often categorized as two categories, intrahepatic CCA and extrahepatic CCA, according to its position in the bile duct tree. The occurrence of CCA in the primary tumor of the hepatobiliary system is inferior only to the first primary liver cancer, accounting for approximately 10%‐15% of hepatobiliary malignancies. The incidence of CCA has increased year by year worldwide, especially in Western countries.2 Due to the rapid progression and lack of specific biomarker, CCA is often diagnosed at an advanced stage when patients have missed the opportunity for effective surgical treatment.1, 3 Thus, seeking key molecules in the progression of CCA is of great importance for the diagnosis, treatment and prognosis of CCA.
LncRNA (long noncoding RNA) is a type of transcript that is longer than 200 nt and has no ability to code protein. Initially, noncoding RNAs (ncRNAs) were considered to be transcriptional noise of genes as a result of their inability to encode proteins. Genome‐plan research shows that, among the 3 billion base pairs that make up the human genome, only 1.5% of nucleic acid sequences are used for protein coding, which means the other 98.5% has no protein‐coding function.4 In recent years, growing evidence has suggested that lncRNAs participate in a series of physiological and pathological activities (including species evolution, embryonic development etc.) by regulating gene expression at epigenetic, transcriptional and post‐transcriptional levels.5 Meanwhile, differentially expressed lncRNAs have been found to play an important role in cancer by taking part in generation, proliferation, apoptosis and other biological processes of cancer cells.6 For example, investigation has shown that B3GALT5‐AS1 repressed miR‐203 expression, thereby upregulating ZEB2 and SNAI2, and inducing epithelial‐to‐mesenchymal transition in colon cancer.7 However, there is still little knowledge about lncRNAs in CCA as a result of unavailability of CCA tissues. Our previous studies on CCA bile‐derived exosomes showed that the dysregulated lncRNAs may serve as molecular markers for the diagnosis of CCA.8 Nevertheless, their expression in CCA tissues and their role in the progression of CCA are not yet clear.
In the present study, we detected the expression of 10 lncRNAs which were differentially expressed in CCA bile‐derived exosomes in CCA tissues and cell lines by quantitative RT‐PCR (qRT‐PCR) and lnc‐RNA component of mitochondrial RNA processing endoribonuclease (RMRP), which is the only product of the RMRP gene and 277 nt long, was selected for further investigation. Then, we explored the possible role of RMRP in CCA through a series of cell and animal experiments. Studies have suggested that lncRNA may regulate microRNAs (miRNAs), which lead to mRNA cleavage or translational repression. For example, lncRNA APF regulates miR‐188‐3p, and thus affects ATG7 expression, autophagic cell death and myocardial infarction in the heart.9 Hence, we determined the effect of dysregulated RMRP on the downstream miRNA expression profile using second‐generation sequencing technology. Moreover, we verified one of the dysregulated miRNAs, miR‐217, and briefly explored its function. Overexpression of miR‐217 can restrain the unlimited proliferation of HCCC‐9810 cell line caused by RMRP. Our data shed new light on the interaction between lncRNAs and miRNAs in CCA and suggest a new approach to the poor diagnosis and treatment.
2. MATERIALS AND METHODS
2.1. Clinical samples
Cholangiocarcinoma and adjacent tissues (n = 33) were obtained by surgical operations from the Second Affiliated Hospital of Nanjing Medical University from June 2014 to April 2018. This study was approved by the Second Affiliated Hospital of Nanjing Medical University Review Board. All patients provided signed informed consent. All tissues were taken and rapidly placed in liquid nitrogen. All clinical experiments were approved by the research ethics committee of Nanjing Medical University (Nanjing, Jiangsu, China).
2.2. Cell culture
Cholangiocarcinoma cell lines (HCCC‐9810 and RBE) were obtained from the Institute of Biochemistry and Cell Biology of the Chinese Academy of Sciences (ICBC, Shanghai, China). HCCC‐9810 and RBE cell lines were cultured in RMPI‐1640 (HIBEpiC in DMEM) (Gibco) containing 10% FBS (ScienCell), 100 mg/mL streptomycin, and 100 U/mL penicillin in a cell incubator (37°C, 5% CO2). When the cell confluence reached 80%‐90%, the cells were digested by trypsinase for passage.
2.3. RNA extraction and qRT‐PCR
RNA was extracted according to protocols in the specifications. The reverse transcription reaction was conducted using PrimeScript RT reagent Kit with gDNA Eraser (RR047A; Takara, Dalian, China) as follows: 42°C for 2 minutes after preparing the first 10 μL system to erase gDNA, and 85°C for 5 minutes after preparing 10 μL Master Mix and mixing with the first 10 μL of the mixture to perform reverse transcription reaction. The obtained cDNA was subjected to PCR amplification under the following conditions: 95°C for 5 seconds and 60°C for 34 seconds for a total of 40 cycles. GAPDH was selected as reference gene and the method was used to calculate the relative expression. Primers used are listed in Appendix S1.
2.4. Transfection
HCCC‐9810 and RBE cells were seeded in 6‐well plates at a density of approximately 1:36 per well when cell confluence in 10‐cm culture dishes was up to 70%‐80%. When the cell confluency of 6‐well plates was approximately 60%, siRNAs (or miRNA mimics/pc‐DNA) were transfected into cells using Lipofectamine 3000 (ThermoFisher Scientific, Waltham, MA, USA) according to the product instructions. All the mentioned sequences are listed in Appendix S1.
2.5. Determination of cell viability
Twenty‐four hours after transfection, cells of control and treated groups were seeded into 96‐well plates from 6‐well plates. Each treatment corresponded to six repeated wells in a 96‐well plate, and 200 μL single‐cell suspension containing 5 × 10³ cells was added to each well. The cells were repeatedly seeded in five 96‐well plates. Six hours after inoculation (marked as 0 hour), one of the five 96‐well plates was taken and viability of the cells after adherence was determined in each well. At the following 24, 48, 72, and 96 hour points, 20 μL CCK‐8 solution was added to each well of a 6‐well plate, placed in a 37°C, 5% CO2 incubator for 2‐3 hours, and assayed using a microplate reader. Absorbance (OD value) was at a wavelength of 450 nm, and only CCK‐8 solution and culture medium (without cells) were added to the blank controls.
2.6. Determination of apoptosis
Cells were washed twice with cold PBS and then resuspended in 1× Binding Buffer at a concentration of 1 × 10⁶ cells/mL. One hundred microliters of the solution (1 × 10⁵ cells) was transferred to a 5 mL culture tube. Five microliters of FITC Annexin V and 5 μL PI (Propidium Iodide) were added to the tube. The cells were gently vortexed and incubated for 15 minutes at room temperature (RT; 25°C) in the dark. Addition of 400 μL of 1× Binding Buffer to each tube was carried out and then analysis by flow cytometry within 1 hour was done.
2.7. Determination of cell cycle
Cell sample(s) were harvested, fixed and washed. All fixative should be removed from cells before proceeding with cell staining. Flow cytometry samples (each containing ~1 × 10⁶ cells in suspension) were prepared. The samples were centrifuged and the supernatant was discarded, leaving a pellet of cells in each sample tube. Addition of 0.5 mL FxCycle PI/RNase Staining Solution stain to each flow cytometry sample was done, and the contents were mixed well. The samples were incubated for 15–30 minutes at RT, protected from light. The samples were analyzed without washing, using 488 nm excitation, and emissions collected using a 585/42 bandpass filter.
2.8. Nude mice xenografts
HCCC‐9810 cells (3 × 10⁶) transfected with sh‐RMRP (sh‐03) or negative control were injected s.c. into male nude mice. Subcutaneous tumors were observed every 3 days. Length and width of the tumors were measured and recorded every 2 days (V = L × W 2/2). The mice were killed 14 days after tumorigenesis. The tumors were removed and photographed, weighed and measured. All animal experiments were conducted in accordance with the guidelines and rules for the protection and utilization of experimental animals of Nanjing Medical University.
2.9. MicroRNA sequencing and analysis
Further miRNA sequencing was carried out by Beijing Genomics Institute (BGI) using the Illumina Genome Analyzer. The specific procedure is as follows: 18‐30 nt sRNA fragments were isolated and then ligated to a 5′ adaptor and a 3′ adaptor. The ligated product was used as a template for cDNA synthesis in PCR amplification, and the amplified product was used for the library for cluster generation and sequencing.
Based on the assumption that RNA sequencing is a random process and each sequence is uniformly random from the respective sample, we can account that the expression of each gene (transcript) obeys a binomial distribution (or Poisson distribution). Using the above model, DEGseq10 calculates differential expression based on MA‐plot.11 The P‐value of each gene is reused. Q‐value performs multiple hypothesis tests and corrections, and is considered to be a significant differentially expressed gene when the coincidence difference is two times or more and the Q‐value value is ≤0.001.
2.10. Gene ontology analysis
Gene ontology (GO) analysis first mapped all target genes corresponding to differentially expressed small RNAs to each term of the Gene Ontology database (http://www.geneontology.org/), calculated the number of genes for each term, and then applied the hypergeometric test to determine significantly enriched GO terms in differentially expressed target genes corresponding to small RNAs compared to the entire genomic background. Referring to the software ‘GO::TermFinder’ ( http://www.yeastgenome.org/help/analyze/go-term-finder), BGI have developed a strict algorithm to carry out this analysis. After the calculated P‐value was corrected by Bonferroni mentioned in Encyclopedia of Measurement and Statistics, the corrected P‐value ≤ 0.05 was used as a threshold. The GO term satisfying this condition was defined as the GO term significantly enriched in target genes corresponding to differentially expressed small RNAs.
2.11. Pathway analysis
Kyoto Encyclopedia of Genes and Genomes (KEGG) is the main public database for Pathway. The pathway significance enrichment analysis uses the KEGG Pathway as a unit and applies hypergeometric tests to identify significant differences in target genes that differentially express small RNAs compared to the entire genomic background. Pathways with Q‐value ≤.05 are defined as Pathways that are significantly enriched in differentially expressed genes.
2.12. Statistical analysis
SPSS 22.0 statistical software was used for data analysis. GraphPad Prism 6.0 and Excel were used for image editing. Comparison of measured data was done using paired t test. Classification data were compared using chi‐squared test. All patients were divided into RMRP‐high group and RMRP‐low group according to the level of RMRP expression (demarcated by the median of RMRP expression). Survival curves were evaluated using the Kaplan‐Meier method, and differences in survival distributions were assessed by the log‐rank test. P < .05 was considered statistically significant (*P < .05, **P < .01, ***P < .001).
3. RESULTS
3.1. High expression of RMRP was observed in CCA tissues and cell lines
Our previous study showed differentially expressed lncRNAs in exosomes derived from bile of CCA patients.8 To investigate whether the indicated lncRNAs previously sequenced and verified in CCA bile exosomes were differentially expressed in CCA tissues, we first used qRT‐PCR to detect and compare the expression levels of 10 lncRNAs in CCA and adjacent tissues. Results showed that expressions of ENST00000601661.1, NR_003051 and ENST00000516869.1 in CCA tissues were significantly higher than those in adjacent tissues compared to the other seven lncRNAs (Figure 1, A1‐A10). Because bile is produced in the liver, stored by the gallbladder, transported to the duodenum, and flows in enterohepatic circulation, the source of bile exosomes is uncertain. As to the consistent high expression of three lncRNAs in both bile exosomes and tissues of patients with CCA, we speculated that high expression of three lncRNAs in bile exosomes may originate from CCA tissues.
Figure 1.
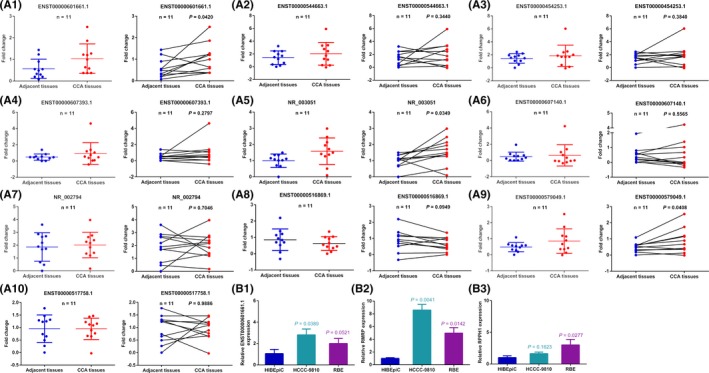
RNA component of mitochondrial RNA processing endoribonuclease (RMRP) is overexpressed in cholangiocarcinoma (CCA) tissues and cell lines. qRT‐PCR was used to detect the expression of (A) 10 dysregulated long noncoding RNAs in bile‐derived exosomes in CCA patients, (B) ENST00000601661.1, ENST00000516869.1 (RPPH1) and RMRP(NR_003051) in normal epithelial bile duct cell line (HIBEpiC) and CCA cell lines (HCCC‐9810 and RBE). Representative data are based on three independent experiments. Bars, ±SD
In order to further explore the possible role of the above three lncRNAs in the progression of CCA, we measured their expression abundances in two CCA cell lines (HCCC‐9810 and RBE) and in a normal bile duct epithelial cell line (HIBEpiC). qRT‐PCR results showed that compared with ENST00000601661.1 and ENST00000516869.1 (RPPH1), the difference of RMRP (NR_003051) expression in CCA and biliary epithelial cell lines was more significant (Figure 1, B1‐B3). The above results showed that the differential expression fold change of RMRP in tissues was also higher than in the other two lncRNAs. Together, the results suggest that RMRP was highly expressed in CCA tissues and cell lines. Therefore, our next research was focused on RMRP.
3.2. Inhibition of RMRP expression suppressed the characteristics of CCA cell lines
To investigate whether RMRP promotes cancer cell characteristics in CCA cell lines, we carried out a series of functional assays after knocking down RMRP in CCA cell lines. First, we knocked down the expression of RMRP by transfecting siRNA (si‐03, si‐07, si‐10) into HCCC‐9810 and RBE. Transfection of si‐03 and si‐07 into cells resulted in better knockdown efficiency relative to si‐10 (Figure 2A). CCK‐8 assay showed that RMRP knockdown in CCA cell lines resulted in a significant decrease in cell viability (Figure 2B). Furthermore, as shown in Figure 2C, the ability of individual CCA cells to form clones was significantly reduced when si‐RMRP was transfected into HCCC‐9810 and RBE. Transwell assay suggested that lower RMRP expression in CCA cells corresponded to poorer cell migration capacity (Figure 2D). In order to further determine the reasons for the decreased viability of cell lines after RMRP knockdown, we determined cell cycle and apoptosis studies using flow cytometry. Apoptosis analysis showed that si‐RMRP transfection increased the cell apoptosis rate in both cell lines (Figure 2E). Moreover, HCCC‐9810 and RBE were arrested in the G0/G1 phase after RMRP was knocked down (Figure 2F). In addition, we transfected RMRP plasmids into normal bile duct epithelial cell line HIBEpiC with low RMRP expression (Figure S1A). Cell viability increased (Figure S1B) and enhanced capability of colony formation was observed (Figure S1C) in HIBEpiC after RMRP overexpression. The above results showed that inhibition of RMRP expression suppressed the characteristics of CCA cell lines.
Figure 2.
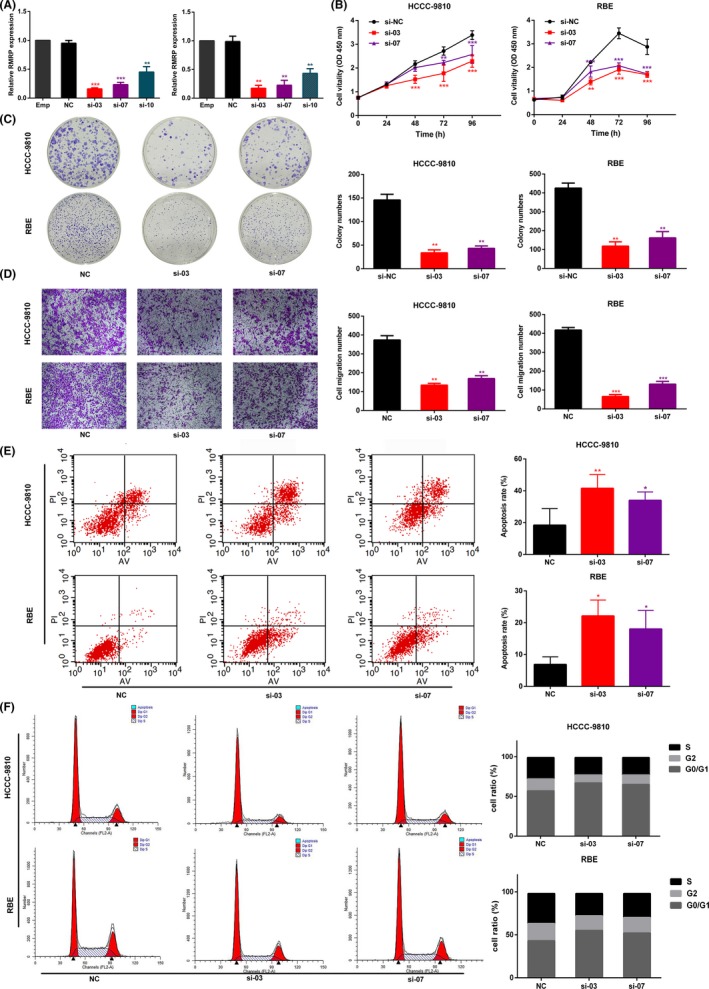
Inhibition of RNA component of mitochondrial RNA processing endoribonuclease (RMRP) suppressed the characteristics of HCC‐9810 and RBE cell lines. A, RMRP was effectively silenced in HCCC‐9810 and RBE cell lines transfected with si‐03 and si‐07 by qRT‐PCR compared to si‐control. In both cholangiocarcinoma cell lines, (B) CCK‐8 assay was used to determine the cell viability of si‐RMRP (si‐03, si‐07) group and si‐control group. C, Colony numbers of control group were significantly greater than those of si‐RMRP group. D, Transwell assay was used to compare the migration ability between control group and RMRP knockdown group. E, Apoptosis rate was higher after RMRP was silenced compared to control group. F, Flow cytometry assay was used to analyze the cell cycle, and cell cycle was blocked in G0/G1 phase after RMRP was knocked down. Representative data based are on three independent experiments. Bars, ±SD. *P < .05, **P < .01, ***P < .001. si‐NC, siRNA/negative control
3.3. Knockdown of RMRP inhibited CCA tumorigenesis in vivo
To prove the oncogenic effect of RMRP in CCA more comprehensively, we carried out tumorigenic experiments in nude mice. Similar to our in vitro findings, the volume and the weight of HCCC‐9810 xenografts were less than in the control group when RMRP was knocked down (Figure 3A,C). In addition, we plotted the growth curve of the tumor by recording the length and width of the tumor in nude mice every other day. As shown in Figure 3B, the growth rate of tumors in the RMRP knockdown group was significantly lower than that in the control group. Subsequently, we measured the expression of RMRP in the extracted tumors. qRT‐PCR results confirmed that RMRP expression was lower in the xenografts originating from the sh‐RMRP HCCC‐9810 cell line (Figure 3D). Furthermore, immunohistochemistry (IHC) results showed that, compared to the control group, Ki‐67‐positivity rate of tumor cells was significantly lower in the sh‐RMRP group (Figure 3E). All of the cellular and animal experiments demonstrated that RMRP acts as an oncogene in CCA.
Figure 3.
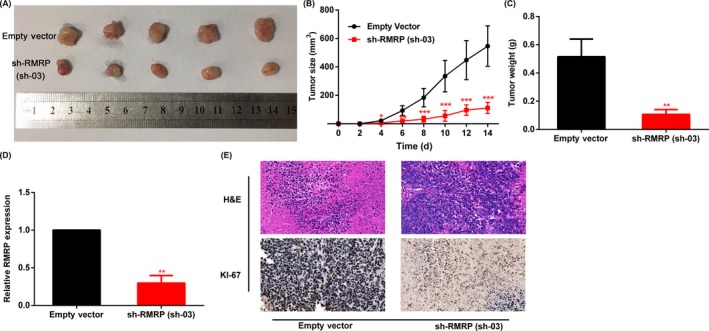
Knockdown of RNA component of mitochondrial RNA processing endoribonuclease (RMRP) inhibits cholangiocarcinoma tumorigenesis in vivo. A, Nude mice were injected with HCCC‐9810 transfected with sh‐03 and control group cells. Tumors were resected 14 days after xenografts were visible and photographed. B, Growth curve was calculated by the length and width of tumors after injection every 2 days (volume = L*W 2/2). C, Weight of the above removed tumors. D, RMRP expression of the removed tumors by qRT‐PCR. E, Images of H&E staining and Ki‐67‐positive cell rate, which were carried out using the removed tumors. Representative data are based on three independent experiments. Bars, ±SD. *P < .05, **P < .01, ***P < .001
3.4. MicroRNA expression profile after RMRP knockdown
As another member of noncoding RNA, miRNA is approximately 22 nucleotides in length. Studies have shown that miRNAs participate in post‐transcriptional gene expression regulation by acting on mRNAs of their target gene in diseases.12 LncRNAs can participate in the regulation of miRNA expression through the apparent regulation of miRNA gene promoter regions or the regulation of endonucleases involved in miRNA maturation.13 The above data suggest that RMRP is overexpressed in CCA tissues and cell lines and is related to the characteristics of CCA cell lines. Accordingly, second‐generation sequencing of miRNA in the HCCC‐9810 cell line was carried out after RMRP knockdown (Table S1–S6). Out of 2769 detected miRNAs, 729 were differentially regulated in the RMRP‐knockdown HCCC‐9810 cells compared to the control cells (P < .05, log2ratio(siRNA/negative control [si/NC]) >2). The top 10 upregulated and downregulated genes are listed in Tables 1 and 2 and shown by a heatmap (Figure 4A).
Table 1.
Top 10 upregulated microRNAs
| miRNA ID | log2ratio(si/NC) | Up/Downregulation | P‐value | Q‐value |
|---|---|---|---|---|
| hsa‐miR‐33a‐3p | 12.3912346 | Up | 2.63E‐165 | 7.15E‐165 |
| hsa‐miR‐186‐5p | 12.25421512 | Up | 2.61E‐154 | 6.80E‐154 |
| hsa‐miR‐216a‐5p | 11.95342579 | Up | 1.40E‐132 | 3.46E‐132 |
| hsa‐miR‐885‐5p | 11.87942521 | Up | 1.06E‐127 | 2.59E‐127 |
| hsa‐miR‐155‐3p | 11.27009816 | Up | 1.38E‐93 | 2.98E‐93 |
| hsa‐miR‐217 | 11.22734851 | Up | 1.48E‐91 | 3.13E‐91 |
| hsa‐miR‐4488 | 10.78677592 | Up | 6.17E‐73 | 1.20E‐72 |
| hsa‐miR‐1290 | 10.36189064 | Up | 1.83E‐58 | 3.24E‐58 |
| novel_mir252 | 10.3218132 | Up | 2.99E‐57 | 5.26E‐57 |
| hsa‐miR‐31‐3p | 10.28059054 | Up | 4.99E‐56 | 8.64E‐56 |
miRNA, microRNA; si/NC, siRNA/negative control.
Table 2.
Top 10 downregulated microRNAs
| miRNA ID | log2ratio(si/NC) | Up/Downregulation | P‐value | Q‐value |
|---|---|---|---|---|
| hsa‐miR‐345‐5p | −6.249998687 | Down | 1.75E‐46 | 2.78E‐46 |
| hsa‐miR‐1275 | −6.158850799 | Down | 7.73E‐44 | 1.21E‐43 |
| hsa‐miR‐4454 | −6.071107904 | Down | 2.01E‐41 | 3.11E‐41 |
| hsa‐miR‐7‐1‐3p | −5.883216356 | Down | 1.18E‐36 | 1.77E‐36 |
| hsa‐miR‐7975 | −5.776301152 | Down | 3.60E‐34 | 5.22E‐34 |
| hsa‐let‐7a‐3p | −5.76457186 | Down | 6.60E‐34 | 9.50E‐34 |
| hsa‐miR‐1293 | −5.582821423 | Down | 4.62E‐30 | 6.27E‐30 |
| hsa‐miR‐30c‐2‐3p | −5.555854375 | Down | 1.58E‐29 | 2.12E‐29 |
| novel_mir18 | −5.555854375 | Down | 1.58E‐29 | 2.12E‐29 |
| hsa‐miR‐181d‐5p | −5.464558541 | Down | 8.87E‐28 | 1.16E‐27 |
miRNA, microRNA; si/NC, siRNA/negative control.
Figure 4.
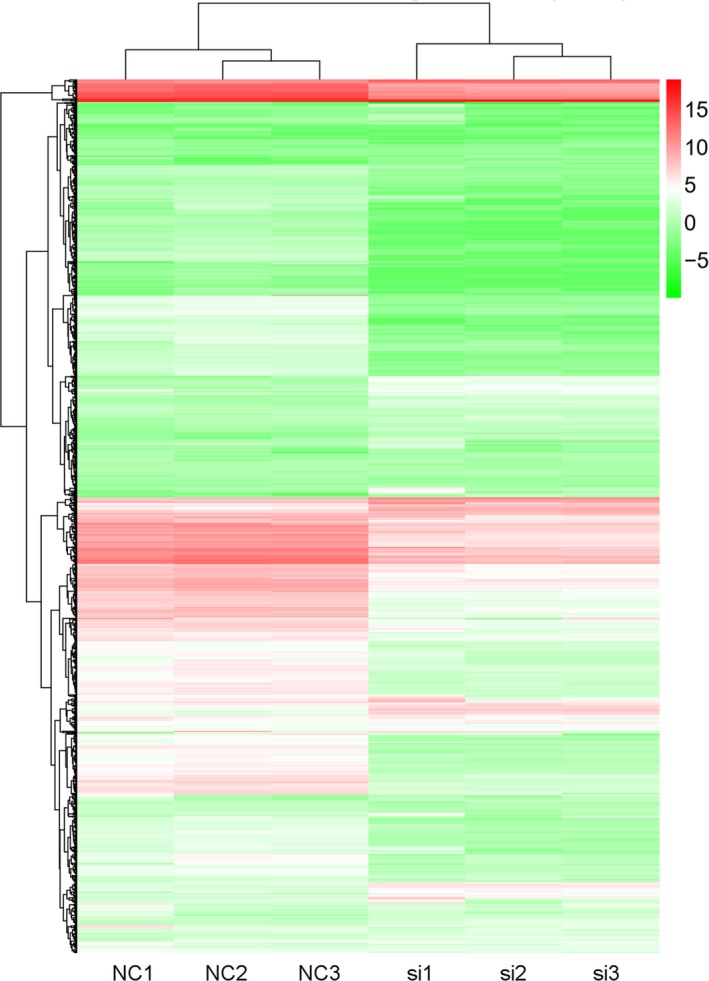
MicroRNA expression profile after RNA component of mitochondrial RNA processing endoribonuclease (RMRP) knockdown (using si‐03). Heatmap of the differentially expressed microRNAs. NC, negative control
The GO functional significance enrichment analysis gives a significantly enriched GO function entry in the target genes corresponding to the differentially expressed small RNA compared to the genomic background. The top 10 GO function terms of three ontologies, respectively, describing molecular function, biological processes and cellular components are listed in Tables 3, 4, 5. The processes with most significance in three ontologies were organ development structural molecular activity, organ development and extracellular region severally. Analysis of significant enrichment of GO is shown in Figure 5A. In vivo, different genes coordinate their biological functions, and Pathway‐based analysis helps to further understand the biological functions of genes. We carried out Pathway enrichment analysis of differential genes using the KEGG public database.14 We analyzed the enrichment path of differential genes by two evaluation methods. One analysis was directly through the Q‐value. The closer the Q‐value is to 0, the more pronounced the enrichment. The top 10 pathway entries for enrichment evaluated by Q‐value are shown in Figure 5B and Table 6. Pathways with most significance were systemic lupus erythematosus, ribosome and signaling pathways regulating pluripotency of stem cells according to the Q‐value. Another type of analysis was carried out by using RichFactor, which refers to the ratio of the number of genes located in the pathway entry of the target gene for differential small RNAs to the total number of genes located in the pathway entry for all annotated genes (Figure 5C). The larger the RichFactor, the more enriched the target gene of the differential gene in this pathway.
Table 3.
Top 10 gene ontology (GO) function terms describing molecular function
| GOMFID | Sample no. | Background no. | P‐value | Term |
|---|---|---|---|---|
| GO:0005198 | 770 | 2619 | 4.96e‐08 | Structural molecular activity |
| GO:0005201 | 116 | 280 | 1.69e‐07 | Extracellular matrix structural constituent |
| GO:0005501 | 46 | 79 | 1.96e‐07 | Retinoid binding |
| GO:0019840 | 47 | 82 | 2.61e‐07 | Isoprenoid binding |
| GO:0005125 | 199 | 575 | 1.02e‐05 | Cytokine activity |
| GO:0001972 | 29 | 51 | 0.00129 | Retinoic acid binding |
| GO:0016209 | 80 | 206 | 0.00347 | Antioxidant activity |
| GO:0003774 | 184 | 565 | 0.00432 | Motor activity |
| GO:0005102 | 1581 | 6044 | 0.01872 | Receptor binding |
| GO:0005132 | 13 | 17 | 0.02097 | Interferon‐alpha/beta receptor binding |
Table 4.
Top10 gene ontology (GO) function terms describing biological processes
| GOBPID | Sample no. | Background no. | P‐value | Term |
|---|---|---|---|---|
| GO:0048513 | 3264 | 12387 | 2.24e‐08 | Organ development |
| GO:0009952 | 233 | 646 | 2.61e‐08 | Anterior/posterior pattern specification |
| GO:0009888 | 1656 | 2048 | 4.17e‐07 | Tissue development |
| GO:0043062 | 365 | 1151 | 8.78e‐06 | Extracellular structure organization |
| GO:0030198 | 363 | 1145 | 1.01e‐05 | Extracellular matrix organization |
| GO:0010033 | 2586 | 9820 | 1.10e‐05 | Response to organic substance |
| GO:0031424 | 48 | 89 | 1.12e‐05 | Keratinization |
| GO:0008544 | 313 | 968 | 1.45e‐05 | Epidermis development |
| GO:0045165 | 295 | 911 | 3.60e‐05 | Cell fate commitment |
| GO:0044707 | 6675 | 26585 | 4.32e‐05 | Single‐multicellular organism process |
Table 5.
Top10 gene ontology (GO) function terms describing cellular components
| GOCCID | Sample no. | Background no. | P‐value | Term |
|---|---|---|---|---|
| GO:0005576 | 4450 | 16283 | 2.67e‐26 | Extracellular region |
| GO:0044421 | 3870 | 14044 | 9.07e‐25 | Extracellular region |
| GO:0045095 | 88 | 134 | 2.40e‐21 | Keratin filament |
| GO:0005615 | 1378 | 4570 | 5.19e‐20 | Extracellular space |
| GO:0005882 | 175 | 379 | 3.96e‐18 | Intermediate filament |
| GO:0043230 | 2804 | 10332 | 7.79e‐13 | Extracellular organelle |
| GO:0065010 | 2804 | 10332 | 7.79e‐13 | Extracellular membrane‐bounded organelle |
| GO:0070062 | 2803 | 10330 | 8.59e‐13 | Extracellular vesicular exosome |
| GO:0031012 | 557 | 1746 | 2.26e‐11 | Extracellular matrix |
| GO:0031988 | 3557 | 13546 | 6.31e‐09 | Membrane‐bounded vesicle |
Figure 5.
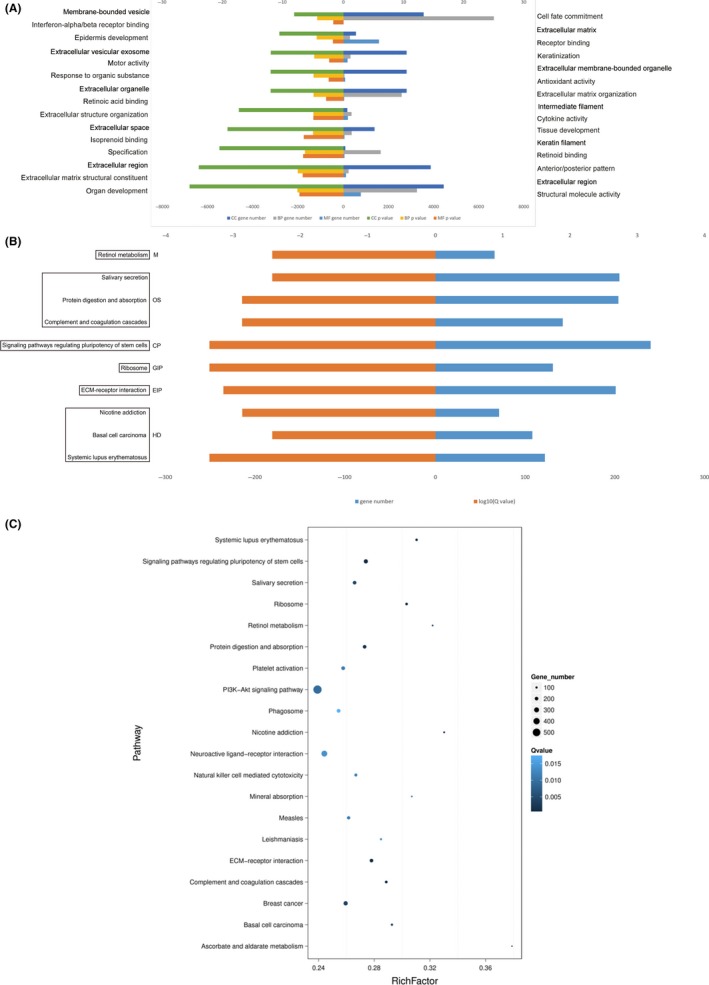
Analysis of the differentially expressed genes. A, Gene ontology (GO) analysis of the differentially expressed genes. Kyoto Encyclopedia of Genes and Genomes (KEGG) pathway enrichment analysis of the differentially expressed genes presented by (B) P‐value and (C) RichFactor (RichFactor refers to the ratio of the number of genes in the pathway entry of the differential small RNA to the total number of genes in the pathway entry in all the annotated genes. The larger the RichFactor, the greater the degree of enrichment.)
Table 6.
Top 10 KEGG pathways (according to Q‐value)
| Term | ID | Sample no. | Background no. | P‐value | Q‐value | Level 1 |
|---|---|---|---|---|---|---|
| Systemic lupus erythematosus | ko05322 | 122 | 393 | 2.066325e‐06 | 0.0004342557 | Human diseases |
| Ribosome | ko03010 | 131 | 432 | 3.463305e‐06 | 0.0004342557 | Genetic information processing |
| Signaling pathways regulating pluripotency of stem cells | ko04550 | 240 | 876 | 3.996218e‐06 | 0.0004342557 | Cellular processes |
| Extracellular matrix‐receptor interaction | ko04512 | 201 | 723 | 8.616936e‐06 | 0.0007022803 | Environmental information processing |
| Complement and coagulation cascades | ko04610 | 142 | 492 | 2.373606e‐05 | 0.0013352292 | Organismal systems |
| Protein digestion and absorption | ko04974 | 204 | 747 | 2.457477e‐05 | 0.0013352292 | Organismal systems |
| Nicotine addiction | ko05033 | 71 | 215 | 2.880416e‐05 | 0.0013414509 | Human diseases |
| Basal cell carcinoma | ko05217 | 108 | 369 | 0.0001137409 | 0.0037463268 | Human diseases |
| Salivary secretion | ko04970 | 205 | 771 | 0.000125721 | 0.0037463268 | Organismal systems |
| Retinol metabolism | ko00830 | 66 | 205 | 0.0001257524 | 0.0037463268 | Metabolism |
KEGG, Kyoto Encyclopedia of Genes and Genomes.
3.5. RNA component of mitochondrial RNA processing endoribonuclease promoted colony formation of HCCC‐9810 partly by repressing miR‐217
The GO and KEGG analysis suggested that the biological processes with high correlation of miRNA expression profile changes caused by RMRP knockdown may be related to stem cell characteristics of CCA cells. We selected a miRNA from the above sequencing results for some subsequent experiments. qRT‐PCR results showed that the expression of miR‐217 was negatively correlated with the expression of RMRP (Figure 6B), which was consistent with the above sequencing results. Previous studies have shown that miR‐217 plays an important role in tumor suppression in tumor cells. Due to the indication that RMRP may be related to metabolism of stem cells, colony formation assay was carried out. Similarly, after overexpression of miR‐217, cell viability and clonality were significantly reduced in HCCC‐9810 (Figure 6D,E). However, when RMRP was overexpressed in HCCC‐9810, the expression of miR‐217 was significantly decreased, and the CCK‐8 and clone formation assays showed opposite results (Figure 6D,E). Subsequently, we transfected miR‐217 mimics into HCCC‐9810 overexpressing RMRP (Figure 6A) and found that re‐upregulation of miR‐217 expression can rescue the cancer‐promoting effects of overexpression of RMRP (Figure 6D,E). Because GO and KEGG analysis based on downstream miRNA expression profiles of RMRP focused the function of RMRP on stem cell‐related characteristics, and previous studies of Jiang et al and Dai et al showed that miR‐217 can participate in tumor progression partially by regulating DKK1,15, 16 we also detected expression of DKK1, Bmi1, CD44 and CD24 in HCCC‐9810 cells after RMRP knockdown. qRT‐PCR results showed that DKK1, Bmi1 and CD24 expression were downregulated but expression of CD44 remained unchanged (Figure S2). Taken together, these data indicated that RMRP acts as an oncogene partly by repressing miR‐217 in HCCC‐9810.
Figure 6.
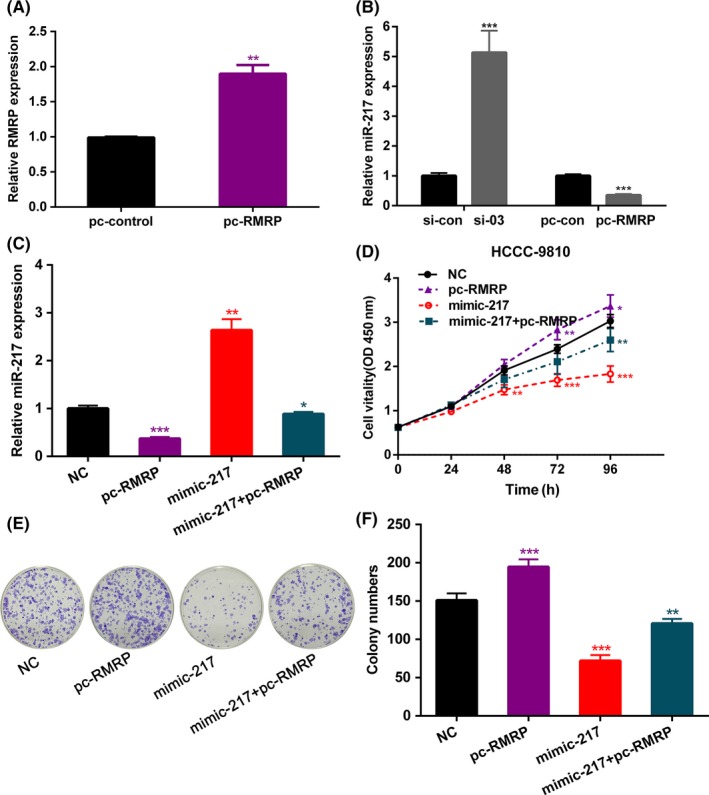
Quantitative RT‐PCR was used to measure (A) expression of RNA component of mitochondrial RNA processing endoribonuclease (RMRP) in HCCC‐9810 cell line after transfection with pcDNA‐control (pc‐con) and pcDNA‐RMRP (pc‐RMRP). B, Expression of microRNA (miR)‐217 in HCCC‐9810 cell line after transfection with si‐03 and pc‐RMRP compared to the control group. C, Expression of miR‐217 in HCCC‐9810 cell line after transfection with miR‐217 mimics, pc‐RMRP and miR‐217 mimics + pc‐RMRP. D, CCK‐8 assay was used to detect cell viability. E, Colony assay was used to determine the ability of colony formation. Representative data are based on three independent experiments. Bars, ±SD. *P < .05, **P < .01, ***P < .001
3.6. Validation of diagnostic and prognostic values of lncRNAs in CCA
To thoroughly validate the dysregulated expression of RMRP at the population level, we expanded the sample number to 33. qRT‐PCR results showed similar high expression of RMRP in CCA tissues (Figure 7A). To explore the relationship between RMRP and clinical characteristics in CCA, we divided patients with CCA into stage I/II and stage III groups based on information of imaging examination and pathological biopsy. Expression of RMRP showed a significantly increasing trend with the advancement of cancer TNM stages (Figure 7B). Relationship of RMRP with prognosis status of CCA patients was further examined by Kaplan‐Meier curve analysis and log‐rank test (Figure 7C). Additionally, expression of RMRP was negatively correlated to that of miR‐217 by qRT‐PCR (Figure 7D). In general, RMRP plays an oncogenic role in CCA and may function partly by suppressing miR‐217 in CCA cells.
Figure 7.
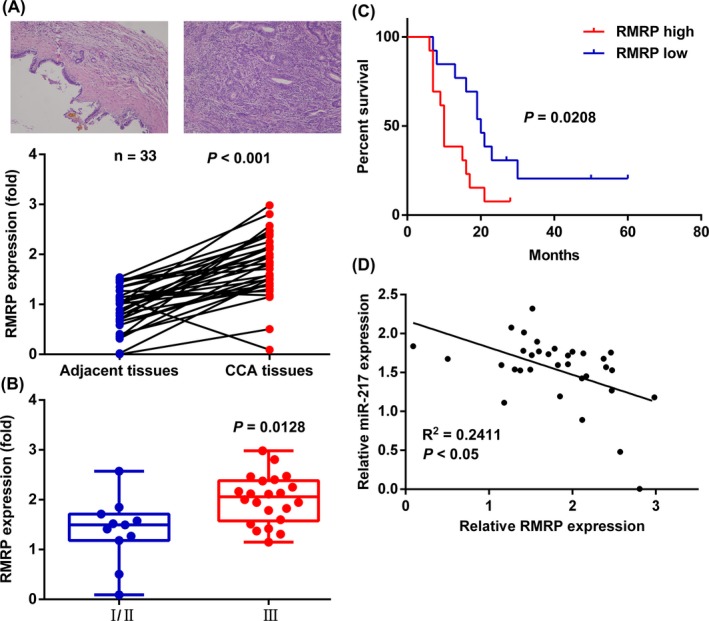
Population level analysis. A (Upper) Immunohistochemical results of adjacent tissue (left) and CCA tissue (right). (Lower) Expression of RNA component of mitochondrial RNA processing endoribonuclease (RMRP) in adjacent tissues and cholangiocarcinoma (CCA) tissues by qRT‐PCR. B, Unpaired t test analysis of RMRP expression in CCA tissues of stage I/II patients and stage III patients. C, Kaplan‐Meier overall survival curves according to the expression of RMRP. D, Expression of RMRP was negatively correlated with that of microRNA (miR)‐217 in CCA tissues. Representative data are based on three independent experiments. Bars, ±SD
4. DISCUSSION
Long non‐coding RNAs have a broad tissue expression profile. The abundance of lncRNAs is generally lower than that of protein‐coding mRNAs. In addition, the sequence conservation of lncRNAs is lower than that of other non‐coding RNAs and is <70% in humans.17 Even so, studies have found that lower sequence conservation does not limit the function of long non‐coding RNAs. As cancer is a major cause of mortality in humans, the study of lncRNAs in cancer has been given full attention.18, 19 The role of some lncRNAs has been fully elucidated, but few studies of lncRNAs associated with CCA have been conducted.
RNA component of mitochondrial RNA processing endoribonuclease RNA is the RNA subunit of the RNase mitochondrial RNA processing (MRP) enzyme complex involved in various cellular RNA processing events. Most of the previous studies were focused on RMRP gene mutations, specifically RMRP gene mutations leading to recessive hereditary developmental disorders and poor cartilage (CHH).20 In recent years, RMRP was found to be highly expressed in some cancers21, 22 and we therefore explored its expression in CCA. RMRP expression in CCA tissues was significantly higher than that in paracancerous tissues in the 33 pairs of tissues we collected, which partially overlapped with our prior bile exosome sequencing results. Therefore, we speculated that RMRP differentially expressed in bile exosome of patients with CCA may originate from CCA tissue. However, because the origins of bile do not overlap with those of CCA tissue, for the time being, it is not possible to correlate RMRP expression in CCA tissue with bile exosomes. Next, we measured a series of function assays after knocking down RMRP in CCA cells. The results clearly showed that decreased RMRP expression can inhibit the proliferation of colony formation of CCA cell lines, promote apoptosis of CCA cell lines, and block CCA cell lines in the G0/G1 phase. LncRNAs can indirectly or directly regulate the expression of target genes by directing or recruiting RNA binding proteins, or as a central platform for the assembly of various complexes. Therefore, we sequenced miRNAs that are more conservative than lncRNAs after RMRP knockdown in HCCC‐9810. Sequencing results showed that the miRNA expression profile varied with RMRP expression, among which there were well‐investigated miR‐33a,23 miR‐186,24 miR‐1725 and miR‐155.26 GO and KEGG analysis of the altered microRNA expression profile showed that these altered miRNAs, as a whole, point to a variety of important function pathways. Among them, three pathways had the most significant changes, suggesting that they may be the most important pathways caused by RMRP‐induced miRNA profile changes. Among the three pathways, one referred to metabolism of stem cells, which corresponds to the previous study that found that RMRP allows cancer cells to infinitely proliferate through interaction with TERT.27 Moreover, cancer stem cell‐related markers such as Bmi1 and CD24 were found to be subsequently decreased after RMRP knockdown, but CD44 expression remained the same. However, subcellular localization of CD44 was not investigated and in‐depth future research is needed. We selected one of the 10 upregulated miRNAs randomly and validated the differential expression of miR‐217. Moreover, we conducted a series of assays which suggested that RMRP can promote oncogenic characteristics by partly repressing miR‐217. miRNA‐217 has previously been reported to play an anticancer role in gastrointestinal tumors such as pancreatic cancer28 and hepatocellular carcinoma,29 but the specific mechanism is still unclear. Further experiments are needed to determine the mechanism of miR‐217 functions.
In summary, we have discovered that RMRP is highly expressed in CCA and that RMRP can affect a series of cancer cell biological functions in vitro and in vivo. In addition, we also sequenced the downstream miRNA profiles of RMRP and found that RMRP can act as an oncogene partly by regulating miR‐217. The present study may provide new ideas for the diagnosis and treatment of CCA, but further investigation of RMRP is needed.
DISCLOSURE
Authors declare no conflicts of interest for this article.
Supporting information
ACKNOWLEDGMENTS
This study was supported by the Project of Standard Diagnosis and Treatment of Key Disease of Jiangsu Province (BE2015722), the Project of the Peak of the Six Talents of Jiangsu Province (WSN‐018), and the Scientific Research Foundation for Health of Jiangsu Province (H201408). In addition, we wish to thank Beijing Genomics Institute for supporting the next‐generation sequencing and bioinformatics analysis.
Tang L, Wang Y, Wang H, et al. Long noncoding‐RNA component of mitochondrial RNA processing endoribonuclease is involved in the progression of cholangiocarcinoma by regulating microRNA‐217. Cancer Sci. 2019;110:2166‐2179. 10.1111/cas.14074
Lingyu Tang, Yuting Wang and Huishan Wang contributed equally to this work.
Contributor Information
Quanpeng Li, Email: 15150543586@163.com.
Lin Miao, Email: linmiao@njmu.edu.cn.
REFERENCES
- 1. Razumilava N, Gores GJ. Cholangiocarcinoma. Lancet. 2014;383(9935):2168‐2179. [DOI] [PMC free article] [PubMed] [Google Scholar]
- 2. Global Burden of Disease Cancer Collaboration , Fitzmaurice C, Allen C, et al. Global, regional, and national cancer incidence, mortality, years of life lost, years lived with disability, and disability‐adjusted life‐years for 32 cancer groups, 1990 to 2015: a systematic analysis for the global burden of disease study. JAMA Oncol. 2017;3(4):524‐548. [DOI] [PMC free article] [PubMed] [Google Scholar]
- 3. Macias RI. Cholangiocarcinoma: biology, clinical management, and pharmacological perspectives. ISRN Hepatol. 2014;2014:828074. [DOI] [PMC free article] [PubMed] [Google Scholar]
- 4. Lander ES, Linton LM, Birren B, et al. Initial sequencing and analysis of the human genome. Nature. 2001;409(6822):860‐921. [DOI] [PubMed] [Google Scholar]
- 5. Quinn JJ, Chang HY. Unique features of long non‐coding RNA biogenesis and function. Nat Rev Genet. 2016;17(1):47‐62. [DOI] [PubMed] [Google Scholar]
- 6. Beermann J, Piccoli MT, Viereck J, Thum T. Non‐coding RNAs in development and disease: background, mechanisms, and therapeutic approaches. Physiol Rev. 2016;96(4):1297‐1325. [DOI] [PubMed] [Google Scholar]
- 7. Wang L, Wei Z, Wu K. Long noncoding RNA B3GALT5‐AS1 suppresses colon cancer liver metastasis via repressing microRNA‐203. Aging (Albany NY). 2018;10:3662‐3682. [DOI] [PMC free article] [PubMed] [Google Scholar]
- 8. Ge X, Wang Y, Nie J, et al. The diagnostic/prognostic potential and molecular functions of long non‐coding RNAs in the exosomes derived from the bile of human cholangiocarcinoma. Oncotarget. 2017;8(41):69995‐70005. [DOI] [PMC free article] [PubMed] [Google Scholar]
- 9. Wang K, Liu CY, Zhou LY, et al. APF lncRNA regulates autophagy and myocardial infarction by targeting miR‐188‐3p. Nat Commun. 2015;6:6779. [DOI] [PubMed] [Google Scholar]
- 10. Wang L, Feng Z, Wang X, Wang X, Zhang X. DEGseq: an R package for identifying differentially expressed genes from RNA‐seq data. Bioinformatics. 2010;26(1):136‐138. [DOI] [PubMed] [Google Scholar]
- 11. Yang YH, Dudoit S, Luu P, et al. Normalization for cDNA microarray data: a robust composite method addressing single and multiple slide systematic variation. Nucleic Acids Res. 2002;30(4):e15. [DOI] [PMC free article] [PubMed] [Google Scholar]
- 12. Achkar NP, Cambiagno DA, Manavella PA. miRNA biogenesis: a dynamic pathway. Trends Plant Sci. 2016;21(12):1034‐1044. [DOI] [PubMed] [Google Scholar]
- 13. Engreitz JM, Haines JE, Perez EM, et al. Local regulation of gene expression by lncRNA promoters, transcription and splicing. Nature. 2016;539(7629):452‐455. [DOI] [PMC free article] [PubMed] [Google Scholar]
- 14. Kanehisa M, Araki M, Goto S, et al. KEGG for linking genomes to life and the environment. Nucleic Acids Res. 2008;36(Database issue):D480‐D484. [DOI] [PMC free article] [PubMed] [Google Scholar]
- 15. Jiang C, Yu M, Xie X, et al. miR‐217 targeting DKK1 promotes cancer stem cell properties via activation of the Wnt signaling pathway in hepatocellular carcinoma. Oncol Rep. 2017;38(4):2351‐2359. [DOI] [PubMed] [Google Scholar]
- 16. Dai Z, Jin Y, Zheng J, et al. MiR‐217 promotes cell proliferation and osteogenic differentiation of BMSCs by targeting DKK1 in steroid‐associated osteonecrosis. Biomed Pharmacother. 2019;109:1112‐1119. [DOI] [PubMed] [Google Scholar]
- 17. Diederichs S. The four dimensions of noncoding RNA conservation. Trends Genet. 2014;30(4):121‐123. [DOI] [PubMed] [Google Scholar]
- 18. Seiler J, Breinig M, Caudron‐Herger M, Polycarpou‐Schwarz M, Boutros M, Diederichs S. The lncRNA VELUCT strongly regulates viability of lung cancer cells despite its extremely low abundance. Nucleic Acids Res. 2017;45(9):5458‐5469. [DOI] [PMC free article] [PubMed] [Google Scholar]
- 19. Martens‐Uzunova ES, Böttcher R, Croce CM, Jenster G, Visakorpi T, Calin GA. Long noncoding RNA in prostate, bladder, and kidney cancer. Eur Urol. 2014;65(6):1140‐1151. [DOI] [PubMed] [Google Scholar]
- 20. Ridanpaa M, van Eenennaam H, Pelin K, et al. Mutations in the RNA component of RNase MRP cause a pleiotropic human disease, cartilage‐hair hypoplasia. Cell. 2001;104(2):195‐203. [DOI] [PubMed] [Google Scholar]
- 21. De Paepe B, Lefever S, Mestdagh P. How long noncoding RNAs enforce their will on mitochondrial activity: regulation of mitochondrial respiration, reactive oxygen species production, apoptosis, and metabolic reprogramming in cancer. Curr Genet. 2018;64(1):163‐172. [DOI] [PubMed] [Google Scholar]
- 22. Xiao X, Gu Y, Wang G, Chen S. c‐Myc, RMRP, and miR‐34a‐5p form a positive‐feedback loop to regulate cell proliferation and apoptosis in multiple myeloma. Int J Biol Macromol. 2018;122:526‐537. [DOI] [PubMed] [Google Scholar]
- 23. Jiang N, Wang X, Xie X, et al. lncRNA DANCR promotes tumor progression and cancer stemness features in osteosarcoma by upregulating AXL via miR‐33a‐5p inhibition. Cancer Lett. 2017;405:46‐55. [DOI] [PubMed] [Google Scholar]
- 24. Wang H, Shen Q, Zhang X, et al. The long non‐coding RNA XIST controls non‐small cell lung cancer proliferation and invasion by modulating miR‐186‐5p. Cell Physiol Biochem. 2017;41(6):2221‐2229. [DOI] [PubMed] [Google Scholar]
- 25. Comincini S, Allavena G, Palumbo S, et al. microRNA‐17 regulates the expression of ATG7 and modulates the autophagy process, improving the sensitivity to temozolomide and low‐dose ionizing radiation treatments in human glioblastoma cells. Cancer Biol Ther. 2013;14(7):574‐586. [DOI] [PMC free article] [PubMed] [Google Scholar]
- 26. Kim S, Rhee JK, Yoo HJ, et al. Bioinformatic and metabolomic analysis reveals miR‐155 regulates thiamine level in breast cancer. Cancer Lett. 2015;357(2):488‐497. [DOI] [PMC free article] [PubMed] [Google Scholar]
- 27. Maida Y, Yasukawa M, Furuuchi M, et al. An RNA-dependent RNA polymerase formed by TERT and the RMRP RNA. Nature. 2009;461(7261):230–5. [DOI] [PMC free article] [PubMed] [Google Scholar]
- 28. Deng S, Zhu S, Wang B, et al. Chronic pancreatitis and pancreatic cancer demonstrate active epithelial‐mesenchymal transition profile, regulated by miR‐217‐SIRT1 pathway. Cancer Lett. 2014;355(2):184‐191. [DOI] [PubMed] [Google Scholar]
- 29. Wang H, Ke J, Guo Q, Barnabo Nampoukime KP, Yang P, Ma K. Long non-coding RNA CRNDE promotes the proliferation, migration and invasion of hepatocellular carcinoma cells through miR-217/MAPK1 axis. J Cell Mol Med. 2018;22(12):5862–5876. [DOI] [PMC free article] [PubMed] [Google Scholar]
Associated Data
This section collects any data citations, data availability statements, or supplementary materials included in this article.
Supplementary Materials


