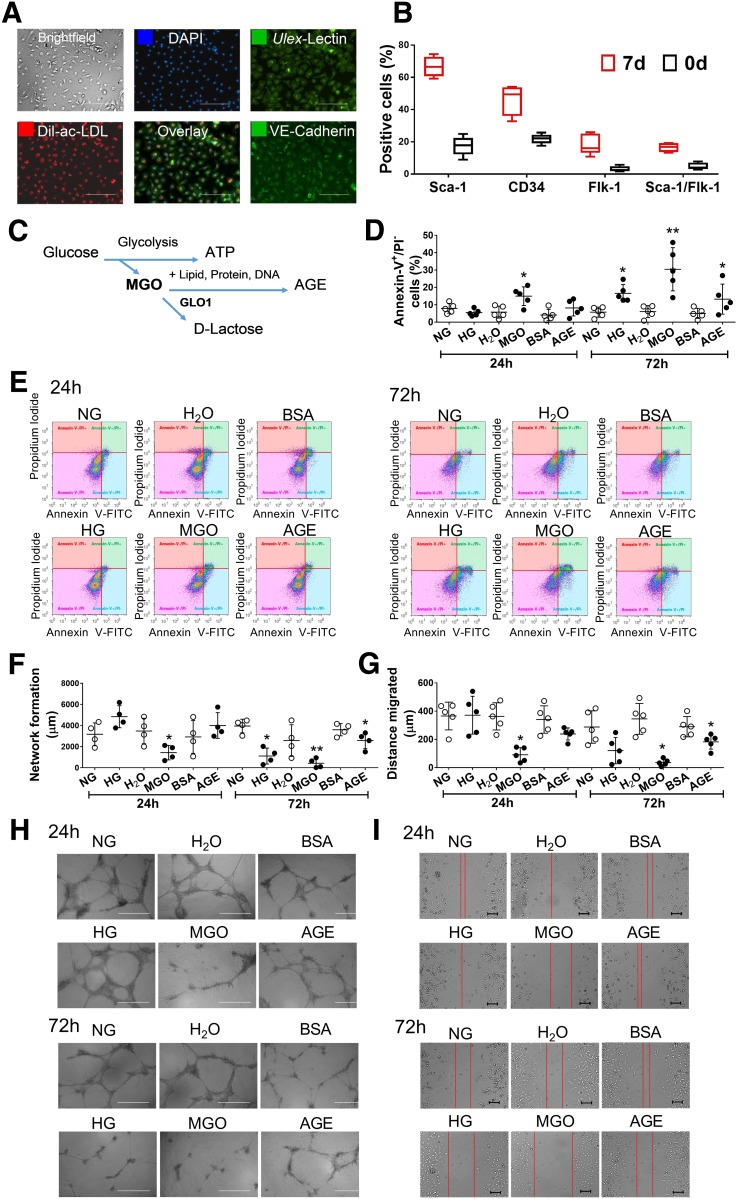
Figure 1.
BMPC function was directly damaged by 24-h exposure of MGO rather than high glucose (HG) or AGEs. BMPCs from type 2 diabetic db/db mice and the healthy control db/+ mice were cultured in vitro for 7 days. A: Fluorescent staining of Ulex-lectin binding and Dil-ac-LDL uptake and VE-cadherin in 7-day cultured BMPCs (n = 4 per group). Scale bar = 500 μm. B: Flow cytometry analysis of Sca-1, CD34, Flk-1, CD45, and Sca-1/Flk-1 cell surface markers of BMPCs after 7 days of culture (n = 5 per group). BMPCs were then treated with either MGO (10 μmol/L, using H2O as control), AGEs (200 μmol/L, using BSA as control), or HG (25 mmol/L d-glucose, using 5 mmol/L d-glucose plus 20 mmol/L d-mannitol [NG] as control) for 24 or 72 h. C: Schema of MGO and AGE metabolism. MGO as by-product from glucose metabolism can bind to proteins, lipids, and DNA, forming AGEs. GLO1 detoxifies MGO by converting it to d-lactate. D: Dot plot of the percent apoptotic cells in db/+ BMPCs treated with MGO, AGEs, or HG for 24 or 72 h (n = 5 per group). E: Representative scatter plots showing the distribution of Annexin-V+/PI− cells in db/+ BMPCs. F: Network formation quantification in db/+ BMPCs treated with MGO, AGEs, or HG for 24 or 72 h (n = 4 per group). G: Dot plot of migration assay of db/+ BMPCs treated with MGO, AGEs, or HG for 24 or 72 h (n = 5 per group). H: Representative images of tube network formed by db/+ BMPCs treated with MGO, AGEs, or HG for 24 or 72 h. Scale bar = 1,000 μm. I: Representative images of migration assay of db/+ BMPCs treated with MGO, AGEs, or HG for 24 or 72 h. Scale bar = 200 μm. *P < 0.05 vs. controls; **P < 0.01 vs. controls.

