Abstract
Leptin resistance is a hallmark of obesity with unclear etiology. Celastrol, a compound found in the roots of the Tripterygium wilfordii and known to reduce endoplasmic reticulum (ER) stress, has recently emerged as a promising candidate to treat obesity by improving leptin sensitivity. However, the underlying neural mechanisms by which celastrol reduces obesity remain unclear. Using three different mouse models of obesity—diet-induced obesity (DIO), leptin receptor (LepR)-null, and melanocortin 4 receptor (MC4R)-null mice—in this study, we show that systemic celastrol administration substantially reduces food intake and body weight in MC4R-null comparable to DIO, proving the MC4R-independent antiobesity effect of celastrol. Body weight reduction was due to decreases in both fat and lean mass, and modest but significant body weight reduction was also observed in nonobese wild-type and LepR-null mice. Unexpectedly, celastrol upregulated proinflammatory cytokines without affecting genes involved in ER stress. Importantly, celastrol steadily increased sympathetic nerve activity to the brown fat and kidney with concordant increases of resting metabolic rate and arterial pressure. Our results suggest a previously unappreciated mechanism of action of celastrol in the regulation of energy homeostasis and highlight the need for careful consideration of its development as a safe antiobesity medication.
Introduction
Obesity is a major worldwide health concern due to its high risk of developing many life-threatening chronic illnesses, including type 2 diabetes, hypertension, coronary heart disease, stroke, and certain types of cancer (1). Obesity is the consequence of a sustained energy imbalance resulting from exceeding energy intake over energy expenditure. Although the discovery of leptin (2) tremendously facilitated the progresses of understanding the neurobiology of obesity over the past two decades, the available treatment options for obesity are still limited, and effective druggable molecular targets for sustained body weight reduction are yet to be identified that urge a better understanding of the mechanisms behind obesity development (3).
It has been well established that leptin acts primarily on hypothalamic and brainstem nuclei to control long-term body weight homeostasis (4). However, an attempt to treat common obesity by targeting brain leptin signaling has failed, mainly due to the existence of leptin resistance in virtually all obese individuals (5). Although the exact mechanism of leptin resistance is still unclear and currently under active investigation, many biological processes have been proposed to be responsible for the development of leptin resistance in obese individuals, including chronic inflammation and endoplasmic reticulum (ER) stress caused by a prolonged state of overnutrition (3). Obesity is now considered as a condition of low-grade, chronic, mild systemic inflammation affecting most organs of the body, including the brain, and ER stress has recently emerged as a key player in obesity-associated inflammation and leptin resistance (6–9). Notably, a recent study of active screening for small compounds ameliorating ER stress led to a discovery of celastrol, a small molecule found in the roots of the Tripterygium wilfordii plant, as a promising candidate to restore leptin sensitivity and dramatically reduce body weight in a mouse model of metabolic syndrome, diet-induced obesity (DIO) (10). The body weight–reducing effect of celastrol was remarkable and repeated independently in other studies soon after its discovery (11,12), although the proposed underlying mechanisms appear discordant. Similarly interesting is that the induction of the unfolded protein response transcription factor spliced X-box binding protein 1 (Xbp1s) exclusively in proopiomelanocortin (Pomc) neurons (a unique source producing the endogenous melanocortin 4 receptor [MC4R] agonist in the brain) alone is sufficient to protect the mice from DIO and improve leptin sensitivity (13), whereas Pomc-specific ablation of mitofusin-2 (Mfn2) results in ER stress–induced leptin resistance and obesity (14), underscoring the importance of the central melanocortin pathway in the development of obesity associated with ER stress. These observations, along with the fact that MC4R is a major mediator of central melanocortin regulation of energy homeostasis (15,16) and that Pomc neurons express leptin receptor (LepR) (17,18), led us to hypothesize that celastrol may improve leptin sensitivity by ameliorating ER stress of Pomc neurons during obesity, thereby resulting in an antiobesity effect through an MC4R signaling–dependent mechanism.
To test this hypothesis, we evaluated the antiobesity efficacy of celastrol in DIO and genetically obese LepR-null and MC4R-null mice. We discovered that although the body weight–reducing effect of celastrol seems largely, but not completely, dependent on LepR as previously reported (10), MC4R-null mice respond normally (comparable to DIO) to celastrol with reduction of body weight without significant changes in expression of genes involved in ER stress. We also show, for the first time, that celastrol increases sympathetic outflow to the interscapular brown adipose tissue (iBAT) and the kidney with concordant increase in arterial pressure in anesthetized mice and increases in resting metabolic rate (RMR). These findings indicate an MC4R-independent antiobesity effect of celastrol and raise the possibility of potentially unexplored mechanisms of action of celastrol that are independent of ER stress or inflammatory processes. Additionally, observation of cardiovascular side effect of celastrol prompts caution for future development of celastrol as a safe antiobesity medication.
Research Design and Methods
Animals
Conditionally reactivatable LepR-TB and MC4R-TB mice, which are now available from the The Jackson Laboratory (stock numbers 018989 and 006414, respectively), were kindly provided by Dr. Joel Elmquist at UT Southwestern Medical Center in Dallas, TX. To establish a mouse model of DIO, wild-type (WT) C57BL/6J male mice were fed a high-fat diet (HFD) with 60% of kcal from fat (#D12492; Research Diets) at the age of 4 to 5 weeks old and maintained on the same diet until the end of the study. All other groups of mice were fed with a regular chow diet throughout the experimental period. All mice were singly housed in a 12-h light and 12-h dark cycle with ad libitum access to food and water. At the end of study, mice were sacrificed, and tissues were collected, immediately frozen in liquid nitrogen, and kept at −80°C for further biochemical analysis.
Drug Treatment
Celastrol (catalog number 70950; Cayman Chemical, Ann Arbor, MI) was dissolved in 1 mL of DMSO and diluted with sterilized PBS up to 250 mL (for 0.1 mg/kg) or 50 mL (for 0.5 mg/kg). Vehicle groups received corresponding concentrations of diluent solution (0.4% DMSO or 2% DMSO). Daily intraperitoneal (IP) injections were performed ∼2 h before the dark cycle.
Body Weight, Food Intake, and Body Composition Measurements
Body weight and food intake were measured daily immediately before drug administration. Body composition was determined at the beginning and end of study using nuclear magnetic resonance (Minispec NF-90; Bruker).
RNA Extraction and Quantitative Real-time PCR
Total RNA was extracted using the Qiagen RNeasy Plus Kit, and cDNA was synthesized using SuperScript VILO (Invitrogen) according to the manufacturer’s instructions. Quantitative real-time PCR was performed using iQ SYBR Green Supermix (Bio-Rad Laboratories) in the Applied Biosystems 7900HT. Sequences of primers are shown in Supplementary Table 1. The levels of gene expressions were normalized to the levels of cycrophilin B mRNA, and the relative gene expressions were calculated using the 2−ΔCT method as previously described (19).
Immunohistochemistry for Leptin-Induced Phosphorylated STAT3
A separate cohort of lean and DIO mice (chow-vehicle, HFD-vehicle, and HFD-celastrol) was used for the baseline and leptin-induced phosphorylated STAT3 (pSTAT3) experiment. Mice were treated with either vehicle or celastrol for 5 consecutive days and then transcardially perfused 60 min after IP injection of either vehicle (PBS) or leptin (3 mg/kg). Extracted brains were immersed in 25% sucrose solution and cut into five series of 30-µm sections encompassing the hypothalamus and processed for immunohistochemistry for leptin-induced pSTAT3 as previously reported (20). Briefly, brain sections were rinsed in PBS and treated with 1% NaOH, 1% H2O2 in distilled water for 20 min at room temperature, and then incubated with 0.3% glycine in PBS for 10 min, followed by a 10-min incubation in 0.03% SDS in PBS and then blocked in 3% normal donkey serum and 0.3% Triton X-100 in PBS for 30 min at room temperature. Sections were then incubated with primary antibody (catalog number 9131; Cell Signaling Technology) for 24 h at room temperature plus an additional 48 h at 4°C. Brain sections were then processed for chromogenic immunohistochemical staining using an ABC kit as per the manufacturer’s instructions (Vector Laboratories).
Western Blotting Analysis
Mice challenged on an HFD for >9 weeks were injected with vehicle (PBS containing 2% DMSO) for 3 days for acclimation against daily IP injection. Then mice were divided into two groups receiving either vehicle or celastrol (0.5 mg/kg body weight) for 5 consecutive days. Hypothalamus and liver samples were collected 6 h after last injection on the fifth day, snap-frozen in liquid nitrogen, and stored at −80°C until use.
For total protein extraction, tissue samples were sonicated in RIPA buffer (Sigma-Aldrich) with complete protease inhibitor cocktail (Roche) and phosphatase inhibitor cocktail II, and protein concentration was measured using a Pierce BCA Protein Assay Kit. Eighty micrograms of proteins were separated using SDS-PAGE and transferred to a polyvindylidene difluoride membrane using the Trans-Blot Turbo semidry transfer system (Bio-Rad Laboratories). The membrane was incubated with the following primary antibodies from Cell Signaling Technology diluted in blocking buffer overnight at 4°C: SERCA2 (#4388), total protein kinase RNA-like ER kinase (PERK) (#5683), and phosphorylated PERK (pPERK) (#3179). Normalization of the signals was done using Revert total protein stain (LI-COR Biosciences).
The Effect of Celastrol on Spontaneous Physical Activity
A separate cohort of mice was singly housed in customized cylindrical plexiglass caging installed with an infrared light beam detection system (Oxymax; Columbus Instruments). Food and water were provided ad libitum. Vehicle or celastrol (0.5 mg/kg) was administered IP just before the beginning of the dark cycle.
RMR
RMR was estimated by respirometry as described previously (21,22). Briefly, mice were placed into thermally controlled, airtight chambers maintained at thermoneutrality (30°C), and oxygen consumption and carbon dioxide content of effluent air (flowing at 300 mL/min, corrected to standard temperature and pressure) were continually recorded (AEI analyzers, logged using ADInstruments PowerLab with associated Chart software). Analyzers were calibrated daily using soda lime and calibration gas (Praxair). To determine the effect of celastrol treatment on the RMR, baseline RMR measurements were taken in the morning and again in the afternoon following IP injection of either vehicle or celastrol (0.5 mg/kg). Changes of RMR and respiratory exchange ratio (RER) from baseline were analyzed and compared between vehicle- and celastrol-treated groups.
The Effect of Celastrol on Regional Sympathetic Nerve Activity
Regional sympathetic nerve activity (SNA) was measured by direct multifiber recording of sympathetic nerve branches subserving the iBAT and the kidney as previously described (23). Seventeen- to 20-week-old chow-fed WT and MC4R-null male mice were used for regional SNA recording. Under anesthesia, catheterization of the carotid arteries and jugular vein was performed for hemodynamic recording and maintenance of anesthesia with α-chloralose (25 mg/kg/h), respectively. Nerves fascicle to the iBAT and the kidney were carefully isolated under a dissecting microscope. A bipolar platinum-iridium electrode (Cooner Wire) was suspended under the nerve and secured with silicone gel (Kwik-Cast; World Precision Instruments). The electrode was attached to a high-impedance probe (HIP-511; Grass Technologies), and the nerve signal was amplified 105 times with a Grass P5 AC preamplifier. After amplification, the nerve signal was filtered at a 100- and 1,000-Hz cutoff with a nerve traffic analysis system (model 706C; Department of Bioengineering, University of Iowa). Subsequently, the amplified and filtered nerve signal was routed to an oscilloscope (model 54501A; Hewlett Packard) for monitoring the quality of the sympathetic nerve recording and to a resetting voltage integrator (model B600c; University of Iowa Bioengineering) that summed the total voltage output to a unit of 1 V 3 s/min before resetting to 0. After a 10-min recording of baseline activity, mice received intravenous (IV) infusion of either vehicle or celastrol (0.5 mg/kg). The SNA was continuously monitored for 5 h, and the changes of SNA and blood pressure from baseline activity were calculated and compared between the groups.
Statistical Analyses
Statistical analyses were performed using GraphPad Prism software (GraphPad Software, La Jolla, CA). Comparisons between groups were made by Student t test (two-tailed) and one-way or two-way ANOVA with Bonferroni post hoc analysis as noted in each figure legend. P < 0.05 was considered statistically significant. Data are presented as mean ± SEM.
Results
Antiobesity Effects of Celastrol
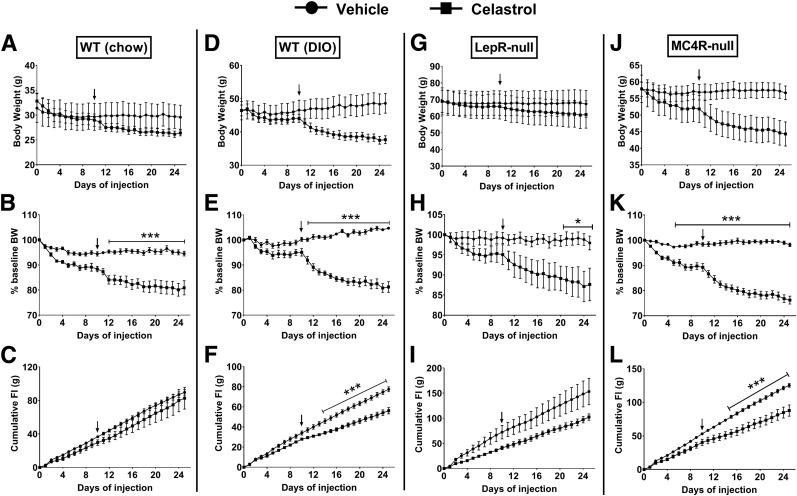
To confirm a previously reported antiobesity effect of celastrol and further test whether brain MC4R signaling is required for this effect, chow-fed lean WT, DIO, LepR-null, and MC4R-null male mice (singly housed) were treated daily for IP celastrol, and body weight and food intake were measured daily throughout the experimental period. Initially, we started with a dose of 0.1 mg/kg IP based on a previous study showing that this dose is sufficient to dramatically reduce body weight in DIO mice within 7–10 days of treatment (10). However, at this dose we observed minimal body weight reduction after 10 days of treatment. Therefore, the dose was increased to 0.5 mg/kg, and this condition was maintained until day 25. With a dose of 0.5 mg/kg, celastrol drastically reduced body weight in DIO (Fig. 1D) and MC4R-null (Fig. 1J) mice. Body weight reduction was relatively mild in WT (Fig. 1A) and LepR-null mice (Fig. 1G), but when body weight changes were expressed relative to baseline, all four groups showed significant drug effects on body weight (Fig. 1B, E, H, and K). Interestingly, significant decreases in energy intake were observed in both DIO and MC4R-null mice (Fig. 1F and L), but not in WT and LepR-null mice (Fig. 1C and I).
Figure 1.
The effects of systemic celastrol on body weight and food intake. A, D, G, and J: Absolute changes of body weight in grams. B, E, H, and K: Percentage changes of body weight (BW). C, F, I, and L: Cumulative food intake (FI) in chow-fed WT, DIO, LepR-null, and MC4R-null mice (n = 4–6/group). Arrows indicate the time when dose of celastrol was increased to 0.5 mg/kg from 0.1 mg/kg. Data are presented as mean ± SEM. *P < 0.05, ***P < 0.001 by two-way ANOVA compared with vehicle group.
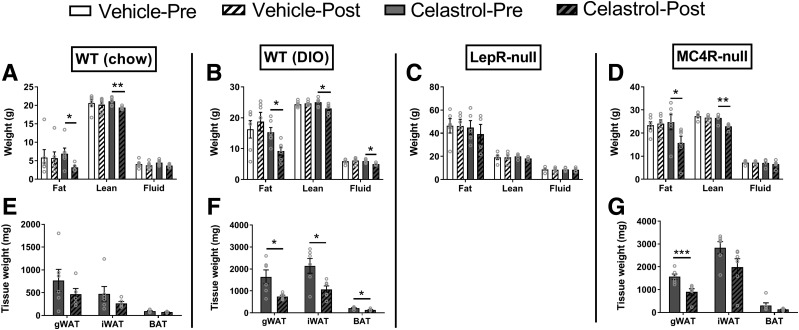
Body composition analyses by nuclear magnetic resonance were performed both before and after celastrol treatment. As expected, body weight reduction was associated with significant decrease in fat mass in all groups except LepR-null mice (Fig. 2A–D). Unexpectedly, celastrol treatment also caused significant reduction in lean mass in all groups except LepR-null mice (Fig. 2A–D). Consistently, gross dissection of body fat pads revealed significant reductions of gonadal white adipose tissue (WAT) in both DIO and MC4R-null mice (Fig. 2E–G). A significant reduction of inguinal WAT was observed in DIO mice. Although it was not statistically significant, inguinal WAT also exhibited a trend toward reduction in WT and MC4R-null mice (Fig. 2E and G).
Figure 2.
Changes of body composition by celastrol treatment. A–D: Body composition shown in grams. E–G: Different fat pad masses from gross dissection at the end of experiment. Data are presented as mean ± SEM. *P < 0.05, **P < 0.01, ***P < 0.001 by unpaired Student t test. gWAT, gonadal WAT.
Gene Expression Changes by Chronic Celastrol Treatment in the Hypothalamus
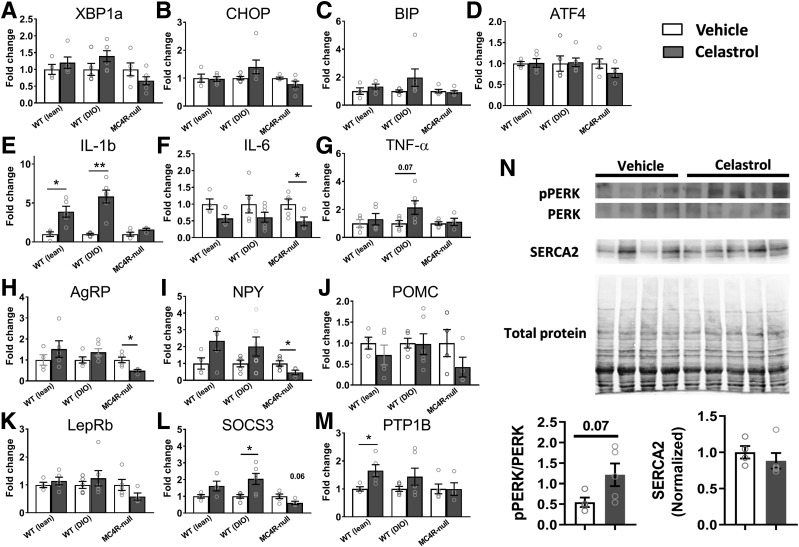
Because the hypothalamus is known to be a primary target of leptin signaling to control energy homeostasis, at the end of the study, we extracted hypothalami from WT, DIO, and MC4R-null mice and performed gene expression profiling. Although celastrol is known to ameliorate ER stress, the levels of expression of ER stress–related genes were not changed by celastrol treatment (Fig. 3A–D). These results are consistent with the previous report in which the expression of ER stress–related genes including Xbp1s and CHOP in the hypothalamus was not affected by celastrol treatment (10). Given the anti-inflammatory effect of celastrol (24), we next investigated the mRNA expression levels of inflammatory genes (Fig. 3E–G). Interestingly, changes varied among inflammatory genes investigated. IL-1b was significantly increased by celastrol treatment in both WT and DIO, but not MC4R-null mice (Fig. 3E), whereas TNFα exhibited a trend toward upregulation only in DIO mice. On the contrary, IL-6 showed a significant decrease or a decreasing trend in all groups (Fig. 3F). Importantly, these changes in gene expression appear to be specific to the brain, as we did not observe similar changes in gene expression in the liver (Supplementary Fig. 1).
Figure 3.
Changes of the levels of gene expressions in the hypothalamus by celastrol. A–D: Expression levels of genes involved in ER stress. E–G: Expression levels of inflammatory cytokine genes. H–J: Expression levels of neuropeptides involved in homeostatic regulation of energy balance. K–M: Expression levels of genes involved in leptin signaling. N: pPERK and SERCA2 protein levels in the hypothalamus. Data are presented as mean ± SEM. *P < 0.05, **P < 0.01 by Student t test compared with vehicle group.
Next, we measured the mRNA levels of genes involved in hypothalamic control of energy homeostasis. Similar to the previous study (10), celastrol tended to upregulate AgRP and NPY in WT and DIO mice, but not in MC4R-null mice, in which both AgRP and NPY were significantly decreased (Fig. 3H and I). In contrast, despite significant reductions in food intake and body weight by celastrol, we did not observe any significant difference in the POMC mRNA levels between vehicle and drug groups (Fig. 3J). Unexpectedly, the genes known to negatively regulate LepR signaling and leading to leptin resistance (SOCS3 and PTP1B) appeared to increase in both WT and DIO mice, but not in MC4R-null mice (Fig. 3L and M). Expression levels of LepR itself appeared largely unaffected by celastrol treatment in any groups of mice tested (Fig. 3K).
Additionally, in order to more rigorously determine whether ER stress is mitigated by celastrol as reported previously (10), we also examined the levels of pPERK and SERCA2 in the hypothalamus of DIO mice treated with either vehicle or celastrol (0.5 mg/kg). In contrast to a previous report, we observed no significant changes of both pPERK and SERCA2 levels in the hypothalamus by celastrol (Fig. 3N), despite significant reduction of body weight (data not shown). To further examine whether LepR signaling was affected by celastrol treatment, we also examined baseline and leptin-induced pSTAT3 in different cohorts of mice that received 5-day consecutive IP injections of either vehicle or celastrol (0.5 mg/kg). Although celastrol treatment for 5 days dramatically reduced body weight (Supplementary Fig. 2A), hypothalamic pSTAT3 level was not improved by celastrol both at baseline (Supplementary Fig. 2B and C) and in response to leptin treatment (Supplementary Fig. 2D–F).
To further explore the potential mechanisms by which celastrol might affect energy balance, we analyzed genes involved in the signal transduction of G-protein–coupled receptors, including different Gα subunits and a family of proteins called the regulators of G-protein signaling (RGS) that terminate G-protein signaling. Among different Gα subunits studied (Supplementary Fig. 3A–G), only Gαs (Gnas) was consistently increased by celastrol treatment (Supplementary Fig. 3G), whereas Gαs12 (Gna12) was exclusively downregulated in DIO mice. Gene expression profiling revealed that only Rgs7, but not Rgs4, 5, 9, 10, 12, and 17, was consistently downregulated by celastrol treatment in all three groups tested (Supplementary Fig. 3I–O). Interestingly, Rgs2 was uniquely downregulated in MC4R-null mice, but not in WT and DIO mice (Supplementary Fig. 3H). Expression levels of G-protein–coupled receptor kinase 2 and 5 were not affected by celastrol treatment (data not shown).
Gene Expression Changes by Chronic Celastrol Treatment in iBAT
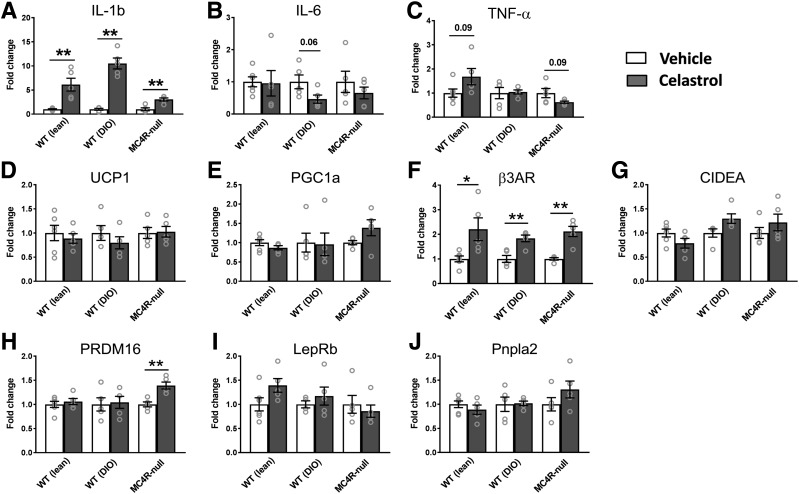
Because celastrol was shown to activate thermogenic genes in the iBAT through heat shock factor 1 (HSF1) and peroxisome proliferator–activated receptor γ coactivator 1α (PGC1α) (11), we next evaluated the expression levels of the metabolic genes as well as the inflammatory genes in the iBAT. Similar to changes seen in the hypothalamus, only IL-1b, but not IL-6 and TNFα, mRNA expression showed significant increases by celastrol in all three groups tested (Fig. 4A–C). Unexpectedly, the expression levels of most thermogenic genes were not changed by celastrol in all groups of mice tested (Fig. 4D–J). However, there was a significant and consistent upregulation of the β3 adrenergic receptor (Fig. 4F) and PRDM16 in MC4R-null mice (Fig. 4H).
Figure 4.
Changes of the levels of gene expressions in iBAT by celastrol. A–C: Expression levels of genes involved in ER stress. D–J: Expression levels of genes involved in thermogenesis, lipolysis, and adipocyte differentiation (N = 4–6/group). Data are presented as mean ± SEM. *P < 0.05, **P < 0.01 by Student t test compared with vehicle group.
Celastrol’s Effect on SNA
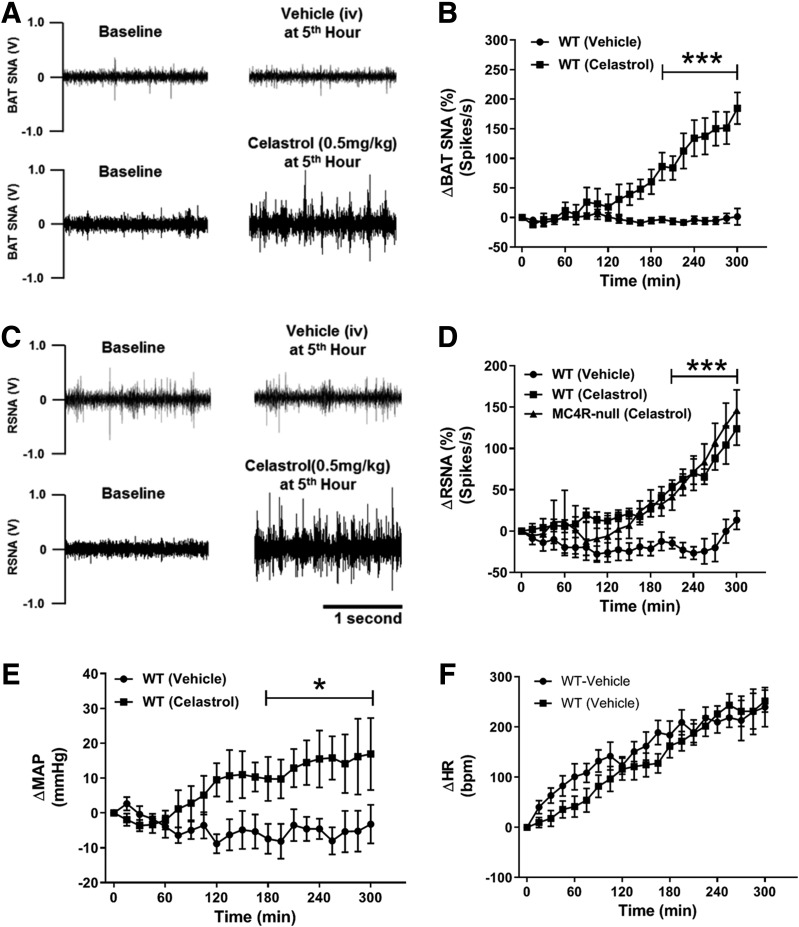
Significant upregulation of β3 adrenergic receptor in the iBAT of WT, DIO, and MC4R-null mice by celastrol suggests an involvement of sympathetic outflow in this process. To directly test this possibility, we measured regional SNA to the iBAT and the kidney in anesthetized chow-fed WT mice. As expected, celastrol significantly increased SNA to iBAT (Fig. 5A and B). Surprisingly, simultaneous recording of renal SNA in the same animal revealed a concomitant increase of sympathetic traffic to the kidney (Fig. 5C and D). Importantly, a comparable increase in renal SNA was also observed in obese MC4R-null mice (Fig. 5D), indicating that MC4R is not required for celastrol-induced sympathoexcitation. Consistent with renal sympathetic nerve activation, mean arterial pressure steadily increased during 5 h of SNA recording (Fig. 5E) without a significant difference in heart rate (Fig. 5F). Together, these data point to a previously unappreciated role of celastrol in sympathoexcitation and cardiovascular control.
Figure 5.
Celastrol increases sympathetic traffic to kidney and iBAT. A: Representative images showing iBAT SNA recording at baseline and at the fifth hour of IV vehicle or celastrol (0.5 mg/kg). B: Five-hour time course of celastrol-induced changes of iBAT SNA from baseline activity. C: Representative images showing renal SNA (RSNA) recording at baseline and at the fifth hour of IV vehicle or celastrol (0.5 mg/kg). D: Five-hour time course of celastrol-induced changes of RSNA from baseline activity. E and F: Change in mean arterial pressure (ΔMAP) and heart rate (ΔHR) from baseline during 5-h SNA recording (N = 3–6/group). Data are presented as mean ± SEM. *P < 0.05, ***P < 0.001 by two-way ANOVA compared with vehicle group.
Celastrol Decreases the Locomotor Activity While Increasing RMR
Although celastrol suppressed food intake in both DIO and MC4R-null mice (Fig. 1F and L), significant body weight reduction in WT mice did not accompany the decrease in food intake (Fig. 1C). We therefore suspected the weight loss could be due to increased energy expenditure associated with increased physical activity. Measurement of locomotor activity, however, revealed that celastrol decreases locomotor activity (Supplementary Fig. 4), which, along with increased iBAT SNA by celastrol, suggests an alternative possibility that celastrol might stimulate RMR, a major component of daily energy expenditure accounting for up to 60–70% of total energy daily expenditure (25). To this end, we measured RMR in both WT and DIO mice using respirometry as previously reported (21). Although a 2-day short-term treatment with celastrol did not yet significantly decrease body weight (Fig. 6A), RMR was significantly elevated by celastrol in DIO mice after this short treatment (Fig. 6B). There was a trend toward increased RMR in chow-fed WT mice, but this effect did not reach statistical significance. Additionally, there was a nonsignificant trend toward increased RER with celastrol treatment in DIO mice (Fig. 6C).
Figure 6.
Celastrol treatment (0.5 mg/kg) increases RMR. A: Body weight when mice subjected to RMR measurement. Changes of RMR (ΔRMR) (B) and RER (ΔRER) (C) from baseline in both chow-fed WT and DIO mice. N = 6–9/group. Data are presented as mean ± SEM. *P < 0.05 by two-way ANOVA compared with vehicle group.
Discussion
We evaluated the antiobesity effect of celastrol using three different models of obesity: DIO, LepR-null, and MC4R-null mice. Body weight–reducing effects of celastrol were remarkable in DIO mice as previously reported (albeit necessitating a relatively higher dose) (10,11), and comparable reduction of body weights was also observed in MC4R-null mice, indicating a melanocortin pathway–independent mechanism of celastrol on body weight regulation. We further show that celastrol stimulates RMR likely through an increase in SNA to iBAT, which is an important organ for nonshivering thermogenesis and energy dissipation. The mechanisms by which celastrol reduces obesity have been controversial. An initial study (10) and recent report (12) attributed the weight-reducing effects of celastrol to its anorectic action, whereas another report indicated energy expenditure but not food intake (11). Although our observations seem to agree with both models, there are also differences between our findings and previous reports. For example, in addition to DIO, significant reductions of body weight (percent change from baseline) were also observed in chow-fed control and LepR-null mice treated with celastrol. Although we did not observe a statistically significant reduction of food intake for both groups of mice, we cannot solely attribute their body weight reduction to increased energy expenditure, as celastrol could also reduce digestive efficiency in these mice to affect total energy absorption, which needs to be further determined in a future study. It is important to note that we had to use a fivefold higher dose of celastrol (0.5 mg/kg) because in our hands, the body weight–reducing effects were minimal with lower dose (0.1 mg/kg). Our finding raises the possibility that at a higher dose, celastrol may act through other unknown mechanisms in addition to LepR signaling to affect body weight. Consistent with this notion, Kim et al. (24) observed that a higher dose of celastrol (1 mg/kg) significantly reduced body weight in LepR-deficient db/db mice. Although blunted body weight–reducing effects of celastrol in LepR-null mice can be interpreted as LepR signaling–dependent actions of celastrol, it is also possible that this could be due to the defect in normal development of hypothalamic anoretic circuits caused by genetic LepR deficiency. Although this possibility needs to be fully investigated in future investigation, the dramatic reduction of body weight by celastrol in mice developmentally lacking MC4R argues against such a possibility. A striking observation in the current study is a significant reduction of lean mass caused by celastrol treatment. Such loss of lean mass that includes skeletal muscle is considered to be metabolically harmful. Though a decrease in locomotor activity and food intake throughout the treatment period could contribute to the reduction in lean mass, a possible direct action of celastrol on muscle to induce atrophy warrants future investigation.
The discovery of celastrol as a potential leptin sensitizer and antiobesity medication was made by initial screening of compounds ameliorating ER stress based on the theory that ER stress and inflammation are major factors contributing to the development of leptin resistance (10). Although our findings generally agree with body weight–reducing effects of celastrol, our results reported in this study do not support a role for celastrol in ameliorating ER stress and/or inflammation. Despite a significant change in body weight, ER stress–associated genes and the levels of pPERK and SERCA2 were not affected in the hypothalamus by celastrol treatment. Unexpectedly, the levels of expression of IL-1b, IL-6, and TNFα were in fact elevated by celastrol, suggesting that celastrol might be proinflammatory in vivo. These findings are inconsistent with or even the opposite of the proposed models of celastrol in producing beneficial metabolic effects, and further studies are needed to clarify these discordances.
Unlike previous reports (10,12), in a recent study, we did not observe an improved LepR signaling (assessed by leptin-induced pSTAT3) in the mediobasal hypothalamus of DIO mice with celastrol treatment. In contrast, we observed minimal (although significant) body weight–reducing effects of celastrol in LepR-null mice, suggesting that the antiobesity effect of celastrol largely depends on LepR signaling. One possible explanation of this seeming discrepancy could be that celastrol might act to improve other LepR signaling cascades rather than JAK/STAT3 pathway, including phosphoinositide 3-kinase and extracellular signal–regulated kinase signaling cascades that are also known to be activated by leptin (26–29). Many more studies are needed to uncover the detailed molecular mechanisms by which celastrol promotes negative energy balance.
Another interesting finding in the present study is that IV injection of celastrol steadily increased sympathetic drives to iBAT and kidney in chow-fed healthy mice with concomitant increases in arterial pressure even under anesthesia, indicating that celastrol has a profound sympathoexcitatory effect, which was not appreciated, in any of previous reports. Importantly, celastrol-induced increase in renal SNA was also observed in obese MC4R-null mice, indicating that the sympathoexcitatory effect of celastrol may not require MC4R signaling. However, whether this sympathoexcitatory effect of celastrol is dependent upon LepR signaling is still unclear, which requires additional studies.
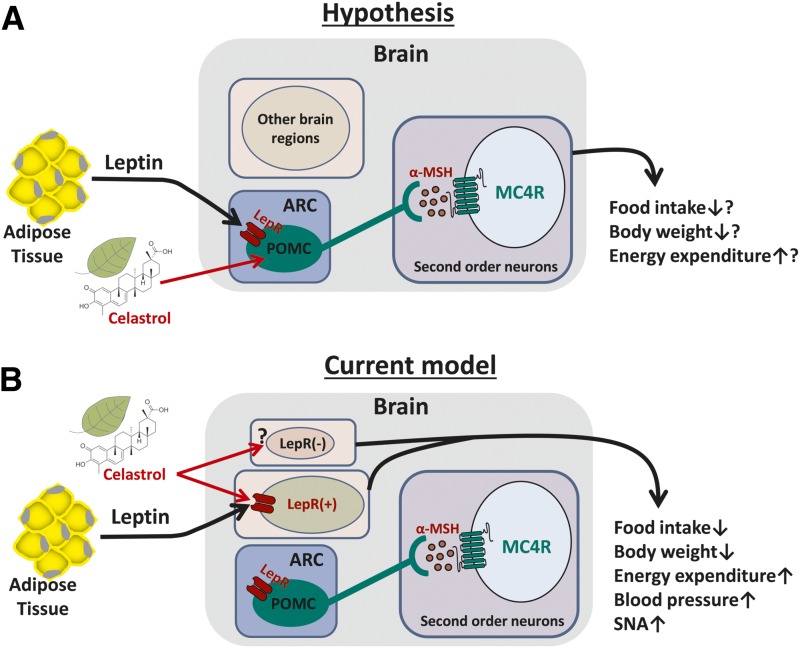
With growing interest in celastrol as a potential treatment for chronic diseases such as obesity and cancer, it is critical to understand the physiological effects of celastrol as well as the mechanisms behind these effects. Our results indicate that the antiobesity effects of celastrol do not require brain MC4R signaling (Fig. 7), which is encouraging, as it brings hope to the 5–8% of those patients with severe obesity due to genetic MC4R deficiency (30–32). However, significantly reduced locomotor activity, potential muscle wasting, and sympathoexcitatory/pressor response caused by celastrol treatment may represent unwanted side effects, which need to be minimized for the clinical use of celastrol to treat obesity.
Figure 7.
Schematic representation of potential circuitry mechanism by which celastrol acts to reduce obesity. A: Hypothesis model. B: Current model based on experimental results. α-MSH, α-melanocyte-stimulating hormone.
Supplementary Material
Article Information
Acknowledgments. The authors thank Dr. Joel K. Elmquist (UT Southwestern Medical Center, Dallas, TX) for kindly providing MC4R-TB and LepR-TB mouse models.
Funding. This work was supported by the National Institutes of Health and National Institute of Mental Health (HL-127673, MH-109920, and HL-084207 to H.C., HL-134850 and HL-084207 to J.L.G., and HL-084207 to K.R.), the American Heart Association (18EIA33890055 to J.L.G. and 14EIA18860041 to K.R.), and the University of Iowa Fraternal Order of Eagles Diabetes Research Center to K.R.
Duality of Interest. No potential conflicts of interest relevant to this article were reported.
Author Contributions. K.S., K.C.D., and H.C. wrote the manuscript. K.S., D.A.M., J.L.G., and H.C. analyzed data. K.S. and H.C. designed research. K.S., K.C.D., D.A.M., B.A.T., J.J., and U.S. performed research. E.D.B., J.L.G., and K.R. revised the manuscript. H.C. is the guarantor of this work and, as such, had full access to all the data in the study and takes responsibility for the integrity of the data and the accuracy of the data analysis.
Footnotes
This article contains Supplementary Data online at http://diabetes.diabetesjournals.org/lookup/suppl/doi:10.2337/db18-1167/-/DC1.
References
- 1.Stewart ST, Cutler DM, Rosen AB. Forecasting the effects of obesity and smoking on U.S. life expectancy. N Engl J Med 2009;361:2252–2260 [DOI] [PMC free article] [PubMed] [Google Scholar]
- 2.Zhang Y, Proenca R, Maffei M, Barone M, Leopold L, Friedman JM. Positional cloning of the mouse obese gene and its human homologue. Nature 1994;372:425–432 [DOI] [PubMed] [Google Scholar]
- 3.Cui H, López M, Rahmouni K. The cellular and molecular bases of leptin and ghrelin resistance in obesity. Nat Rev Endocrinol 2017;13:338–351 [DOI] [PMC free article] [PubMed] [Google Scholar]
- 4.Gautron L, Elmquist JK. Sixteen years and counting: an update on leptin in energy balance. J Clin Invest 2011;121:2087–2093 [DOI] [PMC free article] [PubMed] [Google Scholar]
- 5.Myers MG Jr., Heymsfield SB, Haft C, et al. Challenges and opportunities of defining clinical leptin resistance. Cell Metab 2012;15:150–156 [DOI] [PMC free article] [PubMed] [Google Scholar]
- 6.Baker RG, Hayden MS, Ghosh S. NF-κB, inflammation, and metabolic disease. Cell Metab 2011;13:11–22 [DOI] [PMC free article] [PubMed] [Google Scholar]
- 7.Purkayastha S, Cai D. Neuroinflammatory basis of metabolic syndrome. Mol Metab 2013;2:356–363 [DOI] [PMC free article] [PubMed] [Google Scholar]
- 8.Hotamisligil GS. Endoplasmic reticulum stress and the inflammatory basis of metabolic disease. Cell 2010;140:900–917 [DOI] [PMC free article] [PubMed] [Google Scholar]
- 9.Kälin S, Heppner FL, Bechmann I, Prinz M, Tschöp MH, Yi CX. Hypothalamic innate immune reaction in obesity. Nat Rev Endocrinol 2015;11:339–351 [DOI] [PubMed] [Google Scholar]
- 10.Liu J, Lee J, Salazar Hernandez MA, Mazitschek R, Ozcan U. Treatment of obesity with celastrol. Cell 2015;161:999–1011 [DOI] [PMC free article] [PubMed] [Google Scholar]
- 11.Ma X, Xu L, Alberobello AT, et al. Celastrol protects against obesity and metabolic dysfunction through activation of a HSF1-PGC1α transcriptional axis. Cell Metab 2015;22:695–708 [DOI] [PubMed] [Google Scholar]
- 12.Pfuhlmann K, Schriever SC, Baumann P, et al. Celastrol-induced weight loss is driven by hypophagia and independent from UCP1. Diabetes 2018;67:2456–2465 [DOI] [PubMed] [Google Scholar]
- 13.Williams KW, Liu T, Kong X, et al. Xbp1s in Pomc neurons connects ER stress with energy balance and glucose homeostasis. Cell Metab 2014;20:471–482 [DOI] [PMC free article] [PubMed] [Google Scholar]
- 14.Schneeberger M, Dietrich MO, Sebastián D, et al. Mitofusin 2 in POMC neurons connects ER stress with leptin resistance and energy imbalance. Cell 2013;155:172–187 [DOI] [PMC free article] [PubMed] [Google Scholar]
- 15.Cone RD. Anatomy and regulation of the central melanocortin system. Nat Neurosci 2005;8:571–578 [DOI] [PubMed] [Google Scholar]
- 16.Xu Y, Elmquist JK, Fukuda M. Central nervous control of energy and glucose balance: focus on the central melanocortin system. Ann N Y Acad Sci 2011;1243:1–14 [DOI] [PMC free article] [PubMed] [Google Scholar]
- 17.Elias CF, Aschkenasi C, Lee C, et al. Leptin differentially regulates NPY and POMC neurons projecting to the lateral hypothalamic area. Neuron 1999;23:775–786 [DOI] [PubMed] [Google Scholar]
- 18.Cheung CC, Clifton DK, Steiner RA. Proopiomelanocortin neurons are direct targets for leptin in the hypothalamus. Endocrinology 1997;138:4489–4492 [DOI] [PubMed] [Google Scholar]
- 19.Bookout AL, Cummins CL, Mangelsdorf DJ, Pesola JM, Kramer MF. High-throughput real-time quantitative reverse transcription PCR. Curr Protoc Mol Biol 2006;Chapter 15:Unit 15.8. [DOI] [PubMed] [Google Scholar]
- 20.Cui H, Sohn JW, Gautron L, et al. Neuroanatomy of melanocortin-4 receptor pathway in the lateral hypothalamic area. J Comp Neurol 2012;520:4168–4183 [DOI] [PMC free article] [PubMed] [Google Scholar]
- 21.Grobe JL. Comprehensive assessments of energy balance in mice. Methods Mol Biol 2017;1614:123–146 [DOI] [PMC free article] [PubMed] [Google Scholar]
- 22.Littlejohn NK, Keen HL, Weidemann BJ, et al. Suppression of resting metabolism by the angiotensin AT2 receptor. Cell Rep 2016;16:1548–1560 [DOI] [PMC free article] [PubMed] [Google Scholar]
- 23.Morgan DA, McDaniel LN, Yin T, et al. Regulation of glucose tolerance and sympathetic activity by MC4R signaling in the lateral hypothalamus. Diabetes 2015;64:1976–1987 [DOI] [PMC free article] [PubMed] [Google Scholar]
- 24.Kim JE, Lee MH, Nam DH, et al. Celastrol, an NF-κB inhibitor, improves insulin resistance and attenuates renal injury in db/db mice. PLoS One 2013;8:e62068. [DOI] [PMC free article] [PubMed] [Google Scholar]
- 25.Owen OE, Holup JL, D’Alessio DA, et al. A reappraisal of the caloric requirements of men. Am J Clin Nutr 1987;46:875–885 [DOI] [PubMed] [Google Scholar]
- 26.Sahu A. Intracellular leptin-signaling pathways in hypothalamic neurons: the emerging role of phosphatidylinositol-3 kinase-phosphodiesterase-3B-cAMP pathway. Neuroendocrinology 2011;93:201–210 [DOI] [PMC free article] [PubMed] [Google Scholar]
- 27.Hill JW, Williams KW, Ye C, et al. Acute effects of leptin require PI3K signaling in hypothalamic proopiomelanocortin neurons in mice. J Clin Invest 2008;118:1796–1805 [DOI] [PMC free article] [PubMed] [Google Scholar]
- 28.Al-Qassab H, Smith MA, Irvine EE, et al. Dominant role of the p110beta isoform of PI3K over p110alpha in energy homeostasis regulation by POMC and AgRP neurons. Cell Metab 2009;10:343–354 [DOI] [PMC free article] [PubMed] [Google Scholar]
- 29.Villanueva EC, Myers MG Jr. Leptin receptor signaling and the regulation of mammalian physiology. Int J Obes 2008;32(Suppl. 7):S8–S12 [DOI] [PMC free article] [PubMed] [Google Scholar]
- 30.Vaisse C, Clement K, Durand E, Hercberg S, Guy-Grand B, Froguel P. Melanocortin-4 receptor mutations are a frequent and heterogeneous cause of morbid obesity. J Clin Invest 2000;106:253–262 [DOI] [PMC free article] [PubMed] [Google Scholar]
- 31.Farooqi IS, Yeo GS, Keogh JM, et al. Dominant and recessive inheritance of morbid obesity associated with melanocortin 4 receptor deficiency. J Clin Invest 2000;106:271–279 [DOI] [PMC free article] [PubMed] [Google Scholar]
- 32.Hainerová I, Larsen LH, Holst B, et al. Melanocortin 4 receptor mutations in obese Czech children: studies of prevalence, phenotype development, weight reduction response, and functional analysis. J Clin Endocrinol Metab 2007;92:3689–3696 [DOI] [PubMed] [Google Scholar]
Associated Data
This section collects any data citations, data availability statements, or supplementary materials included in this article.


