

Abstract
The historic emissions of polar micropollutants in a natural drinking water source were investigated by nontarget screening with high-resolution mass spectrometry and open cheminformatics tools. The study area consisted of a riverbank filtration transect fed by the river Lek, a branch of the lower Rhine, and exhibiting up to 60-year travel time. More than 18,000 profiles were detected. Hierarchical clustering revealed that 43% of the 15 most populated clusters were characterized by intensity trends with maxima in the 1990s, reflecting intensified human activities, wastewater treatment plant upgrades and regulation in the Rhine riparian countries. Tentative structure annotation was performed using automated in silico fragmentation. Candidate structures retrieved from ChemSpider were scored based on the fit of the in silico fragments to the experimental tandem mass spectra, similarity to openly accessible accurate mass spectra, associated metadata, and presence in a suspect list. Sixty-seven unique structures (72 over both ionization modes) were tentatively identified, 25 of which were confirmed and included contaminants so far unknown to occur in bank filtrate or in natural waters at all, such as tetramethylsulfamide. This study demonstrates that many classes of hydrophilic organics enter riverbank filtration systems, persisting and migrating for decades if biogeochemical conditions are stable.
Introduction
Thousands of anthropogenic chemicals are released into the aquatic environment via wastewater treatment plant (WWTP) effluents, runoffs, and accidental spills.1−5 Transformation products (TPs) formed during water treatment and under environmental conditions increase the complexity of the chemical mixtures that occur in the environment.6−8 Freshwater systems are particularly vulnerable to contamination by polar organic micropollutants (MPs) exhibiting low or negative pH-adjusted log distribution coefficients (logD) as they preferentially partition into the water phase. When persistent, polar MPs can migrate indefinitely throughout the water cycle and reach drinking water sources.2,9,10
In Europe, riverbank filtration (RBF) is a common drinking water pretreatment with potential to remove dissolved MPs mainly by sorption and biodegradation as surface water infiltrates through the hyporheic zone.11−19 Sorption to organic matter can delay the transport of neutral and moderately hydrophobic MPs (logD > 3) in RBF systems.7 The ion-exchange capacity of soils can result in the retention of cationic MPs, but it is not effective on anionic MPs. Biodegradation is favored by a redox potential gradient and long travel time, as they result in greater biodiversity of microbial communities and longer time for adaptation.7,13,14,20−23
Liquid chromatography coupled to high-resolution tandem mass spectrometry (LC-HRMS/MS) is the preferred system to analyze most polar MPs in aqueous matrices. The capability of recent mass analyzers to achieve sensitive detection with high resolving power (>20,000) and high mass accuracy (<5 ppm) is pivotal to tentatively identify unknown ions via accurate mass spectra without the use of reference standards.24−28 In environmental research, these approaches are known as suspect screening and nontarget screening (NTS). Suspect screening and NTS are increasingly being applied to environmental samples and are gradually becoming harmonized.24−28 Suspect screening aims at identifying pollutants expected in a sample. Commonly, HRMS1 data (mass-to-charge ratios of ionized analytes) is searched for masses of interest suspected to occur (e.g., for study-specific reasons), typically included in a suspect list, and then accompanying isotopic (and adduct) peaks, HRMS2 spectra (fragment ions), and retention time (tR) are used to support the identification and confirmation of suspect hits.24,25,28,29 Initiatives to improve screening efforts include platforms to share suspect lists, e.g., the NORMAN Suspect List Exchange and the U.S. Environmental Protection Agency (EPA) CompTox Dashboard, and openly accessible accurate mass spectral libraries, e.g., MassBank and MassBank of North America (MoNA).
In contrast to suspect screening, NTS aims at identifying compounds without searching for certain masses/substances up front, but rather using the measured data to reveal the masses of interest. Since thousands of ions are acquired indiscriminately in HRMS1 full scans, a prioritization strategy is required to select masses of interest. Tentative structures are generally assigned based on candidate searching in chemical databases, e.g., PubChem and ChemSpider,30,31 often using HRMS2 spectra.26,28 State-of-the-art NTS benefits from the increased availability of computational tools for prioritization, e.g., statistical analysis methods,32−35 and cheminformatics tools for high-throughput structure annotation, e.g., in silico fragmentation querying openly accessible chemical databases and accurate mass spectral libraries.36 An overview on state-of-the-art cheminformatics tools for structure annotation can be found in the literature.37−39
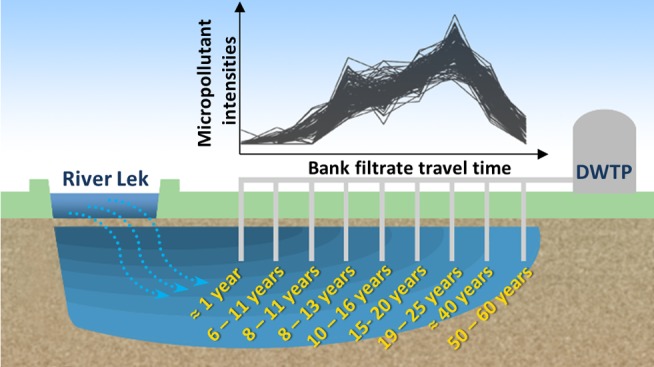
In this study, we investigated a natural drinking water source consisting of a riverbank filtrate originated from the Lek, a branch of the river Rhine in The Netherlands. Bank filtration at this site exhibits up to 60-year travel time from the riverbank to the furthest of a series of wells built by a drinking water utility. This site can be regarded as a hydrogeological archive, where persistent anthropogenic chemicals from the “post-1950s acceleration” to the present are preserved.40 Our goal was to detect major pollution trends across the bank filtration transect and characterize the identities of mobile MPs by applying state-of-the art nontarget screening. To the best of our knowledge, no previous studies have attempted to investigate a time series of nontarget polar contaminants in a natural bank filtrate with such an extended travel time. Exposure to over a half-century of anthropogenic emissions from intensified industrial and agricultural activities followed by mitigation measures such as wastewater treatment upgrades in the 1990s make this bank filtration system a unique location to detect contamination time series and investigate persistent and mobile MPs in the aquatic environment using nontarget analytical approaches. The occurrence of these chemicals is rationalized and their emission sources discussed. Compounds not previously known to occur in bank filtrate were identified, including chemicals that were not known to occur in the water cycle at all.
Materials and Methods
Standards and Reagents
Detailed information on the analytical standards and reagents used for this study are included in the Supporting Information (SI) section S-1.
Sampling Site and Sample Collection
Anaerobic bank filtrate with residence times from 1 to 60 years was abstracted from a series of wells located in two adjacent production fields, named Schuwacht and Tiendweg, fed by the river Lek, a branch of the Rhine (Figure 1). The traveling time at each well was previously investigated by the drinking water utility Oasen (Gouda, The Netherlands) by means of isotopic age dating and hydrogeological modeling.41 The well fields are located in the municipality of Krimpen aan de Lek, South Holland, The Netherlands, and provide raw water for approximately 7000 m3 of drinking water per day. Further details on the riverbank filtration site including a map of the groundwater flow lines with modeled travel time are given in SI section S-2.
Figure 1.
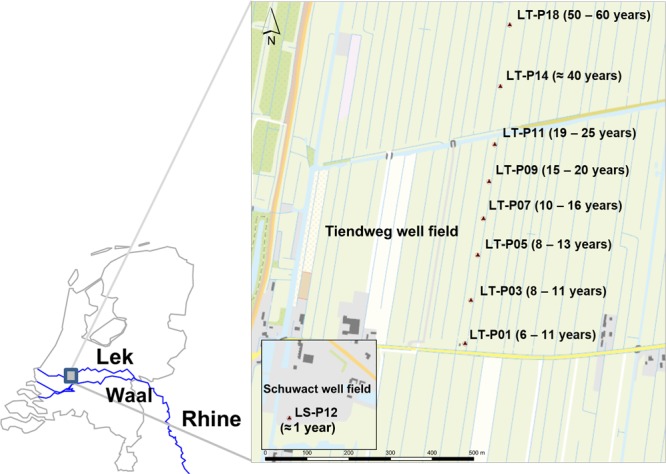
Map of The Netherlands showing the location of the abstraction wells used in the present study with well code and traveling time in parentheses
Bank filtrate samples from nine wells of increasing travel time (n = 3) were collected in 5 L polypropylene bottles from sampling faucets built on each well and immediately transported to the University of Amsterdam, where they were kept in the dark at 2 °C and extracted next day.
Solid-Phase Extraction
The samples were allowed to reach room temperature, then 100 mL was transferred to 250 mL polypropylene bottles and spiked with 100 μL of a mix of 128 isotope-labeled internal standards (IS) available at Eawag at concentration of 1 ng/μL. This resulted in IS concentrations of 1 μg/L in the samples before enrichment by solid-phase extraction (SPE). An offline extraction protocol relying on hydrophilic–lipophilic balance (HLB) sorbent with Oasis cartridges by Waters (Etten-Leur, The Netherlands) was adapted from a procedure described elsewhere42 for the enrichment of moderately hydrophobic and polar organics. The adjustments to the extraction protocol were the spike volume and concentrations of IS and the final concentration step, which in the present study resulted in an enrichment factor of 200 as the extracts were diluted 5-fold with deionized water prior LC-HRMS analysis.
LC-HRMS Analysis
The samples were analyzed at Eawag using LC-HRMS. A high-performance liquid chromatography system (HPLC) consisting of a PAL Autosampler (CTC Analytics, Zwingen, Switzerland), an Accela 1250 mixing pump (Thermo Fisher Scientific, San Jose, United States), and a Waters Xbridge C18 column (2.1 × 100 mm, 3.5 μm) was used. The mobile phase consisted of water (A) and methanol (B), both acidified with 0.1% formic acid. The gradient program expressed as A:B was 90:10 at 0 min, 50:50 at 4 min, 5:95 from 17 to 25 min, and 90:10 from 25.1 to 29 min. The flow rate was 200 μL/min and the column temperature was 30 °C. The sample injection volume was 20 μL. This LC method was adopted from a previous application to biologically treated wastewater,32 where its effectiveness for a wide range of polar and moderately polar MPs was shown. Highly polar MPs may not be sufficiently retained and would require dedicated extraction and chromatographic methods. HRMS detection was achieved with a Q-Exactive hybrid quadrupole-Orbitrap (Thermo Fisher) equipped with an electrospray ionization source (ESI). HRMS1 spectra were acquired for masses ranging from m/z 100 to 1000, with a resolving power of 140,000 at m/z 200 and a mass error below 5 ppm. HRMS2 spectra were recorded in data-dependent mode with a resolving power of 17,500 (more details in SI section S-3.1). Separate analysis runs were conducted for positive and negative ionization modes with a spray voltage of +4 kV and −4 kV, respectively, and a capillary temperature of 300 °C. Confirmation of the prioritized structures was conducted at the University of Amsterdam. Reference standard materials and sample extracts were analyzed with an ultra-high-performance liquid chromatography (UHPLC) system (Nexera, Shimadzu, Den Bosch, The Netherlands) coupled to a maXis 4G q-ToF/HRMS equipped with an ESI source (Bruker Daltonics, Wormer, The Netherlands). Further details on this system are provided in SI section S-3.2).
Nontarget Screening Workflow
The NTS workflow consisted of three steps dealing with (i) HRMS1 data preprocessing, (ii) prioritization, and (iii) structure elucidation. Unless stated otherwise, the steps were automated and computed within R (v 3.3.2).43 For data preprocessing, the analyses raw files were converted to centroided mzXML format with ProteoWizard (v 3.0)44 and imported into enviMass (v 3.4).45 The enviMass settings used for this study are given in SI section S-4). Separate projects were created for positive and negative ESI data. Peak picking was performed to determine the nontarget features, i.e., unique m/z and retention time (tR) pairs. The 128 isotope-labeled ISs were used for mass recalibration, tR alignment, and intensity normalization; i.e., for each measurement, the intensities of the picked peaks were normalized using the median deviation of all ISs from their individual median profile intensity.46 The features were profiled; i.e., unique IDs were assigned to m/z and tR pairs detected across different samples. Features detected in analysis blanks, procedural blanks, and deionized water samples spiked with isotope-labeled ISs (termed blind samples) were profiled and subtracted. Profiled features that were not detected in all three replicates or whose tR was <2 min and >24 min were filtered out. The tR filter ensured that high polarity (tR < 2 min) and low polarity organics (tR > 24 min) were excluded from the data processing, as data of substances eluting either early or late are known to be of lesser quality with the existing chromatographic method, making assignment of (quasi-)isobaric substances challenging. For positive data, grouping of the most common single-charge ESI adducts, i.e., [M + H]+, [M + Na]+, [M + NH4]+, and [M + K]+, was additionally performed to define components.46 Other positive adducts, negative adducts, and isotopic peaks may increase the final number of profiled features, but were not included here.
The profiled features were prioritized by hierarchical cluster analysis (HCA) based on successful applications to lake sediments33 and to ozonation in a WWTP.34 Briefly, profile intensities were normalized to the maximum value detected in the whole data set, and dissimilarities expressed as Euclidean distance were calculated with the stats package (daisy function). The hierarchical classification of the profiled features was computed with the cluster package (hclust function). More details on the application of HCA to profile prioritization can be found elsewhere.33,34 The optimal number of clusters (k) was investigated by silhouette analysis computed with the cluster package (silhouette function). The average silhouette width, i.e., a dimensionless value indicating whether an object truly belongs to the cluster it was assigned to, was calculated at different k values.47 Once the optimal number of clusters was defined, the 15 most populated clusters were considered for further prioritization. In order to obtain good quality spectra for structure annotation, the top 50% most intense ions in each cluster were prioritized and their experimental HRMS1 and HRMS2 data extracted using the RMassBank package.48
Tentative structure elucidation was performed with MetFrag command line v 2.3 in batch mode.36 Neutral monoisotopic masses of the prioritized features were used to retrieve structures within 5 ppm mass accuracy from ChemSpider.31 The maximum number of candidates per feature was set to 5000. The maximum tree depth (MSn) was set to 2. The candidate structures retrieved by MetFrag are fragmented in silico in a combinatorial manner and the fragments matched to the experimental HRMS2 spectra. Additionally, spectral similarities with records in the MoNA spectral library built into MetFrag were calculated using the MetFusion approach.49 All suspect lists available on the NORMAN Suspect List Exchange as of November 2016 were merged into one large list of 11,922 unique InChIKey codes. The candidate structures were scored based on seven terms: FragScore (in silico fragmentation score); MetFusionOffline (MoNA spectral similarities using the MetFusion approach49); CSRefsScores (4 scoring terms: reference count on ChemSpider, reference count on PubMed, reference count on Royal Society of Chemistry and ChemSpider data sources); Suspects (hit in suspect list). The seven scoring terms were normalized by the highest value found among the proposed candidates, and an equal weighting of 1 was used to calculate the MetFrag Combined Score. An in-house script was used to check for agreement of formulas as calculated by MetFrag and the GenFormR package.50 Tentatively annotated spectra and extracted ion chromatograms (EICs) of the nontarget features were plotted with the packages ReSOLUTION(51) and patRoon,52 respectively, for quality control. Finally, identification confidence levels were assigned to all the tentatively annotated features.29
Results and Discussion
Data Preprocessing, Prioritization, and Structure Annotation
An overview on detection, mass deviation, and intensity ranges of the ISs is given in SI section S-5. Preprocessing of HRMS1 spectra with enviMass resulted in 10,850 positive and 7412 negative profiled features across the transect. The HCA results were visualized by plotting heat maps and dendrograms, shown in Figure 2.
Figure 2.

Heat maps of the clustered profile intensities across the riverbank filtration transect in positive (panel a) and negative (panel b) ESI data. Well codes are shown on the x-axes and represent the time line from 1-year (LS-P12) to 60-year (LT-P18) -old water. Dendrograms are shown on the y-axes, where the prioritized clusters are marked in red. The color scale used for profile intensities is illustrated in the legend (upper left).
The HCA classified intensity profiles based on similarities between the detected trends. The results revealed that the data in both polarities were characterized by a series of dynamic trends (clustered at the top of the heat maps) with a high-intensity region between wells LT-P09 and LT-P11, thus in water that originated from the river Lek throughout the 1990s. Additionally, each well seemed to display a set of unique features, visible on the heat maps as high-intensity spots. In the positive data, the spots displayed overall increasing dissimilarity with increasing RBF travel time (Figure 2a), whereas this behavior was not observed in the negative data (Figure 2b). While it could not be excluded that some compounds would occur only in one well, these profiles might result from detection above the peak-picking threshold value exclusively in one well or from lack of detection in all three replicates from adjacent wells. The optimal number of clusters (k) was determined by silhouette analysis. The average silhouette width values for k = 80 were 0.690 and 0.687 for positive and negative data, respectively, indicating reasonable separation of the data.47 The clusters were sorted by the number of profiled features and the 15 most populated clusters were inspected. Inspection of the prioritized clusters is discussed in the following section (see Interpretation of Clustered Time Trends).
The prioritized clusters were populated with 7525 positive and 5123 negative profiled features, of which 3764 and 3845 were prioritized based on their intensity. The RMassBank package was used to extract experimental HRMS1 and HRMS2 information, resulting in 1348 and 983 positive and negative profiled features, respectively, with associated fragmentation data. It should be noted that a higher percentage fraction of negative features was prioritized from the 15 most populated clusters on the basis of their intensities, as only about 25% of these ions triggered an HRMS2 acquisition. An overview of the population of each prioritized cluster, the number of features prioritized from these clusters and how many ions triggered HRMS2 acquisitions is shown in SI section S-6. Candidate structures were assigned to 884 and 550 positive and negative features, respectively, using MetFrag, whereas 369 positive and 345 negative features were excluded from further identification efforts as the maximum number of candidate structures was exceeded (set to 5000 to reduce runtime issues and eliminate cases with poor likelihood of success, based on experience). The MetFrag results were initially reduced by filtering out candidates with combined score lower than 4 (out of 7) and without any explained HRMS2 peaks. The minimum score filtering criterion proved too strict for negative data, which displayed lower scores overall, mostly due to lack of metadata, poor fit of the in silico fragments to the experimental data, or absence from the suspect list. Consequently, for negative data the minimum score was set to 3, including at least one explained HRMS2 peak. The MetFrag Scores plots were visualized for all tentatively annotated features to ease the assessment of the MetFrag results. An example of MetFrag Scores plot for the positive feature m/z 116.0165 detected at tR 2.5 min is provided in Figure 3a.
Figure 3.

Panel a: MetFrag Scores plot of candidate structures to elucidate feature m/z 116.0165 at tR 2.5 min detected in the positive ESI data. CombScore: Combined Score; NoExplPeaks: number of explained peaks; FragScore: in silico fragmentation score; MetFusionOffline: score for spectral similarities against MassBank of North America (MoNA); AVGCSRefs: average ChemSpider references score (only averaged in the plots); Suspects: hit in suspect list. All plotted scores were normalized to 1 except the MetFusionOffline score (which was normalized during score calculation, but not during plotting, for diagnostic purposes). Panel b: HRMS2 spectrum of methylisothiazolinone tentatively annotated by MetFrag to elucidate m/z 116.0164 [M + H]+. Experimental HRMS2 (MSMS, black line); explained MSMS (ExplMSMS, red dashed line); HRMS1 (MS1, green dashed line).
The MetFrag Scores plot in Figure 3a shows individual and combined scores assigned to 59 candidates retrieved from ChemSpider and tentatively annotated to elucidate the nontarget feature of interest, in this example, positive feature m/z 116.0165 (tR = 2.5 min). The top 3 ranking structures were methylisothiazolinone, thiazole-5-methanol and 2-methoxy thiazole, which displayed a rounded score of 5.4, 4.4, and 3.8, respectively (CombScore, black line). The structure of methylisothiazolinone could explain 7/16 peaks, whereas the second and third candidates could explain 4/16 peaks (NoExplPeaks, red dashed line). The higher number of matching fragments resulted in a higher in silico fragmentation score for methylisothiazolinone (FragScore, red line). The top 3 candidates did not differ substantially in terms of spectral similarity scores (MetFusionOffline, blue dotted line), which was low overall and indicated a lack of similar or matching HRMS2 spectra in the library. The reference scores of the top 3 candidates were comparable, although higher for the first candidate (AvgCSRefs, green dot-dash line). The top 2 candidates also had a suspect hit (Suspects, purple dot). Further processing involved generating a tentatively annotated HRMS2 spectrum from the output of MetFrag and GenFormR. MetFrag retrieved candidate structures from ChemSpider, generated fragments in silico, back-calculated their (de)protonated monoisotopic masses, and fitted them to the experimental HRMS2 data. GenFormR instead performed an algebraic calculation on spectral data to find the best formulas fitting the precursor and product ions. As these approaches are complementary, GenFormR was used to gain additional information to MetFrag to enhance the interpretation of the spectra. An example of tentatively annotated spectrum of the highest ranking candidate to elucidate the structure of positive feature m/z 116.0164 is shown in Figure 3b. The structure of methylisothiazolinone was eventually confirmed with a reference standard.
Applying the NTS workflow resulted in the tentative annotation of 72 nontarget features (all Level 3 at this point), 45 from positive clusters and 27 from negative clusters. The full list of tentatively annotated features, including final identification confidence levels, is given in SI section S-7. An overview of the data reduction at the different steps of the NTS workflow is shown in Figure 4.
Figure 4.

Data reduction charts for positive ESI (left) and negative ESI (right) data.
Reference standards of 42 compounds were obtained based on availability and price. All chemicals were highest ranking candidates of their respective nontarget features, with the exception of atrazine-desethyl-2-hydroxy and metamitron-desamino, which were the second-highest ranking candidates, selected based on expert knowledge and following inspection of the MetFrag scores. Atrazine-desethyl-2-hydroxy was chosen for its higher in silico fragmentation score and spectral similarity score compared to the top candidate. The identification of metamitron-desamino represented an interesting case to demonstrate the importance of analyst judgment. This compound was the second-top ranking structure to explain positive ESI feature m/z 188.0817 at tR 6.55 min with a MetFrag Combined Score of 3.25 and 11/17 explained HRMS2 peaks. The highest ranking structure for this feature was the phosphodiesterase 3 inhibitor amrinone, with a score of 5.74 and 10/17 annotated HRMS2 peaks. The most pronounced differences in the MetFrag scores of these two structures were found in the number of references. Since one of the scoring criteria was the number of PubMed references, it was not surprising that the pharmaceutical amrinone had a higher score than a pesticide TP. However, since nearly all tentatively annotated chemicals originated from either industrial or agricultural activities, metamitron-desamino was thought to be the more likely structure. Reference standards were obtained for both compounds, leading to confirmation of the pesticide TP. It is noteworthy that metamitron-desamino would have been missed without amrinone being the first candidate, as its MetFrag score was below the cutoff value used for prioritization of the MetFrag results of the positive ESI data.
The candidate structures of 25 out of 42 nontarget features were confirmed, resulting in a success rate of 60% against the confirmation subset. An extensive evaluation of the performance of MetFrag can be found in the literature.36,37 Details of the successfully confirmed compounds are shown in Table 1. Of the 17 compounds that were not confirmed, 4 could not be detected by the UHPLC-ESI-q-TOF/HRMS system and 13 eluted at a different tR.
Table 1. List of Nontarget Contaminants Confirmed with Reference Standards, Their Formula, Neutral Monoisotopic Mass, Detected Adduct, Retention Time (tR) in Samples and Standards, and ChemSpider ID.
| Compound | Formula | Neutral monoisotopic mass | Detected adduct | tR sample | tR standard | ChemSpider ID |
|---|---|---|---|---|---|---|
| Methylisothiazolinone | C4H5NOS | 115.009 | [M + H]+ | 2.5 | 2.5 | 36393 |
| 1,3-Benzothiazole | C7H5NS | 135.014 | [M + H]+ | 7.5 | 7.5 | 6952 |
| Tetramethylsulfamidea | C4H12N2O2S | 152.062 | [M + H]+ | 4.8 | 4.8 | 121689 |
| Atrazine-desethyl-2-hydroxya | C6H11N5O | 169.096 | [M + H]+ | 3.1 | 3.0 | 96906 |
| 4-Toluenesulfonamidea | C7H9NO2S | 171.035 | [M + H]+ | 5.6 | 5.6 | 6033 |
| Simazine-2-hydroxy | C7H13N5O | 183.112 | [M + H]+ | 4.6 | 4.5 | 16505 |
| Metamitron-desaminoa | C10H9N3O | 187.075 | [M + H]+ | 6.0 | 6.0 | 157884 |
| Benzoguanamine | C9H9N5 | 187.086 | [M + H]+ | 5.0 | 4.9 | 6797 |
| 2,6-dichlorobenzamidea | C7H5Cl2NO | 188.975 | [M + H]+ | 5.0 | 5.0 | 15359 |
| Carbendazima | C9H9N3O2 | 191.069 | [M + H]+ | 4.8 | 4.7 | 23741 |
| Chlortoluron | C10H13ClN2O | 212.072 | [M + H]+ | 9.1 | 9.1 | 25472 |
| Diuron-desmethyl | C8H8Cl2N2O | 218.001 | [M + H]+ | 9.8 | 9.8 | 18040 |
| Diphenylphosphinic acida | C12H11O2P | 218.050 | [M + H]+ and [M − H]− | 7.7 | 7.7 | 14810 |
| 5-Amino-2-chlorotoluene-4-sulfonic acida | C7H8ClNO3S | 220.991 | [M + H]+ and [M − H]− | 5.4 | 5.4 | 6670 |
| Chloridazon | C10H8ClN3O | 221.036 | [M + H]+ | 6.0 | 6.0 | 14790 |
| Naphthionic acida | C10H9NO3S | 223.030 | [M + H]+ and [M − H]− | 2.0 | 2.0 | 6532 |
| Lamotrigine | C9H7Cl2N5 | 255.008 | [M + H]+ | 6.7 | 6.6 | 3741 |
| Tributyl phosphatea | C12H27O4P | 266.165 | [M + H]+ and [M − H]− | 14.9 | 15.0 | 29090 |
| Acesulfame | C4H5NO4S | 162.994 | [M − H]− | 2.5 | 2.5 | 33607 |
| O,O-diethyl thiophosphatea | C4H11O3PS | 170.017 | [M − H]− | 3.6 | 3.6 | 635 |
| p-Toluidine-m-sulfonic acida | C7H9NO3S | 187.030 | [M − H]− | 3.3 | 3.3 | 60405 |
| Dibutyl phosphatea | C8H19O4P | 210.102 | [M − H]− | 8.8 | 8.8 | 7593 |
| Camphorsulfonic acida | C10H16O4S | 232.077 | [M − H]− | 5.0 | 5.0 | 17438 |
| 4-Amino-2,5-dichlorobenzenesulfonic acida | C6H5Cl2NO3S | 240.937 | [M − H]− | 2.6 | 2.6 | 59986 |
| 4-Dodecylbenzenesulfonic acid | C18H30O3S | 326.192 | [M − H]− | 17.3 | 17.3 | 8172 |
Identified in cluster with intensity maxima in the 1990s.
Interpretation of Clustered Time Trends
Several prioritized clusters displayed trends with intensity maxima in the 1990s (wells LT-P09 and LT-P11); there were seven in the positive ESI data and six in the ESI negative data. The presence of these clusters could be rationalized by the history of anthropogenic emissions and restoration measures in the Rhine basin from the 1950s onward. River protection programs coordinated by the International Commission for the Protection of the Rhine (ICPR) resulted in domestic and industrial WWTPs being built between 1970 and 1990 in the Rhine riparian countries.53 A turning point in international river basin management was the 1986 Sandoz accident when 15,000 m3 of water mixed with organophosphorus and organochlorine compounds including pesticides, dyes, solvents, and intermediates accidentally entered the upper Rhine in Switzerland, resulting in widespread mortality of fish, macroinvertebrate, and plankton communities in the riparian countries downstream.53−55 Following the Sandoz accident, the ICPR established the Rhine Action Programme (RAP) to coordinate and implement measures to lower the discharge of hazardous substances. Their goals were achieved in the mid-1990s when substantial reduction of organic emissions, improved oxygen content, and increased biodiversity were reported.53
Given the high number of (tentatively) identified substances, the discussion of the results is limited to the most significant findings from the confirmed identities, whose profiles are highlighted in Figure 5. The cluster shown in Figure 5a indicated a net increase of emissions from the 1950s to the 1990s, followed by a moderate but constant decrease in the 2000s. In this cluster, a negligible number of profiles displayed intensity maxima in the early 2000s; however, these are not discussed further, as no candidate structures could be associated with these trends. Based on the known sources and environmental fate of 2,6-dichlorbenzamide56 (Figure 5a–green line), nonpoint source emissions from agricultural applications of biocides or sewage farming could explain some of these profiles.
Figure 5.

Examples of prioritized clusters with identified nontarget compounds. On the x-axis the well codes are shown. The bank filtrate travel time was as follows: ∼1 year (LS-P12), 6–11 years (LT-P01), 8–11 years (LT-P03), 8–13 years (LT-P05), 10–16 years (LT-P07), 15–20 years (LT-P09), 19–25 (LT-P11), ∼40 years (LT-P14), 50–60 years (LT-P18). Panel a: Positive ESI cluster with maxima in the 1990s accounting for 231 profiles. The profiles of tetramethylsulfamide (blue), 4-toluenesulfonamide (red), 2,6-dichlorobenzamide (green), and tributyl phosphate (gray) are shown in color. Panel b: Negative ESI cluster with maxima in the 1990s accounting for 286 profiles. The profiles of 4-amino-2,5-dichlorobenzenesulfonic acid (green), camphorsulfonic acid (blue), O,O-diethyl thiophosphate (red), and 5-amino-2-chlorotoluene-4-sulfonic acid (gray) are shown in color. Panel c: Positive ESI cluster with gradual increase from the 1970s and displaying stable intensities throughout the 1990s and early 2000s accounting for 238 profiles. The profiles of metamitron-desamino (yellow), diphenylphosphinic acid (green), and atrazine-desethyl-2-hydroxy (blue) are shown in color. Panel d: Positive ESI cluster with maxima in bank filtrate with 1-year travel time (late 2015) accounting for 834 profiles. All trends significantly overlapped, and no plots were manipulated for display purposes. The profiles of lamotrigine (blue) and simazine-2-hydroxy (red) are shown in color.
Confirming the environmental occurrence of tetramethylsulfamide (TMS) was a novel discovery of the present study (Figure 5a–blue line), highlighting the environmental significance of NTS. No information about production or use of TMS was found on the European Chemical Agency (ECHA) or the US EPA Web sites. TMS was not present in the NORMAN Suspect Lists Exchange or in accurate mass spectral libraries. A search on PubChem returned 50 patents detailing formulations for the synthesis of dyes, flame retardants, and pesticides. TMS can be used for the synthesis of sulfur trioxide-dimethylamine complex, a sulfating reagent for dyestuffs.57 TMS can also be a byproduct of the synthesis of dimethylsulfamyl chloride, a chemical used in a variety of industrial applications,58 or a byproduct of the synthesis of sulfur-containing aziridines chemosterilants.59 The exact source of emissions of TMS, although likely industrial, remains so far unknown.
The identity of 4-toluenesulfonamide (4-TSA) in a cluster with maxima in the 1990s was confirmed with a reference standard (Figure 5a–red line). 4-TSA is a plasticizer, an intermediate for the synthesis of pesticides and disinfection byproduct of the antimicrobial agent N-sodium-N-chloro-p-toluenesulfonamide. 4-TSA was detected in the Berlin area in surface water, groundwater, and bank filtrate at concentrations up to 0.9 μg/L, 14.1 μg/L, and 0.24 ng/L, respectively.60 The authors of that study pointed to untreated WWTP effluents and former sewage farms as sources of sulfonamides and concluded that 4-TSA can help identify bank filtrate originating from polluted surface water,60 supporting the results of the present work.
A more dynamic intensity trend showing increasing emission from the 1950s to the 1990s followed by a substantial decrease in the 2000s is shown in Figure 5b. In this cluster, camphorsulfonic acid (CSA) was tentatively identified and later confirmed, along with the metabolite O,O-diethyl thiophosphate (DETP), the industrial chemicals 5-amino-2-chlorotoluene-4-sulfonic acid (ACTSA), and 4-amino-2,5-dichlorobenzenesulfonic acid (ADCBSA). To the best of our knowledge, this is the first time CSA has been confirmed in bank filtrate and its environmental persistence demonstrated (Figure 5b–blue line), highlighting the environmental significance of NTS. CSA was not included in the suspect list, and only one reference was found reporting its occurrence in a WWTP effluent from a rubber manufacturing site in Spain.61 CSA is used as a dopant in the synthesis of polyaniline, a conductive polymer.62,63 Camphor derivatives, such as CSA, are used as UV filters in cosmetic products and eventually reach surface waters via insufficiently treated domestic WWTP effluents.64 The UV filter terephthalydene dicamphorsulfonic acid (TPDCSA) is unstable under photolysis in aqueous media and uncharacterized degradation product(s) with UV absorbance <290 nm were reported.65 CSA has a UV/vis absorbance of 285 nm,66 suggesting that it may originate from TPDCSA in the environment, rather than exclusively from industrial sources.
ACTSA (Figure 5b–gray line) is an important building block for the synthesis of dyes reported to persist in chemical and biological wastewater treatment.67 Its 2-amino isomer can be obtained from the cleavage of the azo dye Pigment Red 53 and was included in a priority list of 23 unregulated aromatic amines of toxicological concern.68 Limited literature references were found for this compound, and to the best of our knowledge, this is the first time it has been identified in a riverbank filtrate. The REACH registration dossier of ACTSA was submitted by a dye manufacturer with a production site at the river Main, the longest tributary of the Rhine, approximately 500 km upstream of the RBF site. The identity of another dyestuff synthesis intermediate, ADCBSA, was confirmed in this cluster (Figure 5b–green line). This chemical occurs in liquid waste from manufacturing processes; however, liquid waste containing ADCBSA is usually treated separately before being sent to WWTPs, because this compound is toxic to microorganisms and inhibits biological treatment.69 This is the first time ADCBSA is identified in a riverbank filtrate and its persistence reported. Its decreasing intensities in the 2000s might be explained by upgrades of industrial WWTPs with ion exchange resins and/or by decreased production volumes.
DETP is a product of mammal metabolism and biological wastewater treatment, as well as an environmental TP of insecticides, flame retardants, plasticizers, and industrial chemicals.70,71 Even if nonpoint sources cannot be excluded, the intensity profile of DETP (Figure 5b–red line) suggests industrial or domestic effluents as possible sources. The decrease in the young bank filtrate might be explained by the upgrade of WWTPs and the implementation of more effective regulation in the 2000s in the riparian Rhine countries. The hypothesis about the point sources of DETP was supported by a recent wastewater-based epidemiological study on the human exposure to pesticides, which reported a detection frequency of 7% in domestic WWTP effluents across Europe in concentrations in the low ng/L range.72 We demonstrate that DETP can enter RBF systems, where it can persist and migrate for at least two decades in the dark anaerobic conditions.
Contaminants that entered the RBF in the mid-1970s and displayed stable intensities along the transect were found among the prioritized clusters. In the cluster shown in Figure 5c, the metabolites metamitron-desamino, atrazine-desethyl-2-hydroxy, and diphenylphosphinic acid (DPPS) were confirmed with their respective reference standard. Metamitron-desamino is the main biodegradation product of the herbicide metamitron, a mobile chemical known to reach surface waters via polluted runoffs or WWTP effluents and with high potential to leach into groundwater. Concentrations of metamitron-desamino up to 680 ng/L have been reported from rivers impacted by urban and agricultural activities.73 Recent research showed that this metabolite can originate from biodegradation in water–sediment systems.74 The profile of metamitron-desamino (Figure 5c–yellow line) matched the sales data of its parent compound metamitron, which was introduced in the European Union in 1975 and has displayed a stable sales trend from the mid-1990s onward.75 The lower intensities in the first well might reflect the recent introduction of herbicide formulations with lower concentrations of metamitron combined with other active substances.76
DPPS (Figure 5c–green line) is a degradation product of the pharmaceutical precursor triphenylphosphine oxide (TPPO). TPPO was quantified at concentrations below 300 ng/L in bank filtrate with up to 4-year travel time from the same area investigated in our study.77 Literature indicated that DPPS was fully degraded within 30 days in a fixed-bed bioreactor filled with aerobic Rhine water and that a major source of TPPO is located approximately 400 km upstream of the RBF system investigated in the present manuscript.78 DPPS is a highly hydrophilic anionic compound (logDpH7.4 = −1.69; pKa = 2.3), so it is not retarded by bank filtration. For the first time, we found that DPPS can be persistent and mobile in the dark anaerobic environment.
Profiles displaying intensity maxima in well LS-P12 (1-year-old water) followed by a sudden decrease in the rest of the transect were assigned to the second and fourth most populated clusters in positive and negative ESI data, respectively (Figure 5d). It could be assumed that such clusters would include profiles of chemicals possibly infiltrated only recently, infiltrated and diluted to below detection level in the older bank filtrate, or formed at the riverbank within 1-year travel time and either degraded further or diluted to undetectable concentrations. In this cluster, lamotrigine, simazine-2-hydroxy, diuron-desmethyl, and 1,3-benzothiazole were confirmed with reference standards. The anticonvulsant lamotrigine (Figure 5d–blue line) is known to be persistent to biological wastewater treatment and has been previously detected in surface water79 and in bank filtrate with short travel time.13 Detection limited to the first well was not expected, because lamotrigine was first marketed in the EU already in 1993. Literature data on degradation of lamotrigine in anaerobic conditions was not found. Although reductive dehalogenation of aryl halide groups might occur in such conditions,80 dechlorinated TPs of lamotrigine were screened for and not detected in the experimental HRMS1 data. A recent study on the fate of pharmaceuticals in soils irrigated with reclaimed wastewater found that lamotrigine (logDpH7.4 = 1.68) displayed the highest sorption affinity to soil compared to carbamazepine (logDpH7.4 = 2.28) and its metabolites.81 The 6- to 11-year travel time between wells LS-P12 and LT-P01 might have maximized adsorptive interactions and restrained lamotrigine mobility in the subsurface. Ultimately, the contribution of dilution to undetectable levels in the older bank filtrate could not be determined.
It is noteworthy how simazine-2-hydroxy was not detected after at least 11-year travel time (Figure 5d–red line), whereas atrazine-desethyl-2-hydroxy showed persistence across the transect (Figure 5c–blue line). Previous studies found that simazine occurred in surface water and groundwater at concentrations up to 10 times lower than atrazine.82 It is unclear whether simazine-2-hydroxy was removed during RBF, transformed further or diluted to undetectable concentrations in the older bank filtrate. Both triazine herbicides that lead to formation of these TPs were banned in the European Union in 2004. The detection of atrazine-desethyl-2-hydroxy at constant levels might be attributed to the release of atrazine (or TPs) from contaminated river sediments prior to infiltration in the RBF system.83 Other known metabolites of atrazine and simazine were screened for in HRMS1 data, but were not detected. These TPs might have either been absent from the RBF transect or occurred at undetectable concentrations. It cannot be excluded that atrazine-desethyl-2-hydroxy prevailed over other more commonly detected dealkylated metabolites,84 as the aquifer screened in this study differs from others for being both confined and anaerobic. For example, in a recent screening of three aerobic bank filtration sites, atrazine-2-hydroxy and atrazine-desethyl were both found in low ng/L concentration, whereas atrazine-desethyl-2-hydroxy and atrazine-desisopropyl were not detected.19
Environmental Implications
This study contributes to the mounting evidence of environmental persistence of hydrophilic organic compounds and shows that polar substances can be highly mobile in RBF systems with long travel time at stable biogeochemical conditions. More research should be done on this or comparable RBF transects to investigate the fate of the most polar MPs, e.g., with even lower logD values than those identified in this study, which might have been lost during enrichment or insufficiently retained by reversed-phase chromatography. We showed that state-of-the-art NTS relying on open computational tools and performed in a semiautomated manner can be an extremely powerful method to explore water contaminants by HRMS. Spectra of the substances identified in this study will be uploaded to openly accessible accurate mass spectral libraries to contribute to future screenings. The list of confirmed contaminants has been shared with local drinking water utilities to assess their removal in drinking water treatment. The trend analysis presented here can be useful to manage bank filtration systems with long travel times in catchment areas impacted by anthropogenic activities. In these cases, to avoid contamination with many legacy pollutants from the 1990s, which overall displayed higher normalized intensities in the older water and thus likely occurred at higher concentrations, the use of young groundwater to produce potable water is recommended, whereas advanced treatment should be applied to the old groundwater. In the case of drinking water treatment at the Tiendweg well field, reverse osmosis is applied to maximize micropollutant removal.
Acknowledgments
The authors thank Martin Loos for his support with enviMass and Aurea Chiaia-Hernández and Michael Stravs for helpful discussions at Eawag. The drinking water utility Oasen (Gouda, The Netherlands) is acknowledged for funding the ECROS project at the Institute for Biodiversity and Ecosystem Dynamics, University of Amsterdam. Funding at Eawag was provided through the EU seventh Framework Programme SOLUTIONS project under Grant Agreement No. 603437. Work at LCSB was supported by the Luxembourg National Research Fund (FNR), grant number 12341006. Willem-Jan Knibbe and Hans van Woerden at Oasen are acknowledged for arranging collection of the samples. Three anonymous reviewers are acknowledged for helpful comments.
Supporting Information Available
The Supporting Information is available free of charge on the ACS Publications website at DOI: 10.1021/acs.est.9b01750.
Standards and chemicals and their sources; tables of labeled and unlabeled standards with molecular formulas and CAS numbers. Additional details on the study area; figure showing the well fields with groundwater flow lines and modeled travel times. Additional details on the HRMS systems. Settings for enviMass. Overview on the detection of the isotope-labeled standards; figures showing mass deviation and intensity distribution of the labeled-standards; tables listing detected adducts, retention time and sample matches of the isotope-labeled standards. Tables listing feature population of the prioritized clusters, number of prioritized features and features with associated HRMS2 data. List of (tentatively) identified substances. (PDF)
The authors declare no competing financial interest.
Supplementary Material
References
- Schwarzenbach R. P.; Escher B. I.; Fenner K.; Hofstetter T. B.; Johnson C. A.; von Gunten U.; Wehrli B. The Challenge of Micropollutants in Aquatic Systems. Science 2006, 313 (5790), 1072–1077. 10.1126/science.1127291. [DOI] [PubMed] [Google Scholar]
- Loos R.; Gawlik B. M.; Locoro G.; Rimaviciute E.; Contini S.; Bidoglio G. EU-Wide Survey of Polar Organic Persistent Pollutants in European River Waters. Environ. Pollut. 2009, 157 (2), 561–568. 10.1016/j.envpol.2008.09.020. [DOI] [PubMed] [Google Scholar]
- Luo Y.; Guo W.; Ngo H. H.; Nghiem L. D.; Hai F. I.; Zhang J.; Liang S.; Wang X. C. A Review on the Occurrence of Micropollutants in the Aquatic Environment and Their Fate and Removal during Wastewater Treatment. Sci. Total Environ. 2014, 473, 619–641. 10.1016/j.scitotenv.2013.12.065. [DOI] [PubMed] [Google Scholar]
- Hermes N.; Jewell K. S.; Wick A.; Ternes T. A. Quantification of More than 150 Micropollutants Including Transformation Products in Aqueous Samples by Liquid Chromatography-Tandem Mass Spectrometry Using Scheduled Multiple Reaction Monitoring. J. Chromatogr. A 2018, 1531, 64–73. 10.1016/j.chroma.2017.11.020. [DOI] [PubMed] [Google Scholar]
- Loos R.; Locoro G.; Comero S.; Contini S.; Schwesig D.; Werres F.; Balsaa P.; Gans O.; Weiss S.; Blaha L.; et al. Pan-European Survey on the Occurrence of Selected Polar Organic Persistent Pollutants in Ground Water. Water Res. 2010, 44 (14), 4115–4126. 10.1016/j.watres.2010.05.032. [DOI] [PubMed] [Google Scholar]
- Krauss M.; Hollender J. Analysis of Nitrosamines in Wastewater: Exploring the Trace Level Quantification Capabilities of a Hybrid Linear Ion Trap/Orbitrap Mass Spectrometer. Anal. Chem. 2008, 80 (3), 834–842. 10.1021/ac701804y. [DOI] [PubMed] [Google Scholar]
- Bertelkamp C.; Reungoat J.; Cornelissen E. R.; Singhal N.; Reynisson J.; Cabo A. J.; van der Hoek J. P.; Verliefde A. R. D. Sorption and Biodegradation of Organic Micropollutants during River Bank Filtration: A Laboratory Column Study. Water Res. 2014, 52, 231–241. 10.1016/j.watres.2013.10.068. [DOI] [PubMed] [Google Scholar]
- Hollender J.; Bourgin M.; Fenner K. B.; Longree P.; McArdell C. S.; Moschet C.; Ruff M.; Schymanski E. L.; Singer H. P. Exploring the Behaviour of Emerging Contaminants in the Water Cycle Using the Capabilities of High Resolution Mass Spectrometry. Chimia 2014, 68 (11), 793–798. 10.2533/chimia.2014.793. [DOI] [PubMed] [Google Scholar]
- Reemtsma T.; Berger U.; Arp H. P. H.; Gallard H.; Knepper T. P.; Neumann M.; Quintana J. B.; Voogt P. de. Mind the Gap: Persistent and Mobile Organic Compounds—Water Contaminants That Slip Through. Environ. Sci. Technol. 2016, 50 (19), 10308–10315. 10.1021/acs.est.6b03338. [DOI] [PubMed] [Google Scholar]
- Eschauzier C.; Haftka J.; Stuyfzand P. J.; de Voogt P. Perfluorinated Compounds in Infiltrated River Rhine Water and Infiltrated Rainwater in Coastal Dunes. Environ. Sci. Technol. 2010, 44 (19), 7450–7455. 10.1021/es100471z. [DOI] [PubMed] [Google Scholar]
- Tufenkji N.; Ryan J. N.; Elimelech M. Peer Reviewed: The Promise of Bank Filtration. Environ. Sci. Technol. 2002, 36 (21), 422A–428A. 10.1021/es022441j. [DOI] [PubMed] [Google Scholar]
- Hiscock K. M.; Grischek T. Attenuation of Groundwater Pollution by Bank Filtration. J. Hydrol. 2002, 266 (3–4), 139–144. 10.1016/S0022-1694(02)00158-0. [DOI] [Google Scholar]
- Huntscha S.; Rodriguez Velosa D. M.; Schroth M. H.; Hollender J. Degradation of Polar Organic Micropollutants during Riverbank Filtration: Complementary Results from Spatiotemporal Sampling and Push-Pull Tests. Environ. Sci. Technol. 2013, 47 (20), 11512–11521. 10.1021/es401802z. [DOI] [PubMed] [Google Scholar]
- Henzler A. F.; Greskowiak J.; Massmann G. Modeling the Fate of Organic Micropollutants during River Bank Filtration (Berlin, Germany). J. Contam. Hydrol. 2014, 156, 78–92. 10.1016/j.jconhyd.2013.10.005. [DOI] [PubMed] [Google Scholar]
- Hoppe-Jones C.; Oldham G.; Drewes J. E. Attenuation of Total Organic Carbon and Unregulated Trace Organic Chemicals in U.S. Riverbank Filtration Systems. Water Res. 2010, 44 (15), 4643–4659. 10.1016/j.watres.2010.06.022. [DOI] [PubMed] [Google Scholar]
- Benotti M. J.; Song R.; Wilson D.; Snyder S. A. Removal of pharmaceuticals and endocrine disrupting compounds through pilot- and full-scale riverbank filtration. Water Sci. Technol.: Water Supply 2012, 12, 11. 10.2166/ws.2011.068. [DOI] [Google Scholar]
- Verstraeten I. M.; Heberer T.; Scheytt T.. Occurrence, Characteristics, Transport, and Fate of Pesticides, Pharmaceuticals, Industrial Products, and Personal Care Products at Riverbank Filtration Sites BT. In Riverbank Filtration: Improving Source-Water Quality, Ray C.; Melin G.; Linsky R. B., Eds.; Springer Netherlands: Dordrecht, 2003; pp 175–227. [Google Scholar]
- Ascott M. J.; Lapworth D. J.; Gooddy D. C.; Sage R. C.; Karapanos I. Impacts of Extreme Flooding on Riverbank Filtration Water Quality. Sci. Total Environ. 2016, 554–555, 89–101. 10.1016/j.scitotenv.2016.02.169. [DOI] [PubMed] [Google Scholar]
- Hollender J.; Rothardt J.; Radny D.; Loos M.; Epting J.; Huggenberger P.; Borer P.; Singer H. Comprehensive Micropollutant Screening Using LC-HRMS/MS at Three Riverbank Filtration Sites to Assess Natural Attenuation and Potential Implications for Human Health. Water Res. X 2018, 1, 100007. 10.1016/j.wroa.2018.100007. [DOI] [PMC free article] [PubMed] [Google Scholar]
- Schaper J. L.; Seher W.; Nützmann G.; Putschew A.; Jekel M.; Lewandowski J. The Fate of Polar Trace Organic Compounds in the Hyporheic Zone. Water Res. 2018, 140, 158–166. 10.1016/j.watres.2018.04.040. [DOI] [PubMed] [Google Scholar]
- Liu P.; Farré M. J.; Keller J.; Gernjak W. Reducing Natural Organic Matter and Disinfection By-Product Precursors by Alternating Oxic and Anoxic Conditions during Engineered Short Residence Time Riverbank Filtration: A Laboratory-Scale Column Study. Sci. Total Environ. 2016, 565, 616–625. 10.1016/j.scitotenv.2016.05.061. [DOI] [PubMed] [Google Scholar]
- Bertelkamp C.; Verliefde A. R. D.; Schoutteten K.; Vanhaecke L.; Vanden Bussche J.; Singhal N.; van der Hoek J. P. The Effect of Redox Conditions and Adaptation Time on Organic Micropollutant Removal during River Bank Filtration: A Laboratory-Scale Column Study. Sci. Total Environ. 2016, 544, 309–318. 10.1016/j.scitotenv.2015.11.035. [DOI] [PubMed] [Google Scholar]
- Ghattas A.-K.; Fischer F.; Wick A.; Ternes T. A. Anaerobic Biodegradation of (Emerging) Organic Contaminants in the Aquatic Environment. Water Res. 2017, 116, 268–295. 10.1016/j.watres.2017.02.001. [DOI] [PubMed] [Google Scholar]
- Krauss M.; Singer H.; Hollender J. LC-High Resolution MS in Environmental Analysis: From Target Screening to the Identification of Unknowns. Anal. Bioanal. Chem. 2010, 397 (3), 943–951. 10.1007/s00216-010-3608-9. [DOI] [PubMed] [Google Scholar]
- Hernández F.; Sancho J. V.; Ibáñez M.; Abad E.; Portolés T.; Mattioli L. Current Use of High-Resolution Mass Spectrometry in the Environmental Sciences. Anal. Bioanal. Chem. 2012, 403 (5), 1251–1264. 10.1007/s00216-012-5844-7. [DOI] [PubMed] [Google Scholar]
- Schymanski E. L.; Singer H. P.; Longrée P.; Loos M.; Ruff M.; Stravs M. A.; Ripollés Vidal C.; Hollender J. Strategies to Characterize Polar Organic Contamination in Wastewater: Exploring the Capability of High Resolution Mass Spectrometry. Environ. Sci. Technol. 2014, 48 (3), 1811–1818. 10.1021/es4044374. [DOI] [PubMed] [Google Scholar]
- Aceña J.; Stampachiacchiere S.; Pérez S.; Barceló D. Advances in Liquid Chromatography-High-Resolution Mass Spectrometry for Quantitative and Qualitative Environmental Analysis. Anal. Bioanal. Chem. 2015, 407 (21), 6289–6299. 10.1007/s00216-015-8852-6. [DOI] [PubMed] [Google Scholar]
- Hollender J.; Schymanski E. L.; Singer H. P.; Ferguson P. L. Nontarget Screening with High Resolution Mass Spectrometry in the Environment: Ready to Go?. Environ. Sci. Technol. 2017, 51 (20), 11505–11512. 10.1021/acs.est.7b02184. [DOI] [PubMed] [Google Scholar]
- Schymanski E. L.; Jeon J.; Gulde R.; Fenner K.; Ruff M.; Singer H. P.; Hollender J. Identifying Small Molecules via High Resolution Mass Spectrometry: Communicating Confidence. Environ. Sci. Technol. 2014, 48 (4), 2097–2098. 10.1021/es5002105. [DOI] [PubMed] [Google Scholar]
- Gindulyte A.; Shoemaker B. A.; Yu B.; Fu G.; He J.; Zhang J.; Chen J.; Wang J.; Han L.; Thiessen P. A.; et al. Pub Chem Substance and Compound Databases. Nucleic Acids Res. 2016, 44 (D1), D1202–D1213. 10.1093/nar/gkv951. [DOI] [PMC free article] [PubMed] [Google Scholar]
- Pence H. E.; Williams A. Chem Spider: An Online Chemical Information Resource. J. Chem. Educ. 2010, 87 (11), 1123–1124. 10.1021/ed100697w. [DOI] [Google Scholar]
- Schollee J. E.; Schymanski E. L.; Avak S. E.; Loos M.; Hollender J. Prioritizing Unknown Transformation Products from Biologically-Treated Wastewater Using High-Resolution Mass Spectrometry, Multivariate Statistics, and Metabolic Logic. Anal. Chem. 2015, 87 (24), 12121–12129. 10.1021/acs.analchem.5b02905. [DOI] [PubMed] [Google Scholar]
- Chiaia-Hernandez A. C.; Gunthardt B. F.; Frey M. P.; Hollender J. Unravelling Contaminants in the Anthropocene Using Statistical Analysis of Liquid Chromatography-High-Resolution Mass Spectrometry Nontarget Screening Data Recorded in Lake Sediments. Environ. Sci. Technol. 2017, 51 (21), 12547–12556. 10.1021/acs.est.7b03357. [DOI] [PubMed] [Google Scholar]
- Schollée J. E.; Bourgin M.; von Gunten U.; McArdell C. S.; Hollender J. Non-Target Screening to Trace Ozonation Transformation Products in a Wastewater Treatment Train Including Different Post-Treatments. Water Res. 2018, 142, 267–278. 10.1016/j.watres.2018.05.045. [DOI] [PubMed] [Google Scholar]
- Peter K. T.; Tian Z.; Wu C.; Lin P.; White S.; Du B.; McIntyre J. K.; Scholz N. L.; Kolodziej E. P. Using High-Resolution Mass Spectrometry to Identify Organic Contaminants Linked to Urban Stormwater Mortality Syndrome in Coho Salmon. Environ. Sci. Technol. 2018, 52 (18), 10317–10327. 10.1021/acs.est.8b03287. [DOI] [PubMed] [Google Scholar]
- Ruttkies C.; Schymanski E. L.; Wolf S.; Hollender J.; Neumann S. Met Frag Relaunched: Incorporating Strategies beyond in Silico Fragmentation. J. Cheminf. 2016, 8 (1), 3. 10.1186/s13321-016-0115-9. [DOI] [PMC free article] [PubMed] [Google Scholar]
- Schymanski E. L.; Ruttkies C.; Krauss M.; Brouard C.; Kind T.; Dührkop K.; Allen F.; Vaniya A.; Verdegem D.; Böcker S.; et al. Critical Assessment of Small Molecule Identification 2016: Automated Methods. J. Cheminf. 2017, 9 (1), 22. 10.1186/s13321-017-0207-1. [DOI] [PMC free article] [PubMed] [Google Scholar]
- Schymanski E. L.; Singer H. P.; Slobodnik J.; Ipolyi I. M.; Oswald P.; Krauss M.; Schulze T.; Haglund P.; Letzel T.; Grosse S.; et al. Non-Target Screening with High-Resolution Mass Spectrometry: Critical Review Using a Collaborative Trial on Water Analysis. Anal. Bioanal. Chem. 2015, 407 (21), 6237–6255. 10.1007/s00216-015-8681-7. [DOI] [PubMed] [Google Scholar]
- Blaženović I.; Kind T.; Ji J.; Fiehn O. Software Tools and Approaches for Compound Identification of LC-MS/MS Data in Metabolomics. Metabolites 2018, 8, 31. 10.3390/metabo8020031. [DOI] [PMC free article] [PubMed] [Google Scholar]
- Steffen W.; Broadgate W.; Deutsch L.; Gaffney O.; Ludwig C. The Trajectory of the Anthropocene: The Great Acceleration. Anthr. Rev. 2015, 2 (1), 81–98. 10.1177/2053019614564785. [DOI] [Google Scholar]
- Timmer H.Aandeel Oevergrondwater Berekend via Zuurstof-18 Isotopen Onderzoek - Internal Oasen Report; 2006.
- Albergamo V.; Helmus R.; de Voogt P. Direct Injection Analysis of Polar Micropollutants in Natural Drinking Water Sources with Biphenyl Liquid Chromatography Coupled to High-Resolution Time-of-Flight Mass Spectrometry. J. Chromatogr. A 2018, 1569, 53–61. 10.1016/j.chroma.2018.07.036. [DOI] [PubMed] [Google Scholar]
- R Core Team. R: A Language and Environment for Statistical Computing; Foundation for Statistical Computing; Vienna, Austria, 2017.https//www.R-project.org/.
- Chambers M. C.; Maclean B.; Burke R.; Amodei D.; Ruderman D. L.; Neumann S.; Gatto L.; Fischer B.; Pratt B.; Egertson J.; et al. A Cross-Platform Toolkit for Mass Spectrometry and Proteomics. Nat. Biotechnol. 2012, 30, 918. 10.1038/nbt.2377. [DOI] [PMC free article] [PubMed] [Google Scholar]
- Loos M.enviMass beta version 3.1; Zenodo 2016. 10.5281/zenodo.48164https://zenodo.org/record/48164#.XQVcIYhKhEY. [DOI]
- Loos M. J.Mining of High-Resolution Mass Spectrometry Data to Monitor Organic Pollutant Dynamics in Aquatic Systems; ETH Zurich, 2015.
- Ng R. T.; Han J.. Efficient and Effective Clustering Methods for Spatial Data Mining. In Proceedings of the 20th International Conference on Very Large Data Bases, VLDB ‘94; Morgan Kaufmann Publishers Inc.: San Francisco, CA, USA, 1994; pp 144–155.
- Stravs M. A.; Schymanski E. L.; Singer H. P.; Hollender J. Automatic Recalibration and Processing of Tandem Mass Spectra Using Formula Annotation. J. Mass Spectrom. 2013, 48 (1), 89–99. 10.1002/jms.3131. [DOI] [PubMed] [Google Scholar]
- Gerlich M.; Neumann S. Met Fusion: Integration of Compound Identification Strategies. J. Mass Spectrom. 2013, 48 (3), 291–298. 10.1002/jms.3123. [DOI] [PubMed] [Google Scholar]
- Meringer E.GenFormR package 2018. https://github.com/schymane/GenFormR.
- Schymanski E. L.ReSOLUTION - SOLUTIONS for High Resolution Mass Spectrometry; https://github.com/schymane/ReSOLUTION.
- Helmus R.patRoon package 2018. https://github.com/rickhelmus/patRoon.
- Wieriks K.; Schulte-Wülwer-Leidig A. Integrated Water Management for the Rhine River Basin, from Pollution Prevention to Ecosystem Improvement. Nat. Resour. Forum 1997, 21 (2), 147–156. 10.1111/j.1477-8947.1997.tb00686.x. [DOI] [Google Scholar]
- Verweij M. The Remarkable Restoration of the Rhine: Plural Rationalities in Regional Water Politics. Water Int. 2017, 42 (2), 207–221. 10.1080/02508060.2017.1278576. [DOI] [Google Scholar]
- Capel P. D.; Giger W.; Reichert P.; Wanner O. Accidental Input of Pesticides into the Rhine River. Environ. Sci. Technol. 1988, 22 (9), 992–997. 10.1021/es00174a001. [DOI] [PubMed] [Google Scholar]
- Björklund E.; Styrishave B.; Anskjær G. G.; Hansen M.; Halling-Sørensen B. Dichlobenil and 2,6-Dichlorobenzamide (BAM) in the Environment: What Are the Risks to Humans and Biota?. Sci. Total Environ. 2011, 409 (19), 3732–3739. 10.1016/j.scitotenv.2011.06.004. [DOI] [PubMed] [Google Scholar]
- Gilbert E. E. The Reactions of Sulfur Trioxide, and Its Adducts, with Organic Compounds. Chem. Rev. 1962, 62 (6), 549–589. 10.1021/cr60220a003. [DOI] [Google Scholar]
- Hargittai I.; Brunvoll J. Reinvestigation of the Molecular Structure of N,N-Dimethyl Sulfamoyl Chloride by Electron Diffraction. Acta Chem. Scand. 1976, 30A, 634–640. 10.3891/acta.chem.scand.30a-0634. [DOI] [Google Scholar]
- Borkovec A. B.; Woods C. W.. Aziridine Chemosterilants. In New Approaches to Pest Control and Eradication; Advances in Chemistry; American Chemical Society: Washington, DC, 1963; Vol. 41, pp 6–47. [Google Scholar]
- Richter D.; Massmann G.; Dünnbier U. Identification and Significance of Sulphonamides (p-TSA, o-TSA, BSA) in an Urban Water Cycle (Berlin, Germany). Water Res. 2008, 42 (6–7), 1369–1378. 10.1016/j.watres.2007.10.003. [DOI] [PubMed] [Google Scholar]
- Puig A.; Ormad P.; Sarasa J.; Gimeno E.; Ovelleiro J. L. Wastewater from the Manufacture of Rubber Vulcanization Accelerators: Characterization, Downstream Monitoring and Chemical Treatment. J. Chromatogr. A 1996, 733 (1–2), 511–522. 10.1016/0021-9673(95)00866-7. [DOI] [PubMed] [Google Scholar]
- MacDiarmid A. G.; Epstein A. J. The Concept of Secondary Doping as Applied to Polyaniline. Synth. Met. 1994, 65 (2–3), 103–116. 10.1016/0379-6779(94)90171-6. [DOI] [Google Scholar]
- Lee H.-T.; Yang S.-J. Synthesis and Characterization of Polyaniline/Silica Doped with Camphorsulfonic Acid and Dodecylbenzylsulfonic Acid. J. Appl. Polym. Sci. 2009, 116 (2), 934–945. 10.1002/app.31624. [DOI] [Google Scholar]
- Silvia Díaz-Cruz M.; Llorca M.; Barceló D.; Barceló D. Organic UV Filters and Their Photodegradates, Metabolites and Disinfection by-Products in the Aquatic Environment. TrAC, Trends Anal. Chem. 2008, 27 (10), 873–887. 10.1016/j.trac.2008.08.012. [DOI] [Google Scholar]
- Serpone N.; Salinaro A.; Emeline A. V.; Horikoshi S.; Hidaka H. Z. J. An in Vitro Systematic Spectroscopic Examination of the Photostabilities of a Random Set of Commercial Sunscreen Lotions and Their Chemical UVB/UVA Active Agents. Photochem. Photobiol. Sci. 2002, 1 (12), 970–981. 10.1039/b206338g. [DOI] [PubMed] [Google Scholar]
- Huang J.; Virji S.; Weiller B. H.; Kaner R. B. Polyaniline Nanofibers: Facile Synthesis and Chemical Sensors. J. Am. Chem. Soc. 2003, 125 (2), 314–315. 10.1021/ja028371y. [DOI] [PubMed] [Google Scholar]
- Li C.; Xu Z.; Li C. Removal of 5-Amino-2-Chlorotoluene-4-Sulfonic and Chlorhydric Acids from Wastewater by Weakly Basic Resin11Supported by the Natural Science Foundation of Jilin Province (No.990337). Chin. J. Chem. Eng. 2006, 14 (5), 696–699. 10.1016/S1004-9541(06)60137-7. [DOI] [Google Scholar]
- Brüschweiler B. J.; Küng S.; Bürgi D.; Muralt L.; Nyfeler E. Identification of Non-Regulated Aromatic Amines of Toxicological Concern Which Can Be Cleaved from Azo Dyes Used in Clothing Textiles. Regul. Toxicol. Pharmacol. 2014, 69 (2), 263–272. 10.1016/j.yrtph.2014.04.011. [DOI] [PubMed] [Google Scholar]
- Bednarik V.; Vondruska M.; Pruckova Z.; Koutny M. Disposal of Waste Liquor from 2,5-Dichlorodisulfanilic Acid Production. Environ. Technol. 2007, 28 (11), 1237–1243. 10.1080/09593332808618882. [DOI] [PubMed] [Google Scholar]
- Rousis N. I.; Zuccato E.; Castiglioni S. Monitoring Population Exposure to Pesticides Based on Liquid Chromatography-Tandem Mass Spectrometry Measurement of Their Urinary Metabolites in Urban Wastewater: A Novel Biomonitoring Approach. Sci. Total Environ. 2016, 571, 1349–1357. 10.1016/j.scitotenv.2016.07.036. [DOI] [PubMed] [Google Scholar]
- Vidya Lakshmi C.; Kumar M.; Khanna S. Biodegradation of Chlorpyrifos in Soil by Enriched Cultures. Curr. Microbiol. 2009, 58 (1), 35–38. 10.1007/s00284-008-9262-1. [DOI] [PubMed] [Google Scholar]
- Rousis N. I.; Gracia-Lor E.; Zuccato E.; Bade R.; Baz-Lomba J. A.; Castrignanò E.; Causanilles A.; Covaci A.; de Voogt P.; Hernàndez F.; et al. Wastewater-Based Epidemiology to Assess Pan-European Pesticide Exposure. Water Res. 2017, 121, 270–279. 10.1016/j.watres.2017.05.044. [DOI] [PubMed] [Google Scholar]
- Moschet C.; Vermeirssen E. L. M.; Singer H.; Stamm C.; Hollender J. Evaluation of In-Situ Calibration of Chemcatcher Passive Samplers for 322 Micropollutants in Agricultural and Urban Affected Rivers. Water Res. 2015, 71, 306–317. 10.1016/j.watres.2014.12.043. [DOI] [PubMed] [Google Scholar]
- Wang S.; Miltner A.; Kästner M.; Schäffer A.; Nowak K. M. Transformation of Metamitron in Water-Sediment Systems: Detailed Insight into the Biodegradation Processes. Sci. Total Environ. 2017, 578, 100–108. 10.1016/j.scitotenv.2016.10.125. [DOI] [PubMed] [Google Scholar]
- Commission of the European Union . Case No COMP/M.2547 - Bayer/Aventis Crop Science. REGULATION (EEC) No 4064/89 MERGER PROCEDURE; Official Journal of the European Union 2002, Article 8.
- German Federal Office of Consumer Protection and Food Safety . PSM-Zulassungsbericht Goltix Gold https://www.bvl.bund.de/SharedDocs/Downloads/04_Pflanzenschutzmittel/01_zulassungsberichte/006470-00-05.pdf?__blob=publicationFile&v=2 (accessed May 10, 2019).
- Hamann E.; Stuyfzand P. J.; Greskowiak J.; Timmer H.; Massmann G. The Fate of Organic Micropollutants during Long-Term/Long-Distance River Bank Filtration. Sci. Total Environ. 2016, 545–546, 629–640. 10.1016/j.scitotenv.2015.12.057. [DOI] [PubMed] [Google Scholar]
- Knepper T. P.; Karrenbrock F.. Pollutants as Byproducts and Degradation Products of Chemical Syntheses BT - The Rhine, Knepper T. P., Ed.; Springer Berlin Heidelberg: Berlin, Heidelberg, 2006; pp 235–254. [Google Scholar]
- Zonja B.; Pérez S.; Barceló D. Human Metabolite Lamotrigine-N2-Glucuronide Is the Principal Source of Lamotrigine-Derived Compounds in Wastewater Treatment Plants and Surface Water. Environ. Sci. Technol. 2016, 50 (1), 154–164. 10.1021/acs.est.5b03691. [DOI] [PubMed] [Google Scholar]
- Hartkamp-Commandeur L. C. M.; Gerritse J.; Govers H. A. J.; Parsons J. R. Reductive Dehalogenation of Polychlorinated Biphenyls by Anaerobic Microorganisms Enriched from Dutch Sediments. Chemosphere 1996, 32 (7), 1275–1286. 10.1016/0045-6535(96)00039-2. [DOI] [Google Scholar]
- Paz A.; Tadmor G.; Malchi T.; Blotevogel J.; Borch T.; Polubesova T.; Chefetz B. Fate of Carbamazepine, Its Metabolites, and Lamotrigine in Soils Irrigated with Reclaimed Wastewater: Sorption, Leaching and Plant Uptake. Chemosphere 2016, 160, 22–29. 10.1016/j.chemosphere.2016.06.048. [DOI] [PubMed] [Google Scholar]
- Sabik H.; Jeannot R.; Rondeau B. Multiresidue Methods Using Solid-Phase Extraction Techniques for Monitoring Priority Pesticides, Including Triazines and Degradation Products, in Ground and Surface Waters. J. Chromatogr. A 2000, 885 (1), 217–236. 10.1016/S0021-9673(99)01084-5. [DOI] [PubMed] [Google Scholar]
- Guo J.; Li Z.; Ranasinghe P.; Bonina S.; Hosseini S.; Corcoran M. B.; Smalley C.; Kaliappan R.; Wu Y.; Chen D.; et al. Occurrence of Atrazine and Related Compounds in Sediments of Upper Great Lakes. Environ. Sci. Technol. 2016, 50 (14), 7335–7343. 10.1021/acs.est.6b00706. [DOI] [PubMed] [Google Scholar]
- Mohn W. W.; Tiedje J. M. Microbial Reductive Dehalogenation. Microbiol. Mol. Biol. Rev. 1992, 56 (3), 482–507. [DOI] [PMC free article] [PubMed] [Google Scholar]
Associated Data
This section collects any data citations, data availability statements, or supplementary materials included in this article.