

Abstract
Background:
As the use of continuous glucose monitoring (CGM) increases, there is a need to better understand key metrics of time in range 70-180 mg/dL (TIR70-180) and hyperglycemia and how they relate to hemoglobin A1c (A1C).
Methods:
Analyses were conducted utilizing datasets from four randomized trials encompassing 545 adults with type 1 diabetes (T1D) who had central-laboratory measurements of A1C. CGM metrics were calculated and compared with each other and A1C cross-sectionally and longitudinally.
Results:
Correlations among CGM metrics (TIR70-180, time >180 mg/dL, time >250 mg/dL, mean glucose, area under the curve above 180 mg/dL, high blood glucose index, and time in range 70-140 mg/dL) were typically 0.90 or greater. Correlations of each metric with A1C were lower (absolute values 0.66-0.71 at baseline and 0.73-0.78 at month 6). For a given TIR70-180 percentage, there was a wide range of possible A1C levels that could be associated with that TIR70-180 level. On average, a TIR70-180 of 70% and 50% corresponded with an A1C of approximately 7% and 8%, respectively. There also was considerable spread of change in A1C for a given change in TIR70-180, and vice versa. An increase in TIR70-180 of 10% (2.4 hours per day) corresponded to a decrease in A1C of 0.6%, on average.
Conclusions:
In T1D, CGM measures reflecting hyperglycemia (including TIR and mean glucose) are highly correlated with each other but only moderately correlated with A1C. For a given TIR or change in TIR there is a wide range of possible corresponding A1C values.
Keywords: type 1 diabetes, continuous glucose monitoring, glucose time in range
In recent years, advances in continuous glucose monitoring (CGM) technology have led to a substantial increase in CGM use. At the same time, limitations of hemoglobin A1c (A1C), which has been the gold standard for assessing both individual, group, and population glycemic control, have received increasing attention.1 Numerous studies have shown that there are a wide range of possible mean glucose levels for a given A1C level,1-5 meaning that for some patients, A1C may not be a reliable indicator of glucose control. In addition, A1C primarily reflects hyperglycemia and does not provide information about hypoglycemia, glycemic variability, or the daily pattern of glucose concentrations.
As CGM use continues to increase, there is the need to better understand CGM metrics and patterns, and their key role in diabetes management. Recently, several organizations have published consensus statements on specific CGM metrics to use for assessing hyperglycemia, hypoglycemia, and glycemic variability.6,7 Time >180 mg/dL (T>180) and time >250 mg/dL (T>250) are the two consensus hyperglycemia metrics. Other common metrics which are highly correlated with hyperglycemia and thus largely measures of hyperglycemia are time in range of 70-180 mg/dL (TIR70-180) and mean glucose concentration. In this article, we evaluate multiple aspects of these common CGM-measured hyperglycemia metrics and their relationship to A1C to facilitate the effective use of CGM to optimize diabetes management.
Methods
Analyses were conducted utilizing datasets from 4 randomized trials that included participants ≥18 years old with type 1 diabetes. Each study assessed CGM as an intervention over a 6-month period and had central-laboratory measurements of A1C at baseline and 6 months. One clinical trial (Juvenile Diabetes Research Foundation Continuous Glucose Monitoring Randomized Clinical Trial [JDRF CGM RCT]) included the 3 commercially available CGM systems at the time of the study (Dexcom™ SEVEN® Dexcom, Inc, San Diego, CA; MiniMed Paradigm® REAL-Time Insulin Pump and Continuous Glucose Monitoring System, Medtronic MiniMed, Inc, Northridge, CA; FreeStyle Navigator™, Abbott Diabetes Care, Inc, Alameda, CA),8,9 while the other 3 (DIAMOND, REPLACE-BG, and HypoDE) utilized a Dexcom G4 sensor with 505 software.10-12 Participants included in the analyses were in a treatment arm using CGM as an intervention and had a minimum of 336 hours (14 days) of CGM values in month 6. For analyses reporting baseline data or assessing change from baseline, a minimum of 240 hours (10 days) of masked baseline CGM data were required. Table 1 provides details of the 4 studies.
Table 1.
Descriptions of the Four Studies.
| JDRF CGM RCTa | DIAMOND (T1D) | REPLACE-BG | HypoDE | |
|---|---|---|---|---|
| Time period of study | February 2007-June 2009 | October 2014-May 2016 | May 2015-September 2016 | March 2016-July 2017 |
| CGM(s) | Dexcom Seven, MiniMed Paradigm, Abbott Freestyle Navigator | Dexcom G4 with software 505 | Dexcom G4 with software 505 | Dexcom G5 |
| Method for A1C measurement | A1C measured with NGSP-certified method (Tosoh A1c 2.2 Plus Glycohemoglobin Analyzer), performed at University of Minnesota | A1C measured with NGSP-certified method (G8 Tosoh Biosciences), performed at Northwest Lipid Research Laboratories, University of Washington, Seattle | A1C measured with NGSP-certified method (G8 Tosoh Biosciences), performed at Northwest Lipid Research Laboratories, University of Washington, Seattle | A1C measured with NGSP-certified method (G8 Tosoh Biosciences), performed at MLM Medical Labs, Moenchengladbach, Germany |
| A1C eligibility range | ≤10.0% | 7.5%-9.9% | ≤9.0% | ≤9.0% |
| Insulin delivery | Pump and MDI users (predominately pump) | 100% MDI | 100% pump users | 100% MDI |
| Number of participants included in the analyses | 93 | 99 | 212 | 141 |
| Age (years) | ||||
| Mean ± SD | 38 ± 13 | 46 ± 14 | 45 ± 14 | 46 ± 11 |
| [Range] | [18 to 73] | [26 to 72] | [20 to 78] | [20 to 69] |
| Female % | 52 (56%) | 43 (43%) | 107 (50%) | 56 (40%) |
| White race % | 90 (97%) | 86 (88%) | 195 (92%) | n/a |
| Diabetes duration (years) | ||||
| Median (IQR) | 20 (14-31) | 19 (9-31) | 23 (15-32) | 21 (9-31) |
| [Range] | [2 to 63] | [2 to 57] | [2 to 64] | [2 to 54] |
| A1C (%)—baseline | ||||
| Mean ± SD | 7.2 ± 0.8 | 8.6 ± 0.7 | 7.1 ± 0.6 | 7.5 ± 1.0 |
| [Range] | [4.7 to 9.2] | [7.5 to 9.9] | [5.2 to 8.7] | [4.9 to 10.0] |
| A1C (%)—6 months | ||||
| Mean ± SD | 6.8 ± 0.6 | 7.6 ± 0.8 | 7.0 ± 0.7 | 7.3 ± 0.9 |
| [Range] | [5.0 to 8.9] | [6.0 to 10.1] | [5.2 to 8.8] | [5.3 to 9.7] |
| A1C—change from baseline (%) | ||||
| Mean ± SD | −0.4 ± 0.5 | −1.0 ± 0.8 | 0.0 ± 0.5 | −0.2 ± 0.5 |
| [Range] | [−2.0 to +0.9] | [−3.0 to +0.7] | [−1.4 to +1.4] | [−1.8 to +1.5] |
Includes both the A1C ≥7.0% and A1C <7.0% cohorts.
Statistical Methods
The main CGM metrics included in the analyses were TIR70-180, T>180, T>250, and mean glucose. In addition, the following CGM metrics also were tabulated and included in some analyses: area under the curve above 180 mg/dL (AUC>180), high blood glucose index (HBGI, which provides an increasing influence to values based on the extent of hyperglycemia),13 time < 70 mg/dL (T<70), time <54 mg/dL (T<54), and time in range 70-140 mg/dL (TIR70-140).
Mean ± SD or median (interquartile range [IQR]) are reported as appropriate for the distribution of data. Spearman partial correlations were calculated, adjusting for study, among A1C and CGM metrics at baseline, at month 6, and change from baseline to month 6. Least squares regression models were used to assess the relationships between A1C and TIR70-180, TIR70-140, and T>180 at baseline and at month 6, and to assess the relationship between change in A1C and change in these metrics from baseline to month 6. Analyses also were conducted to assess the relationship between changes in above metrics according to baseline A1C levels.
Analyses were repeated using data from only the 3 studies using the Dexcom G4 (with 505 software) sensor with similar results (results not shown). Analyses also were replicated by creating a dataset in which every third glucose value was retained to mirror a sensor with glucose measurements every 15 minutes; the results were virtually identical (results not shown).
Results
The cross-sectional analyses at 6 months included data from 545 study participants. Mean age was 44 ± 13 years (range 18 to 78 years), 47% were female, and 92% were white. Median diabetes duration was 21 years (IQR 12 to 31, range 2 to 64 years). Mean A1C was 7.5 ± 1.0% (range 4.7% to 10.0%) at baseline and 7.2 ± 0.8% (range 5.0% to 10.1%) at 6 months. Participant characteristics in each of the 4 studies are provided in Table 1. The distributions of their CGM metrics at baseline and month 6 are shown in Table 2.
Table 2.
CGM Metrics at Baseline and 6 Months According to Study.
| All | JDRF | Diamond T1D | Replace-BG | HypoDE | |
|---|---|---|---|---|---|
| Na | 545 | 93 | 99 | 212 | 141 |
| CGM at baseline | |||||
| N | 455 | 4 | 98 | 212 | 141 |
| Amount of CGM data (hours) | |||||
| Mean ± SD | 558 ± 141 | 306 ± 45 | 324 ± 48 | 614 ± 76 | 642 ± 43 |
| Median (IQR) | 633 (473-651) | 290 (274-337) | 315 (305-320) | 641 (620-651) | 642 (615-661) |
| [Range] | [248-795] | [273 to 370] | [248 to 477] | [270 to 684] | [546 to 795] |
| TIR70-180 (%) | |||||
| Mean ± SD | 58 ± 15 | 56 ± 20 | 46 ± 12 | 64 ± 13 | 59 ± 14 |
| Median (IQR) | 58 (48-68) | 61 (40-72) | 47 (37-54) | 64 (55-72) | 58 (48-67) |
| [Range] | [13 to 97] | [30 to 74] | [13 to 80] | [16 to 97] | [23 to 97] |
| TIR70-140 (%) | |||||
| Mean ± SD | 37 ± 13 | 33 ± 15 | 28 ± 10 | 40 ± 13 | 38 ± 14 |
| Median (IQR) | 36 (28-44) | 36 (21-45) | 28 (22-34) | 39 (31-47) | 37 (29-46) |
| Range | [2 to 94] | [13 to 47] | [5 to 57] | [2 to 94] | [7 to 94] |
| T>180 (%) | |||||
| Mean ± SD | 37 ± 16 | 43 ± 21 | 49 ± 14 | 33 ± 13 | 34 ± 17 |
| Median (IQR) | 36 (26, 48) | 38 (26, 59) | 48 (38, 56) | 32 (24, 42) | 34 (22, 46) |
| [Range] | [0 to 85] | [26 to 69] | [12 to 85] | [1 to 84] | [0 to 76] |
| T>250 (%) | |||||
| Mean ± SD | 13 ± 10 | 14 ± 12 | 22 ± 11 | 9 ± 7 | 12 ± 9 |
| Median (IQR) | 10 (5, 18) | 11 (5, 24) | 21 (13, 28) | 7 (4, 13) | 8 (5, 17) |
| [Range] | [0 to 51] | [4 to 31] | [3 to 51] | [0 to 33] | [0 to 40] |
| Mean glucose (mg/dL) | |||||
| Mean ± SD | 166 ± 27 | 177 ± 30 | 186 ± 26 | 160 ± 21 | 160 ± 28 |
| Median (IQR) | 164 (148, 182) | 172 (153, 201) | 182 (165, 201) | 159 (148, 174) | 156 (141, 181) |
| [Range] | [89 to 250] | [149 to 216] | [121 to 250] | [99 to 223] | [89 to 240] |
| AUC>180 mg/dL | |||||
| Mean ± SD | 23 ± 15 | 26 ± 18 | 37 ± 17 | 18 ± 11 | 21 ± 15 |
| Median (IQR) | 19 (12-31) | 22 (12-39) | 34 (24-46) | 16 (10-24) | 17 (10-29) |
| [Range] | [0 to 84] | [10 to 48] | [6 to 84] | [0 to 55] | [0 to 67] |
| HBGI | |||||
| Mean ± SD | 8.7 ± 4.4 | 9.9 ± 5.1 | 12.5 ± 4.6 | 7.4 ± 3.3 | 8.1 ± 4.3 |
| Median (IQR) | 8.1 (5.7, 11.4) | 8.9 (5.8, 13.9) | 11.9 (9.2, 14.8) | 6.9 (5.1, 9.6) | 7.4 (4.8, 10.9) |
| [Range] | [0.2 to 24.1] | [5.3 to 16.5] | [3.4 to 24.1] | [0.4 to 17.6] | [0.2 to 21.2] |
| T<70 (%) | |||||
| Mean ± SD | 5.0 ± 4.5 | 1.1 ± 1.0 | 5.4 ± 4.0 | 3.5 ± 2.5 | 7.2 ± 6.0 |
| Median (IQR) | 3.7 (2.1-6.6) | 0.7 (0.5-1.6) | 4.4 (2.3-7.4) | 3.0 (1.7-4.6) | 5.7 (2.9-9.8) |
| Range | [0.0 to 34.7] | [0.2 to 2.5] | [0.0 to 20.1] | [0.0 to 13.1] | [0.0 to 34.7] |
| T<54 (%) | |||||
| Mean ± SD | 1.7 ± 2.3 | 0.2 ± 0.2 | 2.1 ± 2.2 | 0.8 ± 0.8 | 2.8 ± 3.2 |
| Median (IQR) | 0.8 (0.4, 2.3) | 0.2 (0.0, 0.3) | 1.2 (0.6, 3.0) | 0.6 (0.2, 1.0) | 1.9 (0.7, 3.7) |
| Range | [0.0 to 18.1] | [0.0 to 0.4] | [0.0 to 9.3] | [0.0 to 5.2] | [0.0 to 18.1] |
| CGM in Month 6 | |||||
| N | 545 | 93 | 99 | 212 | 141 |
| Amount of CGM data (hours) | |||||
| Mean ± SD | 607 ± 73 | 510 ± 81 | 607 ± 65 | 620 ± 50 | 652 ± 36 |
| Median (IQR) | 635 (589, 653) | 526 (454, 576) | 634 (579, 649) | 637 (612, 651) | 657 (639, 671) |
| [Range] | [340 to 803] | [340 to 653] | [345 to 661] | [371 to 663] | [508 to 803] |
| TIR70-180 (%) | |||||
| Mean ± SD | 61 ± 15 | 70 ± 13 | 51 ± 14 | 64 ± 13 | 58 ± 15 |
| Median (IQR) | 62 (51, 72) | 71 (64, 80) | 52 (41, 59) | 64 (56, 73) | 58 (47, 68) |
| [Range] | [11 to 99] | [29 to 94] | [11 to 87] | [19 to 97] | [19 to 99] |
| TIR70-140 (%) | |||||
| Mean ± SD | 39 ± 14 | 47 ± 13 | 30 ± 11 | 41 ± 13 | 36 ± 15 |
| Median (IQR) | 38 (29-47) | 47 (40-54) | 31 (22-38) | 39 (32-49) | 35 (26-44) |
| Range | [4 to 96] | [15 to 86] | [5 to 72] | [4 to 96] | [5 to 88] |
| T>180 (%) | |||||
| Mean ± SD | 35 ± 16 | 25 ± 13 | 46 ± 15 | 32 ± 14 | 37 ± 17 |
| Median (IQR) | 34 (23, 45) | 24 (16, 33) | 44 (35, 56) | 32 (22, 42) | 36 (26, 51) |
| [Range] | [0 to 89] | [1 to 69] | [3 to 89] | [0 to 81] | [1 to 81] |
| T>250 (%) | |||||
| Mean ± SD | 11 ± 10 | 6 ± 6 | 18 ± 12 | 9 ± 7 | 12 ± 10 |
| Median (IQR) | 8 (4, 16) | 4 (2, 7) | 17 (9, 24) | 7 (4, 13) | 10 (4, 17) |
| [Range] | [0 to 68] | [0 to 33] | [0 to 68] | [0 to 33] | [0 to 48] |
| Mean glucose (mg/dL) | |||||
| Mean ± SD | 163 ± 27 | 148 ± 21 | 181 ± 28 | 158 ± 22 | 166 ± 29 |
| Median (IQR) | 160 (144, 179) | 145 (137, 156) | 177 (163, 197) | 158 (143, 174) | 163 (147, 187) |
| [Range] | [93 to 278] | [109 to 218] | [111 to 278] | [93 to 219] | [101 to 255] |
| AUC>180 (mg/dL) | |||||
| Mean ± SD | 20 ± 15 | 12 ± 10 | 31 ± 18 | 17 ± 11 | 22 ± 16 |
| Median (IQR) | 17 (9, 28) | 10 (6, 14) | 29 (18, 40) | 15 (9, 23) | 19 (11, 29) |
| [Range] | [0 to 102] | [0 to 52] | [1 to 102] | [0 to 51] | [0 to 82] |
| HBGI | |||||
| Mean ± SD | 8.0 ± 4.4 | 5.7 ± 3.1 | 11.3 ± 5.0 | 7.2 ± 3.3 | 8.7 ± 4.6 |
| Median (IQR) | 7.3 (4.9, 10.4) | 5.0 (3.7, 6.8) | 10.7 (7.5, 13.9) | 7.0 (4.7, 9.2) | 8.1 (5.4, 11.3) |
| [Range] | [0.1 to 29.6] | [0.7 to 17.3] | [1.1 to 29.6] | [0.1 to 17.0] | [0.7 to 24.7] |
| T<70 (%) | |||||
| Mean ± SD | 4.2 ± 3.9 | 4.2 ± 3.6 | 3.7 ± 3.2 | 3.9 ± 3.2 | 5.0 ± 5.1 |
| Median (IQR) | 3.1 (1.5, 5.7) | 3.3 (1.8, 5.7) | 2.7 (1.6, 4.7) | 3.1 (1.6, 5.5) | 3.4 (1.1, 6.5) |
| Range | [0.0 to 21.6] | [0.2 to 20.6] | [0.1 to 16.7] | [0.0 to 17.0] | [0.0 to 21.6] |
| T<54 (%) | |||||
| Mean ± SD | 1.2 ± 1.8 | 1.0 ± 1.6 | 1.1 ± 1.6 | 1.0 ± 1.1 | 1.9 ± 2.7 |
| Median (IQR) | 0.6 (0.2, 1.5) | 0.4 (0.1, 1.3) | 0.5 (0.2, 1.3) | 0.6 (0.2, 1.3) | 0.7 (0.1, 2.3) |
| Range | [0.0 to 12.3] | [0.0 to 11.3] | [0.0 to 10.2] | [0.0 to 7.1] | [0.0 to 12.3] |
Total number of participants included in analyses (with nonmissing CGM data at month 6).
As can be seen in Table 3 and Figures S1, and S2, correlations among the CGM metrics were typically 0.9 or higher at baseline and 6 months. All 7 CGM metrics had a lower correlation with A1C than with each other (absolute value 0.66-0.71 at baseline and 0.73-0.78 at month 6). Despite the moderate correlation between TIR70-180 and A1C (−0.67 at baseline and −0.73 at month 6), for a given TIR70-180 level, there was a wide range of possible A1C levels that could be associated with that TIR70-180 (Figure 1 for month 6 and Figure S3 for baseline). Likewise there was a wide range of possible TIR70-180 levels associated with a given A1C level (Figure S4). This is evident in the 95% confidence limits for a predicted A1C for a specified TIR70-180 (Table 4a) and the confidence limits for TIR70-180 for a specified A1C (Table 4b). Note that the equation to predict TIR from A1C is not simply a rearrangement of the equation for predicting A1C from TIR. A similar degree of dispersion was seen for mean glucose, T>180, T>250, and TIR70-140 versus A1C (Figures 1, S3, and S5).
Table 3.
Spearman Partial Correlation Among A1C and Selected CGM Metrics.a
| TIR70-180 | TIR70-140 | T>180 | T>250 | Mean glucose | AUC>180 | HBGI | A1C | |
|---|---|---|---|---|---|---|---|---|
| Baseline data | ||||||||
| TIR70-180 | +1.00 | +0.94 | −0.96 | −0.94 | −0.92 | −0.96 | −0.96 | −0.67 |
| TIR70-140 | +0.94 | +1.00 | −0.97 | −0.86 | −0.95 | −0.90 | −0.94 | −0.69 |
| T>180 | −0.96 | −0.97 | +1.00 | +0.92 | +0.98 | +0.95 | +0.98 | +0.70 |
| T>250 | −0.94 | −0.86 | +0.92 | +1.00 | +0.92 | +0.99 | +0.97 | +0.66 |
| Mean glucose | −0.92 | −0.95 | +0.98 | +0.92 | +1.00 | +0.95 | +0.98 | +0.71 |
| AUC>180 | −0.96 | −0.90 | +0.95 | +0.99 | +0.95 | +1.00 | +0.99 | +0.69 |
| HBGI | −0.96 | −0.94 | +0.98 | +0.97 | +0.98 | +0.99 | +1.00 | +0.71 |
| A1C | −0.67 | −0.69 | +0.70 | +0.66 | +0.71 | +0.69 | +0.71 | +1.00 |
| Month 6 data | ||||||||
| TIR70-180 | +1.00 | +0.95 | −0.96 | −0.95 | −0.92 | −0.96 | −0.96 | −0.73 |
| TIR70-140 | +0.95 | +1.00 | −0.97 | −0.88 | −0.96 | −0.92 | −0.95 | −0.75 |
| T>180 | −0.96 | −0.97 | +1.00 | +0.93 | +0.98 | +0.96 | +0.98 | +0.77 |
| T>250 | −0.95 | −0.88 | +0.93 | +1.00 | +0.92 | +0.99 | +0.97 | +0.73 |
| Mean glucose | −0.92 | −0.96 | +0.98 | +0.92 | +1.00 | +0.95 | +0.98 | +0.78 |
| AUC>180 | −0.96 | −0.92 | +0.96 | +0.99 | +0.95 | +1.00 | +0.99 | +0.75 |
| HBGI | −0.96 | −0.95 | +0.98 | +0.97 | +0.98 | +0.99 | +1.00 | +0.77 |
| A1C | −0.73 | −0.75 | +0.77 | +0.73 | +0.78 | +0.75 | +0.77 | +1.00 |
| Change from baseline to month 6 | ||||||||
| TIR70-180 | +1.00 | −0.90 | −0.94 | −0.80 | −0.85 | −0.85 | −0.88 | −0.47 |
| TIR70-140 | +0.90 | +1.00 | −0.91 | −0.70 | −0.87 | −0.76 | −0.84 | −0.49 |
| T>180 | −0.94 | −0.91 | +1.00 | +0.82 | +0.95 | +0.88 | +0.94 | +0.51 |
| T>250 | −0.80 | −0.70 | +0.82 | +1.00 | +0.88 | +0.97 | +0.95 | +0.45 |
| Mean glucose | −0.85 | −0.87 | +0.95 | +0.88 | +1.00 | +0.93 | +0.97 | +0.52 |
| AUC>180 | −0.85 | −0.76 | +0.88 | +0.97 | +0.93 | +1.00 | +0.99 | +0.48 |
| HBGI | −0.88 | −0.84 | +0.94 | +0.95 | +0.97 | +0.99 | +1.00 | +0.50 |
| A1C | −0.47 | −0.49 | +0.51 | +0.45 | +0.52 | +0.48 | +0.50 | +1.00 |
The Spearman partial correlation is adjusted for studies.
Figure 1.

Scatter plots for selected CGM Metrics with A1C at month 6 (RMS = root mean square error) The Intercept, slope and RMS are not shown for A1C (%) vs T>250 (%) in view of apparent nonlinearity of this relationship.
Table 4.
Relationship of TIR and T > 180 to A1C.a
| A. Estimation of A1C for a given TIR Level of CGM metric | ||||||
|---|---|---|---|---|---|---|
| Baseline (N = 455) | Month 6 (N = 545) | |||||
| Estimate | 95% CI for the predicted valueb | 95% CI for the meanb | Estimate | 95% CI for the predicted valueb | 95% CI for the meanb | |
| Estimated A1C (%) | ||||||
| TIR70-180 | ||||||
| 20% | 9.4 | (8.0, 10.7) | (9.2, 9.5) | 8.8 | (7.9, 9.8) | (8.7, 9.0) |
| 30% | 8.9 | (7.6, 10.2) | (8.7, 9.0) | 8.4 | (7.5, 9.4) | (8.3, 8.5) |
| 40% | 8.4 | (7.1, 9.7) | (8.3, 8.5) | 8.0 | (7.1, 9.0) | (8.0, 8.1) |
| 50% | 7.9 | (6.6, 9.2) | (7.9, 8.0) | 7.6 | (6.7, 8.6) | (7.6, 7.7) |
| 60% | 7.4 | (6.1, 8.8) | (7.4, 7.5) | 7.2 | (6.3, 8.2) | (7.2, 7.3) |
| 70% | 7.0 | (5.6, 8.3) | (6.9, 7.0) | 6.8 | (5.8, 7.8) | (6.8, 6.9) |
| 80% | 6.5 | (5.2, 7.8) | (6.4, 6.6) | 6.4 | (5.4, 7.4) | (6.3, 6.5) |
| 90% | 6.0 | (4.7, 7.3) | (5.9, 6.2) | 6.0 | (5.0, 7.0) | (5.9, 6.1) |
| Equation | A1C = 10.31 – 0.048×TIR70-180 | A1C = 9.65 – 0.041×TIR70-180 | ||||
| RMSc | 0.67 | 0.49 | ||||
| TIR70-140 | ||||||
| 20% | 8.4 | (7.0, 9.8) | (8.3, 8.5) | 8.0 | (7.0, 9.0) | (7.9, 8.0) |
| 30% | 7.9 | (6.5, 9.2) | (7.8, 7.9) | 7.5 | (6.6, 8.5) | (7.5, 7.6) |
| 40% | 7.4 | (6.0, 8.7) | (7.3, 7.4) | 7.1 | (6.1, 8.1) | (7.1, 7.2) |
| 50% | 6.8 | (5.5, 8.2) | (6.7, 6.9) | 6.7 | (5.7, 7.7) | (6.6, 6.7) |
| 60% | 6.3 | (5.0, 7.7) | (6.2, 6.4) | 6.3 | (5.3, 7.2) | (6.2, 6.3) |
| 70% | 5.8 | (4.4, 7.2) | (5.6, 6.0) | 5.8 | (4.9, 6.8) | (5.7, 5.9) |
| 80% | 5.3 | (3.9, 6.7) | (5.1, 5.5) | 5.4 | (4.4, 6.4) | (5.3, 5.5) |
| 90% | 4.8 | (3.4, 6.1) | (4.5, 5.0) | 5.0 | (4.0, 6.0) | (4.8, 5.1) |
| Equation | A1C = 9.43 – 0.052×TIR70-140 | A1C = 8.83 – 0.043×TIR70-140 | ||||
| RMSc | 0.69 | 0.50 | ||||
| T>180 | ||||||
| 80% | 9.5 | (8.1, 10.8) | (9.3, 9.6) | 8.9 | (8.0, 9.9) | (8.8, 9.1) |
| 70% | 9.0 | (7.7, 10.3) | (8.9, 9.2) | 8.6 | (7.6, 9.5) | (8.5, 8.6) |
| 60% | 8.6 | (7.3, 9.9) | (8.5, 8.7) | 8.2 | (7.2, 9.1) | (8.1, 8.2) |
| 50% | 8.1 | (6.8, 9.4) | (8.0, 8.2) | 7.8 | (6.9, 8.7) | (7.7, 7.8) |
| 40% | 7.7 | (6.4, 9.0) | (7.6, 7.7) | 7.4 | (6.5, 8.3) | (7.3, 7.4) |
| 30% | 7.2 | (5.9, 8.5) | (7.2, 7.3) | 7.0 | (6.1, 7.9) | (7.0, 7.0) |
| 20% | 6.8 | (5.5, 8.1) | (6.7, 6.9) | 6.6 | (5.7, 7.5) | (6.6, 6.7) |
| 10% | 6.3 | (5.0, 7.6) | (6.2, 6.5) | 6.2 | (5.3, 7.1) | (6.1, 6.3) |
| Equation | A1C = 5.88 – 0.045×T>180 | A1C = 5.83 – 0.039×T>180 | ||||
| RMSc | 0.67 | 0.46 | ||||
| B. Estimation of TIR70-180, TIR70-140, and T>180 for given A1C | ||||||
| Baseline (N = 455) | Month 6 (N = 545) | |||||
| A1C | Estimate | 95% CI for the predicted value | 95% CI for the mean | Estimate | 95% CI for the predicted value | 95% CI for the mean |
| Estimated TIR70-180 (%) | ||||||
| 6.0% | 75 | (55, 95) | (73, 77) | 79 | (60, 97) | (77, 80) |
| 6.5% | 70 | (50, 90) | (68, 71) | 71 | (53, 90) | (70, 72) |
| 7.0% | 64 | (44, 84) | (63, 65) | 64 | (45, 82) | (63, 65) |
| 7.5% | 59 | (38, 79) | (58, 59) | 56 | (38, 75) | (55, 57) |
| 8.0% | 53 | (33, 73) | (52, 54) | 49 | (30, 67) | (48, 50) |
| 8.5% | 47 | (27, 68) | (46, 49) | 41 | (23, 60) | (40, 43) |
| 9.0% | 42 | (22, 62) | (40, 44) | 34 | (15, 53) | (32, 36) |
| Equation | TIR70-180 = 141 – 11.1×A1C | TIR70-180 = 168 – 14.9×A1C | ||||
| RMSc | 10.2 | 9.5 | ||||
| Estimated TIR70-140 (%) | ||||||
| 6.0% | 51 | (33, 70) | (50, 53) | 55 | (37, 73) | (54, 57) |
| 6.5% | 47 | (28, 65) | (45, 48) | 48 | (30, 66) | (47, 49) |
| 7.0% | 42 | (23, 60) | (41, 43) | 41 | (23, 59) | (40, 42) |
| 7.5% | 37 | (18, 55) | (36, 38) | 34 | (16, 52) | (33, 35) |
| 8.0% | 32 | (14, 51) | (31, 33) | 27 | (9, 45) | (26, 28) |
| 8.5% | 27 | (9, 46) | (26, 28) | 20 | (2, 38) | (19, 22) |
| 9.0% | 22 | (4, 41) | (21, 24) | 13 | (-5, 31) | (11, 15) |
| Equation | TIR70-140 = 109 – 9.6×A1C | TIR70-140 = 139 – 14.0×A1C | ||||
| RMSc | 9.4 | 9.0 | ||||
| Estimated T>180 (%) | ||||||
| 6.0% | 19 | (-3, 40) | (17, 20) | 15 | (-4, 34) | (14, 17) |
| 6.5% | 25 | (3, 46) | (23, 26) | 23 | (4, 42) | (22, 24) |
| 7.0% | 30 | (9, 52) | (29, 32) | 32 | (13, 51) | (31, 33) |
| 7.5% | 36 | (15, 58) | (35, 37) | 40 | (21, 59) | (39, 41) |
| 8.0% | 42 | (21, 64) | (41, 44) | 48 | (29, 67) | (47, 50) |
| 8.5% | 48 | (27, 70) | (47, 50) | 57 | (38, 76) | (55, 58) |
| 9.0% | 54 | (33, 76) | (53, 56) | 65 | (46, 84) | (63, 67) |
| Equation | T>180 = −53 + 11.9×A1C | T>180 = −85 + 16.7×A1C | ||||
| RMSc | 10.9 | 9.6 | ||||
Simple linear regression models were used to assess relationship between A1C and selected CGM metrics at baseline and month 6 separately.
The 95% CI for the mean represents the range within which the true mean is likely to be, whereas the 95% CI for the predictive value represents the range within which the true value for an individual’s value is likely to be.
RMS = root mean square error from the least squares regression model.
Correlations (absolute value) of change from baseline among CGM metrics ranged from 0.70 (TIR70-140 versus T>250) to 0.99 (AUC>180 versus HBGI) whereas correlations of change in CGM metrics versus change in A1C ranged from 0.47 to 0.52 (Table 3). Figure 2 and Table 5a show the change in A1C for a specified change in TIR70-180 from baseline to 6 months. As in the cross-sectional analysis, there was considerable spread of A1C change values for a specified TIR70-180 change value. Although, the slope for change in A1C versus change in TIR70-180 was not significantly influenced by baseline A1C level (P = .22 for interaction term), the magnitude of change in A1C was greater the higher the baseline A1C (Figure 2, Table 5a). Results were similar comparing change in T>180 and change in A1C (Figure 3, Table 5a). Change in TIR70-180 for a given change in A1C is shown in Table 5b, and change in A1C for a given change in TIR70-140 is shown in Figure S6.
Figure 2.
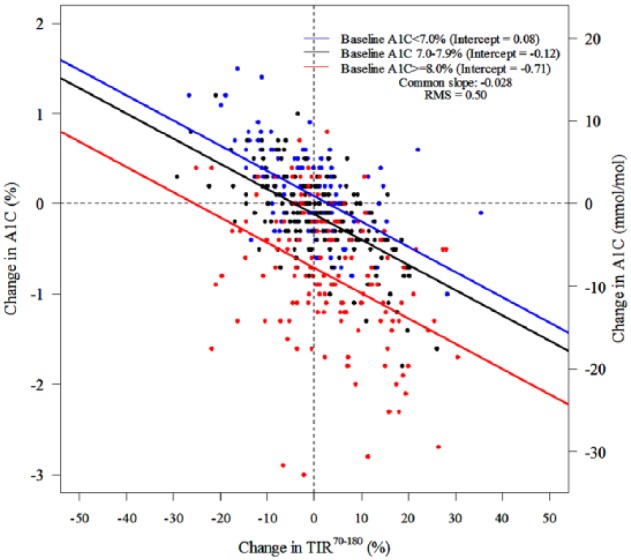
Scatter plots for change in TIR70-180 versus change in A1C (slopes were constrained to be identical for all three subgroups for A1C at baseline; RMS = root mean square error).
Table 5.
Relationship of Change in TIR and T > 180 to Change in A1C According to Baseline A1C Level.a
| Overall (N = 455) |
Baseline A1C <7.0% (n =
131) |
Baseline A1C 7.0-7.9% (n =
182) |
Baseline A1C ≥8.0% (n =
142) |
|||||
|---|---|---|---|---|---|---|---|---|
| Estimate | 95% CI for the predicted value | Estimate | 95% CI for the predicted value | Estimate | 95% CI for the predicted value | Estimate | 95% CI for the predicted value | |
| A. Estimation of change in A1C for a given level of CGM metrica | ||||||||
| Estimated Change in A1C from Baseline (%) | ||||||||
| Change in TIR70-180 | ||||||||
| −20% | +0.42 | (−0.76, +1.60) | +0.64 | (−0.35, +1.64) | +0.45 | (−0.55, +1.44) | −0.14 | (−1.14, +0.85) |
| −15% | +0.25 | (−0.92, +1.43) | +0.50 | (−0.49, +1.50) | +0.31 | (−0.69, +1.30) | −0.29 | (−1.28, +0.71) |
| −10% | +0.09 | (−1.08, +1.26) | +0.36 | (−0.63, +1.35) | +0.16 | (−0.83, +1.16) | −0.43 | (−1.42, +0.57) |
| −5% | −0.08 | (−1.25, +1.10) | +0.22 | (−0.77, +1.21) | +0.02 | (−0.97, +1.01) | −0.57 | (−1.56, +0.42) |
| 0% | −0.24 | (v1.41, +0.93) | +0.08 | (−0.91, +1.07) | −0.12 | (−1.11, +0.87) | −0.71 | (−1.70, +0.28) |
| +5% | −0.41 | (−1.58, +0.76) | −0.06 | (−1.06, +0.93) | −0.26 | (−1.25, +0.73) | −0.85 | (−1.84, +0.14) |
| +10% | −0.57 | (−1.74, +0.60) | −0.21 | (−1.20, +0.79) | −0.40 | (−1.39, +0.59) | −0.99 | (−1.99, −0.00) |
| +15% | −0.74 | (−1.91, +0.43) | −0.35 | (−1.34, +0.65) | −0.54 | (−1.54, +0.45) | −1.14 | (−2.13, −0.14) |
| +20% | −0.90 | (−2.08, +0.27) | −0.49 | (−1.49, +0.51) | −0.69 | (−1.68, +0.31) | −1.28 | (−2.27, −0.28) |
| Equation: ΔA1C = |
−0.24 – 0.033×ΔTIR70-180 | 0.08 – 0.028×ΔTIR70-180 | −0.12 – 0.028×ΔTIR70-180 | −0.71 – 0.028×ΔTIR70-180 | ||||
| RMSb | 0.59 | 0.50 | ||||||
| Change in TIR70-140 | ||||||||
| −20% | +0.40 | (−0.79, +1.59) | +0.64 | (−0.37, +1.64) | +0.45 | (−0.55, +1.45) | −0.16 | (−1.17, +0.84) |
| −15% | +0.23 | (−0.95, +1.42) | +0.49 | (−0.51, +1.49) | +0.31 | (−0.69, +1.31) | −0.31 | (−1.31, +0.69) |
| −10% | +0.07 | (−1.12, +1.25) | +0.35 | (−0.65, +1.34) | +0.16 | (−0.84, +1.16) | −0.45 | (−1.45, +0.55) |
| −5% | −0.10 | (−1.28, +1.08) | +0.20 | (−0.80, +1.20) | +0.02 | (−0.98, +1.01) | −0.60 | (−1.60, +0.40) |
| 0% | −0.27 | (−1.45, +0.92) | +0.06 | (−0.94, +1.05) | −0.13 | (−1.12, +0.87) | −0.74 | (−1.74, +0.25) |
| +5% | −0.43 | (−1.62, +0.75) | −0.09 | (−1.09, +0.91) | −0.27 | (−1.27, +0.72) | −0.89 | (−1.89, +0.11) |
| +10% | −0.60 | (−1.78, +0.59) | −0.23 | (−1.23, +0.76) | −0.42 | (−1.42, +0.58) | −1.03 | (−2.03, −0.04) |
| +15% | −0.77 | (−1.95, +0.42) | −0.38 | (−1.38, +0.62) | −0.56 | (−1.56, +0.44) | −1.18 | (−2.18, −0.18) |
| +20% | −0.93 | (−2.12, +0.26) | −0.53 | (−1.53, +0.48) | −0.71 | (−1.71, +0.29) | −1.32 | (−2.33, −0.32) |
| Equation: ΔA1C = |
−0.27 – 0.033×ΔTIR70-140 | 0.06 – 0.029×ΔTIR70-140 | −0.13 – 0.029×ΔTIR70-140 | −0.74 – 0.029×ΔTIR70-140 | ||||
| RMSb | 0.60 | 0.51 | ||||||
| Change in T>180 | ||||||||
| +20% | +0.32 | (−0.86, +1.50) | +0.58 | (−0.40, +1.56) | +0.39 | (−0.59, +1.37) | −0.23 | (−1.21, +0.76) |
| +15% | +0.17 | (−1.00, +1.35) | +0.45 | (−0.53, +1.43) | +0.26 | (−0.72, +1.24) | −0.36 | (−1.34, +0.63) |
| +10% | +0.03 | (−1.15, +1.20) | +0.32 | (−0.66, +1.30) | +0.13 | (−0.85, +1.11) | −0.49 | (−1.47, +0.49) |
| +5% | −0.12 | (−1.30, +1.05) | +0.19 | (−0.79, +1.17) | −0.00 | (−0.98, +0.98) | −0.62 | (−1.60, +0.36) |
| 0% | −0.27 | (−1.44, +0.90) | +0.06 | (−0.92, +1.04) | −0.13 | (−1.11, +0.85) | −0.75 | (−1.73, +0.23) |
| −5% | −0.42 | (−1.59, +0.76) | −0.07 | (−1.06, +0.91) | −0.26 | (−1.24, +0.72) | −0.88 | (−1.86, +0.10) |
| −10% | −0.56 | (−1.74, +0.61) | −0.21 | (−1.19, +0.78) | −0.39 | (−1.38, +0.59) | −1.01 | (−1.99, −0.03) |
| −15% | −0.71 | (−1.89, +0.46) | −0.34 | (−1.32, +0.65) | −0.53 | (−1.51, +0.46) | −1.14 | (−2.12, −0.16) |
| −20% | −0.86 | (−2.04, +0.32) | −0.47 | (−1.45, +0.52) | −0.66 | (−1.64, +0.33) | −1.27 | (−2.26, −0.29) |
| Equation: ΔA1C = |
−0.27 + 0.029×ΔT>180 | 0.06 + 0.026×ΔT>180 | −0.13 + 0.026×ΔT>180 | −0.75 + 0.026×ΔT>180 | ||||
| RMSb | 0.60 | 0.50 | ||||||
| B. Estimation of change in TIR70-180, TIR70-140, and T>180 for a given change in A1C | ||||||||
| Change in A1C | Estimated change in TIR70-180 from baseline (%) | |||||||
| −2.0% | +13.5 | (−3.9, +30.9) | +19.6 | (+3.2, +36.0) | +24.9 | (+9.5, +40.4) | +10.0 | (−10.6, +30.7) |
| −1.5% | +9.9 | (−7.4, +27.2) | +14.7 | (−1.2, +30.7) | +18.5 | (+3.3, +33.6) | +7.1 | (−13.4, +27.7) |
| −1.0% | +6.3 | (−11.0, +23.6) | +9.8 | (−5.8, +25.4) | +12.0 | (−2.9, +26.9) | +4.2 | (−16.2, +24.7) |
| −0.5% | +2.7 | (−14.6, +20.0) | +5.0 | (−10.4, +20.4) | +5.5 | (−9.3, +20.4) | +1.3 | (−19.2, +21.8) |
| 0% | −0.9 | (−18.2, +16.4) | +0.1 | (−15.2, +15.4) | −0.9 | (−15.7, +13.9) | −1.6 | (−22.1, +19.0) |
| +0.5% | −4.5 | (−21.8, +12.8) | −4.8 | (−20.1, +10.5) | −7.4 | (−22.3, +7.5) | −4.5 | (−25.2, +16.2) |
| +1.0% | −8.1 | (−25.5, +9.2) | −9.7 | (−25.2, +5.8) | −13.9 | (−28.9, +1.2) | −7.4 | (−28.2, +13.5) |
| Equation: ΔTIR70-180 = |
−0.92 – 7.21×ΔA1C | 0.09 − 9.75×ΔA1C | −0.93 – 12.93×ΔA1C | −1.56 – 5.80×ΔA1C | ||||
| RMSb | 8.8 | 7.7 | 7.5 | 10.3 | ||||
| Change in A1C | Estimated change in TIR70-140 from baseline (%) | |||||||
| −2.0% | +11.8 | (−5.0, +28.7) | +23.4 | (+6.4, +40.5) | +23.3 | (+7.4, +39.2) | +7.2 | (−10.1, +24.6) |
| −1.5% | +8.5 | (−8.3, +25.3) | +17.5 | (+0.9, +34.0) | +17.2 | (+1.6, +32.8) | +5.0 | (−12.2, +22.3) |
| −1.0% | +5.2 | (−11.6, +21.9) | +11.5 | (−4.7, +27.7) | +11.1 | (−4.4, +26.5) | +2.8 | (−14.4, +20.0) |
| −0.5% | +1.8 | (−14.9, +18.6) | +5.5 | (−10.4, +21.5) | +4.9 | (−10.4, +20.2) | +0.5 | (−16.7, +17.8) |
| 0% | −1.5 | (−18.2, +15.2) | −0.4 | (−16.3, +15.5) | −1.2 | (−16.5, +14.1) | −1.7 | (−19.0, +15.6) |
| +0.5% | −4.8 | (−21.6, +11.9) | −6.4 | (−22.3, +9.5) | −7.3 | (−22.7, +8.0) | −3.9 | (−21.3, +13.4) |
| +1.0% | −8.2 | (−24.9, +8.6) | −12.3 | (−28.4, +3.8) | −13.4 | (−28.9, +2.1) | −6.2 | (−23.7, +11.4) |
| Equation: ΔTIR70-140 = |
−1.50 – 6.66×ΔA1C | −0.42 – 11.9×ΔA1C | −1.19 – 12.2×ΔA1C | −1.70 – 4.47×ΔA1C | ||||
| RMSb | 8.5 | 8.0 | 7.7 | 8.7 | ||||
| Change in A1C | Estimated change in T>180 from baseline (%) | |||||||
| +1.0% | +10.0 | (−9.4, +29.4) | +14.4 | (−0.8, +29.7) | +15.6 | (−1.4, +32.5) | +9.4 | (−14.4, +33.1) |
| +0.5% | +6.0 | (−13.4, +25.3) | +7.4 | (−7.7, +22.5) | +8.6 | (−8.2, +25.3) | +6.3 | (−17.3, +29.8) |
| 0% | +2.0 | (−17.4, +21.3) | +0.3 | (−14.7, +15.4) | +1.5 | (−15.1, +18.2) | +3.1 | (−20.2, +26.5) |
| −0.5% | −2.0 | (−21.4, +17.3) | −6.7 | (−21.9, +8.4) | −5.5 | (−22.2, +11.2) | +0.0 | (−23.3, +23.3) |
| −1.0% | −6.0 | (−25.4, +13.3) | −13.8 | (−29.2, +1.6) | −12.5 | (−29.3, +4.3) | −3.1 | (−26.4, +20.2) |
| −1.5% | −10.0 | (−29.4, +9.4) | −20.8 | (−36.6, −5.1) | −19.5 | (−36.6, −2.4) | −6.2 | (−29.5, +17.2) |
| −2.0% | −14.0 | (−33.5, +5.4) | −27.9 | (−44.1, −11.7) | −26.5 | (−43.9, −9.1) | −9.3 | (−32.8, +14.2) |
| Equation: ΔT>180 = |
1.97 + 8.00×ΔA1C | 0.33 + 14.11×ΔA1C | 1.55 + 14.04×ΔA1C | 3.14 + 6.22×ΔA1C | ||||
| RMSb | 9.8 | 7.6 | 8.4 | 11.7 | ||||
Simple linear regression models were used to assess the relationship between change in A1C and change in selected CGM metrics for the entire cohort. For the subgroup analyses by baseline A1C, in part A, slopes were forced to be the same across subgroups since there were no significant interaction between baseline A1C and all 3 predictors; in part B, regression models were done separately in each subgroup since there were significant interactions between baseline A1C and change in A1C.
RMS = root mean square error from the least squares regression model.
Figure 3.
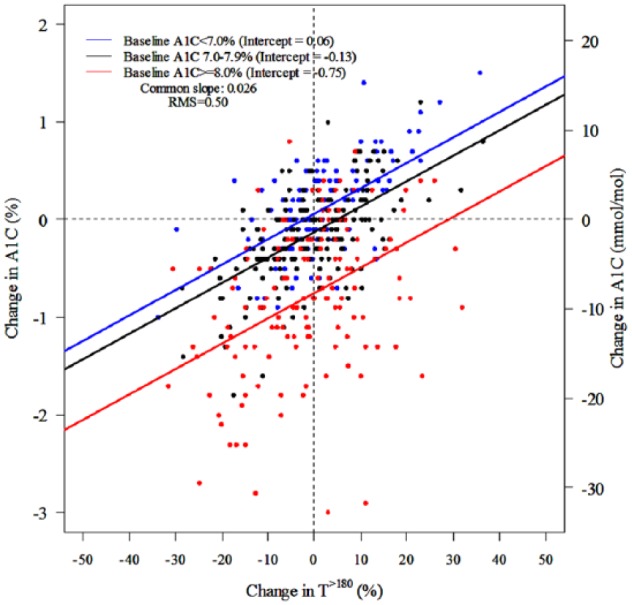
Scatter plots for change in T>180 versus change in A1C (slopes were constrained to be identical for all three subgroups for A1C at baseline; RMS = root mean square error).
Discussion
The analyses of this large type 1 diabetes CGM dataset confirm that CGM metrics that are measures of or largely reflect hyperglycemia, including TIR and mean glucose, are highly correlated with each other, suggesting that there may not be a meaningful statistical advantage to AUC>180 and HBGI over simpler percentage of time metrics, as noted by Rodbard.14
The correlation of the CGM metrics with A1C is only moderate. In relating TIR70-180 to A1C, results were slightly different for masked baseline data at the time of study entry versus the data during month 6, with estimated mean A1C tending to be slightly lower for a given TIR70-180 or T>180 at month 6 than at baseline . This might be reflecting a shift in the mean values due to use of CGM in diabetes management for 6 months and therefore also a shift in the regression lines; at baseline, most of the participants were not using CGM for diabetes management. For a specified TIR70-180, there was a wide range of possible A1C levels which is apparent when observing a graph of TIR70-180 versus A1C. This finding also was present for the other measures of hyperglycemia and is essentially identical to observations from numerous researchers with respect to the mean glucose versus A1C relationship.1,5 Although TIR70-180 of 50% on average is associated with an A1C level of about 8%, the actual A1C could be substantially lower (eg, 6.6%) or higher (eg, 9.2%). Likewise, on average, a TIR70-180 of 30% is associated with an A1C of about 8.7% and a TIR70-180 of 70% is associated with an A1C of about 7.0%. Assuming there is not measurement error, discordance when present may reflect interindividual differences in red blood cell lifespan or other factors that influence A1C levels unrelated to the degree of glycemia.3,4 Several studies have demonstrated that an individual’s mean glucose-A1C relationship tends to be reasonably constant over time and presumably the TIR-A1C relationship would be as well.15-17
Although the present authors propose to move beyond A1C and rely primarily on CGM for diabetes management decisions, we recognize that most clinicians and patients are not ready to do so. Thus, the estimate of A1C derived from CGM metrics will have clinical relevance as long as A1C targets are being used to direct approaches to diabetes management. Until recently, when it was removed at the suggestion of the US Food and Drug Administration (FDA), many displays of CGM data showed an estimated A1C calculated from mean glucose, usually based on the ADAG study.3,4 To reduce confusion when the estimated A1C and measured A1C were discordant, it has been proposed to refer to this predicted value of A1C as the Glucose Management Indicator (GMI).18 The authors of this publication developed the term GMI with input and collaboration from many in the diabetes community including members of the Center for Devices and Radiological Health (CDRH), a division of the FDA that regulates medical devices, including CGM systems.
The present study shows that a predicted (estimated) A1C based on TIR70-180 or on T>180 have essentially the same degree of precision and reliability as an estimated A1C based on mean glucose. For now, the estimated A1C based on mean glucose (calculating a GMI) is the standard. In the future, it will be essential to indicate exactly how the estimated A1C was calculated. Although there may be utility in estimating A1C from CGM metrics, the estimation of TIR, mean glucose and hyperglycemia metrics from A1C would appear to have limited clinical relevance since the actual values will be available if CGM is being used as the basis for diabetes management. Although an observed laboratory A1C value of 8.0% on average corresponds to an estimated TIR70-180 of about 50% and a laboratory-measured A1C of 7.0% corresponds to an estimated TIR70-180 of about 64%, the conversion of a laboratory A1C to an expected TIR70-180 is not necessary or particularly useful for diabetes management.
The results comparing change in TIR70-180 versus change in A1C also demonstrate a wide degree of interindividual variability. For a given change in TIR70-180, even for no change in TIR70-180, there is a large spread in the observed change in A1C. This finding was similar for change in T>180 versus change in A1C so the discordance between change in TIR70-180 and change in A1C isn’t due to the impact of hypoglycemia on TIR70-180. Roughly an increase in TIR70-180 or a decrease in T>180 of 10% (corresponding to 2.4 hours per day) is associated with a reduction in A1C of about 0.6%. However, with baseline A1C ≥8.0%, for example, a 10% increase in TIR was associated on average with a change in A1C of approximately −1% whereas for subjects with a baseline A1C of 7.0-7.9%, a 10% increase in TIR was associated on average with a change in A1C of only −0.4%.
For comparative purposes, it is useful to understand the distribution of CGM values in individuals without diabetes. In a recent study that included 96 adults (≥18 years old, A1c <5.7% and negative islet cell antibodies) without diabetes who wore a masked Dexcom G6 sensor for a median of 205 hours, median TIR70-180 was 99% (IQR 97% to 99%), median TIR70-140 was 95% (IQR 92% to 97%) and median mean glucose concentration was 99 mg/dL (IQR 95 to 105); 1% of participants had at least 2% glucose values >180 mg/dL, none had at least 1% >250 mg/dL, 35% had at least 2% <70 mg/dL, and 5% had at least 1% <54 mg/dL.19 Although some of the out-of-range values may have been due to sensor errors (particularly for T<54—possibly due to a compression artifact while sleeping), these data are useful for comparative purposes when evaluating CGM data from individuals with diabetes.
The main limitation of these analyses is that the data are reflective of a population of individuals who participated in clinical trials, which may not be representative of the full population of adults with T1D. A potential limitation is that the data from the JDRF CGM RCT were collected with older generation sensors. However, analyses excluding results from that study produced similar results. Another potential limitation is that the amount of baseline data was less than the amount in month 6, but a minimum of 10 days of baseline data were required for the baseline and change from baseline analyses since prior studies have shown that 10-14 days of CGM data generally are sufficient to approximate the results based on 3 months of data and for correlation with A1C.20,21
A rationale that has been championed for why A1C should remain the gold standard for assessing glycemic control is that A1C is the only metric that has been associated with chronic diabetic complications. However, recently Beck et al demonstrated using the Diabetes Control and Complications (DCCT) dataset that TIR and the other hyperglycemia metrics computed from 7-point blood glucose testing every 3 months were strongly associated with the risk of retinopathy and microalbuminuria.20 A recent cross-sectional study of CGM metrics from individuals with type 2 diabetes demonstrated an association of time in range (TIR) with the presence of diabetic retinopathy.22 Nevertheless, A1C remains a valuable metric for assessing glycemic control. It can be measured easily with precision and does not require the wearing of a device.
However, as CGM use becomes more widespread, the value of A1C may lessen with greater emphasis placed instead on TIR70-180 as a metric of overall glucose control. TIR70-180 is readily understandable by individuals with diabetes and in a survey it was recognized as an important indicator for diabetes management.23,24 Since TIR70-180 is an indirect measure of hyperglycemia with a very high negative correlation with T>180 (Table 3, Figure S1a) as previously noted,11 both TIR70-180 and a metric of time in hypoglycemia (eg, T<70 and T<54) are needed to guide therapeutic decisions. Even what appears to be a small change in TIR can be clinically important: a 5% change in either TIR70-180, T>180, T<70, or T<54 represents 1.2 hours per day, while a 10% change represents 2.4 hours per day. As the medical community places greater reliance on CGM for diabetes management and less reliance on A1C, it will be important to establish targets for CGM metrics. The data reported herein are useful for this purpose. TIR70-180 of 50% for instance corresponds on average to an A1C of close to 8%, but to achieve the ADA A1C target for adults of 7.0%, the equivalent TIR70-180 target would be about 70%.
The information available from CGM to assist with diabetes management goes well beyond just the glycemic metrics that can be calculated. This information becomes evident in a display of glucose patterns versus time of day in a report such as the Ambulatory Glucose Profile (AGP, Figure 4). The AGP provides considerable information for optimizing diabetes management.25-28 The “stacked bar chart” showing the percentages of time in multiple ranges, was introduced by Rodbard29 and is part of the standardized AGP report.25 Rodbard also has illustrated several graphical methods for use of TIRs that can be used to evaluate quality of glycemic control.30 As use of CGM becomes more widespread, and as progressively more data become available confirming that TIR correlates with long-term diabetes complications,20,22 we expect that we may reach a point in the future where A1C adds little to the wealth of information available from CGM to make diabetes management decisions.
Figure 4.

Example of ambulatory glucose profile (AGP). The AGP shows glucose patterns over time, which provides considerable information for optimizing diabetes management by identifying specific times of day with hyperglycemia or hypoglycemia.20-23 The inset shows time in ranges for five ranges (very low <54 mg/dL to very high >250 mg/dL).20,24
Supplemental Material
Supplemental material, BECK_Supplementary_File_2 for The Relationships Between Time in Range, Hyperglycemia Metrics, and HbA1c by Roy W. Beck, Richard M. Bergenstal, Peiyao Cheng, Craig Kollman, Anders L. Carlson, Mary L. Johnson, RN CDE and David Rodbard in Journal of Diabetes Science and Technology
Footnotes
Abbreviations: A1C, hemoglobin A1c; AUC>180, area under the curve 180 mg/dL; CGM, continuous glucose monitoring; FDA, US Food and Drug Administration; GMI, Glucose Management Indicator; HBGI, high blood glucose index; IQR, interquartile range; JDRF CGM RCT, Juvenile Diabetes Research Foundation Continuous Glucose Monitoring Randomized Clinical Trial; T<54, time <54 mg/dL; T<70, time < 70 mg/dL; T>180, time >180 mg/dL; T>250, time >250 mg/dL; TIR70-140, time in range 70-140 mg/dL; TIR70-180, time in range of 70-180 mg/dL.
Declaration of Conflicting Interests: The author(s) declared the following potential conflicts of interest with respect to the research, authorship, and/or publication of this article: RWB has no personal disclosures. His nonprofit employer has received research funding from Dexcom, Bigfoot Biomedical, and Tandem Diabetes Care, study supplies from Roche, Ascencia, Dexcom, and Abbot Diabetes Care, and consulting fees from Insulet, Bigfoot Biomedical, and Eli Lilly and Company. RMB has received research support, consulted, or has been on the scientific advisory board for Abbott Diabetes Care, Dexcom, Hygieia, Johnson & Johnson, Lilly, Medtronic, Novo Nordisk, Onduo, Roche, Sanofi, and United Healthcare. RMB’s employer, nonprofit HealthPartners Institute, contracts for his services and no personal income goes to RMB. PC has no disclosures. CK has no disclosures. ALC has received research support from or consulted for Abbott Diabetes Care, Dexcom, Medtronic, Novo Nordisk, and Sanofi. ALC’s employer, the nonprofit HealthPartners Institute, contracts for his services and no personal income goes to ALC. MLJ has received research support from and/or has consulted with Abbott Diabetes Care, Dexcom, Hygieia, Johnson & Johnson, Lilly, Medtronic, Novo Nordisk, and Sanofi. MLJ’s employer, nonprofit HealthPartners Institute, contracts for her services and no personal incomes goes to MLJ. DR has served as a consultant to Eli Lilly and Company.
Funding: The author(s) disclosed receipt of the following financial support for the research, authorship, and/or publication of this article: The study was supported by research funding from Sanofi and by the Jaeb Center for Research Foundation, Inc. Sanofi had no role in the conduct of the analyses or writing of the manuscript. RWB had full access to all of the data in this study and takes complete responsibility for the integrity of the data and the accuracy of the data analysis.
Supplemental Material: Supplemental material for this article is available online.
References
- 1. Beck RW, Connor CG, Mullen DM, Wesley DM, Bergenstal RM. The fallacy of average: how using HbA1c alone to assess glycemic control can be misleading. Diabetes Care. 2017;40:994-999. [DOI] [PMC free article] [PubMed] [Google Scholar]
- 2. Hempe JM, Liu S, Myers L, McCarter RJ, Buse JB, Fonseca V. The hemoglobin glycation index identifies subpopulations with harms or benefits from intensive treatment in the ACCORD trial. Diabetes Care. 2015;38:1067-1074. [DOI] [PMC free article] [PubMed] [Google Scholar]
- 3. Malka R, Nathan DM, Higgins JM. Mechanistic modeling of hemoglobin glycation and red blood cell kinetics enables personalized diabetes monitoring. Sci Transl Med. 2016;8:359ra130. [DOI] [PMC free article] [PubMed] [Google Scholar]
- 4. Nathan DM, Kuenen J, Borg R, et al. Translating the A1C assay into estimated average glucose values. Diabetes Care. 2008;31:1473-1478. [DOI] [PMC free article] [PubMed] [Google Scholar]
- 5. Yudkin JS, Forrest RD, Jackson CA, Ryle AJ, Davie S, Gould BJ. Unexplained variability of glycated haemoglobin in non-diabetic subjects not related to glycaemia. Diabetologia. 1990;33:208-215. [DOI] [PubMed] [Google Scholar]
- 6. Agiostratidou G, Anhalt H, Ball D, et al. Standardizing clinically meaningful outcome measures beyond HbA1c for type 1 diabetes: a consensus report of the American Association of Clinical Endocrinologists, the American Association of Diabetes Educators, the American Diabetes Association, the Endocrine Society, JDRF International, the Leona M. and Harry B. Helmsley Charitable Trust, the Pediatric Endocrine Society, and the T1D Exchange. Diabetes Care. 2017;40:1622-1630. [DOI] [PMC free article] [PubMed] [Google Scholar]
- 7. Danne T, Nimri R, Battelino T, et al. International consensus on use of continuous glucose monitoring. Diabetes Care. 2017;40:1631-1640. [DOI] [PMC free article] [PubMed] [Google Scholar]
- 8. The Juvenile Diabetes Research Foundation Continuous Glucose Monitoring Study Group. Continuous glucose monitoring and intensive treatment of type 1 diabetes. N Engl J Med. 2008;359:1464-1476. [DOI] [PubMed] [Google Scholar]
- 9. The Juvenile Diabetes Research Foundation Continuous Glucose Monitoring Study Group. The effect of continuous glucose monitoring in well-controlled type 1 diabetes. Diabetes Care. 2009;32:1378-1383. [DOI] [PMC free article] [PubMed] [Google Scholar]
- 10. Aleppo G, Ruedy KJ, Riddlesworth TD, et al. A randomized trial comparing continuous glucose monitoring with and without routine blood glucose monitoring in well-controlled adults with type 1 diabetes. Diabetes Care. 2017;40:538-545. [DOI] [PMC free article] [PubMed] [Google Scholar]
- 11. Beck RW, Riddlesworth T, Ruedy K, et al. Effect of continuous glucose monitoring on glycemic control in adults with type 1 diabetes using insulin injections: the DIAMOND randomized clinical trial. JAMA. 2017;317:371-378. [DOI] [PubMed] [Google Scholar]
- 12. Heinemann L, Freckmann G, Ehrmann D, et al. Real-time continuous glucose monitoring in adults with type 1 diabetes and impaired hypoglycaemia awareness or severe hypoglycaemia treated with multiple daily insulin injections (HypoDE): a multicentre, randomised controlled trial. Lancet. 2018;391:1367-1377. [DOI] [PubMed] [Google Scholar]
- 13. Kovatchev BP. Metrics for glycaemic control—from HbA1c to continuous glucose monitoring. Nat Rev Endocrinol. 2017;13:425-436. [DOI] [PubMed] [Google Scholar]
- 14. Rodbard D. Metrics to evaluate quality of glycemic control: comparison of time in target, hypoglycemic, and hyperglycemic ranges with “risk indices.” Diabetes Technol Ther. 2018;20:325-334. [DOI] [PubMed] [Google Scholar]
- 15. Nayak AU, Holland MR, Macdonald DR, Nevill A, Singh BM. Evidence for consistency of the glycation gap in diabetes. Diabetes Care. 2011;34:1712-1716. [DOI] [PMC free article] [PubMed] [Google Scholar]
- 16. Rodriguez-Segade S, Rodriguez J, Garcia Lopez JM, Casanueva FF, Camina F. Estimation of the glycation gap in diabetic patients with stable glycemic control. Diabetes Care. 2012;35:2447-2450. [DOI] [PMC free article] [PubMed] [Google Scholar]
- 17. Wilson DM, Xing D, Cheng J, et al. Persistence of individual variations in glycated hemoglobin: analysis of data from the Juvenile Diabetes Research Foundation Continuous Glucose Monitoring Randomized Trial. Diabetes Care. 2011;34:1315-1317. [DOI] [PMC free article] [PubMed] [Google Scholar]
- 18. Bergenstal RM, Beck RW, Close KL, et al. Glucose management indicator (GMI): a new term for estimating A1C from continuous glucose monitoring. Diabetes Care. 2018;41:2275-2280. [DOI] [PMC free article] [PubMed] [Google Scholar]
- 19. Peters AL, Li Z, DuBose S, et al. Continuous glucose monitoring profiles in healthy non-diabetic participants: A multicenter prospective study. Paper presented at: European Association for the Study of Diabetes Meeting; October 2018; Berlin, Germany. [Google Scholar]
- 20. Beck RW, Bergenstal RM, Riddlesworth TD, et al. Validation of time in range as an outcome measure for diabetes clinical trials. Diabetes Care. 2019;42:400-405. [DOI] [PMC free article] [PubMed] [Google Scholar]
- 21. Riddlesworth TD, Beck RW, Gal RL, et al. Optimal sampling duration for continuous glucose monitoring to determine long-term glycemic control. Diabetes Technol Ther. 2018;20:314-316. [DOI] [PubMed] [Google Scholar]
- 22. Lu J, Ma X, Zhou J, et al. Association of time in range, as assessed by continuous glucose monitoring, with diabetic retinopathy in type 2 diabetes. Diabetes Care. 2018;41:2370-2376. [DOI] [PubMed] [Google Scholar]
- 23. Beyond A1c Working Group. Need for regulatory change to incorporate beyond A1C glycemic metrics. Diabetes Care. 2018;41:e92-e94. [DOI] [PubMed] [Google Scholar]
- 24. Runge AS, Kennedy L, Brown AS, et al. Does time-in-range matter? perspectives from people with diabetes on the success of current therapies and the drivers of improved outcomes. Clin Diabetes. 2018;36:112-119. [DOI] [PMC free article] [PubMed] [Google Scholar]
- 25. Bergenstal RM, Ahmann AJ, Bailey T, et al. Recommendations for standardizing glucose reporting and analysis to optimize clinical decision making in diabetes: the Ambulatory Glucose Profile (AGP). Diabetes Technol Ther. 2013;15:198-211. [DOI] [PubMed] [Google Scholar]
- 26. Mazze R, Strock E, Morgan B, Wesley D, Bergenstal R, Cuddihy R. Diurnal glucose patterns of exenatide once weekly: a 1-year study using continuous glucose monitoring with ambulatory glucose profile analysis. Endocr Pract. 2009;15:326-334. [DOI] [PubMed] [Google Scholar]
- 27. Mazze RS, Lucido D, Langer O, Hartmann K, Rodbard D. Ambulatory glucose profile: representation of verified self-monitored blood glucose data. Diabetes Care. 1987;10:111-117. [DOI] [PubMed] [Google Scholar]
- 28. Mazze RS, Strock E, Wesley D, et al. Characterizing glucose exposure for individuals with normal glucose tolerance using continuous glucose monitoring and ambulatory glucose profile analysis. Diabetes Technol Ther. 2008;10:149-159. [DOI] [PubMed] [Google Scholar]
- 29. Rodbard D. Display of glucose distributions by date, time of day, and day of week: new and improved methods. J Diabetes Sci Technol. 2009;3:1388-1394. [DOI] [PMC free article] [PubMed] [Google Scholar]
- 30. Rodbard D. Evaluating quality of glycemic control: graphical displays of hypo- and hyperglycemia, time in target range, and mean glucose. J Diabetes Sci Technol. 2015;9:56-62. [DOI] [PMC free article] [PubMed] [Google Scholar]
Associated Data
This section collects any data citations, data availability statements, or supplementary materials included in this article.
Supplementary Materials
Supplemental material, BECK_Supplementary_File_2 for The Relationships Between Time in Range, Hyperglycemia Metrics, and HbA1c by Roy W. Beck, Richard M. Bergenstal, Peiyao Cheng, Craig Kollman, Anders L. Carlson, Mary L. Johnson, RN CDE and David Rodbard in Journal of Diabetes Science and Technology