

Abstract
Background:
Physical activity presents a significant challenge for glycemic control in individuals with type 1 diabetes. As accurate glycemic predictions are key to successful automated decision-making systems (eg, artificial pancreas, AP), the inclusion of additional physiological variables in the estimation of the metabolic state may improve the glucose prediction accuracy during exercise.
Methods:
Predictor-based subspace identification is applied to a dynamic glucose prediction model including heart rate measurements along with variables representing the carbohydrate consumption and insulin boluses. To demonstrate the improvement in prediction ability due to the additional heart rate variable, the performance of the proposed modeling technique is evaluated with (SID-HR) and without heart rate (SID-2) as an additional input using experimental data involving adolescents at ski camp. Furthermore, the performance of the proposed approach is compared to that of the metabolic state observer (MSO) model currently used in the University of Virginia AP algorithm.
Results:
The addition of heart rate in the subspace-based model (SID-HR) yields a statistically significant improvement in the root-mean-square error compared to the SID-2 model (P < .001) and the standard MSO (P < .001). Furthermore, the SID-HR model performed favorably in comparison to the SID-2 and MSO models after accounting for its increased complexity.
Conclusions:
Directly considering the effects of physical activity levels on glycemic dynamics through the inclusion of heart rate as an additional input variable in the glucose dynamics model improves the glucose prediction accuracy. The proposed methodology could improve exercise-informed model-based predictive control algorithms in artificial pancreas systems.
Keywords: artificial pancreas, glucose concentration prediction, heart rate information, physical activity, subspace identification
Despite rapid improvements in diabetes technology, physical activity continues to represent a substantial challenge for people living with type 1 diabetes (T1D) as physical activity levels have significant effects on glucose dynamics and insulin action. Numerous factors impact the blood glucose concentration (BGC) response to physical activity, including (1) the type, duration, and intensity of the exercise; (2) physical fitness level; (3) previous insulin delivery or food ingestion; and (4) the degree of stress involved in the activity.1,2 Although guidelines for treatment during exercise exist, conventional diabetes management requires the individual with T1D to plan physical activities multiple hours in advance by consuming sufficient quantities of carbohydrates, reducing insulin, or both, and further frequently monitor their BGC dynamics during the activity.3 The challenge of maintaining euglycemia during exercise can be exacerbated in adolescence as endocrine changes often lead to increased insulin resistance, and suboptimal treatment behaviors can deteriorate metabolic control.4
Recent advances in artificial pancreas (AP) systems have improved glucose control in the presence of diurnal variability.5-12 The traditional AP structure, using a continuous glucose monitor (CGM), a subcutaneous insulin infusion pump, and a control algorithm, is not directly informed of physical activity. Therefore, such APs are limited to learning the presence of physical activity and its potential impact on glucose concentrations only by detecting interstitial glucose changes due to physical activity. Numerous studies have demonstrated that an AP system employing this traditional structure can be safe and effective in regulating BGC using both single hormone (insulin only)13-22 and dual hormone (insulin and glucagon) AP systems.23-27 Nevertheless, in these studies some subjects still experienced mild hypoglycemia because this reactive feedback mechanism may be inadequate to compensate for the rapidly changing BGC during aerobic exercise.
Without considering additional information beyond CGM measurements, the precipitous decline in BGC during various physical activities can be challenging to account for in mathematical models, as exercise can increase muscular glucose uptake up to fifty fold through insulin independent transport.28 In people without diabetes, plasma insulin concentrations decrease with a corresponding increase in glucagon and other counterregulatory hormones during aerobic exercise which maintains euglycemia. If the plasma insulin concentrations fail to decrease during aerobic exercise, the glucose counterregulatory hormone response is less effective and, in many cases, is insufficient to increase the hepatic glucose production to prevent hypoglycemia. This phenomenon occurs frequently in people with insulin-dependent diabetes as the pharmacokinetic and pharmacodynamic profiles of insulin analogues do not favor this response. In addition, rapid BGC changes may not be immediately reflected in the interstitial glucose concentrations measured by CGM sensors, leading to worsened CGM accuracy.29 Finally, the need for accurate tracking and prediction of glycemia is heightened by the necessary timing of insulin delivery adjustments to physical activity: with any such adjustments optimally occurring as early into the exercise bout as possible compensating for transient increases in plasma free insulin concentrations associated with exercise.30
Using additional physiological signals to inform the AP system of physical activity and exercise intensity may improve its performance by allowing it to be proactive to the BGC changes. In one approach, exogenous physiological variables are utilized to passively detect the occurrence of exercise but are not directly employed in the predictive models. These studies utilize heart rate data,31,32 accelerometer signals,33,34 or both,35-37 as indicators of exercise. Another approach, as is used in this work, is to include the physiological variables as inputs to the predictive models. This has been accomplished through the addition of galvanic skin response and estimates of energy expenditure38 or accelerometer signals.39 Early studies demonstrated an improvement in glucose prediction accuracy with the additional input variables,40 which provides a foundation for this contribution.
As several studies indicate, heart rate is a good indicator of the occurrence and intensity of exercise.41 This article extends upon the existing work by developing a glucose prediction model that explicitly considers the exercise intensity by utilizing the proportion of the current measured heart rate to the age-predicted maximum in addition to variables quantifying the carbohydrate consumption and insulin boluses. The proposed approach identifies a state-space model using the predictor-based subspace identification (PBSID) approach. To demonstrate the improvement in prediction ability due to the inclusion of the additional variable, the performance of the proposed modeling technique is evaluated with and without heart rate as an additional input using experimental data collected in T1D adolescents during camp. Furthermore, the performance of the proposed approach is compared to that of the metabolic state observer (MSO) model,42 used in the University of Virginia AP system.
Methods
Data
The proposed models are identified using data collected over two ski and snowboarding camps for adolescents with T1D.43 Each camp lasted six days with five nights and contained about five hours of on-snow activity per day. The daily schedule of activities was consistent between the two sessions. The subjects were evenly divided into open and closed-loop groups and were coarsely paired based upon age and HbA1c, all participants wore a Dexcom G4 sensor (Dexcom, Inc, San, Diego, CA), a Fitbit Charge HR activity monitor (Fitbit, San Francisco, CA), and used an insulin pump.43 The demographic information of the participants is given in Table 1.
Table 1.
Demographic Information of the Participants.
| Participant characteristics | |
|---|---|
| Age, years | |
| Mean ± SD (range) | 13 ± 1.7 (10-16) |
| HbA1c | |
| Mean ± SD (range) | 8.5 ± 1.5 (6.6-13.2) |
| Gender, n (%) | |
| Female | 15 (46.9) |
| Male | 17 (53.1) |
| Weight, kg | |
| Mean ± SD (range) | 54.2 ± 11.4 (40.9-76.8) |
| Body mass index, kg/m2 | |
| Mean ± SD (range) | 20.5 ± 2.9 (16.1-24.9) |
| Sport, n (%) | |
| Ski | 20 (62.5) |
| Snowboard | 12 (37.5) |
| Skill level, n (%) | |
| First time | 14 (43.7) |
| Beginner | 2 (6.3) |
| Intermediate | 5 (15.6) |
| Advanced | 11 (34.4) |
| DiAs operating mode, n (%) | |
| Open loop | 16 (50) |
| Closed loop | 16 (50) |
The AP control system performed well despite the intense physical activity. The closed-loop control outperformed the remotely monitored sensor-augmented pump therapy in terms of time spent in the euglycemic range (71.3 vs 64.7% between 70-140 mg/dL, P = .008) with less time spent both above and below that target (Table 2). The closed-loop control group had significant reductions in insulin administered during the skiing period (9:30 am–noon, 1:00 pm–4:00 pm) and in the daytime (7:00 am–11:00 pm) when compared to the remotely monitored sensor-augmented pump group. These reductions did not have a significant impact on average glycemia in any of the time periods studied, but the time spent in the target range was increased. The hypoglycemia exposure and total insulin use were improved overall (P = .0001 and P = .0001) and an interaction of ski proficiency and AP performance was observed in both criteria as well (P = .002 and P = .001). Based on numerous safety outcomes and quality of control measures, it can be concluded that the closed-loop control performs, at a minimum, comparably and in many cases, more favorably than remotely monitored sensor-augmented pump in adolescents at a ski camp as shown by Breton et al.43
Table 2.
Percentage of Time in Range.
| Percentage of CGM samples in range | |||||
|---|---|---|---|---|---|
| CGM range (mg/dL) | <55 | 55-70 | 70-180 | 180-250 | >250 |
| Open-loop data | 0.50 | 2.47 | 66.07 | 21.24 | 9.72 |
| Closed-loop data | 0.29 | 2.02 | 74.16 | 17.61 | 5.92 |
Modeling Approach
The MSO model is a linearized and discretized derivation of the “minimal model” developed by Bergman et al.44 The model has two inputs with one representing absorbed carbohydrates and one representing active insulin. The coefficients of the model are population-based parameters that are scaled by body weight as a step toward personalization. The state observer is based upon a steady-state Kalman filter in which the meal disturbance process and CGM signal noise represented as zero-mean white Gaussian processes. Over the prediction horizon, the inputs are held at their operating point values. The MSO model has been described in greater detail by Hughes et al.42
The PBSID technique is the foundation for the proposed approach for modeling glycemic measurements with the heart rate measurements utilized to incorporate the effects of exercise intensity.45-47 The structure of the identified linear, time-invariant state-space model with state feedback is mathematically represented as
| (1) |
| (2) |
where and denote the vectors of state, input and output variables, respectively. The system matrices and are the state transition, input coefficient, output coefficient, direct feedthrough, and Kalman gain matrices, respectively. In this notation, denotes a vector of n elements and denotes a matrix with n rows and m columns.
The PBSID approach first estimates the coefficient matrices of a vector autoregressive with exogenous inputs (VARX) model parametrized by Markov parameters. The estimated Markov parameters are subsequently used to obtain an estimate of the state sequence and the state-space system matrices. To improve the accuracy of the glucose predictions during exercise, the modeling approach is extended to utilize heart rate as a representation of physical activity levels. To this end, let the vector of input variables to the model at the k -th sampling instance be with and denoting the carbohydrate consumption, insulin boluses and the ratio of the current heart rate to the age-predicted maximum, respectively. The age-predicted maximum heart rate is calculated as Therefore, , with as the heart rate measurement at the k -th sampling instance. Considering the CGM measurements a one-step ahead VARX predictor can be developed as
| (3) |
where and denote the coefficient matrices and is the predicted output for time instant k using the given inputs and the measured outputs over a past window p based on information at time k-1. Furthermore, the stacked vectors and are defined with respect to the past and future windows of lengths p and f as and Stacked vectors and are also defined in a similar way. Recognizing that the predicted state is given by
| (4) |
where and denotes the extended controllability matrices and . Assuming that the state transition matrix is nilpotent with degree p (), the contribution of the initial state is negligible for sufficiently large p, and the predicted state can be expressed as
| (5) |
The product between the predicted state and the observability matrix is given by
| (6) |
with
The product of the matrices and can be constructed from the VARX model coefficient matrices and .45,46 Therefore, after estimating the VARX coefficient matrices, all quantities on the right-hand side of Eq. 5 are known and a singular value decomposition can be used to readily obtain a low-rank approximation of the state sequence. The estimated state sequence is then employed along with the inputs and measured outputs to estimate the system matrices A, B, C, D and K by solving linear least squares problems.45,46 In the batch-wise approach, the system matrices are determined to effectively characterize the relationship between the input and output training data. To minimize computational complexity, these parameters are consistent among the subjects and are time-invariant.
To evaluate the predictive performance of the proposed technique compared to the MSO model, we first focus on the same two inputs: the rate of appearance of ingested glucose and the rate of appearance of insulin. This two-input model developed using the PBSID technique is referred to as SID-2. Next, an additional input, the ratio of measured heart rate to the age-predicted maximum heart rate, is added and a new model incorporating exercise intensity information is developed (termed SID-HR).
The camp data are divided into two sets for training and testing the proposed models. The second and third day of the camp (samples 300-800 at a five-minute sampling rate) of the open-loop (control group) participants is used for training the models. Many of the camp participants were learning to ski or snowboard on the first day with it being their first exposure to the sport, and presumably, the stress of learning a new skill influences both the glycemic response to the activity and the heart rates. For that reason, we opted to use data from the second day onward to train the model. The open-loop data are selected for training because these individuals spent a greater percentage of time in hypo- and hyperglycemia compared to the closed-loop subjects (Table 2). Data that span a greater range are valuable for training the model as they capture the BGC dynamics at the extremes and, thus, prevents a model bias toward the euglycemic range. For assessing the model performance, the data collected from all participants in the camp were utilized. The performance of the open- and closed-loop arms of the study were evaluated together and separately to identify the model’s performance on individuals outside of the training group and within it. For the open loop subjects, the performance for testing was calculated on days 1, 4, 5, and 6 (samples 1-300 and 800-end of experiment). For the closed loop subjects, the performance of the model was assessed for the entire duration of the study period.
Statistical Analysis
To evaluate the predictive performance of the proposed SID-HR model in comparative analysis with the SID-2 and MSO models, several performance criteria are considered. The root-mean-square error (RMSE), mean absolute error (MAE), integral square error (ISE), Akaike information criterion (AIC),48 Bayesian information criterion (BIC),49 and coefficient of determination (R2) are computed. Furthermore, two sample t-tests are employed in order to determine the statistical significance of the difference between the models.
Results
The comparison of the prediction ability of the models through various performance criteria is given in Table 3. The primary concern of this study is improving the 30-minute-ahead glucose predictions, which translates to a six-step-ahead prediction with a five-minute sampling time. A modest improvement is observed in the SID-2 model in comparison to the MSO model across the performance criteria, but the change was insufficient to be statistically significant. The inclusion of the additional heart rate variable in the SID-HR model yields a statistically significant improvement in the RMSE in comparison to the SID-2 model (P = 5.34×10⁻¹⁰). Moreover, the SID-HR model is more accurate than the SID-2 and MSO models across all the considered performance criteria. In Table 3, the P values are computed in relation to the RMSE values of the entire testing data set between the SID models and the MSO model. The ISE, AIC and BIC were reduced, on average, for the SID-HR model when compared to the SID-2 and MSO. The R2 values of the 30-minute predictions relative to the CGM are greater for the SID models as compared to the MSO, with the SID-HR model obtaining the highest value.
Table 3.
Comparison of Glucose Prediction Models.
| RMSE | MAE | ISE | AIC | BIC | R 2 | P value | |
|---|---|---|---|---|---|---|---|
| MSO | 28.87 | 20.67 | .7185 | — | |||
| SID-2 | 28.64 | 20.47 | .7241 | .359 | |||
| SID-HR | 26.33 | 19.61 | .7643 |
The performance of the models on the open loop and closed loop groups is then considered. This is significant for more than their experimental group, as the SID models were trained using a portion of the data from each open loop subject whereas the data from the closed loop subjects was only used for model assessment. The RMSE and MAE for these groups under each model is shown in Table 4. There is no statistically significant difference between the open- and closed-loop data in the SID-2 model prediction accuracy (P = .961) or the SID-HR model prediction accuracy (P = .753). Using a subset of the open loop data as the training data was valuable, as the same technique trained with the closed-loop data led to the RMSE of SID-HR increasing by 0.77.
Table 4.
Comparison of Glucose Prediction Models.
| RMSE |
MAE |
|||||||||
|---|---|---|---|---|---|---|---|---|---|---|
| All | OL | CL | Hypo | Camp | All | OL | CL | Hypo | Camp | |
| MSO | 28.87 | 28.71 | 29.04 | 31.58 | 48.82 | 20.67 | 20.28 | 21.09 | 26.50 | 38.26 |
| SID-2 | 28.64 | 28.68 | 28.61 | 28.63 | 48.21 | 20.47 | 20.22 | 20.74 | 23.68 | 37.81 |
| SID-HR | 26.33 | 26.62 | 26.02 | 36.98 | 46.16 | 19.61 | 19.71 | 19.50 | 33.13 | 36.33 |
The prediction accuracy is reduced in periods of activity for all three models. As shown in Table 4, the RMSE and MAE were above average during the time periods the adolescents were actively skiing and snowboarding (9 am–noon and 1:00 pm–4:00 pm). Yet, the errors were lower on average in the SID-HR model when compared to the SID-2 and MSO models during that period.
The Clarke error grid analysis in Figure 1 shows that the majority of samples occur in regions A and B. This indicates the 30-minute-ahead predicted values are either within of the actual CGM readings (region A) or the samples with prediction discrepancies greater than 20% (region B) would not lead to erroneous treatment decisions.
Figure 1.
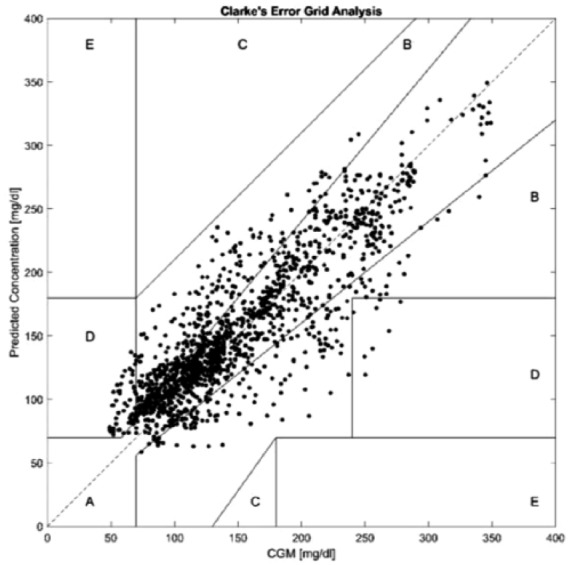
Clarke error grid of a representative subject.
A small number of samples occur in the regions C and D, which indicates a potentially undesirable treatment outcome or a failure to predict hypo- or hyperglycemia. The samples appearing in C and D are present in both the sedentary and active time periods when the rate of glucose change is high. A very small percentage of samples occur in region E, which would indicate a misclassification of hypoglycemia as hyperglycemia or vice versa. The average percentage of samples within each region of the Clarke error grid for each model is shown in Table 5.
Table 5.
Percentage of Samples in Each Region of the Clarke Error Grid.
| Model | % Zone A | % Zone B | % Zone C | % Zone D | % Zone E |
|---|---|---|---|---|---|
| MSO | 74.66 | 22.88 | 0.18 | 2.26 | 0.020 |
| SID-2 | 74.69 | 23.01 | 0.14 | 2.12 | 0.03 |
| SID-HR | 74.81 | 22.26 | 0.11 | 2.81 | 0.006 |
In Figure 2, the distributions of the residuals using the SID-HR, SID-2, and MSO models are plotted. The mean of the residuals across all subjects for the SID-HR, SID-2, and MSO models is 3.9, 0.12, and 0.050 mg/dL, respectively. Despite the improved prediction ability of proposed SID-HR model, the residuals are biased, whereas the mean of the residuals of the comparative methods are closer to zero. In addition, the residuals for the proposed SID-HR model are more widely distributed as compared to the residuals of the SID-2 and MSO models with standard deviations of 34.0, 33.5, and 28.8 mg/dL for the respective models. Thus, the introduction of heart rate into the model improves the prediction performance, but in some cases introduces errors. The SID-HR model has a positive skew over the entire residual set; however, all three models have a slight positive skew when considering the 30-minutes prior to the CGM detecting hypoglycemia (<70 mg/dL). The mean absolute error over the hypoglycemic region for each model are 26.50, 23.68, and 33.13 for the MSO, SID-2, and SID-HR models, respectively.
Figure 2.
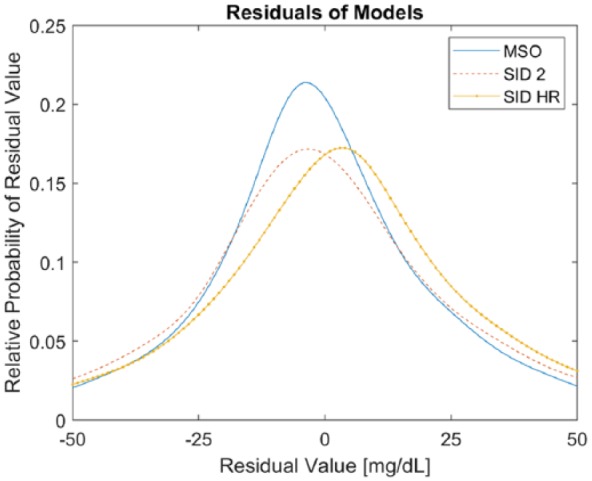
Residuals of the three models.
Representative model predictions and inputs for one subject are presented in Figures 3 and 4. The CGM values, the glucose predictions for both the MSO and SID-HR models, the basal and bolus insulin, and the heart rate are presented for direct comparison.
Figure 3.

Glucose predictions and model inputs for an open-loop subject.
Figure 4.

Glucose predictions and model inputs for a closed-loop subject.
Analyzing the model predictions raises a few qualitative observations. The prediction delay is generally smaller in the SID-HR model (red line) than the MSO model (blue dashed line) or the SID-2 model (purple dotted line). In comparing the two predictive models, the MSO model is highly correlated with the current CGM measurement value (R2 = .9975). In addition, the RMSE between the current CGM measurement and the predicted value is very small, indicating a potential delay in predicting a change in glucose. The SID-2 and SID-HR have larger RMSE compared to the current sample of the CGM which indicates that the predicted values are further from the current values and the smaller errors at the 30-minute prediction horizon may be indicative of less delay as shown in Table 6. In considering delay from the perspective of correlation using the MATLAB finddelay function, the delay between the 30-minute prediction and CGM values are 5.8, 5.1, and 4.6 samples for the MSO, SID-2, and SID-HR models, respectively. Therefore, the MSO model’s high dependence on the current value of CGM may hinder its performance, whereas the SID-HR model provides a 30-minute-ahead prediction that more closely coincides with the actual CGM.
Table 6.
Prediction Accuracy as a Degree of Predicted Change.
| RMSE | Current value [k] | 6-step-ahead prediction [k + 6] |
|---|---|---|
| MSO | ||
| SID-2 | ||
| SID-HR |
Overall, the proposed SID-HR model is more accurate in prediction ability when compared to the MSO model. Across all the performance criteria, the SID-HR model outperforms the SID-2 model, while the SID-2 model outperforms the MSO model. In addition, no significant difference is seen in the predictions for the open- and closed-loop data using either the SID-HR and SID-2 models despite training the models exclusively on the open-loop data.
Discussion
The SID-HR model outperformed the SID-2 and MSO models across several performance metrics. The prediction error, as calculated by RMSE and MAE, is reduced overall and in the active skiing time for the SID-HR model. Thus, the inclusion of heart rate from a commercially available wrist-worn heart rate monitor is sufficient to see modest improvements in prediction performance in physically active adolescents. The reduction in RMSE and MAE is observed in the open loop group, where a portion of each subject’s data were used for training, and in the closed loop group where the subjects were only used for testing the model. This indicates that the model can generalize to new subjects without loss of performance. This comparison may be more directly applicable to the MSO model as its parameters were also not trained on this data set.
In considering measures other than prediction error directly, the SID-HR model continues to perform well. The ISE is reduced for the SID-HR model which indicates a reduction in prediction error over time. As AIC and BIC are metrics which represent the trade-off of model fitting and model simplicity, the reduction in those values in the SID-HR given the additional input is promising. The predictions of the SID-HR model are highly correlated to the CGM values as shown by it having the highest R2 of the models. This indicates it can represent the variance of the CGM values most adeptly.
The percentage of samples falling into each Clarke error grid region was similar for each of the three models with the overwhelming majority falling into regions A and B. Only a small percentage fall into C, D, and E which could lead to unnecessary or undesirable treatment outcomes. As the Clarke error grid analysis was developed to quantify blood glucose meter accuracy (an instantaneous measurement), achieving an acceptable error grid performance with the 30-minute-ahead glucose predictions demonstrates a high degree of accuracy and safety in the proposed SID-HR model.
The improved prediction ability of the proposed SID-HR model notwithstanding, a sustained bias is observed in the mean of the residuals across all subjects for the proposed model in contrast to the SID-2 and MSO models. As this bias is observed despite the lower RMSE and MAE values, it suggests that the glycemic measurements may not be linearly dependent on the heart rate. The bias in the residuals may also be due to the fact that including heart rate may only capture some of the effects of physical activity on glycemic dynamics, while characterizing all the effects may require more physiological variables. This bias may have an undesirable effect on the ability to predict hypoglycemia accurately, as the prediction error when the CGM was indicating hypoglycemia (BG < 70 mg/dL) was greatest in the SID-HR as compared to the SID-2 or MSO.
As prediction accuracy is a primary focus of this work, the delay between the predicted values and the CGM is an important factor to assess. In this work, the observed delay was reduced with the introduction of the heart rate input (SID-HR) as compared with the other two models. The heart rate signal used in this work was obtained through a commercially available wrist-worn fitness-tracker. As such, the heart rate measurement accuracy is impacted by noise and artifacts because of the movement of the arms and of movement of the wristband on the arm. The accuracy of HR data is highly affected during the physical activity periods. Despite this limitation, the inclusion of heart rate in the model reduced the prediction error and delay between the predictions and future CGM values.
As the data considered in this work consisted exclusively of adolescent subjects, the improved prediction performance of the SID models compared to the MSO model may be a result of the limited diversity in the data. Greater diversity in the population involved in the experiments may lead to divergent results where the improvement in prediction accuracy of the SID-HR model is less conclusive. This scenario may be evident if the SID-HR model is evaluated using adults, particularly the adults with a long duration of diabetes whose reported heart rates may be influenced by diabetic neuropathy. In addition, the models considered in this work are identified using subject data with a significant amount of physical activity (~5 h/day). Finally, heart rate can be greatly influenced by many factors, including stress, medication and body position. Therefore, the predictive performance of the proposed model may not extend to situations where subjects are prone to such disturbances.
For an AP system to be adopted in an ambulatory setting, the computational tractability of the control algorithm is of concern. As the control algorithms need to be implemented on computationally constrained hardware settings, such as insulin pumps or smartphones, the proposed model should be relatively computationally tractable and efficient, yet be able to provide reliable predictions. For reasons related to the computational complexity of the model, a linear, time-invariant model is favored over a nonlinear model or a model with time-varying parameters even though nonlinear or recursively updated model may provide better predictions.
Conclusion
In active adolescents at skiing and snowboarding camp, the inclusion of heart rate as an additional input in the glucose prediction model significantly improved the prediction performance as measured by several performance indices. Since exercise has a significant effect on blood glucose concentration, a model that can accurately predict the variations in the glycemic dynamics due to physical activity may allow artificial pancreas systems to proactively make the appropriate treatment decisions and improve glycemic control.
Footnotes
Abbreviations: AIC, Akaike information criterion; AP, artificial pancreas; BGC, blood glucose concentration; BIC, Bayesian information criterion; CGM, continuous glucose monitor; DiAs, Diabetes Assistant: user interface for the University of Virginia artifical pancreas system50 ; ISE, integral square error; MAE, mean absolute error; MSO, metabolic state observer; PBSID, predictor-based subspace identification; R2, coefficient of determination; RMSE, root-mean-square error; SID-2, two-input model developed by predictor-based subspace identification; SID-HR, three-input model with heart rate as an input developed by predictor-based subspace identification; T1D, type 1 diabetes; VARX, vector autoregressive with exogenous inputs.
Declaration of Conflicting Interests: The author(s) declared no potential conflicts of interest with respect to the research, authorship, and/or publication of this article.
Funding: The author(s) disclosed receipt of the following financial support for the research, authorship, and/or publication of this article: This work is sponsored by NIDDK grants DP3 DK106826-01 to the University of Virginia and subcontract to Illinois Institute of Technology, DP3 DK101075-01 and DP3 DK101077-01 to Illinois Institute of Technology.
References
- 1. Robertson K, Adolfsson P, Scheiner G, Hanas R, Riddell MC. Exercise in children and adolescents with diabetes. Pediatr Diabetes. 2009;10:154-168. doi: 10.1111/j.1399-5448.2009.00567.x. [DOI] [PubMed] [Google Scholar]
- 2. Riddell MC, Perkins BA. Type 1 diabetes and vigorous exercise: applications of exercise physiology to patient management. Can J Diabetes. 2006;30:63-71. doi: 10.1016/S1499-2671(06)01010-0. [DOI] [Google Scholar]
- 3. Riddell MC, Gallen IW, Smart CE, et al. Exercise management in type 1 diabetes: a consensus statement. Lancet Diabetes Endocrinol. 2017;5:377-390. [DOI] [PubMed] [Google Scholar]
- 4. Cameron FJ, Amin R, de Beaufort C, Codner E, Acerini CL. Diabetes in adolescence. Pediatr Diabetes. 2014;15:245-256. doi: 10.1111/pedi.12169. [DOI] [PubMed] [Google Scholar]
- 5. Gondhalekar R, Dassau E, Doyle FJ. Periodic zone-MPC with asymmetric costs for outpatient-ready safety of an artificial pancreas to treat type 1 diabetes. Automatica. 2016;71:237-246. [DOI] [PMC free article] [PubMed] [Google Scholar]
- 6. Del Favero S, Boscari F, Messori M, et al. Randomized summer camp crossover trial in 5-to 9-year-old children: outpatient wearable artificial pancreas is feasible and safe. Diabetes Care. 2016;39:1180-1185. doi: 10.2337/dc15-2815. [DOI] [PubMed] [Google Scholar]
- 7. Resalat N, Youssef J El, Reddy R, Jacobs PG. Design of a dual-hormone model predictive control for artificial pancreas with exercise model. In: 2016 38th Annual International Conference of the IEEE Engineering in Medicine and Biology Society Orlando, FL: IEEE; 2016:2270-2273. doi: 10.1109/EMBC.2016.7591182. [DOI] [PMC free article] [PubMed] [Google Scholar]
- 8. Renard E, Farret A, Kropff J, et al. Day and night closed-loop glucose control in patients with type 1 diabetes under free-living conditions: results of a single-arm 1-month experience compared with a previously reported feasibility study of evening and night at home. Diabetes Care. 2016:dc160008. [DOI] [PubMed] [Google Scholar]
- 9. Anderson SM, Raghinaru D, Pinsker JE, et al. Multinational home use of closed-loop control is safe and effective. Diabetes Care. 2016:dc152468. [DOI] [PMC free article] [PubMed] [Google Scholar]
- 10. Taleb N, Emami A, Suppere C, et al. Efficacy of single-hormone and dual-hormone artificial pancreas during continuous and interval exercise in adult patients with type 1 diabetes: randomised controlled crossover trial. Diabetologia. 2016;59:2561-2571. doi: 10.1007/s00125-016-4107-0. [DOI] [PubMed] [Google Scholar]
- 11. Russell SJ, Hillard MA, Balliro C, et al. Day and night glycaemic control with a bionic pancreas versus conventional insulin pump therapy in preadolescent children with type 1 diabetes: a randomised crossover trial. Lancet Diabetes Endocrinol 2016;4:233-243. doi: 10.1016/S2213-8587(15)00489-1. [DOI] [PMC free article] [PubMed] [Google Scholar]
- 12. Brown SA, Breton MD, Anderson S, et al. Artificial pancreas improves glycemic control in a multi-night multicenter outpatient/home study of patients with T1D. Diabetes. 2015;64:A59. [Google Scholar]
- 13. Murphy HR, Kumareswaran K, Elleri D, et al. Safety and efficacy of 24-h closed-loop insulin delivery in well-controlled pregnant women with type 1 diabetes: a randomized crossover case series. Diabetes Care. 2011;34:2527-2529. doi: 10.2337/dc11-1430dc11-1430 [pii]. [DOI] [PMC free article] [PubMed] [Google Scholar]
- 14. Breton M, Farret A, Bruttomesso D, et al. Fully integrated artificial pancreas in type 1 diabetes modular closed-loop glucose control maintains near normoglycemia. Diabetes. 2012;61:2230-2237. [DOI] [PMC free article] [PubMed] [Google Scholar]
- 15. Nimri R, Atlas E, Ajzensztejn M, Miller S, Oron T, Phillip M. Feasibility study of automated overnight closed-loop glucose control under md-logic artificial pancreas in patients with type 1 diabetes: the DREAM project. Diabetes Technol Ther. 2012;14:728-735. [DOI] [PubMed] [Google Scholar]
- 16. Elleri D, Allen JM, Kumareswaran K, et al. Closed-loop basal insulin delivery over 36 hours in adolescents with type 1 diabetes: randomized clinical trial. Diabetes Care. 2013;36:838-844. doi: 10.2337/dc12-0816dc12-0816 [pii]. [DOI] [PMC free article] [PubMed] [Google Scholar]
- 17. Israeli E. Nocturnal glucose control with an artificial pancreas at a diabetes camp. Isr Med Assoc J. 2013;15:255. doi: 10.1056/NEJMoa1206881. [DOI] [PubMed] [Google Scholar]
- 18. Sherr JL, Cengiz E, Palerm CC, et al. Reduced hypoglycemia and increased time in target using closed-loop insulin delivery during nights with or without antecedent afternoon exercise in type 1 diabetes. Diabetes Care. 2013;36:2909-2914. [DOI] [PMC free article] [PubMed] [Google Scholar]
- 19. Harvey RA, Dassau E, Bevier WC, et al. Clinical evaluation of an automated artificial pancreas using zone-model predictive control and health monitoring system. Diabetes Technol Ther. 2014;16:348-357. doi: 10.1089/dia.2013.0231. [DOI] [PMC free article] [PubMed] [Google Scholar]
- 20. Elleri D, Biagioni M, Allen J, et al. Safety, efficacy and glucose turnover of reduced prandial boluses during closed-loop therapy in adolescents with type 1 diabetes: a randomized clinical trial. Diabetes Obes Metab. 2015;17:1173-1179. doi: 10.1111/dom.12549. [DOI] [PMC free article] [PubMed] [Google Scholar]
- 21. Mauseth R, Lord SM, Hirsch IB, Kircher RC, Matheson DP, Greenbaum CJ. Stress testing of an artificial pancreas system with pizza and exercise leads to improvements in the system’s fuzzy logic controller. J Diabetes Sci Technol. 2015;9:1253-1259. doi: 10.1177/1932296815602098. [DOI] [PMC free article] [PubMed] [Google Scholar]
- 22. Jayawardene DC, McAuley SA, Horsburgh JC, et al. Closed-loop insulin delivery for adults with type 1 diabetes undertaking high-intensity interval exercise versus moderate-intensity exercise: a randomized, crossover study. Diabetes Technol Ther. 2017;19:340-348. doi: 10.1089/dia.2016.0461. [DOI] [PubMed] [Google Scholar]
- 23. Russell SJ, El-Khatib FH, Nathan DM, Magyar KL, Jiang J, Damiano ER. Blood glucose control in type 1 diabetes with a bihormonal bionic endocrine pancreas. Diabetes Care. 2012;35:2148-2155. [DOI] [PMC free article] [PubMed] [Google Scholar]
- 24. Van Bon AC, Jonker LD, Koebrugge R, Koops R, Hoekstra JB, DeVries JH. Feasibility of a bihormonal closed-loop system to control postexercise and postprandial glucose excursions. J Diabetes Sci Technol. 2012;6:1114-1122. [DOI] [PMC free article] [PubMed] [Google Scholar]
- 25. Haidar A, Legault L, Dallaire M, et al. Glucose-responsive insulin and glucagon delivery (dual-hormone artificial pancreas) in adults with type 1 diabetes: a randomized crossover controlled trial. CMAJ. 2013;185:297-305. doi: 10.1503/cmaj.121265. [DOI] [PMC free article] [PubMed] [Google Scholar]
- 26. El-Khatib FH, Russell SJ, Magyar KL, et al. Autonomous and continuous adaptation of a bihormonal bionic pancreas in adults and adolescents with type 1 diabetes. J Clin Endocrinol Metab. 2014;99:1701-1711. [DOI] [PMC free article] [PubMed] [Google Scholar]
- 27. Haidar A, Legault L, Messier V, Mitre TM, Leroux C, Rabasa-Lhoret R. Comparison of dual-hormone artificial pancreas, single-hormone artificial pancreas, and conventional insulin pump therapy for glycaemic control in patients with type 1 diabetes: an open-label randomised controlled crossover trial. Lancet Diabetes Endocrinol. 2015;3:17-26. doi: 10.1016/S2213-8587(14)70226-8. [DOI] [PubMed] [Google Scholar]
- 28. Ploug T, Galbo H, Richter EA. Increased muscle glucose uptake during contractions: no need for insulin. Am J Physiol Metab. 1984;247:E726-E731. [DOI] [PubMed] [Google Scholar]
- 29. Wolpert HA. The nuts and bolts of achieving end points with real-time continuous glucose monitoring. Diabetes Care. 2008;31:S146-S149. doi: 10.2337/dc08-s238. [DOI] [PubMed] [Google Scholar]
- 30. McAuley SA, Horsburgh JC, Ward GM, et al. Insulin pump basal adjustment for exercise in type 1 diabetes: a randomised crossover study. Diabetologia. 2016;59:1636-1644. doi: 10.1007/s00125-016-3981-9. [DOI] [PubMed] [Google Scholar]
- 31. Breton MD, Brown SA, Karvetski CH, et al. Adding heart rate signal to a control-to-range artificial pancreas system improves the protection against hypoglycemia during exercise in type 1 diabetes. Diabetes Technol Ther. 2014;16:506-511. [DOI] [PMC free article] [PubMed] [Google Scholar]
- 32. DeBoer MD, Cherñavvsky DR, Topchyan K, Kovatchev BP, Francis GL, Breton MD. Heart rate informed artificial pancreas system enhances glycemic control during exercise in adolescents with T1D. Pediatr Diabetes. 2017;18:540-546. doi: 10.1111/pedi.12454. [DOI] [PubMed] [Google Scholar]
- 33. Stenerson M, Cameron F, Payne SR, et al. The impact of accelerometer use in exercise-associated hypoglycemia prevention in type 1 diabetes. J Diabetes Sci Technol. 2015;9:80-85. doi: 10.1177/1932296814551045. [DOI] [PMC free article] [PubMed] [Google Scholar]
- 34. Cameron FM, Ly TT, Buckingham BA, et al. Closed-loop control without meal announcement in type 1 diabetes. Diabetes Technol Ther. 2017:dia.2017.0078. doi: 10.1089/dia.2017.0078. [DOI] [PMC free article] [PubMed] [Google Scholar]
- 35. Manohar C, O’Keeffe DT, Hinshaw L, et al. Comparison of physical activity sensors and heart rate monitoring for real-time activity detection in type 1 diabetes and control subjects. Diabetes Technol Ther. 2013;15:751-757. doi: 10.1089/dia.2013.0044. [DOI] [PMC free article] [PubMed] [Google Scholar]
- 36. Dasanayake IS, Bevier WC, Castorino K, et al. Early detection of physical activity for people with type 1 diabetes mellitus. J Diabetes Sci Technol. 2015;9:1236-1245. doi: 10.1177/1932296815592409. [DOI] [PMC free article] [PubMed] [Google Scholar]
- 37. Jacobs PG, Resalat N, El Youssef J, et al. Incorporating an exercise detection, grading, and hormone dosing algorithm into the artificial pancreas using accelerometry and heart rate. J Diabetes Sci Technol. 2015;9:1175-1184. doi: 10.1177/1932296815609371. [DOI] [PMC free article] [PubMed] [Google Scholar]
- 38. Turksoy K, Bayrak ES, Quinn L, Littlejohn E, Cinar A. Multivariable adaptive closed-loop control of an artificial pancreas without meal and activity announcement. Diabetes Technol Ther. 2013;15:386-400. doi: 10.1089/dia.2012.0283. [DOI] [PMC free article] [PubMed] [Google Scholar]
- 39. Dasanayake IS, Seborg DE, Pinsker JE, Doyle FJ, Dassau E. Empirical dynamic model identification for blood-glucose dynamics in response to physical activity. In: 2015 54th IEEE Conference on Decision and Control (CDC) Osaka, Japan: IEEE; 2015:3834-3839. doi: 10.1109/CDC.2015.7402815. [DOI] [PMC free article] [PubMed] [Google Scholar]
- 40. Eren-Oruklu M, Cinar A, Rollins DK, Quinn L. Adaptive system identification for estimating future glucose concentrations and hypoglycemia alarms. Automatica. 2012;48:1892-1897. [DOI] [PMC free article] [PubMed] [Google Scholar]
- 41. Karvonen J, Vuorimaa T. Heart rate and exercise intensity during sports activities. Sport Med. 1988;5:303-312. doi: 10.2165/00007256-198805050-00002. [DOI] [PubMed] [Google Scholar]
- 42. Hughes CS, Patek SD, Breton MD, Kovatchev BP. Hypoglycemia prevention via pump attenuation and red-yellow-green “traffic” lights using continuous glucose monitoring and insulin pump data. J Diabetes Sci Technol. 2010;4:1146-1155. doi: 10.1177/193229681000400513. [DOI] [PMC free article] [PubMed] [Google Scholar]
- 43. Breton MD, Cherñavvsky DR, Forlenza GP, et al. Closed loop control during intense prolonged outdoor exercise in adolescents with type 1 diabetes: the artificial pancreas Ski Study. Diabetes Care. 2017;40:1644-1650. doi: 10.2337/dc17-0883. [DOI] [PMC free article] [PubMed] [Google Scholar]
- 44. Bergman RN, Ider YZ, Bowden CR, Cobelli C. Quantitative estimation of insulin sensitivity. Am J Physiol. 1979;236:E667-E677. [DOI] [PubMed] [Google Scholar]
- 45. Houtzager I, van Wingerden JW, Verhaegen M. Fast-array recursive closed-loop subspace model identification. IFAC Proc. 2009;42:96-101. doi: 10.3182/20090706-3-FR-2004.00015. [DOI] [Google Scholar]
- 46. Houtzager I, van Wingerden JW, Verhaegen M. Recursive predictor-based subspace identification with application to the real-time closed-loop tracking of flutter. IEEE Trans Control Syst Technol. 2012;20:934-949. doi: 10.1109/TCST.2011.2157694. [DOI] [Google Scholar]
- 47. Hajizadeh I, Rashid M, Turksoy K, et al. Multivariable recursive subspace identification with application to artificial pancreas systems. Int Fed Autom Control Trienn World Congr. 2017;50:886-891. doi: 10.1016/j.ifacol.2017.08.268. [DOI] [Google Scholar]
- 48. Akaike H. A new look at the statistical model identification. IEEE Trans Automat Contr. 1974;19:716-723. doi: 10.1109/TAC.1974.1100705. [DOI] [Google Scholar]
- 49. Schwarz G. Estimating the dimension of a model. Ann Stat. 1978;6:461-464. doi: 10.1214/aos/1176344136. [DOI] [Google Scholar]
- 50. Keith-Hynes P, Guerlain S, Mize B, Hughes-Karvetski C, Khan M, McElwee-Malloy M, et al. DiAs User Interface: A Patient-Centric Interface for Mobile Artificial Pancreas Systems. J Diabetes Sci Technol. 2013;7(6):1416–26. [DOI] [PMC free article] [PubMed] [Google Scholar]