

Abstract
Microbial air pollution from livestock farms has raised concerns regarding public health. Little is known about airborne livestock-related microbial levels in residential areas. We aimed to increase insights into this issue. Air measurements were performed in 2014 and 2015 at 61 residential sites in The Netherlands. Quantitative-PCR was used to assess DNA concentrations of selected bacteria (commensals: Escherichia coli and Staphylococcus spp.; a zoonotic pathogen: Campylobacter jejuni) and antimicrobial resistance (AMR) genes (tetW, mecA) in airborne dust. Mixed models were used to explore spatial associations (temporal adjusted) with livestock-related characteristics of the surroundings. DNA from commensals and AMR genes was detectable even at sites furthest away from farms (1200 m), albeit at lower levels. Concentrations, distinctly different between sites, were strongly associated with the density of farms in the surroundings especially with poultry and pigs. C. jejuni DNA was less prevalent (42% of samples positive). Presence of C. jejuni was solely associated with poultry (OR: 4.7 (95% CI: 1.7–14), high versus low poultry density). Residential exposure to livestock-related bacteria and AMR genes was demonstrated. Identified associations suggest contribution of livestock farms to microbial air pollution in general and attribution differences between farm types. This supports the plausibility of recent studies showing health effects in relation to residential proximity to farms.
Introduction
Microbial air pollution from the livestock industry has raised concerns about potential public health risks and environmental impact.1 Livestock farms are known to emit microorganisms, some of which are zoonotic pathogens or carriers of resistance to antimicrobials. A series of epidemiological studies identified associations between residential proximity to livestock farms and risk of zoonotic infections and suggest that environmental transmission might play a role.1−8 Only for Q fever, the transmission of the causal bacteria via air has been firmly established; for other zoonotic diseases (campylobacteriosis, methicillin-resistant Staphylococcus aureus (MRSA) colonization), this is still to be ascertained.1,9 Besides infectious diseases, other health outcomes like respiratory health effects and atopic sensitization were found to be associated with livestock density.10−14 The underlying causal mechanisms for these more general health outcomes are unknown; microbial air pollution is suggested to potentially play a role.10−14
Bacteria are highly abundant at farms; major sources are farm animals and their excreta, mainly faeces. Levels of bacteria in indoor air inside farms are high, and a wide variety of species can be present.15,16 The majority of airborne bacteria within farms are attached to dust particles.17,18 These dust particles with associated components can be transported to the outside environment by ventilation. At close distances (<200 m) from farms, elevated levels were measured of several bacteria including livestock commensals (e.g., Escherichia coli and Staphylococcus spp.) but also zoonotic pathogens.18−31Staphylococci were measured at the greatest distances, until up to 400 m.22,23 These studies aimed at tracking the spread of microbial aerosols in the close surroundings of a farm; the methodologies used did not allow for quantification of residential exposures. In the air at farm premises, bacteria that are commensals to livestock animals are detected more often compared to pathogens because of their high abundances.20,27 This makes commensals useful indicator organisms of livestock farm microbial emissions. Recently, also antimicrobial resistant bacteria and antimicrobial resistance (AMR) genes have been measured. Indoor collected air samples frequently contained antimicrobial resistant bacteria and AMR genes, and also, some of the air samples collected outside contained these.16,18,28,30,31 Higher abundances of antimicrobial resistant bacteria and AMR genes have been reported downwind from farms compared to upwind.16,20,28,32
Valuable insights into the role of livestock farms on residential microbial exposures can be gained by environmental sampling. Availability of molecular techniques has opened up the possibility to study microbial air pollution at further distances from farms, yet there is a lack of studies measuring livestock-related microbes and their constituents in air at distances where neighboring residents are living. Measurement studies performed thus far focused mainly on endotoxin (inflammatory cell wall component of Gram-negative bacteria), assessed by a biological assay.33−38 A recently performed study on Coxiella burnetii (zoonotic pathogen) showed the possibilities of applying molecular techniques in combination with air sampling at residential sites.39 Gaining knowledge on other microbial exposures in air at residential sites in livestock dense areas is of great significance for public health assessment.
Hence, we performed an extensive measurement study aimed at sampling livestock-related microbial concentrations in ambient air at residential sites. Our objective was to gain insight into airborne concentrations at the residential level of livestock-related commensals, pathogenic bacteria, and AMR genes. Since levels at residential distances were expected to be considerably lower compared to levels at farms, we integrated long-term sampling with qPCR analyses to enable quantitative estimation of the microbial load. A high number of sites (n = 61) were included, as we aimed to gain profound insight into spatial variation. Sites were measured repeatedly over the course of 1.5 years, providing insight into temporal variation. Additionally, our goal was to explore spatial associations between microbial concentrations in air with livestock-related characteristics of the surroundings by using detailed farm information.
Methods
Study Design
In total, five gene targets were analyzed in this study. Genes from Escherichia coli and Staphylococci were included to represent, respectively, Gram-negative and Gram-positive bacterial livestock commensals. E. coli and Staphylococcus spp. are omnipresent at farms of all types; hence, these are considered general markers for livestock-related air pollution. In addition, two general AMR genes were included, tetW and mecA, both related to antibiotic classes widely used in the livestock industry (tetracyclines, penicillins). Besides these four microbial markers for livestock emissions in general, also a gene target for Campylobacter jejuni was analyzed. Campylobacter jejuni is a mainly poultry-related zoonotic pathogenic bacterium.
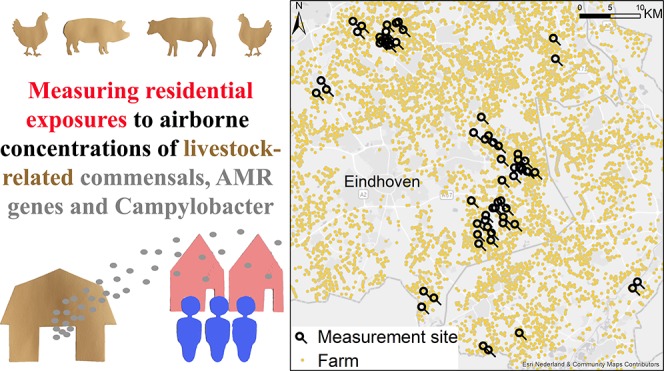
These five gene targets were tested in airborne dust samples collected. In order to represent residential exposure to microbial air pollution optimally, airborne dust samples were collected at average breathing height (1.6 m) in residential yards. Particulate matter samples with a nominal aerodynamic diameter below 10 μm (PM10) were collected to ensure that only particles small enough to be inhaled by humans were collected. The air measurement campaign was performed in the years 2014 and 2015 as part of the “Livestock Farming and Neighboring Residents’ Health” (VGO) project; see de Rooij et al. for a complete overview.33 In short, 2-week average air samples were collected repeatedly at 61 residential sites in a region with high livestock density in the Southeast of The Netherlands (see Figure S.1 in the Supporting Information for a map of the study area: 3000 km2 in size, no elevations). Sites were selected to cover a wide spatial contrast in density of livestock farms and animal species kept. To ensure coverage of the expected highest local-scale air pollution variation in the vicinity of farms, we chose to over-represent sites close to livestock farms, resulting in 40% of sites at <250 m from a farm, 35% at 250–500 m, 18% at 500–1000 m, and 7% at >1000 m. Attention was paid to ensuring a geographical spread of sites throughout the study area and a distribution without major outliers for farm densities over the different sites. The following inclusion criteria were kept: at least 500 m away from an industrial site and at least 500 m distance between measurement sites. The aim was to sample each site four times, spread over the seasons. Per measurement period, around 10 sites were sampled simultaneously (restricted by availability of equipment); it was taken care of that this set of 10 sites was spread throughout the area and that sites located close to farms, as well as further away, were represented. In addition, a reference site was included which was located in the middle of the study area, more than 1 km away from the nearest farm. The reference site was sampled during the whole duration of the measurement campaign. Parallel sampling was performed at the reference site to gain insight into variability between samples collected simultaneously side by side. During each measurement period, a field blank control was placed at a different site. This field blank filter underwent the same procedure except that no air was drawn through the sampling device.
Sampling
Harvard Impactors (Air Diagnostics and Engineering Inc., Naples, ME, USA) were used to collect PM10 on Teflon filters (Teflo W/ring 37 mm with 2 μm pore size; SKC, Pennsylvania, USA). Samples were taken at a height of 1.6 m, the average breathing height of humans. A pump with critical orifices was used to maintain the flow at 10 L/min. To avoid filter overloading, pumps were installed to sample 15 min of each hour during the 14-day sampling period so each filter represented a 14-day average Total sampling volume was calculated on the basis of the total sampling time and the measured average flow. Samples were stored within 72 h after collection at −20 °C.
Sample Processing
Filters collected during the same measurement period were processed in one run of extraction. In each run, a blank filter was processed in parallel. Total DNA in the PM10 dust captured on filters was extracted by using the NucliSENS Magnetic bead DNA extraction kit (Biomerieux-diagnostics, Marcy l’Etoile, France) with some adaptions to the manufacturer’s instructions. In short, filters were added to 15 mL tubes containing a mixture of 3.5 mL of NucliSENS Lysisbuffer and 3.5 mL of phosphate buffered saline (PBS). Samples were incubated for 30 min at room temperature on an orbital shaker at 250 rounds/min, after which the fluid was transposed to a new 15 mL tube. To each tube, 30 μL of a quantified DNA solution was added to serve as an internal control for both extraction and qPCR amplification. This DNA solution contained a 424 base pair sequence which was amplified from the blue fluorescent protein (BFP) gene contained in the pRSET/BFP bacterial expression vector (Invitrogen); see the Supporting Information for further details. The NucliSENS Magnetic Beads suspension (50 μL) was added and mixed, followed by incubation at room temperature for 10 min. Subsequently, the magnetic beads containing DNA were washed according to the manufacturer’s recommendations. Small modifications to the procedure were applied as described before (de Bruin et al., 2011). DNA yield from the beads was optimized by repeating the elution with 50 μL of elution buffer to obtain 100 μL of DNA solution. This solution was stored at −70 °C until further processing.
Quantitative PCR Analyses
Several quantitative PCR analyses were performed to quantify DNA signature sequences from bacteria and antimicrobial resistance genes in the ambient PM10 fraction. Detection of Campylobacter jejuni DNA was performed using the assay described by Jensen et al.40Escherichia coli DNA was determined by means of the previously described assay,41 which was adapted to allow detection of both uidA (E. coli target) and BFP (blue fluorescent protein, the control for DNA extraction and qPCR amplification; see the Supporting Information for details). Initial validation showed that assay performance, including limit of detection (LOD), was unaffected by the presence of other primer/probe sets. The assay described by Kilic et al.42 was used for detection of DNA of Staphylococcus spp. (tuf) and DNA of methicillin resistance gene (mecA). Quantification of DNA of tetracycline resistance gene (tetW) was performed using the assay described by Walsh et al.43 with minor modifications (increased primer (600 nM) and probe (200 nM) concentrations, decreased annealing temperature from 60 to 59 °C). See the Supporting Information for a description of gene targets, primer and probe sequences per gene targets, and protocols including number of cycles, times, and temperature per gene target. Analyses of tetracycline resistance gene (tetW) were performed on a Bio-Rad CFX384 instrument (product-number: 1855485, Bio-Rad, Hercules, California). All other qPCR analyses were performed on a Lightcycler 480 instrument, Roche, Basel, Switzerland). Negative controls (no template) and positive controls were included for each PCR run. To avoid inhibiting effects of dust, an adequate dilution was established on the basis of the threshold cycle number (Ct) of the BFP internal control. Samples were tested at 1:10 dilution using 3 μL of DNA template per reaction well in triplicate for all genes, except for tetW which was tested in duplicate and in 1:100 dilution.
Calibration Curves and Calculation of LOD
For each gene target, calibration curves were implemented using serial dilutions of positive control DNA at known concentrations; see the Supporting Information for the dilution series per gene target. The limit of detection (LOD) expressed as cycle number (Ct) was determined by means of the receiver operating characteristic (ROC) curve as described previously.44 In short, the optimal LOD is based on maximization of the Youden index which is a combination of sensitivity and specificity. Specificity was determined using the outcomes of the no template controls. Sensitivity was determined using the calibration curves. Computation of LOD based on maximization of the Youden index was not possible for the C. jejuni target, as none of the no template controls yielded a Ct value (thus no false positives); hence, LOD was determined using the probability of detection method as described previously by Nutz et al. set at 99%.44 See the Supporting Information for specification of the Youden index and LOD per gene target.
The calibration curve was obtained through a log–linear fit between copy-number concentrations in standard samples and corresponding Ct values. First, PCR results <LOD were excluded. Next, outliers were excluded through an iterative process: every iteration, a log–linear model was fitted and residuals assessed for outliers (defined as < first quartile minus 1.5 times IQR or > third quartile plus 1.5 times IQR) and the outlier with the highest Ct-value was removed; this process was repeated until no outliers were present. At the end, for each gene target, the calibration curve formula was plotted against the standard samples of the dilution series and visually checked for coherence. See the Supporting Information for formulas of calibration curves.
Data Processing
To allow quantitative estimations based on all outcomes of the triplicate/duplicate tests per sample, imputations were performed for results of the triplicate/duplicate tests having an outcome below LOD (e.g., sample tested in triplicate with one outcome above LOD, the other two below LOD; the two outcomes below LOD are imputed to allow averaging over all three outcomes taking all information into account). Multiple imputation of outcomes below LOD for each gene target were processed using Bayesian statistics. This was only applied for gene targets where minimally two-thirds of the samples had a Ct value above LOD for at least 1 out of 3 of the triplicate (or 1 out of 2 for the duplicate outcomes for tetW). For gene targets not meeting this criterion (results showed this to be the case for C. jejuni), a sample was defined as either positive or negative (positive sample: at least one of the triplicates having an outcome above LOD). Ct values per reaction well were estimated using a censored regression model that included outcomes of the other reaction wells of that sample (testing was in triplicate/duplicate), location, and measurement period as random effects. Results obtained at the reference site across all measurement periods were used to improve estimation of (random) measurement period effects by including these in a bivariate normal model (for the formula of the full model, see the Supporting Information). The model was estimated in a Bayesian framework using MCMC methods as implemented in the R-package rjags, using uninformative (or weakly informative) priors for random effects, regression coefficients, and (residual) precisions (R studio - version 3.3.3 was used45).
The resulting data were used to compute the mean Ct per sample for each gene target based on the Ct values of the reaction wells per triplicate/duplicate. Then, by using the calibration curve formula, the copy number per sample was computed. Using the sampling volume (the amount of air drawn through the filter) in combination with the reaction well volume plus extraction volume and dilution, the number of copies per cubic meter of air was calculated per sample. Field blank correction per gene target was performed when more than 10% of the field blanks yielded Ct values above LOD (results showed this to be the case for Staphylococcus spp.). In that case, to account for potential contamination, the average concentration of the field blanks was subtracted from the copy number per sample before calculation of the number of copies per cubic meter of air.
Livestock-Related Determinants
Geographical Information System (GIS) software (ArcGIS, version 10.2.2.) was used to compute general and detailed livestock characteristics of the surroundings around the measurement sites (see Table S.1 for descriptives of livestock characteristics around sites). Coordinates of the locations of all livestock farms and the number and species of licensed animals per farm in the year 2015 were used. These were obtained from the provincial database of mandatory environmental licenses for livestock keeping, as provided by the provinces of Noord-Brabant (http://bvb.brabant.nl) and Limburg (http://limburg.vaa.com/webbvb). The available farm data did not entail information on antibiotic usage. The main animal species kept in the livestock industry in The Netherlands are the following: poultry, pigs, cows, horses, goats, sheep, and fur animals. We calculated distances to the nearest farm and the number of farms/animals in buffers of 1000 and 3000 m around the site (buffer size was restricted to 3000 m because of proximity to country borders). We also calculated the distance weighted number of farms/animals in these buffers (Σ(N/m), e.g., summation (n/distance in m) for all farms in the buffer). Each livestock-related predictor was truncated to its 95th percentile value in line with de Rooij et al. 2018.33 This was done because various livestock-related predictors showed a right-skewed distribution among measurement sites
Statistical Analyses
Descriptive analyses were performed. For C. jejuni, the proportion of samples being positive was assessed. For the other gene targets, due to skewness of the distribution of concentrations, a log-transformation was performed. Correlations (Pearson and Spearman) between concentrations of the various gene targets were assessed.
Mixed modeling was performed to assess associations with livestock-related characteristics of the surroundings whereby the nature of repeated measurements was taken into account (random intercept per location; see the Supporting Information for model equations). Due to the widely different scales of the different livestock-related characteristics, each predictor was scaled from the 10th percentile to 90th percentile range, making direct comparisons of the magnitude of associations of livestock-related predictors possible. Linear mixed modeling was performed on log-transformed concentrations of commensal bacteria and AMR genes. Estimates of associations were exponentiated to represent ratios in concentrations. Logistic mixed modeling was performed for C. jejuni (C. jejuni was assessed binary(absence/presence), since criteria for applying multiple imputations was not met); consequently, associations were expressed in odds ratios. Associations were adjusted for temporal variation by including the concentrations (log-transformed) measured at the reference site into the model (linear mixed modeling) or by including the binary outcome (negative or positive) at the reference site into the model (logistic mixed modeling). Mixed modeling per gene target for every general livestock characteristic (all farm types taken together) was performed to assess associations and thereby gain insight into the relevance of the number of livestock farms and distances to livestock farms. Next, mixed modeling per gene target was performed using more detailed characteristics: information on animal species (pig, poultry, cattle, horse, goat, sheep, or fur animals farm) and number of animals (per animal species) were included. Then, mixed modeling per gene target including all animal species together was performed to assess mutually adjusted associations. Model assumptions were checked including distribution of residuals and spatial autocorrelation though Moran’s I statistic.
As an additional analysis, gene targets’ concentrations were compared to endotoxin and PM10 concentrations, as assessed previously within this air measurement campaign.33 Several sensitivity analyses were performed. Multivariable analyses with exclusion of the animal species determinant with the highest variance inflation factor were performed to check for potential disturbances of associations due to collinearity. In the case of a considerable change in the estimate of statistically significant associations after adjustment for other animal species, further model checking was performed by assessing the effects of excluding other animal species as a determinant. Results of all analyses are shown, either in the main text or in the Supporting Information.
Results
Concentrations/Levels
In total, 235 samples were successfully collected at 61 measurement sites, with 2, 3, 4, and 5 times successful sampling at 1, 9, 49, and 2 sites, respectively. The reference site was sampled successfully for every measurement period except for the first period due to a loss of power supply to the pump. DNA of livestock-related bacteria and AMR genes was found to be present in ambient air at residential sites within a livestock dense area. The majority of gene targets had high percentages of positive samples (at least one within a triplicate/duplicate having an outcome above LOD), except C. jejuni (E. coli - 75%, Staphylococcus spp. - 95%, mecA - 88%, tetW - 95%, C. jejuni - 42%; see Table S.2). Consequently, for C. jejuni, no multiple imputations were performed and binary analyses were carried out. Nearly all of the field blanks were negative for most gene targets (percentage positives of 0% to max 6%) except for Staphylococcus spp. (32%). Hence, Staphylococcus spp. concentrations of DNA in samples were adjusted for (potential) contamination by subtracting the average concentration of field blanks (9.1 × 10³ gene copies/sample).
The distributions of airborne concentrations of livestock commensal bacteria and AMR genes were skewed (see Figure S.2). Samples with outlying high values were present for each target; however, absolute concentrations measured differ per gene target (95th percentile for E. coli, Staphylococcus spp., tetW, and mecA: 2.5 × 10², 3.7 × 10⁴, 1.8 × 10⁵, and 1.8 × 10² (copies/m3), respectively). For each gene target, the concentration of samples collected side by side at the reference site showed a high level of agreement (see Figure S.3 for correlation plots; range in Pearson correlations of 0.93–0.97; range in Spearman correlations of 0.84–0.93; range in mean coefficients of variation of 2.7–15%), indicating limited sampling variability for each gene target.
Variation in Time and Space
Clear variation between sites and over time was observed (see Figure 1). Figure 1A shows the concentrations of livestock commensals and AMR genes measured during the whole campaign, and Figure 1B shows the proportion of samples positive for C. jejuni over time; per measurement period (14 days), the reference site and around 10 sites were included. Gene targets were detected both at residential sites located close to a farm (250 m) as well as residential sites located further away from a farm (>1000 m); concentrations showed a decreasing trend with increasing distance from the nearest farm (see Figure S.4). The spatial variation in DNA concentrations was smaller than the temporal variation, with the ratio of mean variance between locations over total variance (mean variance between locations + mean variance between measurement periods) being for E. coli, Staphylococcus spp., tetW, and mecA: 0.31 (90% CI: 0.21–0.42), 0.14 (90% CI: 0.07–0.23), 0.17 (90% CI: 0.10–0.26), 0.26 (90% CI: 0.15–0.36), respectively. The pattern in variation over time was comparable for the different gene targets; correlations between gene target concentrations measured at the reference site during the 26 two-week periods were strong (range in Pearson correlations: 0.71–0.91; see Figure S.5).
Figure 1.

(A) Overview of concentrations in ambient air of livestock commensal bacteria and AMR genes over time measured repeatedly at 61 sites in sets of 10 sites per measurement period and continuously at the reference site (panel A, E. coli; panel B, Staphylococcus spp.; panel C, tetW; panel D, mecA). Note: Dual y-axes; the left y-axis represents concentrations in ln copies/m3, and the right y-axis represents concentrations in copies/m3. RF site is reference site; Sites Av is average concentration over all measurement sites during the measurement period; Sites are measurement sites (in total 61). (B) Overview over time of the proportion of samples containing C. jejuni DNA—ambient air samples collected repeatedly at 61 sites in sets of 10 sites per measurement period and continuously at the reference site. Note: The bars marked with a black dot mean positive samples at the reference site in the corresponding measurement period.
Variation within sites markedly decreased after adjustment for temporal variation using the concentrations measured over time at the reference site, supporting the usefulness of a reference site for these markers (Figure S.4). The effect on rank classification due to temporal adjustment was minimal (intraclass correlation coefficient of 0.94, 0.94, 0.89, and 0.93 for E. coli, Staphylococcus spp., tetW, and mecA, respectively). Residual temporal variation remained despite adjustment for temporal variation, as expected, since this adjustment cannot account for local effects. The within site variance was smaller than the between site variance (ratio of between site variance/within site variance of 1.81, 3.68, 2.13, and 2.57 for E. coli, Staphylococcus spp., tetW, and mecA, respectively). Spatial correlation between gene target concentrations was slightly less strong than temporal correlation (Figure 2 and Figure S.5). The range in correlations was 0.66–0.81 for spatial correlation and 0.71–0.91 for temporal correlation.
Figure 2.

Correlation between temporal adjusted site-average DNA concentrations of the gene targets at 61 sites plotted against each other in the lower panel, together with the Pearson correlation coefficient in the upper panel. Note: The axes represent concentrations expressed in ln copies/m3. The red line is based on the LOESS smoothed fit. *** = P-value < 0.001.
DNA concentrations of livestock commensal bacteria and AMR genes were weakly to moderately correlated with previously reported endotoxin and PM10 concentrations (see Table S.3). Pearson correlations between gene target DNA and PM10 concentrations were low for temporal and spatial variation (0.32 with mecA for spatial variation and with E. coli for temporal variation, lower with other gene targets). Spatial correlations between gene target DNA concentrations and endotoxin concentrations were stronger (0.45–0.57) compared to temporal correlation (0.23 with E. coli and with tetW, lower with other gene targets).
Associations with Livestock-Related Determinants
Concentrations measured in air at residential sites were strongly related to general livestock characteristics of the surroundings (all farm types taken together); see Table 1 for results of these analyses and see Figure 3 for the visual representation of the association between the distance weighted number of farms with the concentrations measured. Associations were strongest when the number of farms weighted to distance in a 3000 m buffer were considered, highlighting the importance of taking into account the number of farms together with proximity. Analyses with distance weighted predictors, including information on farm type and the number of animals (per animal species), showed strong associations with especially pigs, poultry, and cattle (see Table S.4, associations unadjusted for other animal species). The animal species the most strongly associated differed between gene targets (strongest association: tetW, mecA, and C. jejuni - poultry; E. coli - pigs; Staphylococcus spp. - cows). Most of these strongest associations remained after adjustment for other animal species (see Table 2). There were generally moderate to low correlations between the number of animals/farms of different species/types (see Figure S.7).
Table 1. Temporal Adjusted Associations of General Livestock Characteristics with Airborne Bacteria and AMR Genes Measureda.
| commensal bacteria (ln copies/m3) |
AMR genes (ln copies/m3) |
pathogenic bacteria (0/1) |
|||||||||||||
|---|---|---|---|---|---|---|---|---|---|---|---|---|---|---|---|
|
E. coli |
Staph spp. |
tetW |
mecA |
C. jejuni |
|||||||||||
| variables (scaled 10th–90th percentile) | ratio | CI LB | CI UB | ratio | CI LB | CI UB | ratio | CI LB | CI UB | ratio | CI LB | CI UB | OR | CI LB | CI UB |
| distance site to nearest livestock farm (−1 * m) | 1.51* | 1.01 | 2.25 | 1.80 | 0.90 | 3.63 | 1.67* | 1.08 | 2.56 | 1.77 | 1.00 | 3.16 | 2.39* | 1.13 | 5.53 |
| distance site to nearest livestock farm (m–1) | 1.86* | 1.20 | 2.89 | 1.97 | 0.90 | 4.35 | 2.08* | 1.28 | 3.32 | 1.92 | 1.00 | 3.67 | 2.32* | 1.02 | 5.67 |
| N livestock farms within 250 m buffer | 1.57* | 1.15 | 2.14 | 1.35 | 0.76 | 2.39 | 1.60* | 1.14 | 2.25 | 1.36 | 0.85 | 2.18 | 1.71 | 0.95 | 3.22 |
| N livestock farms within 500 m buffer | 2.41* | 1.57 | 3.71 | 2.41* | 1.07 | 5.42 | 2.12* | 1.30 | 3.46 | 2.39* | 1.25 | 4.62 | 2.43* | 1.03 | 6.28 |
| N livestock farms within 1000 m buffer | 2.36* | 1.48 | 3.82 | 4.18* | 1.82 | 9.49 | 2.44* | 1.45 | 4.10 | 2.64* | 1.32 | 5.31 | 3.98* | 1.62 | 11.03 |
| N livestock farms within 3000 m buffer | 2.66* | 1.79 | 3.94 | 4.35* | 2.14 | 8.85 | 2.36* | 1.51 | 3.71 | 3.94* | 2.23 | 6.89 | 3.03* | 1.36 | 7.38 |
| N farms weighted to distance in 1000 m buffer (Σ(N/m)) | 2.51* | 1.68 | 3.78 | 3.29* | 1.54 | 6.96 | 2.51* | 1.60 | 3.97 | 2.53* | 1.36 | 4.76 | 3.26* | 1.45 | 8.13 |
| N farms weighted to distance in 3000 m buffer (Σ(N/m)) | 3.16* | 2.14 | 4.66 | 5.05* | 2.44 | 10.49 | 2.92* | 1.86 | 4.57 | 4.06* | 2.25 | 7.39 | 3.85* | 1.68 | 9.84 |
Mixed modeling was performed per livestock characteristic for each gene target. Associations were adjusted for temporal variation by taking into account concentrations measured at reference site. Ratio = estimate of association exponentiated to represent ratio in concentration when comparing the predictor 10th percentile to the 90th percentile. OR = odds ratio. CI LB/CI UB = 95% confidence interval; lower bound, upper bound, respectively. Predictor variables truncated to 95th percentile and then scaled to 10–90 percentile range, thus predictor values divided by 10–90 percentile range of that predictor. Σ(N/m) = summation weighted distance to a farm (1/distance in meters) for all farms in the buffer. For all values marked with *, P-value < 0.05.
Figure 3.

Scatterplots showing the associations between airborne DNA concentrations of gene targets with distance weighted number of farms in the surroundings of residencies. Note: The dashed line represents the linear regression fitted line (all p-values <0.0001).
Table 2. Results of Multivariable Modeling for Each of the Measured Airborne Bacteria and AMR Genes Showing Mutually Adjusted Associations with Animal-Species-Specific Livestock Characteristicsa.
| commensal
bacteria (ln copies/m3) |
AMR genes (ln copies/m3) |
pathogenic
bacteria (0/1) |
|||||||||||||
|---|---|---|---|---|---|---|---|---|---|---|---|---|---|---|---|
|
E. coli |
Staph spp. |
tetW |
mecA |
C. jejuni |
|||||||||||
| variables (scaled 10th–90th percentile) | ratio (unadjusted) | CI LB | CI UB | ratio (unadjusted) | CI LB | CI UB | ratio (unadjusted) | CI LB | CI UB | ratio (unadjusted) | CI LB | CI UB | OR (unadjusted) | CI LB | CI UB |
| N pigs weighted to distance in 3000 m buffer | 3.06* (3.16) | 1.80 | 5.26 | 1.90 (3.42) | 0.64 | 5.58 | 2.36* (2.69) | 1.27 | 4.35 | 1.86 (3.25) | 0.83 | 4.18 | 2.13 (3.64) | 0.62 | 7.42 |
| N poultry animals weighted to distance in 3000 m buffer | 1.77* (2.51) | 1.14 | 2.77 | 2.53* (4.01) | 1.03 | 6.23 | 2.41* (2.80) | 1.43 | 4.01 | 3.90* (5.10) | 1.99 | 7.69 | 4.71* (5.69) | 1.71 | 13.98 |
| N cows weighted to distance in 3000 m buffer | 0.77 (2.69) | 0.38 | 1.55 | 1.21 (4.62) | 0.29 | 5.10 | 0.80 (2.44) | 0.35 | 1.80 | 1.14 (3.90) | 0.39 | 3.29 | 1.22 (3.58) | 0.24 | 6.38 |
| N horses weighted to distance in 3000 m buffer | 1.40 (1.49) | 0.85 | 2.29 | 2.32 (2.69) | 0.84 | 6.30 | 1.55 (1.65) | 0.88 | 2.75 | 1.38 (1.63) | 0.65 | 2.92 | 0.82 (0.83) | 0.26 | 2.59 |
| N goats weighted to distance in 3000 m buffer | 1.14 (1.20) | 0.71 | 1.80 | 1.17 (1.99) | 0.45 | 3.03 | 1.08 (1.27) | 0.64 | 1.86 | 1.16 (1.63) | 0.57 | 2.36 | 0.90 (1.12) | 0.30 | 2.68 |
| N sheep weighted to distance in 3000 m buffer | 0.87 (1.36) | 0.59 | 1.27 | 0.95 (1.72) | 0.44 | 2.05 | 0.75 (1.20) | 0.49 | 1.16 | 0.76 (1.62) | 0.43 | 1.36 | 0.75 (1.78) | 0.30 | 1.83 |
| N fur animals weighted to distance in 3000 m buffer | 1.13 (1.65) | 0.79 | 1.62 | 1.32 (1.92) | 0.64 | 2.77 | 1.20 (1.60) | 0.79 | 1.80 | 1.21 (1.73) | 0.70 | 2.10 | 0.88 (1.48) | 0.38 | 2.04 |
Multivariable mixed modeling was performed for each gene target. Models included all seven animal species together; associations were adjusted for temporal variation by taking into account concentrations measured at reference site. Model residuals met the criteria of normality, homoscedasticity, and spatial independency (Moran’s I was not significant). Predictor variables truncated to 95th percentile and then scaled to 10–90 percentile range, thus predictor values divided by 10–90 percentile range of that predictor. Ratio = estimate of adjusted association exponentiated to represent ratio in concentration when comparing the predictor 10th percentile to the 90th percentile. OR = odds ratio. In lightface font within parentheses are unadjusted ratios, thus not adjusted for the presence of other animal species (see Table S2). CI LB/CI UB = 95% confidence interval; lower bound, upper bound, respectively. Unit of variables (Σ(n/m)) = summation weighted distance number of animals present at a farm (n animals/distance in m) for all farms in the buffer. For all values marked with *, P-value < 0.05. VIF value of 4.1 for “N cows weighted to distance in 3000 m buffer”, other predictors <3.
Table 2 shows the results of multivariable modeling performed per gene target including all seven animal species. Ambient air DNA concentrations of mecA were found to be independently associated with the “distance weighted number of poultry”. Concentrations of mecA were 3.9 times higher when the “distance weighted number of poultry” was high (90th percentile) compared to a low “distance weighted number of poultry” (10th percentile). DNA concentrations in ambient air of E. coli as well as tetW were found to be independently associated with the “distance weighted number of pigs” and the “distance weighted number of poultry animals”. The ratio in E. coli concentrations associated with the “distance weighted number of pigs” and “distance weighted number of poultry” was 3.1 and 1.8, respectively. For tetW concentrations, this ratio was, for both predictors, 2.4. Results of multivariable models also showed relatively high ratios for several other animal species that did not reach statistical significance (e.g., ratio of 2.32 for “distance weighted number of horses” in relation to Staph spp. concentration). Multivariable logistic analyses on C. jejuni results showed the “distance weighted number of poultry” to be independently associated with odds of an ambient air sample to be positive (odds ratio of 4.71). For Staphylococcus spp., differences in associations before and after mutual adjustment were apparent, especially for the predictor “distance weighted number of cows”. More insight into this was gained by sensitivity analyses.
Sensitivity Analyses
Independently associated predictors (see Table 2) were robust to exclusion of the predictor with the highest variance inflation factor (4.1), “distance weighted number of cows”, from the multivariable model (see Table S.5). Additional investigations for Staphylococcus spp. showed that, when the predictor “distance weighted number of poultry” was excluded, no other predictor was significantly associated with DNA concentrations of Staphylococcus spp. (see Table S.6). Exclusion of the predictor “distance weighted number of pigs” from the full multivariable model did not change the association of “distance weighted number of poultry” with Staphylococcus spp. Pearson correlation between the predictor “distance weighted number of cows” and the predictors “distance weighted number of pigs” and “distance weighted number of poultry” was 0.72 and 0.55; respectively (see Figure S.7). Taking these results together, the difference in association with Staphylococcus spp. concentration before and after mutual adjustment could be explained by spatial relatedness between these livestock characteristics.
Discussion
This study shows that livestock-related bacteria (commensals, Campylobacter jejuni) and antimicrobial resistance genes (tetW, mecA) can be detected in air also at greater distances (more than several hundred meters) from farms, extending to distances at which residential areas are located. This indicates that microbial exposure, resulting from livestock emissions, occurs in these residential areas. Detectable levels of DNA of the bacterial and AMR genes were measured across the measurement area (surface 3000 km2). Even at sites located the furthest away from farms (1200 m distance) detectable levels of bacteria and resistance genes were found, albeit at lower quantities. We observed large temporal and spatial variations in airborne concentrations within the study area. The spatial variation observed was strongly associated with livestock densities in the surroundings; this suggests contribution of livestock industry to microbial air pollution in general. In addition, results suggested differences in contribution between farm types to airborne concentrations measured. The findings of this study are a crucial step toward assessment of environmental impact and ultimately public health relevance.
Insights in Microbial Airborne Exposures
A high percentage of the collected air samples yielded detectable DNA levels for livestock commensal bacteria and AMR genes. In contrast to highly abundant commensal bacteria, the percentage of air samples containing C. jejuni DNA was considerably lower. This was expected, since C. jejuni bacteria (pathogens) are not as omniprevalent at livestock farms as E. coli and staphylococci. Higher DNA concentrations were measured for Staphylococcus spp. compared to E. coli. Dominance of staphylococci was also described in studies measuring bacteria in the air within farms.16,46−52 McEachran et al. showed airborne AMR genes to be highly prevalent in close vicinity to farms; we included further distances from farms and showed high abundances of AMR genes (tetW and mecA) also at these distances.20
All gene targets were significantly related to the number of farms in the surroundings as well as the distances to these farms. The number of farms weighted to distance in a 3000 m buffer had the strongest relation with measured levels. This confirms the dilution effect of microbial emissions away from the source and underpins the relevance of the collection of farms in the surroundings instead of solely the nearest farm. This finding also suggests that farms potentially contribute to residential exposures at distances up to 3000 m. Microbial emissions being able to travel large distances are not unexpected given the dispersion of particulate matter to which the biological components adhere. It is known that PM10 particles are able to disperse up to several kilometers from a source, smaller particles even further,53 and this has also been shown for PM emissions from livestock farms.54 Research done on Q fever epidemics indicated dispersion of airborne Coxiella burnetii bacteria from farms to its surroundings to be far; results suggested distances traveled of over 5 km.9 Both livestock-related commensals and AMR gene concentrations were strongly related to livestock characteristics of the surroundings, indicating the usefulness of these gene targets as markers for livestock-related microbial air pollution at residential distances. This was expected, since E. coli and staphylococci are known to be ubiquitous in all livestock animals and the studied AMR genes (tetW and mecA) will be present in Dutch livestock farms of all types, as usage of penicillins and tetracyclines is widespread.55
Multivariable analyses enabled identification of independently associated animal species. Poultry was the only animal species associated with the presence of C. jejuni DNA in ambient air, in line with C. jejuni generally being considered a typical poultry-related pathogen.56 Animal species that remained associated with measured ambient concentrations of livestock commensals and AMR genes after adjustment for other animal species were poultry and pigs. The robustness of these associations was confirmed by sensitivity analyses. The strength of the associations varied for the different gene targets. This likely reflects differences in composition of bioaerosol concentrations in farms indoors between farm types, with absolute as well as relative differences in concentrations between various bioaerosols. Despite indications for associations between animal density and increased ambient bioaerosol concentrations for animal species other than pigs and poultry, these were not identified as significantly associated in multivariable analyses. This may be due to several reasons: effects being subtle and hence limitations in the power of this study to pick these up, more limited animal density contrasts, and spatial inter-relatedness with other animal species complicating disentangling of effects.
Concentrations varied noticeably over time for all targets in this livestock dense area. Likely, this is due to complex co-occurrences of effects of meteorological conditions and time-varying emissions of farms. Emission levels of microbial air pollution are known to vary over time for farms of all types.21,27,29,49,57,58 The transport of bioaerosols in ambient air is known to be affected by meteorological conditions, which also affect viability of micro-organisms and decay of DNA.59 Microbial air pollution at residential sites to considerably vary over time offers the possibility to investigate acute effects of peaks of exposure. As we did not have data on time-varying emissions, we did not attempt to model temporal variation. Studies measuring exposure to endotoxin (another livestock-related microbial air pollutant) in rural areas also showed substantial variation over time.34−38 These results stress the importance of taking into account temporal adjustment when studying spatial variation in microbial air pollution. As no routine monitoring data of microbial air pollution is available, this requires installment of a reference site within the studied area which is sampled for the whole duration of the measurement campaign.
We previously showed that concentrations in ambient air of endotoxin, also a marker of bacterial exposure, were associated with livestock farm density in the surroundings.33 Interestingly, DNA concentrations of livestock commensals and AMR genes showed only modest temporal and moderate spatial correlation with endotoxin concentrations. This may partially be explained by the observation that the strength of the correlation between endotoxin concentrations and bacterial concentrations in air inside farms differed per bacteria species.46,49 Moreover, endotoxin can be derived from all Gram-negative bacteria species, not solely animal-related bacteria species, and may therefore be affected by other sources of bacteria in the environment. Measurement sites were selected not to be near industrial sites, avoiding proximity of major sources like composting sites, manure-processing facilities, and food-processing plants. Small local sources contributing to measured endotoxin concentrations could however have occurred.33 Livestock commensals and AMR genes appeared, compared to endotoxin, more specific markers for livestock-related air pollution. Spatial variation of concentrations of livestock commensals and AMR genes were more profound, results did not pinpoint one of the gene targets as the best representative.
Issues Related to the Methodology Used
Our objective was to gain insight into residential exposures at a high number of sites and to study differences in concentrations between sites. Exposure levels were expected to be considerably less at these distances from farms; therefore, long-term sampling in combination with qPCR analyses was performed. Quantitative PCR analyses in combination with long duration sampling allowed aerosolized bacteria to be quantified even at low levels and are not hampered by decreased culturability (e.g., due to airborne sampling itself). This could not have been achieved with culture-based methods, as those only allow for short-term sampling, since viability issues with captured bacteria intensify over time. Consequently, the number of samples needed to accurately assess residential exposures and differences between residential sites would be unfeasibly high, as these depend upon longer-term averages to diminish potential unrepresentativeness of snapshot moments. A drawback of qPCR analyses is unknown viability status of the bacteria, which is of relevance for health risks due to pathogens. Studies performed so far have reported the majority of livestock-related bacteria within the air surrounding a farm to originate from that farm.58 Attribution to other sources than livestock farms on the airborne DNA concentrations measured at the residential sites cannot be excluded, but if they have contributed, a limited and random effect is to be expected due to applied selection criteria for measurement sites (not near industrial sites). Furthermore, measurement sites were properly geographically distributed with respect to distance to the nearest farm; sites located close to a farm, further away, and far away were scattered throughout the study area.
Human Health Implications
Several studies performed in North America and Europe suggest a clear association between campylobacteriosis and residential proximity to livestock farms.2,3,6,60,61 In this study, we showed Campylobacter jejuni DNA to be present in the air at residencies in a rural area in particular in poultry dense areas. This observation lends plausibility to the hypothesis that airborne transmission may contribute to recent epidemiological findings that indicate that campylobacter-related illness is more prevalent in poultry dense areas.2,3 To gain more insight, research on viability and relations between airborne exposure, uptake, and response is needed. Epidemiological studies on MRSA carriage indicated residential proximity to livestock farms as a risk factor.4,5,7,8 We did not assess specific antimicrobial resistant bacteria but did show a decline in airborne concentrations of AMR genes with increasing distance from farms. Further research is warranted to increase insights into the relevance of livestock farm emissions of AMR genes with respect to the public health burden of antimicrobial resistant bacteria. Besides infectious diseases, other health outcomes like respiratory health effects and atopic sensitization were also associated with livestock density.10,14 Inflammatory responses are independent of the viability status of bacteria, as these are induced by bacterial components having pro-inflammatory properties like endotoxin (cell wall component Gram-negative bacteria) and peptidoglycan (cell wall component Gram-positive bacteria).62
Prospects
Bioaerosol sampling today is still challenging, despite technological developments thus far. Thanks to innovations in molecular microbiology, sampling is not fully dependent on culture-based methods anymore. This enables valuable comparisons of outcomes between studies and prevents underestimation of bacterial quantities due to no or decreased culturability.51,63 Both qPCR analyses as culture-based methods are impractical to thoroughly specify acute exposures at residential sites. Gaining insight into the potential occurrence of high peaks of microbial air pollution at residential sites would be interesting, as these can have, depending on the agent and mechanism, health implications. Intriguing technical developments are ongoing aimed at accurate real-time monitoring of microbial concentrations in air, which would mean a great leap forward for insights into short-term variation. Technology is not there yet but expected in the foreseeable future.63
Knowledge on airborne bioaerosol levels in relation to livestock farming has, besides public health relevance, also veterinary value. Increasing insights in airborne transmission of micro-organisms emitted by a farm is also of importance with respect to farm-to-farm transmission. In the case of infectious disease outbreaks, air measurements can either prospectively or retrospectively contribute to source identification and source attribution.9
This study demonstrates microbial air pollution at residential distances in relation to livestock farming. More and more epidemiological evidence has become available on the health effects in relation to residential proximity to farms. Health outcomes found to be associated with livestock density not only included infectious diseases; also associations were observed considering general respiratory health effects and atopic sensitization. Exposure proxies were used in these studies, so no underlying causal mechanisms could be identified; it is not unlikely that microbial air pollution (in part) plays a role. Our study revealed measurable exposures in air to livestock-related microbial markers (commensals and AMR genes) and a zoonotic pathogen (Campylobacter jejuni) at residential sites and identified associations between airborne concentrations and livestock characteristics of the surroundings. Exposure assessment studies are crucial to understanding the observed health effects and the potential risks resulting from farm emissions.
Acknowledgments
We thank the participating residents for their cooperation. The Provinces Noord-Brabant and Limburg are acknowledged for providing data. Isabella van Schothorst, Karlijn Moonen, Erik van Deurssen, Jack Spithoven, Nena Burger, Siegfried de Wind, Max Hennekes, Gerdit Greve, and Rozemarijn van der Plaats are thanked for their help with sample collection and/or laboratory analyses. We thank Kees Meliefste, Bert Brunekreef, and Eef Otterloo for their assistance with design of the measurement campaign. Lützen Portengen is thanked for helping with multiple imputation analyses. The study was funded by the Ministry of Health, Welfare and Sports and the Ministry of Economic Affairs of Netherlands.
Supporting Information Available
The Supporting Information is available free of charge on the ACS Publications website at DOI: 10.1021/acs.est.8b07029.
Additional details on materials and methods, supplementary tables, and supplementary figures (PDF)
The authors declare no competing financial interest.
Supplementary Material
References
- Casey J. A.; Kim B. F.; Larsen J.; Price L. B.; Nachman K. E. Industrial Food Animal Production and Community Health. Curr. Environ. Heal. reports 2015, 2 (3), 259–271. 10.1007/s40572-015-0061-0. [DOI] [PubMed] [Google Scholar]
- Poulsen M. N.; Pollak J.; Sills D. L.; Casey J. A.; Rasmussen S. G.; Nachman K. E.; Cosgrove S. E.; Stewart D.; Schwartz B. S. Residential Proximity to High-Density Poultry Operations Associated with Campylobacteriosis and Infectious Diarrhea. Int. J. Hyg. Environ. Health 2018, 221 (2), 323–333. 10.1016/j.ijheh.2017.12.005. [DOI] [PMC free article] [PubMed] [Google Scholar]
- Friesema I. H. M.; Havelaar A. H.; Westra P. P.; Wagenaar J. A.; van Pelt W. Poultry Culling and Campylobacteriosis Reduction among Humans, The Netherlands. Emerging Infect. Dis. 2012, 18 (3), 466–468. 10.3201/eid1803.111024. [DOI] [PMC free article] [PubMed] [Google Scholar]
- Zomer T. P.; Wielders C. C. H.; Veenman C.; Hengeveld P.; van der Hoek W.; de Greeff S. C.; Smit L. A. M.; Heederik D. J.; Yzermans C. J.; Bosch T.; et al. MRSA in Persons Not Living or Working on a Farm in a Livestock-Dense Area: Prevalence and Risk Factors. J. Antimicrob. Chemother. 2017, 72 (3), 893–899. 10.1093/jac/dkw483. [DOI] [PubMed] [Google Scholar]
- Carrel M.; Schweizer M. L.; Sarrazin M. V.; Smith T. C.; Perencevich E. N. Residential Proximity to Large Numbers of Swine in Feeding Operations Is Associated with Increased Risk of Methicillin-Resistant Staphylococcus Aureus Colonization at Time of Hospital Admission in Rural Iowa Veterans. Infect. Control Hosp. Epidemiol. 2014, 35 (02), 190–192. 10.1086/674860. [DOI] [PubMed] [Google Scholar]
- Green C. G.; Krause D. O.; Wylie J. L. Spatial Analysis of Campylobacter Infection in the Canadian Province of Manitoba. Int. J. Health Geogr. 2006, 5 (1), 2. 10.1186/1476-072X-5-2. [DOI] [PMC free article] [PubMed] [Google Scholar]
- Casey J. A.; Curriero F. C.; Cosgrove S. E.; Nachman K. E.; Schwartz B. S. High-Density Livestock Operations, Crop Field Application of Manure, and Risk of Community-Associated Methicillin-Resistant Staphylococcus Aureus Infection in Pennsylvania. JAMA Int. Med. 2013, 173 (21), 1980. 10.1001/jamainternmed.2013.10408. [DOI] [PMC free article] [PubMed] [Google Scholar]
- Feingold B. J.; van Cleef B. A. G. L.; Heck M. E. O. C.; Curriero F. C.; Kluytmans J. A. J. W.; Silbergeld E. K. Livestock-Associated Methicillin-Resistant Staphylococcus Aureus in Humans, the Netherlands. Emerging Infect. Dis. 2012, 18 (11), 1841–1849. 10.3201/eid1811.111850. [DOI] [PMC free article] [PubMed] [Google Scholar]
- De Rooij M. M. T.; Van Leuken J. P. G.; Swart A.; Kretzschmar M. E. E.; Nielen M.; De Koeijer A. A.; Janse I.; Wouters I. M.; Heederik D. J. J. A Systematic Knowledge Synthesis on the Spatial Dimensions of Q Fever Epidemics. Zoonoses Public Health 2019, 66 (1), 14–25. 10.1111/zph.12534. [DOI] [PMC free article] [PubMed] [Google Scholar]
- Borlée F.; Joris Yzermans C.; Aalders B.; Rooijackers J.; Krop E.; Maassen C. B. M.; Schellevis F.; Brunekreef B.; Heederik D.; Smit L. A. M. Air Pollution from Livestock Farms Is Associated with Airway Obstruction in Neighboring Residents. Am. J. Respir. Crit. Care Med. 2017, 196 (9), 1152–1161. 10.1164/rccm.201701-0021OC. [DOI] [PubMed] [Google Scholar]
- Smit L. A. M.; Hooiveld M.; van der Sman-de Beer F.; Opstal-van Winden A. W. J.; Beekhuizen J.; Wouters I. M.; Yzermans C. J.; Heederik D. Air Pollution from Livestock Farms, and Asthma, Allergic Rhinitis and COPD among Neighbouring Residents. Occup. Environ. Med. 2014, 71 (2), 134–140. 10.1136/oemed-2013-101485. [DOI] [PubMed] [Google Scholar]
- Freidl G. S.; Spruijt I. T.; Borlée F.; Smit L. A. M.; van Gageldonk-Lafeber A. B.; Heederik D. J. J.; Yzermans J.; van Dijk C. E.; Maassen C. B. M.; van der Hoek W. Livestock-Associated Risk Factors for Pneumonia in an Area of Intensive Animal Farming in the Netherlands. PLoS One 2017, 12 (3), e0174796 10.1371/journal.pone.0174796. [DOI] [PMC free article] [PubMed] [Google Scholar]
- Smit L. A. M.; Boender G. J.; De Steenhuijsen Piters W. A. A.; Hagenaars T. J.; Huijskens E. G. W.; Rossen J. W. A.; Koopmans M.; Nodelijk G.; Sanders E. A. M.; Yzermans J.; et al. Increased Risk of Pneumonia in Residents Living near Poultry Farms: Does the Upper Respiratory Tract Microbiota Play a Role?. Pneumonia 2017, 9, 3. 10.1186/s41479-017-0027-0. [DOI] [PMC free article] [PubMed] [Google Scholar]
- Borlée F.; Yzermans J.; Krop M.; esmeralda J.; Maassen M.; catharina B.; Schellevis F.; J Heederik D. J.; Smit lidwien M. Residential Proximity to Livestock Farms Is Associated with a Lower Prevalence of Atopy. Occup. Environ. Med. 2018, 75, 453–460. 10.1136/oemed-2017-104769. [DOI] [PubMed] [Google Scholar]
- Seedorf J.; Hartung J.; Schröder M.; Linkert K. H.; Phillips V. R.; Holden M. R.; Sneath R. W.; Short J. L.; White R. P.; Pedersen S.; et al. Concentrations and Emissions of Airborne Endotoxins and Microorganisms in Livestock Buildings in Northern Europe. J. Agric. Eng. Res. 1998, 70 (1), 97–109. 10.1006/jaer.1997.0281. [DOI] [Google Scholar]
- Gibbs S. G.; Green C. F.; Tarwater P. M.; Mota L. C.; Mena K. D.; Scarpino P. V. Isolation of Antibiotic-Resistant Bacteria from the Air Plume Downwind of a Swine Confined or Concentrated Animal Feeding Operation. Environ. Health Perspect. 2006, 114 (7), 1032–1037. 10.1289/ehp.8910. [DOI] [PMC free article] [PubMed] [Google Scholar]
- Müller W.; Wieser P.; Woiwode J.. Zur Grösse Koloniebildender Einheiten in Der Stalluft. Berl. Munch. Tierarztl. Wochenschr. 1977, 90 ( (1), ), 6–11. [PubMed] [Google Scholar]
- Von Salviati C.; Laube H.; Guerra B.; Roesler U.; Friese A. Emission of ESBL/AmpC-Producing Escherichia Coli from Pig Fattening Farms to Surrounding Areas. Vet. Microbiol. 2015, 175, 77–84. 10.1016/j.vetmic.2014.10.010. [DOI] [PubMed] [Google Scholar]
- Thorne P. S.; Ansley A. C.; Perry S. S. Concentrations of Bioaerosols, Odors, and Hydrogen Sulfide inside and Downwind from Two Types of Swine Livestock Operations. J. Occup. Environ. Hyg. 2009, 6 (4), 211–220. 10.1080/15459620902729184. [DOI] [PMC free article] [PubMed] [Google Scholar]
- McEachran A. D.; Blackwell B. R.; Hanson J. D.; Wooten K. J.; Mayer G. D.; Cox S. B.; Smith P. N. Antibiotics, Bacteria, and Antibiotic Resistance Genes: Aerial Transport from Cattle Feed Yards via Particulate Matter. Environ. Health Perspect. 2015, 123 (4), 337–343. 10.1289/ehp.1408555. [DOI] [PMC free article] [PubMed] [Google Scholar]
- Chinivasagam H. N.; Tran T.; Maddock L.; Gale A.; Blackall P. J. Mechanically Ventilated Broiler Sheds: A Possible Source of Aerosolized Salmonella, Campylobacter, and Escherichia Coli. Appl. Environ. Microbiol. 2009, 75 (23), 7417–7425. 10.1128/AEM.01380-09. [DOI] [PMC free article] [PubMed] [Google Scholar]
- Chinivasagam H. N.; Tran T.; Maddock L.; Gale A.; Blackall P. J. The Aerobiology of the Environment around Mechanically Ventilated Broiler Sheds. J. Appl. Microbiol. 2010, 108 (5), 1657–1667. 10.1111/j.1365-2672.2009.04571.x. [DOI] [PubMed] [Google Scholar]
- Zhong Z.; Chai T.; Duan H.; Miao Z.; Li X.; Yao M.; Yuan W.; Wang W.; Li Q.; Zucker B. A.; et al. REP-PCR Tracking of the Origin and Spread of Airborne Staphylococcus Aureus in and around Chicken House. Indoor Air 2009, 19 (6), 511–516. 10.1111/j.1600-0668.2009.00618.x. [DOI] [PMC free article] [PubMed] [Google Scholar]
- Dungan R. S.; Leytem A. B.; Bjorneberg D. L. Concentrations of Airborne Endotoxin and Microorganisms at a 10,000-Cow Open-Freestall Dairy. J. Anim. Sci. 2011, 89 (10), 3300–3309. 10.2527/jas.2011-4002. [DOI] [PubMed] [Google Scholar]
- Jonges M.; Van Leuken J.; Wouters I.; Koch G.; Meijer A.; Koopmans M. Wind-Mediated Spread of Low-Pathogenic Avian Influenza Virus into the Environment during Outabreaks at Commercial Poultry Farms. PLoS One 2015, 10 (5), e0125401 10.1371/journal.pone.0125401. [DOI] [PMC free article] [PubMed] [Google Scholar]
- Duan H.; Chai T.; Liu J.; Zhang X.; Qi C.; Gao J.; Wang Y.; Cai Y.; Miao Z.; Yao M.; et al. Source Identification of Airborne Escherichia Coli of Swine House Surroundings Using ERIC-PCR and REP-PCR. Environ. Res. 2009, 109, 511–517. 10.1016/j.envres.2009.02.014. [DOI] [PMC free article] [PubMed] [Google Scholar]
- Ko G.; Simmons O. D.; Likirdopulos C. a; Worley-Davis L.; Williams M.; Sobsey M. D. Investigation of Bioaerosols Released from Swine Farms Using Conventional and Alternative Waste Treatment and Management Technologies. Environ. Sci. Technol. 2008, 42 (23), 8849–8857. 10.1021/es801091t. [DOI] [PubMed] [Google Scholar]
- Laube H.; Friese A.; Von Salviati C.; Guerra B.; Rö Sler U. Transmission of ESBL/AmpC-Producing Escherichia Coli from Broiler Chicken Farms to Surrounding Areas. Vet. Microbiol. 2014, 172, 519–527. 10.1016/j.vetmic.2014.06.008. [DOI] [PubMed] [Google Scholar]
- Yuan W.; Chai T. J.; Miao Z. M. ERIC-PCR Identification of the Spread of Airborne Escherichia Coli in Pig Houses. Sci. Total Environ. 2010, 408, 1446–1450. 10.1016/j.scitotenv.2009.12.019. [DOI] [PubMed] [Google Scholar]
- Sancheza H. M.; Echeverria C.; Thulsiraj V.; Zimmer-Faust A.; Flores A.; Laitz M.; Healy G.; Mahendra S.; Paulson S. E.; Zhu Y. Antibiotic Resistance in Airborne Bacteria Near Conventional and Organic Beef Cattle Farms in California, USA. Water, Air, Soil Pollut. 2016, 227 (8), 280. 10.1007/s11270-016-2979-8. [DOI] [Google Scholar]
- Navajas-Benito E. V.; Alonso C. A.; Sanz S.; Olarte C.; Martínez-Olarte R.; Hidalgo-Sanz S.; Somalo S.; Torres C. Molecular Characterization of Antibiotic Resistance in Escherichia Coli Strains from a Dairy Cattle Farm and Its Surroundings. J. Sci. Food Agric. 2017, 97 (1), 362–365. 10.1002/jsfa.7709. [DOI] [PubMed] [Google Scholar]
- Schulz J.; Friese A.; Klees S.; Tenhagen B. A.; Fetsch A.; Rösler U.; Hartung J. Longitudinal Study of the Contamination of Air and of Soil Surfaces in the Vicinity of Pig Barns by Livestock-Associated Methicillin-Resistant Staphylococcus Aureus. Appl. Environ. Microbiol. 2012, 78 (16), 5666–5671. 10.1128/AEM.00550-12. [DOI] [PMC free article] [PubMed] [Google Scholar]
- de Rooij M. M. T.; Heederik D. J. J.; Van Nunen E. J. H. M.; Van Schothorst I. J.; Maassen C. B. M.; Hoek G.; Wouters I. M. Spatial Variation of Endotoxin Concentrations Measured in Ambient PM 10 in a Livestock-Dense Area: Implementation of a Land-Use Regression Approach. Environ. Health Perspect. 2018, 126 (1), 017003 10.1289/EHP2252. [DOI] [PMC free article] [PubMed] [Google Scholar]
- De Rooij M. M. T.; Heederik D. J. J.; Borlée F.; Hoek G.; Wouters I. M. Spatial and Temporal Variation in Endotoxin and PM10 Concentrations in Ambient Air in a Livestock Dense Area. Environ. Res. 2017, 153, 161–170. 10.1016/j.envres.2016.12.004. [DOI] [PubMed] [Google Scholar]
- Mueller-Anneling L.; Avol E.; Peters J. M.; Thorne P. S. Ambient Endotoxin Concentrations in PM10 from Southern California. Environ. Health Perspect. 2004, 112, 583–588. 10.1289/ehp.6552. [DOI] [PMC free article] [PubMed] [Google Scholar]
- Pavilonis B. T.; Anthony T. R.; O’Shaughnessy P. T.; Humann M. J.; Merchant J. a; Moore G.; Thorne P. S.; Weisel C. P.; Sanderson W. T. Indoor and Outdoor Particulate Matter and Endotoxin Concentrations in an Intensely Agricultural County. J. Exposure Sci. Environ. Epidemiol. 2013, 23 (3), 299–305. 10.1038/jes.2012.123. [DOI] [PMC free article] [PubMed] [Google Scholar]
- Schulze A.; Van Strien R.; Ehrenstein V.; Schierl R.; Küchenhoff H.; Radon K. Ambient Endotoxin Level in an Area with Intensive Livestock Production. Ann. Agric. Environ. Med. 2006, 13 (1), 87–91. [PubMed] [Google Scholar]
- Tager I. B.; Lurmann F. W.; Haight T.; Alcorn S.; Penfold B.; Katharine Hammond S. Temporal and Spatial Patterns of Ambient Endotoxin Concentrations in Fresno, California. Environ. Health Perspect. 2010, 118 (10), 1490–1496. 10.1289/ehp.0901602. [DOI] [PMC free article] [PubMed] [Google Scholar]
- De Rooij M. M. T.; Borlée F.; Smit L. A. M.; De Bruin A.; Janse I.; Heederik D. J. J.; Wouters I. M. Detection of Coxiella Burnetii in Ambient Air after a Large Q Fever Outbreak. PLoS One 2016, 11 (3), e0151281 10.1371/journal.pone.0151281. [DOI] [PMC free article] [PubMed] [Google Scholar]
- Jensen A. N.; Andersen M. T.; Dalsgaard A.; Baggesen D. L.; Nielsen E. M. Development of Real-Time PCR and Hybridization Methods for Detection and Identification of Thermophilic Campylobacter Spp. in Pig Faecal Samples. J. Appl. Microbiol. 2005, 99 (2), 292–300. 10.1111/j.1365-2672.2005.02616.x. [DOI] [PubMed] [Google Scholar]
- Frahm E.; Obst U. Application of the Fluorogenic Probe Technique (TaqMan PCR) to the Detection of Enterococcus Spp. and Escherichia Coli in Water Samples. J. Microbiol. Methods 2003, 52 (1), 123–131. 10.1016/S0167-7012(02)00150-1. [DOI] [PubMed] [Google Scholar]
- Kilic A.; Muldrew K. L.; Tang Y.-W.; Basustaoglu A. C. Triplex Real-Time Polymerase Chain Reaction Assay for Simultaneous Detection of Staphylococcus Aureus and Coagulase-Negative Staphylococci and Determination of Methicillin Resistance Directly from Positive Blood Culture Bottles. Diagn. Microbiol. Infect. Dis. 2010, 66 (4), 349–355. 10.1016/j.diagmicrobio.2009.11.010. [DOI] [PubMed] [Google Scholar]
- Walsh F.; Ingenfeld A.; Zampicolli M.; Hilber-Bodmer M.; Frey J. E.; Duffy B. Real-Time PCR Methods for Quantitative Monitoring of Streptomycin and Tetracycline Resistance Genes in Agricultural Ecosystems. J. Microbiol. Methods 2011, 86 (2), 150–155. 10.1016/j.mimet.2011.04.011. [DOI] [PubMed] [Google Scholar]
- Nutz S.; Döll K.; Karlovsky P. Determination of the LOQ in Real-Time PCR by Receiver Operating Characteristic Curve Analysis: Application to QPCR Assays for Fusarium Verticillioides and F. Proliferatum. Anal. Bioanal. Chem. 2011, 401 (2), 717–726. 10.1007/s00216-011-5089-x. [DOI] [PMC free article] [PubMed] [Google Scholar]
- R.Core-Team . R: A Language and Environment for Statistical Computing. R Foundation for Statistical Computing, Vienna, Austria, 2017.
- Brooks J. P.; Mclaughlin M. R.; Scheffler B.; Miles D. M. Microbial and Antibiotic Resistant Constituents Associated with Biological Aerosols and Poultry Litter within a Commercial Poultry House ☆. Sci. Total Environ. 2010, 408, 4770–4777. 10.1016/j.scitotenv.2010.06.038. [DOI] [PubMed] [Google Scholar]
- Green C. F.; Gibbs S. G.; Tarwater P. M.; Mota L. C.; Scarpino P. V. Bacterial Plume Emanating from the Air Surrounding Swine Confinement Operations. J. Occup. Environ. Hyg. 2006, 3, 9–15. 10.1080/15459620500430615. [DOI] [PubMed] [Google Scholar]
- Masclaux F. G.; Sakwinska O.; Charrière N.; Semaani E.; Oppliger A. Concentration of Airborne Staphylococcus Aureus (MRSA and MSSA), Total Bacteria, and Endotoxins in Pig Farms. Ann. Occup. Hyg. 2013, 57 (5), 550–557. 10.1093/annhyg/mes098. [DOI] [PubMed] [Google Scholar]
- Oppliger A.; Charrière N.; Droz P. O.; Rinsoz T. Exposure to Bioaerosols in Poultry Houses at Different Stages of Fattening; Use of Real-Time PCR for Airborne Bacterial Quantification. Ann. Occup. Hyg. 2008, 52 (5), 405–412. 10.1093/annhyg/men021. [DOI] [PMC free article] [PubMed] [Google Scholar]
- Martin E.; Jäckel U. Characterization of Bacterial Contaminants in the Air of a Duck Hatchery by Cultivation Based and Molecular Methods. J. Environ. Monit. 2011, 13 (2), 464–470. 10.1039/C0EM00272K. [DOI] [PubMed] [Google Scholar]
- Schaeffer J. W.; Reynolds S.; Magzamen S.; Vandyke A.; Gottel N. R.; Gilbert J. A.; Owens S. M.; Hampton-Marcell J. T.; Volckens J. Size, Composition, and Source Profiles of Inhalable Bioaerosols from Colorado Dairies. Environ. Sci. Technol. 2017, 51 (11), 6430–6440. 10.1021/acs.est.7b00882. [DOI] [PMC free article] [PubMed] [Google Scholar]
- Popescu S.; Borda C.; Diugan E. Microbiological Air Contamination in Different Types of Housing Systems for Laying Hens. ProEnvironment 2013, 6 (16), 549–555. [Google Scholar]
- Godoy S. M.; Mores P. L.; Santa Cruz A. S. M.; Scenna N. J. Assessment of Impact Distances for Particulate Matter Dispersion: A Stochastic Approach. Reliab. Eng. Syst. Saf. 2009, 94, 1658–1665. 10.1016/j.ress.2009.04.006. [DOI] [Google Scholar]
- Hiranuma N.; Brooks S. D.; Gramann J.; Auvermann B. W. High Concentrations of Coarse Particles Emitted from a Cattle Feeding Operation. Atmos. Chem. Phys. 2011, 11 (16), 8809–8823. 10.5194/acp-11-8809-2011. [DOI] [Google Scholar]
- Netherlands Veterinary Medicines Institute, T . The Usage of Antibiotics in the Livestock Industry in 2017 in the Netherlands - Trends, Benchmarking Farms and Veterinarians; Utrecht, The Netherlands, 2018.
- Hermans D.; Pasmans F.; Messens W.; Martel A.; Van Immerseel F.; Rasschaert G.; Heyndrickx M.; Van Deun K.; Haesebrouck F. Poultry as a Host for the Zoonotic Pathogen Campylobacter Jejuni. Vector-Borne Zoonotic Dis. 2012, 12 (2), 89–98. 10.1089/vbz.2011.0676. [DOI] [PubMed] [Google Scholar]
- Alvarado C. S.; Gandara A.; Flores C.; Perez H. R.; Green C. F.; Hurd W. W.; Gibbs S. G. Seasonal Changes in Airborne Fungi and Bacteria at a Dairy Cattle Concentrated Animal Feeding Operation in the Southwest United States. J. Environ. Health 2009, 71 (9), 40–44. [PubMed] [Google Scholar]
- Schulz J.; Formosa L.; Seedorf J.; Hartung J. Measurement of Culturable Airborne Staphylococci Downwind from a Naturally Ventilated Broiler House. Aerobiologia (Bologna). 2011, 27 (4), 311–318. 10.1007/s10453-011-9202-6. [DOI] [Google Scholar]
- Dungan R. S. Board-Invited Review: Fate and Transport of Bioaerosols Associated with Livestock Operations and Manures. J. Anim. Sci. 2010, 88 (11), 3693–3706. 10.2527/jas.2010-3094. [DOI] [PMC free article] [PubMed] [Google Scholar]
- Jonsson M. E.; Heier B. T.; Norström M.; Hofshagen M. Analysis of Simultaneous Space-Time Clusters of Campylobacter Spp. in Humans and in Broiler Flocks Using a Multiple Dataset Approach. Int. J. Health Geogr. 2010, 9 (1), 48. 10.1186/1476-072X-9-48. [DOI] [PMC free article] [PubMed] [Google Scholar]
- Rosenberg Goldstein R. E.; Cruz-Cano R.; Jiang C.; Palmer A.; Blythe D.; Ryan P.; Hogan B.; White B.; Dunn J. R.; Libby T. Association between Community Socioeconomic Factors, Animal Feeding Operations, and Campylobacteriosis Incidence Rates: Foodborne Diseases Active Surveillance Network (FoodNet), 2004–2010. BMC Infect. Dis. 2016, 16 (1), 354. 10.1186/s12879-016-1686-9. [DOI] [PMC free article] [PubMed] [Google Scholar]
- Poole J. A.; Dooley G. P.; Saito R.; Burrell A. M.; Bailey K. L.; Romberger D. J.; Mehaffy J.; Reynolds S. J. Muramic Acid, Endotoxin, 3-Hydroxy Fatty Acids, and Ergosterol Content Explain Monocyte and Epithelial Cell Inflammatory Responses to Agricultural Dusts. J. Toxicol. Environ. Health, Part A 2010, 73 (10), 684–700. 10.1080/15287390903578539. [DOI] [PMC free article] [PubMed] [Google Scholar]
- Garcia-Alcega S.; Nasir Z. A.; Ferguson R.; Whitby C.; Dumbrell A. J.; Colbeck I.; Gomes D.; Tyrrel S.; Coulon F. Fingerprinting Outdoor Air Environment Using Microbial Volatile Organic Compounds (MVOCs) e A Review. TrAC, Trends Anal. Chem. 2017, 86, 75–83. 10.1016/j.trac.2016.10.010. [DOI] [Google Scholar]
Associated Data
This section collects any data citations, data availability statements, or supplementary materials included in this article.