F1000Research logoLink to F1000Research
. 2019 May 29;7:1306. Originally published 2018 Aug 16. [Version 2] doi: 10.12688/f1000research.15830.2

An accessible, interactive GenePattern Notebook for analysis and exploration of single-cell transcriptomic data

Clarence K Mah 1,#, Alexander T Wenzel 1,#, Edwin F Juarez 1,a,#, Thorin Tabor 1, Michael M Reich 1, Jill P Mesirov 1,2,b
PMCID: PMC6611141  PMID: 31316748

Version Changes

Revised. Amendments from Version 1

We thank both reviewers for their comments on our manuscript and software. We have made several modifications to the notebook visualizations and underlying analysis software in order to improve clarity and usability. We appreciate the reviewers’ insight into alternative statistical approaches to analyzing single cell transcriptomic data. We note that the primary objective of this notebook is to implement the workflow described in the Seurat PBMC tutorial. Thus, to stay within that scope, we mention those alternative and additional approaches and methods in the text but leave them as future work. We designed this notebook to be a “living document.” New versions of this notebook can be published both by us as well as by investigators using our public notebook repository. Therefore, we anticipate that this notebook and subsequent versions of it will evolve alongside the best practices in the single cell community. We have added 3 new authors to this v2: Alexander T. Wenzel; Edwin F. Juarez and Michael M. Reich. Alex T. Wenzel and Edwin F. Juarez revised the text, figures, and software in response to reviewers. Michael M. Reich provided direction for addressing reviewer comments and expertise for the GenePattern Notebook Environment. The NIH T15LM011271 grant was added to the Grant information section.

Abstract

Single-cell RNA sequencing (scRNA-seq) has emerged as a popular method to profile gene expression at the resolution of individual cells. While there have been methods and software specifically developed to analyze scRNA-seq data, they are most accessible to users who program. We have created a scRNA-seq clustering analysis GenePattern Notebook that provides an interactive, easy-to-use interface for data analysis and exploration of scRNA-Seq data, without the need to write or view any code. The notebook provides a standard scRNA-seq analysis workflow for pre-processing data, identification of sub-populations of cells by clustering, and exploration of biomarkers to characterize heterogeneous cell populations and delineate cell types.

Keywords: scRNA-seq, single-cell expression, pre-processing, clustering, interactive, visualization, GenePattern Notebook, Jupyter Notebook, open-source

Introduction

Single-cell RNA sequencing (scRNA-seq) is a powerful tool to measure genome-wide gene expression at the resolution of individual cells. Compared to traditional RNA-seq collected from bulk cells or tissue, scRNA-seq enables users to capture cell-by-cell transcriptomic variability. This information can then be used to define and characterize heterogeneity within a population of cells, from identifying known cell types to discovering novel ones. A number of high-throughput scRNA-seq protocols have been developed to simultaneously sequence thousands to hundreds of thousands of cells while retaining the origin of each transcript, including SMART-seq2 ( Picelli et al., 2014), CEL-seq ( Hashimshony et al., 2012), Drop-seq ( Macosko et al., 2015), and the commercial 10X Genomics scRNA-seq protocol. Despite the power of this approach, analysis of scRNA-seq data presents a unique set of challenges centered on the discrimination of technical variation from the biological signal. The variability in efficiency of capturing individual transcripts is compounded by the variability in the number of transcripts per cell, anywhere between 50,000 to 300,000 ( Marinov et al., 2014). Conversely, reads for multiple cells may be captured together, artificially inflating the number of reads for a single cell. Comprehensive methods and software have been developed for proper data pre-processing, normalization, quality control, and clustering analysis including Seurat ( Satija et al., 2015), Scanpy ( Wolf et al., 2018), and the 10X Genomics Cell Ranger pipeline. These methods take raw read counts as input and are downstream of read alignment and quantification. They have been used successfully in studies across many cell types to analyze tens of thousands of cells in parallel ( Macosko et al., 2015; Svensson et al., 2018; Villani et al., 2017).

While these tools are readily available for those with computational expertise who are comfortable programming in Python or R, they are less accessible to non-coding users due to a steep learning curve. In order to enable analysis of scRNA-seq data, regardless of programming expertise, we have created an interactive analysis notebook using the GenePattern Notebook Environment that does not require coding by the user ( Reich et al., 2017). The GenePattern Notebook Environment integrates an easy-to-use graphical user interface with the Jupyter notebook's rich text, media, executable code, and results, to present the entire narrative in a single notebook document.

The notebook presented here aims to provide a standard pre-processing and clustering analysis workflow for scRNA-seq datasets. We based the workflow on the Seurat R tutorial and perform the below analysis steps using methods implemented in the Scanpy Python package.

Methods

Setup analysis

The workflow begins with an expression data matrix already derived from alignment of reads and quantification of RNA transcripts. Users may upload a single expression file and specify whether the rows represent genes and the columns represent cells or vice-versa. Text files from read count quantification tools like HTSeq ( Anders et al., 2015) and Kallisto ( Bray et al., 2016) are supported as input. Additionally, this notebook supports the three-file 10X output format, allowing users to upload the matrix, genes, and barcodes files. Any of those inputs can also be provided as .zip files.

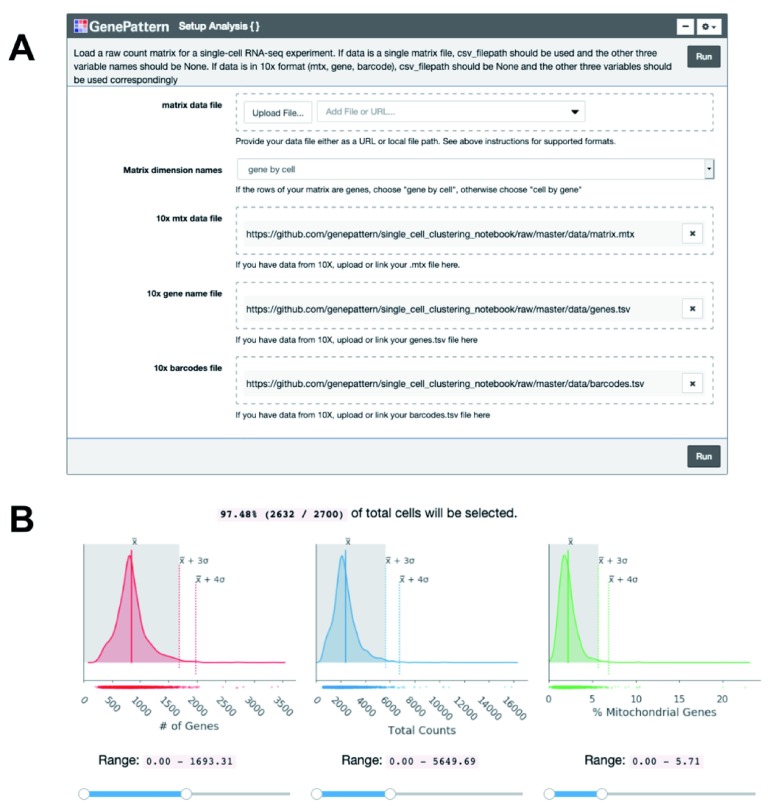
Once the expression matrix is loaded into the notebook using a GenePattern cell ( Figure 1A), the notebook presents a series of plots to compare quality metrics across cells ( Figure 1B). There are 3 metrics including: the number of genes detected in each cell, the total counts in each cell, and, when available, the percentage of counts mapped to mitochondrial genes. A high percentage of mitochondrial genes indicates apoptotic or lysed cells. These disrupted cells tend to lose cytoplasmic RNA and retain RNA enclosed in the mitochondria. The user can interactively set thresholds to see how the number of cells below the threshold change ( Figure 1B). To use the mitochondrial gene filter, the user must supply their data with gene names in HGNC format with “MT-” prepended to each mitochondrial gene name.

Figure 1. Cell quality metrics.

Figure 1.

( A) The “Setup Analysis” function is presented using the GenePattern UI Builder. ( B) The quality metric distributions are shown as kernel density estimation fitted curves. The values of the mean, 3 standard deviations (SDs) above the mean and 4 SDs above the mean are indicated to help identify outlier cells with abnormally large metric values. Interactive sliders under each plot allow the user to see how many cells are included under a threshold.

Preprocess counts

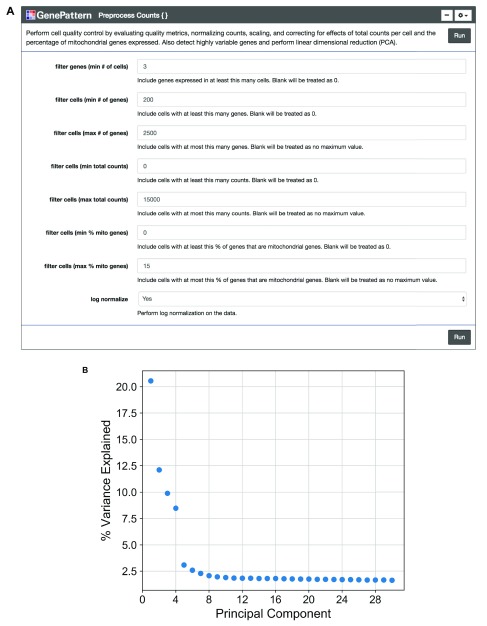
We encourage the user to visually inspect their data across several parameters, using the quality metric plots provided prior to proceeding with further analysis. Furthermore, we enable the user to determine appropriate filtering thresholds for each of the metrics to exclude low quality cells and outliers by inputting thresholds in the GenePattern cell interface ( Figure 2A). We have also provided an option to filter for genes expressed in a minimum number of cells. All preprocessing steps follow the Seurat and Scanpy workflows. Counts are scaled to have the same total counts for each cell. Highly variable genes are identified for downstream analysis by selecting genes with a minimum mean expression and dispersion; where dispersion is calculated as the log of the mean to variance ratio. Counts are then log-transformed to reduce the distribution skew and bring it closer to a normal distribution. We also give users the option to remove sources of technical variation by performing linear regression on the total number of molecules detected and the percentage of reads mapped to mitochondrial genes. As there is debate in the field concerning the correctness of using regression on covariates such as percent mitochondrial reads ( Batson, 2018) we have made this step optional. Finally, the counts for highly variable genes in each cell are scaled to unit variance and a mean of zero. For clustering cells in the next step, dimensionality reduction is performed using principal component analysis (PCA) on highly variable genes. A plot showing the percent variance explained of each principal component is then displayed so the user may choose a reasonable number of principal components for use in clustering ( Figure 2B). We note that this notebook is a living, open source document and can be modified as the single cell community’s perspectives on best practices evolves.

Figure 2. Preprocessing count data.

Figure 2.

( A) The “Preprocess Counts” function is presented using the GenePattern UI Builder. Here the user specifies thresholds for filtering samples and for performing log normalization. ( B) A scatterplot showing the percent variance explained by each individual principal component.

Cluster cells

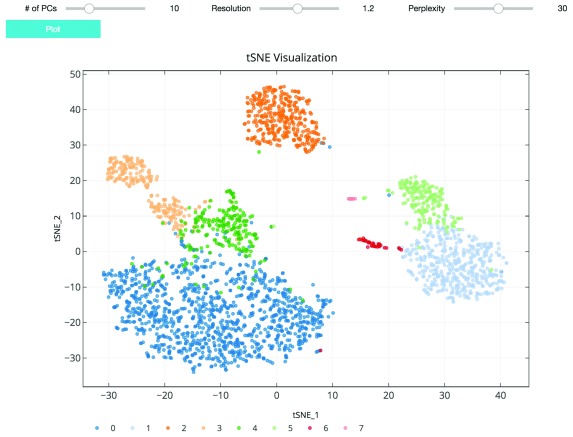
As suggested in Satija et al., 2015, and followed in the Seurat and Scanpy workflows, we cluster cells using a graph-based clustering approach. With the selected principal components as features, the cells are embedded in a K-nearest neighbor graph where cells are grouped using the Louvain community detection method ( Blondel et al., 2008). Then t-distributed stochastic neighbor embedding (t-SNE), a standard dimensionality reduction technique suited for visualizing high-dimensional data, is used to project and visualize the cells in the space of the first two t-SNE components ( Figure 3) ( Maaten & Hinton, 2008). Cells are represented as points colored by clustering assignment. Select parameters including the number of principal components, Louvain clustering resolution, and t-SNE perplexity are exposed for users to iteratively adjust the clustering results using the visualization for feedback ( Figure 3). Setting a higher resolution results in more and smaller clusters. The perplexity parameter loosely models the number of close neighbors each cell will have.

Figure 3. t-SNE plot visualizing cluster assignments of cells.

Figure 3.

The clustering parameters can be changed using the sliders and re-plotted with the “Plot” button. Cells are projected into t-SNE space, with the first two t-SNE components as the axes of the plot. Cluster assignments of cells are defined by Louvain clustering and denoted as distinct colors.

Visualize cluster markers

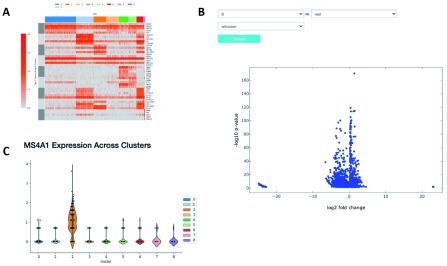
The application of proper visualization tools is an important aid to interpret the complexity and depth of scRNA-seq data. We provide various visualizations within the notebook to explore differentially expressed genes, which can be used to identify specific cell types or highlight heterogeneous gene expression across clusters ( Figure 4A and B, Figure 5). There is also an interface to query for differentially expressed genes that are higher in one cluster compared to the rest ( Figure 4C). The Wilcoxon-Rank-Sum test statistic is used to rank genes by default. This test is performed in a one-versus-all setup for each of the clusters, providing unique markers for each individual cluster. We also include the option to perform pairwise cluster comparisons. Additional statistical information about each gene is provided in interactive plots, such as the log-fold change comparing the average expression of a gene in one cluster versus the average expression in all other cells, the percentage of cells within the cluster that express the gene, and the percentage of cells in other clusters that express the gene.

Figure 4. Relative expression of marker genes.

Figure 4.

( A) A heatmap showing the expression of the top 10 differentially expressed markers of each cluster across all cells. ( B) A volcano plot illustrating the genes differentially expressed between two clusters or one cluster and the rest. ( C) A violin plot showing the expression of that gene in each cluster.

Export analysis data

Data generated by the analysis can be exported in two ways. First the data can be exported as a set of CSV (comma separated values) files suited for further independent analysis and data sharing. We provide a description of the exported CSV files, which include the preprocessed expression matrix, cell annotations, dimensional reduction outputs, and gene rankings generated during the analysis. The data can also be exported as an H5AD file that can be re-imported into this notebook’s workflow, retaining the generated results. The parameters for each step in the analyses are automatically saved in the notebook once executed, ensuring the entire workflow is documented. Notably, the entire notebook can be shared with other users rather than exporting output files.

Operation

To run this notebook, the user needs a GenePattern account or can create one on the GenePattern Notebook site. After logging in, the notebook can be found in the “Featured” section of the “Public Notebooks” page.

Use case

An example notebook ( https://github.com/genepattern/single_cell_clustering_notebook) employs a scRNA-seq gene expression dataset for 2700 peripheral blood mononuclear cells (PBMCs) from a healthy donor as a demonstration of its use. We can recapitulate cell types identified using Seurat and Scanpy; the clusters can be characterized by visualizing the expression of canonical markers of these cell types on the 2D t-SNE projection plot. We also find that many of these markers are highly ranked when looking at significant differentially expressed genes between clusters ( Figure 4).

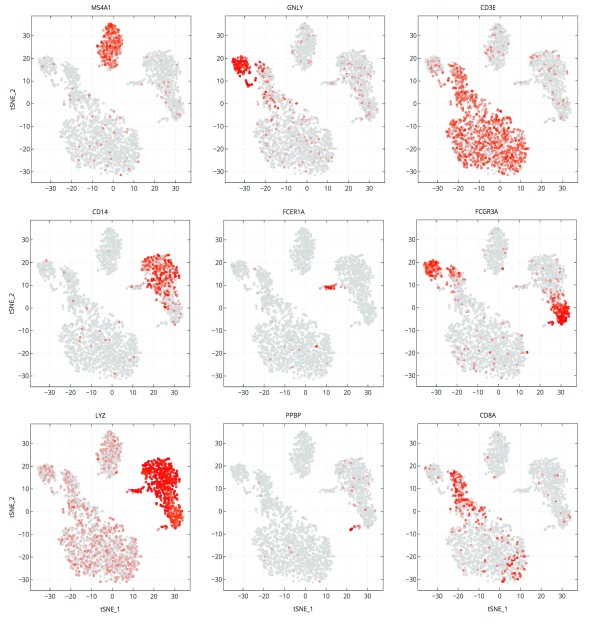
In Figure 4 we examine cluster markers to understand why some larger groups of cells are divided into sub clusters. For example, LYZ is overexpressed in a cloud of samples that clustering separates as two distinct clusters, 1 and 5. The LYZ gene encodes for human lysozyme, an antimicrobial agent associated with blood monocytes. Using the cluster comparison tool ( Figure 4B), we can see that cluster 1 exhibits high relative expression of CD14 while cluster 5 exhibits high relative expression of FCGR3A, also known as the CD16 receptor gene ( Figure 5). These two genes characterize two known subtypes of blood monocytes respectively; classical and non-classical monocytes.

Figure 5. Marker gene expression projected on t-SNE plot.

Figure 5.

Cells are projected into t-SNE space, as in Figure 2, but are colored by the relative expression of a given gene instead of cluster assignment. Colors span a gradient from red (high expression) to grey (low expression). Genes shown here are indicative of known cell types; MS4A1: B cells, GNLY: NK cells, CD3E: T cells, CD14: CD14+ monocytes, FCER1A: dendritic cells, FCGR3A: FCGR3A+ monocytes, LYZ: CD14+ monocytes, PPBP: megakaryocytes, and CD8A: CD8 T cells.

Conclusion

We encourage users to perform analyses on their own data using this notebook. We note that all the required libraries are already installed on the public GenePattern Notebook server at https://notebook.genepattern.org. This resource is freely available to the community and the analysis described in this notebook falls well within the per-account memory allocations (see the Scanpy authors’ benchmarking in Wolf et al., 2018; Eulenberg et al., 2017a; Eulenberg et al., 2017b). To analyze larger datasets that exceed the per-user memory allocation on the public notebook server, users should deploy the open source GenePattern Notebook server using their own computational resources as described in Reich et al., 2017. The GenePattern Notebook server is available as the genepattern-notebook package through the pip ( https://pypi.org/project/genepattern-notebook/) or conda ( https://anaconda.org/genepattern/genepattern-notebook) package managers, or as a Docker image ( https://hub.docker.com/r/genepattern/genepattern-notebook).

As single-cell RNA-seq continues to grow in popularity, this GenePattern Notebook will provide an accessible and reproducible way to preprocess the data and perform clustering analysis without having to interact with any code. We plan to continually review the notebook as single-cell RNA-seq protocols evolve to be even more high-throughput and as algorithms adapt to accommodate growing amounts of single-cell data. For example, future notebook releases may include quality control methods such as doublet detection ( McGinnis et al., 2018) as well as visualization methods such as UMAP ( Becht et al., 2019), which is growing in popularity in the single cell community. We also encourage advanced users to copy the notebook, add new approaches or features, and publish them as a community notebook in the GenePattern Notebook repository. As the GenePattern Notebook user interface gains more features, the notebook will also be able to take advantage of these features. Future notebooks such as those for multi-experiment aggregation (multiple sequencing runs) and pseudotime analysis are being considered to grow a compendium of single-cell sequencing analysis notebooks.

Software and data availability

GenePattern Notebook Web site https://genepattern-notebook.org. GenePattern Notebook repository and workspace: https://notebook.genepattern.org/.

GenePattern Notebook source code is available from: https://github.com/genepattern/seurat_python_notebook.

GenePattern Notebook and all its dependencies are available as a Docker image: https://hub.docker.com/r/genepattern/genepattern-notebook

Archived source code as at time of publication: https://doi.org/10.5281/zenodo.2584417 ( Mah, 2019)

License: BSD 3-Clause

The 3k PBMCs from a Healthy Donor dataset is publicly available via the 10X Genomics website after user registration: https://support.10xgenomics.com/single-cell-gene-expression/datasets/1.1.0/pbmc3k.

Acknowledgments

The authors thank Nadia Arang, Olivier Harismendy, Lukas Chavez and members of the Mesirov Lab for providing feedback on the workflow and manuscript, and the GenePattern development team for help implementing features in the GenePattern Notebook. The authors also thank Dan Carlin and Konstantin Okonechnikov for testing the notebook on independent data sets.

Funding Statement

NIH U24CA194107, NIH U41HG007517, NIH U19AI090023, NIH T15LM011271, Silicon Valley Community Foundation 2018-183110 (5022).

The funders had no role in study design, data collection and analysis, decision to publish, or preparation of the manuscript.

[version 2; peer review: 2 approved]

References

  1. Anders S, Pyl PT, Huber W: HTSeq--a Python framework to work with high-throughput sequencing data. Bioinformatics. 2015;31(2):166–169. 10.1093/bioinformatics/btu638 [DOI] [PMC free article] [PubMed] [Google Scholar]
  2. Batson J: Regression Hazards – CZ Biohub Data Science – Blog posts from the CZ Biohub data science group. CZ Biohub Data Science. 2018; [Accessed 12 December 2018]. Reference Source [Google Scholar]
  3. Becht E, McInnes L, Healy J, et al. : Dimensionality reduction for visualizing single-cell data using UMAP. Nat Biotechnol. 2019;37(1):38–44. 10.1038/nbt.4314 [DOI] [PubMed] [Google Scholar]
  4. Blondel VD, Guillaume JL, Lambiotte R, et al. : Fast unfolding of communities in large networks. Journal of Statistical Mechanics: Theory and Experiment. 2008;2008(10):P10008 10.1088/1742-5468/2008/10/P10008 [DOI] [Google Scholar]
  5. Bray NL, Pimentel H, Melsted P, et al. : Near-optimal probabilistic RNA-seq quantification. Nat Biotechnol. 2016;34(5):525–527. 10.1038/nbt.3519 [DOI] [PubMed] [Google Scholar]
  6. Eulenberg P, Köhler N, Blasi T, et al. : Reconstructing cell cycle and disease progression using deep learning. Nat Commun. 2017a;8(1):463. 10.1038/s41467-017-00623-3 [DOI] [PMC free article] [PubMed] [Google Scholar]
  7. Eulenberg P, Köhler N, Blasi T, et al. : Pseudotime-based reconstruction of cell cycle [Online].2017b; [Accessed: 13 December 2018]. Reference Source [Google Scholar]
  8. Hashimshony T, Wagner F, Sher N, et al. : CEL-Seq: single-cell RNA-Seq by multiplexed linear amplification. Cell Rep. 2012;2(3):666–673. 10.1016/j.celrep.2012.08.003 [DOI] [PubMed] [Google Scholar]
  9. Maaten LJP, Hinton GE: Visualizing High-Dimensional Data Using t-SNE. J Mach Learn Res. 2008;9:2579–2605. Reference Source [Google Scholar]
  10. Macosko EZ, Basu A, Satija R, et al. : Highly Parallel Genome-wide Expression Profiling of Individual Cells Using Nanoliter Droplets. Cell. 2015;161(5):1202–1214. 10.1016/j.cell.2015.05.002 [DOI] [PMC free article] [PubMed] [Google Scholar]
  11. Mah C, Wenzel AT, Juarez EF, et al. : genepattern/single_cell_clustering_notebook: v2.0.0 (Version v2.0.0). Zenodo. 2019. 10.5281/zenodo.2584417 [DOI] [Google Scholar]
  12. Marinov GK, Williams BA, McCue K, et al. : From single-cell to cell-pool transcriptomes: stochasticity in gene expression and RNA splicing. Genome Res. 2014;24(3):496–510. 10.1101/gr.161034.113 [DOI] [PMC free article] [PubMed] [Google Scholar]
  13. McGinnis CS, Murrow LM, Gartner ZJ: DoubletFinder: Doublet detection in single-cell RNA sequencing data using artificial nearest neighbors. BioRxiv. 2018. 10.1016/j.cels.2019.03.003 [DOI] [PMC free article] [PubMed] [Google Scholar]
  14. Picelli S, Faridani OR, Björklund ÅK, et al. : Full-length RNA-seq from single cells using Smart-seq2. Nat Protoc. 2014;9(1):171–181. 10.1038/nprot.2014.006 [DOI] [PubMed] [Google Scholar]
  15. Reich M, Tabor T, Liefeld T, et al. : The GenePattern Notebook Environment. Cell Syst. 2017;5(2):149–151.e1. 10.1016/j.cels.2017.07.003 [DOI] [PMC free article] [PubMed] [Google Scholar]
  16. Satija R, Farrell JA, Gennert D, et al. : Spatial reconstruction of single-cell gene expression data. Nat Biotechnol. 2015;33(5):495–502. 10.1038/nbt.3192 [DOI] [PMC free article] [PubMed] [Google Scholar]
  17. Svensson V, Teichmann SA, Stegle O: SpatialDE: identification of spatially variable genes. Nat Methods. 2018;15(5):343–346. 10.1038/nmeth.4636 [DOI] [PMC free article] [PubMed] [Google Scholar]
  18. Villani AC, Satija R, Reynolds G, et al. : Single-cell RNA-seq reveals new types of human blood dendritic cells, monocytes, and progenitors. Science. 2017;356(6335): pii: eaah4573. 10.1126/science.aah4573 [DOI] [PMC free article] [PubMed] [Google Scholar]
  19. Wolf FA, Angerer P, Theis FJ: SCANPY: large-scale single-cell gene expression data analysis. Genome Biol. 2018;19(1):15. 10.1186/s13059-017-1382-0 [DOI] [PMC free article] [PubMed] [Google Scholar]
F1000Res. 2019 Jul 1. doi: 10.5256/f1000research.20652.r49213

Reviewer response for version 2

Timothy Tickle 1

Thank you to the authors of the paper for their time and effort in addressing comments in the previous revision. In the previous review, the following major comments were requested to be addressed: 1) extending the differential expression to more than two labels, 2) a suggestion of using dot plots over heatmaps, 3) a request for benchmarking execution time, and 4) a clarification of costs.

Admittedly, the first two points could be interpreted as extending and not delivering the specific tutorial that is being replicated. In this light, Seurat tutorials are a de facto standard and making them available "as is" in this notebook environment adds great value to the community. I look forward to the community extending these notebooks with additional functionality but seeing how this works is not needed for the indexing of this manuscript. Execution time for each step is now given in the notebook for major steps. Costs are clarified as part of the conclusion of the manuscript. These corrections and actions address the requested points from the previous review.

I confirm that I have read this submission and believe that I have an appropriate level of expertise to confirm that it is of an acceptable scientific standard.

F1000Res. 2019 Jun 11. doi: 10.5256/f1000research.20652.r49214

Reviewer response for version 2

Joshua Batson 1

The revisions to the visualizations and to file I/O are appreciated. The implementation of the method put forward in Seurat's first PBMC tutorial is sound. As the authors state, ongoing research in single-cell will necessitate that this be a living document in the same way that the major software packages are.

I confirm that I have read this submission and believe that I have an appropriate level of expertise to confirm that it is of an acceptable scientific standard.

F1000Res. 2018 Nov 15. doi: 10.5256/f1000research.17278.r40612

Reviewer response for version 1

Joshua Batson 1

This manuscript describes a GenePattern Notebook implementing a standard analysis pipeline for single-cell RNA sequencing data. GenePattern notebooks allow a user to access python libraries for data analysis through a simple GUI--dropdown menus, text fields, and sliders are used to provide inputs to python functions that get run under the hood. This allows a user familiar with web interfaces to run a program without having to understand syntax.

In this case, that program is Scanpy, a package for scRNA-seq analysis. The order of the steps and the supporting guidelines for parameter choice and data exploration are taken from the Seurat PBMC3k tutorial.

Ideally, a naive user could upload their gene counts (say the output of CellRanger by 10X), tune just a few parameters according to the guidelines in the notebook, and find meaningful clusters in their data. Such an accessible analysis with guard-rails would be useful--had I been aware of the GenePattern system when organizing data analysis for the Tabula Muris project, I would certainly have used it, and so avoided many problems with people deleting code they shouldn't have, not changing file names to match their local directory structure, etc.

There are some significant usability issues with the notebook as it stands that will need to be remedied for it to be useful to a broad audience. Since people who cannot program will be unable to make even small changes to the workflow, it is important that the pipeline implemented here by scientifically sound, robust to different input formats and scales, and feature-complete.

  • Data I/O. I attempted to use the web-hosted version of the notebook to upload a large csv (80 MB). After nothing happened, I switched to a smaller CSV. Since it was in gene x cell format instead of cell x gene, the analysis couldn't proceed. Finally I tried a 10X .mtx file, but as there was no way to upload the corresponding barcodes file, that didn't work. Finally I used an h5ad file from a previous scanpy analysis. That won't be possible for the typical user. (Given slow upload times, actually, you may want to accept zipped csvs as well.)

The author should make it possible to upload 10X files properly. They should also allow for the data to be gene x cell or cell x gene, by giving the user a chance to transpose the matrix if necessary.

  • Interactive sliders are nice, much better than setting cutoffs by number, seeing how values change, and iterating. For the cutoffs on nGene and nCounts, the sliders are not aligned with the plot and lack numerical axes or numbers for current values. These should be displayed directly under the plots so that one can slide them to align with suggested cutoffs at various values of sigma, and should also display the numerical value currently selected.

 (Also, the suggestion that 3\sigma is an appropriate cutoff is based on the assumption of a normal distribution, which does not hold for this data, especially for 10X.)

  • The notebook bakes in certain analysis choices, such as regressing out % mito, which are not statistically sound. For the problems with regressing out, see this [blog post](http://ds.czbiohub.org/blog/Regression-Hazards/). I suggest that such "corrections" be removed. For a simple, sound analysis, see the workflow and language we used for Tabula Muris [Annotation Vignette](https://github.com/czbiohub/tabula-muris/blob/master/00_data_ingest/02_tissue_analysis_rmd/Organ_Annotation_Vignette.Rmd)

  • The notebook also includes some assumptions about the reference used. In particular, it assumes for % mito that genes be formatted in a certain case.

  • Users will likely have metadata they want to visualize, such as sample, batch, sex, stimulated vs unstimulated, etc. They should be able to upload a csv with that data, and visualize it on the tSNE plots. This is important for interpretation of the results.

  • The tSNE tab for visualizing gene expression did not load when clicked on.

  • "Conversely, reads for multiple cells may be captured together, artificially inflating the number of reads for a single cell. " Doublet detection is indeed a tricky problem. There are [methods](https://www.biorxiv.org/content/early/2018/07/19/352484) to address it, but this notebook does not implement them.

  • Depending on the size of the data, each step may take seconds to hours. For a naive user, they may not know how long to wait and at some point anyone would give up. It would be very useful if the author did some calibration for each step (running sample datasets of various sizes) so that an estimated time to completion could be displayed.

Final remarks:

Single-cell sequencing analysis is evolving, and it is essential that we get the most sound methods in the hands of practitioners. Anchoring this notebook to Scanpy is great, since that library is actively being developed. I recommend that the author regularly update this template with methods as they become available in that library. For example, t-tests and the wilcox have problems with log-normalized data (they fail to be consistent when cells are sampled to different depths). I recommend the t-test_overestim_var from Scanpy for something fast and logreg for something more accurate, but all the options should be made available and the defaults from Scanpy should be the defaults for you.

This will need to be a living document to be useful. If it is a repository of best practices for simple single-cell analysis, then it may serve as a way in to single for people who don't yet know how to program.

I confirm that I have read this submission and believe that I have an appropriate level of expertise to confirm that it is of an acceptable scientific standard, however I have significant reservations, as outlined above.

F1000Res. 2018 Dec 17.
Jill Mesirov 1

We appreciate your comprehensive comments and suggestions for improvement and enhancement of the notebook and are working to incorporate them as well as revise the paper. When that work is finished we will provide a more detailed response to review.

F1000Res. 2019 Apr 3.
Clarence Mah 1

1. The current manuscript focuses on user experience through a standardized analysis pattern, this is done well by the publication. The majority of the analysis and data visualization is modeled after current trends but two areas of improvement exist. The use of a Wilcoxon-Rank-Sum test to test one label verse all other labels is useful to researchers and is something offered through current analysis packages. There has been work that has improved the way differential expression is performed, SCDE and MAST are packages that allow more complex models or comparisons that go beyond two labels. Of those, at least MAST has shown to be performant and is now available as an option in Seurat. It is rare one will only find two clusters of cells in a single cell transcriptomics study, the extension to more labels should be included.

We agree with the reviewer that other analyses, for example more complex differential expression, can be performed. However, writing suitable Python wrappers for those is beyond the scope of this article and notebook. As Scanpy is constantly updated to reflect these current best practices to analyze single cell RNA-Seq data, this notebook can be updated as well.

2. Heatmaps were used in Figure 4a. Although useful when one wants to see the actual data and scalable to an extremely small subsection of genes (here 10), often single cell transcriptomics data is too sparse to fully appreciate patterns when presented in heatmaps (as measurements, when not using summaries) and the numbers of observations in these studies can go to more than a million; making this visualization not scalable. Dot plots should be the first plot offered in these use cases with the ability to go to heatmaps to see the actual data if needed.

We first note that, due to software compatibility issues with visualization widgets, we have redesigned the presentation of Figure 4 in the manuscript and the visualization in Step 4 of the notebook. However, we have chosen, in this case, to continue displaying the heatmap first. We agree with the reviewer that heatmaps for large, sparse data are useful mostly for summarizing, and that is indeed the reason we provide this heatmap. Users can identify the top n markers of each cluster in the heatmap (now Step 4A) and then explore each marker in more detail using the tSNE and violin plots in Step 4B.

3. Standardization and approachable user experiences are big wins for our community, but this has to be coupled with an underlying methodology that is scalable to the sizes of data we see and expect to see the near future. Data sets of over a million already exist, how does this solution scale to data in the thousands, tens of thousands, and so on. It is essential the manuscript include benchmarking so users can understand if working with their data set in this environment is possible.

We have included benchmarking relevant to the Seurat PBMC tutorial dataset before each step in the notebook. Additionally, the Scanpy development team has benchmarked their code (which forms the core of the analysis performed by this notebook) on both the same Seurat tutorial dataset we use in the notebook and a large dataset of one million cells. We have cited these benchmarks in the manuscript (see response to Reviewer 1). We note that the GenePattern Notebook uses a client-server architecture with most processing done by the server. Most datasets on the order of thousands of cells can likely be processed using the free public GenePattern Notebook server at https://notebook.genepattern.org. For larger datasets, the open source GenePattern Notebook server can be deployed on any appropriate computational resource, for example, an Amazon AWS instance or an institutional supercomputer allocation. We have added text to the manuscript noting this – see point 4 below.

4. Please list if there are any costs (or that there are no costs if that is, in fact, true) with running analysis in the notebooks. Must one always download the notebooks and run them on their own systems or is the running of analysis hosted?

We have added the following text to the conclusion section of the manuscript to address this concern:

We encourage users to perform analyses on their own data using this notebook. We note that all the required libraries are already installed on the public GenePattern Notebook server at https://notebook.genepattern.org. This resource is freely available to the community and the analysis described in this notebook falls well within the per-account memory allocations (see the Scanpy authors’ benchmarking in Wolf et al., 2018, Eulenberg et al., 2017, Eulenberg et al. 2, 2017). To analyze larger datasets that exceed the per-user memory allocation on the public notebook server, users should deploy the open source GenePattern Notebook server using their own computational resources as described in Reich et al., 2017. The GenePattern Notebook server is available as the genepattern-notebook package through the pip ( https://pypi.org/project/genepattern-notebook/) or conda ( https://anaconda.org/genepattern/genepattern-notebook) package managers, or as a Docker image ( https://hub.docker.com/r/genepattern/genepattern-notebook).

A response to following minor comments are of interest to the reviewer.

1. It is interesting that Jupyter Notebooks are leveraged to target an audience that can not program given Jupyter notebooks are a common environment for developers. That being said the interfaces given to the users do seem to be appropriate user experiences for those who prefer working through UIs. Does this work also include the ability for someone to edit and update the code of the GenePattern Notebook if they are a developer? Such a functionality would extend the usability of the notebooks by supporting an additional type of user.

Yes, GenePattern Notebooks allow users who are comfortable programming to modify the underlying code or add their own. Users access public GenePattern notebooks by saving a copy of the notebook to their own accounts. In addition to executing the analysis with the notebook copy, users can modify their copy, share it with other users, and publish modified versions to a notebook repository. Please refer to the article describing GenePattern Notebook for further details ( https://doi.org/10.1016/j.cels.2017.07.003) or to the section on Programmatic Features of the GenePattern Notebook website ( http://genepattern-notebook.org/programmatic/).

2. In Figure 1 kernel density estimations with a data plotted below the density are used instead of violin plots with over-plotted data. Although I appreciate the same information is being presented in both plots (hence this being a minor comment), it would be helpful to use violin plots instead of the current plots. First, violin plots are de facto (and the GenePattern plot does not add information) and secondly, outliers are given more presence in violin plots (data is plotted directly on the plot and the tail of the plot to higher values is not hidden by an axis). This is important given outlier are explicitly the focus of figure 1.

In Figure 1, cells are displayed under the density plots (in the form of dots) with outliers clearly visible. We believe this already implemented functionality achieves the effect of highlighting the outliers in the distribution as requested by the reviewer.

F1000Res. 2018 Sep 17. doi: 10.5256/f1000research.17278.r37288

Reviewer response for version 1

Timothy Tickle 1

“An accessible, interactive GenePattern Notebook for analysis and exploration of single-cell transcriptomic data” by Mah et al announces GenePattern NoteBooks to provide an interactive, easy-to-use interface for data analysis and exploration of single cell transcriptomics data.

GenePattern is an important body of software that supports an active user base. Growing resources for single cell transcriptomics will continue to enable that community and extend GenePattern to additional users. Jupyter notebooks are an excellent tool for development and reproducibility of scripts, it is interesting to see it being leveraged as a space to provide user interfaces for single cell transcriptomics data science. The selection of analysis was well selected, using a tutorial from Seurat, a leading environment for single cell transcriptomics analysis who have historically provided a collection of high-quality tutorials. Steps for analysis leveraged from that tutorial seem reasonable and visualizations (excluding one comment below) seem to match what you would see in publications.

The following major comments should be addressed.

  1. The current manuscript focuses on user experience through a standardized analysis pattern, this is done well by the publication. The majority of the analysis and data visualization is modeled after current trends but two areas of improvement exist. The use of a Wilcoxon-Rank-Sum test to test one label verse all other labels is useful to researchers and is something offered through current analysis packages. There has been work that has improved the way differential expression is performed, SCDE and MAST are packages that allow more complex models or comparisons that go beyond two labels. Of those, at least MAST has shown to be performant and is now available as an option in Seurat. It is rare one will only find two clusters of cells in a single cell transcriptomics study, the extension to more labels should be included.

  2. Heatmaps were used in Figure 4a. Although useful when one wants to see the actual data and scalable to an extremely small subsection of genes (here 10), often single cell transcriptomics data is too sparse to fully appreciate patterns when presented in heatmaps (as measurements, when not using summaries) and the numbers of observations in these studies can go to more than a million; making this visualization not scalable. Dot plots should be the first plot offered in these use cases with the ability to go to heatmaps to see the actual data if needed.

  3. Standardization and approachable user experiences are big wins for our community, but this has to be coupled with an underlying methodology that is scalable to the sizes of data we see and expect to see the near future. Data sets of over a million already exist, how does this solution scale to data in the thousands, tens of thousands, and so on. It is essential the manuscript include benchmarking so users can understand if working with their data set in this environment is possible.

  4. Please list if there are any costs (or that there are no costs if that is, in fact, true) with running analysis in the notebooks. Must one always download the notebooks and run them on their own systems or is the running of analysis hosted?

A response to following minor comments are of interest to the reviewer.

  1. It is interesting that Jupyter Notebooks are leveraged to target an audience that can not program given Jupyter notebooks are a common environment for developers. That being said the interfaces given to the users do seem to be appropriate user experiences for those who prefer working through UIs. Does this work also include the ability for someone to edit and update the code of the GenePattern Notebook if they are a developer? Such a functionality would extend the usability of the notebooks by supporting an additional type of user.

  2. In Figure 1 kernel density estimations with a data plotted below the density are used instead of violin plots with overplotted data. Although I appreciate the same information is being presented in both plots (hence this being a minor comment), it would be helpful to use violin plots instead of the current plots. First, violin plots are de facto (and the GenePattern plot does not add information) and secondly, outliers are given more presence in violin plots (data is plotted directly on the plot and the tail of the plot to higher values is not hidden by an axis). This is important given outlier are explicitly the focus of figure 1.

I confirm that I have read this submission and believe that I have an appropriate level of expertise to confirm that it is of an acceptable scientific standard, however I have significant reservations, as outlined above.

F1000Res. 2018 Dec 17.
Jill Mesirov 1

We appreciate your comprehensive comments and suggestions for improvement and enhancement of the notebook and are working to incorporate them as well as revise the paper. When that work is finished we will provide a more detailed response to review.

F1000Res. 2019 Apr 3.
Clarence Mah 1

1. Data I/O. I attempted to use the web-hosted version of the notebook to upload a large csv (80 MB). After nothing happened, I switched to a smaller CSV. Since it was in gene x cell format instead of cell x gene, the analysis couldn't proceed. Finally I tried a 10X .mtx file, but as there was no way to upload the corresponding barcodes file, that didn't work. Finally I used an h5ad file from a previous scanpy analysis. That won't be possible for the typical user. (Given slow upload times, actually, you may want to accept zipped csvs as well.)

The author should make it possible to upload 10X files properly. They should also allow for the data to be gene x cell or cell x gene, by giving the user a chance to transpose the matrix if necessary.

We have addressed the lack of flexibility in regards to input files and mention that in the text.

Users can now upload or link to their own 10X files (matrix, genes, and barcodes) or upload a single matrix file and specify whether it contains “gene by cell” or “cell by gene” data. Any of these files may be zipped as well. The new text reads as follows:

“The workflow begins with an expression data matrix already derived from alignment of reads and quantification of RNA transcripts. Users may upload a single expression file and specify whether the rows represent genes and the columns represent cells or vice-versa. Text files from read count quantification tools like HTSeq ( Anders et al. 2015) and Kallisto ( Bray et al. 2016) are supported as input. Additionally, this notebook supports the three-file 10X output format, allowing users to upload the matrix, genes, and barcodes files. Any of those inputs can also be provided as .zip files.”

We thank the reviewer for providing additional files for us to use in testing and we have confirmed that the notebook will load even the larger 80MB file.

2. Interactive sliders are nice, much better than setting cutoffs by number, seeing how values change, and iterating. For the cutoffs on nGene and nCounts, the sliders are not aligned with the plot and lack numerical axes or numbers for current values. These should be displayed directly under the plots so that one can slide them to align with suggested cutoffs at various values of sigma, and should also display the numerical value currently selected.

(Also, the suggestion that 3 is an appropriate cutoff is based on the assumption of a normal distribution, which does not hold for this data, especially for 10X.)

We have adjusted the alignment of plot elements such that the sliders are now more closely aligned with the boundaries of their respective KDE plots. We have left the graphical markers indicating the third and fourth standard deviation on the plots for the purpose of describing the distribution, but we have removed the suggestion that those values may make good cutoffs.

3. The notebook bakes in certain analysis choices, such as regressing out % mito, which are not statistically sound. For the problems with regressing out, see this [blog post]( http://ds.czbiohub.org/blog/Regression-Hazards/ ). I suggest that such "corrections" be removed. For a simple, sound analysis, see the workflow and language we used for Tabula Muris [Annotation Vignette]( https://github.com/czbiohub/tabula-muris/blob/master/00_data_ingest/02_tissue_analysis_rmd/Organ_Annotation_Vignette.Rmd )

We appreciate the reviewer's word of caution with regards to regressing out %mito and the links to some relevant literature. We included some of these analysis choices as we are explicitly following the Seurat tutorial, and that is a data preprocessing step in the tutorial. However, we added a note of caution to the text of the manuscript and the GenePattern notebook with regards to the possible hazards of regression in the single cell RNA-seq context while noting the alternatives provided, and we have made the regression step optional. The text now reads as follows:

We also give users the option to use remove sources of technical variation by performing linear regression on the total number of molecules detected and the percentage of reads mapped to mitochondrial genes. As there is debate in the field concerning the correctness of using regression on covariates such as percent mitochondrial reads (Batson 2018) we have made this step optional.

4. The notebook also includes some assumptions about the reference used. In particular, it assumes for % mito that genes be formatted in a certain case.

For the purposes of reproducing the Seurat tutorial, we kept the convention of assuming that mitochondrial gene names begin with “MT-”. This “hardcoding” could be avoided by asking users to supply a list of mitochondrial genes corresponding to their data’s gene ID system, but we feel this might over-complicate the input step and impose a burden on users, especially since, as the reviewer observes, the percent mitochondrial genes regression is of questionable statistical utility in the general case. We have emphasized in the manuscript that gene names must follow this specific convention in order to use this regression. Because of this requirement as well as the statistical issues the reviewer notes above, we have made this regression step optional. Users who either do not wish to use regression or do not have gene names in the required format can now skip this step.

5. Users will likely have metadata they want to visualize, such as sample, batch, sex, stimulated vs unstimulated, etc. They should be able to upload a csv with that data, and visualize it on the tSNE plots. This is important for interpretation of the results.

We agree with the reviewer that this is an important step in single cell RNA-seq workflows. However, an appropriate implementation of visualization of metadata is a feature that we believe would require a separate notebook and is out of scope of the goal of this particular notebook. Thus, we leave this for future work.

6. The tSNE tab for visualizing gene expression did not load when clicked on.

We have identified the source of this error as an incompatibility between GenePattern Notebooks and certain Jupyter Widgets (ipywidgets) that arose after the initial release of this notebook. We are addressing this problem; however, in order to avoid further delays we have redesigned the visualization without using the incompatible widgets. Correspondingly, Figure 4 in the manuscript has been updated to reflect this change.

7. Conversely, reads for multiple cells may be captured together, artificially inflating the number of reads for a single cell. " Doublet detection is indeed a tricky problem. There are [methods](https://www.biorxiv.org/content/early/2018/07/19/352484) to address it, but this notebook does not implement them.

We appreciate the importance of considering problems such as doublet detection. The Seurat PBMC tutorial does not include a doublet detection step and Scanpy does not currently implement methods for handling doublets. However, we do mention the importance of this issue in the text and point to a reference, and that we hope to address this issue in future work. The relevant text reads as follows:

For example, future notebook releases may include quality control methods such as doublet detection ( McGinnis et al., 2018) as well as visualization methods such as UMAP ( Becht et al., 2019), which is growing in popularity in the single cell community.

8. Depending on the size of the data, each step may take seconds to hours. For a naive user, they may not know how long to wait and at some point anyone would give up. It would be very useful if the author did some calibration for each step (running sample datasets of various sizes) so that an estimated time to completion could be displayed.

We have annotated each step in the notebook with benchmarking for the Seurat PBMC dataset. For each step, we list the default amount for the limiting factors (genes, principal components, etc.) and the execution time we estimate for that step based on those values. For example, “For 2,600 cells and 10 principal components, this step will run in approximately 60 to 90 seconds”. Additionally, the Scanpy developers have benchmarked their code both on the same Seurat PBMC dataset we use in this notebook and on an large dataset of one million cells. We have cited these benchmarks in the manuscript in the first paragraph of the conclusions.

Final remarks:

Single-cell sequencing analysis is evolving, and it is essential that we get the most sound methods in the hands of practitioners. Anchoring this notebook to Scanpy is great, since that library is actively being developed. I recommend that the author regularly update this template with methods as they become available in that library. For example, t-tests and the wilcox have problems with log-normalized data (they fail to be consistent when cells are sampled to different depths). I recommend the t-test_overestim_var from Scanpy for something fast and logreg for something more accurate, but all the options should be made available and the defaults from Scanpy should be the defaults for you.

This will need to be a living document to be useful. If it is a repository of best practices for simple single-cell analysis, then it may serve as a way in to single for people who don't yet know how to program.

We agree with the reviewer that keeping this notebook in line with evolving best practices is essential. We also agree that Scanpy’s default parameters are likely robust in the general case, however, in keeping with the objective of following the Seurat PBMC tutorial, default settings for parameters in this notebook were chosen to reproduce the results from that tutorial. We have included documentation at each step in the notebook to introduce users to the purpose and nuance of different parameters and empower them to make the best choices for their own data.

Associated Data

    This section collects any data citations, data availability statements, or supplementary materials included in this article.

    Data Availability Statement

    GenePattern Notebook Web site https://genepattern-notebook.org. GenePattern Notebook repository and workspace: https://notebook.genepattern.org/.

    GenePattern Notebook source code is available from: https://github.com/genepattern/seurat_python_notebook.

    GenePattern Notebook and all its dependencies are available as a Docker image: https://hub.docker.com/r/genepattern/genepattern-notebook

    Archived source code as at time of publication: https://doi.org/10.5281/zenodo.2584417 ( Mah, 2019)

    License: BSD 3-Clause

    The 3k PBMCs from a Healthy Donor dataset is publicly available via the 10X Genomics website after user registration: https://support.10xgenomics.com/single-cell-gene-expression/datasets/1.1.0/pbmc3k.


    Articles from F1000Research are provided here courtesy of F1000 Research Ltd

    RESOURCES