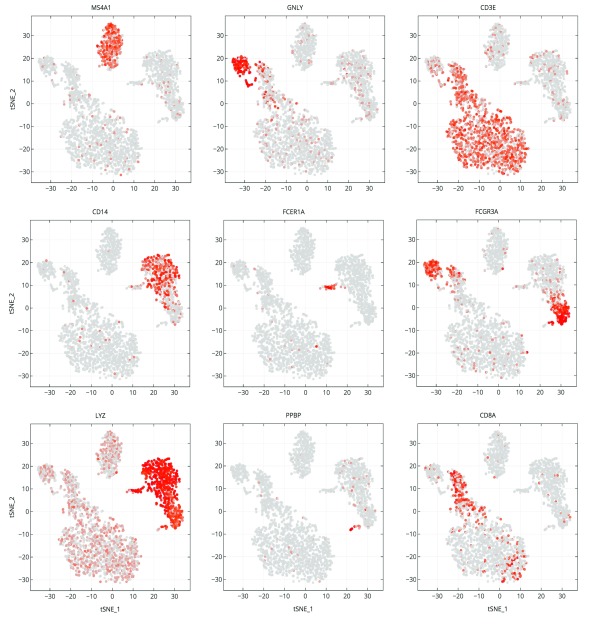
Figure 5. Marker gene expression projected on t-SNE plot.
Cells are projected into t-SNE space, as in Figure 2, but are colored by the relative expression of a given gene instead of cluster assignment. Colors span a gradient from red (high expression) to grey (low expression). Genes shown here are indicative of known cell types; MS4A1: B cells, GNLY: NK cells, CD3E: T cells, CD14: CD14+ monocytes, FCER1A: dendritic cells, FCGR3A: FCGR3A+ monocytes, LYZ: CD14+ monocytes, PPBP: megakaryocytes, and CD8A: CD8 T cells.

