

Abstract
BACKGROUND:
Although racial/ethnic and sex disparities have been examined in health care generally and pain management more specifically, the combined influence of these sociodemographic factors together has not been well documented. The aim of this study was to examine the association between administration of opioid analgesics in the emergency department (ED) and interaction of race/ethnicity and sex.
METHODS:
We conducted a retrospective cohort study using 2010–2014 Center for Disease Control-National Hospital Ambulatory Medical Care Survey data for patients 12–5 years of age presenting to EDs with a primary diagnosis of appendicitis or gallbladder disease as defined by International Classification of Diseases, Ninth Revision codes. The primary outcome was the receipt of opioid analgesic medications. Secondary outcomes included: receipt of nonopioids, receipt of antiemetic medications, wait time to see a provider, and length of visit in the ED. The association between sex and analgesic receipt within Caucasian non-Hispanic and non-Caucasian groups was evaluated adjusting for pain score on presentation, patient age, emergent status, number of comorbidities, time of visit (month, day of the week, standard versus nonstandard working hours, year), and US region.
RESULTS:
After exclusions, a weighted sample of 553 ED visits was identified, representing 2,622,926 unique visits. The sample population was comprised of 1,858,035 (70.8%) females and 1,535,794 (58.6%) Caucasian non-Hispanics. No interaction was found in adjusted sampling-weighted model between sex and race/ethnicity on the odds of receiving opioids (P = .74). There was no difference in opioid administration to males as compared to females (odds ratio [OR] = 0.96, 95% CI, 0.87–1.06; P = .42) or to non-Caucasians as compared to Caucasians (OR = 0.99, 95% CI, 0.89–1.10; P = .84). In adjusted weighted models, non-Caucasian males, 123,12½39,457 (51.4%) did not differ from Caucasian non-Hispanic males, 317,427/525,434 (60.4%), on odds of receiving opioids, aOR = 0.88, 95% CI, 0.39–1.99; P = .75. Non-Caucasian females, 547,709/847,675 (64.6%) also did not differ from Caucasian females, 621,638/1,010,360 (61.5%), on odds of receiving opioids, aOR = 1.01, 95% CI, 0.53–1.90; P = .98. Across both sexes, non-Caucasians did not differ from Caucasians on receipt of nonopioid analgesics or antiemetics. Neither wait time to see a provider nor the length of the hospital visit was significantly different between sexes or race/ethnicities.
CONCLUSIONS:
Based on National Hospital Ambulatory Medical Care Survey data from 2010 to 2014, there is no statistically significant interaction between race/ethnicity and sex for administration of opioid analgesia to people presenting to the ED with appendicitis or gallbladder disease. These results suggest that the joint effect of patient race/ethnicity and sex may not manifest in disparities in opioid management. (Anesth Analg 2019;128:1005–12)
Disparities in health care have been examined across a spectrum of clinical settings, including the management of acute pain.1 Multiple studies have investigated the influences of race/ethnicity and of sex on acute pain management, particularly in the administration or receipt of analgesic medications for acute pain. However, the exact role of these factors remains unclear. Many studies have found significant disparities in treatment among races/ethnicities, although to different degrees and in different specific contexts.2–8 Likewise, there is some evidence that adult females receive more analgesics for acute pain than males,3,8 but there is also evidence that they receive either fewer9,10 or equal2,7 amounts of analgesics.
Although the above research has examined the influence of race/ethnicity and of sex as individual factors on opioid management, little study exists to understand the effects of both of these sociodemographic factors concurrently on opioid management, particularly for perioperative patients. To our knowledge, only 1 study, published in 2008, has examined the association between receipt of opioid medications for acute pain and interaction between race/ethnicity and sex.2 To begin to elucidate the complex interaction of race/ethnicity and sex for patients in the perioperative period, we performed a retrospective study of patient visits for acute surgical conditions from 2010 to 2014 in the emergency department (ED). We used data from the National Hospital Ambulatory Medical Care Survey (NHAMCS) and selected surgical conditions associated with the most common general surgery procedures performed in the United States.11,12 We hypothesized that Caucasian non-Hispanic females would be more likely to receive opioid analgesia than Caucasian non-Hispanic males when presenting to the ED with appendicitis or gallbladder disease, but that female sex would have the inverse effect for non-Caucasians. We chose this population of patients—those who would likely require surgical care— given our clinical specialties.
METHODS
We conducted an analysis on a retrospective cohort of NHAMCS data using 2010–2014 ED visits. The Partners Institutional Review Board deemed this study nonhuman research (exempt); no written consent was needed.
The Center for Disease Control administers NHAMCS, a national survey of visits to EDs, outpatient departments, and ambulatory surgery centers in the United States (excluding Federal, military, and Veterans Administration locations). NHAMCS data are routinely used to study complex issues of public health, health services, and public policy by examining patients, conditions, and diagnostic services at 3 locations within hospitals.13 However, this analysis exclusively utilized visits to hospital emergency departments. Data are collected on patient visits at each site over a 4-week period. A multistage probability design involves several distinct stages including: the sampling of approximately 112 geographic primary sampling units, approximately 480 sample hospitals within those units, and patient visits within emergency service areas. The sampling plan allows the assignment of a weight to each visit, allowing it to represent a larger number of individual visits to attain a national estimate of representative patient visits. These weights were used in the analysis when population estimates were calculated.13
The inclusion criteria were ED visits of patients 12–55 years of age (inclusive) with an International Classification of Diseases, Ninth Revision, diagnosis of appendicitis (codes 540.0, 540.1, 540.9, 541) or gallbladder disease (codes 574.00, 570.01, 574.10, 574.11, 574.20, 574.21, 574.30, 574.31, 574.40, 574.41, 574.50, 574.51, 574.60, 574.61, 574.70, 574.71, 574.80, 574.81, 574.90, 574.91) (Figure 1). The primary exposure was aggregated race/ethnicity (Caucasian non-Hispanic; non-Caucasian) and sex (male; female). Non-Hispanic other includes Asians (Far-East, Southeast Asian, and Indian Sub-Continent), Native Hawaiian/Pacific Islander, and American Indian or Alaskan Native who are not also of Latino heritage.13 NHAMCS race/ethnicity designations are (usually) based on assignment by health care providers. In response to limited numbers of certain racial/ethnic groups within our inclusion criteria (specifically Hispanic/Latino and non-Hispanic other), we recoded the race/ethnicity variable into Caucasian non-Hispanic and non-Caucasian for our primary analysis.
Figure 1.
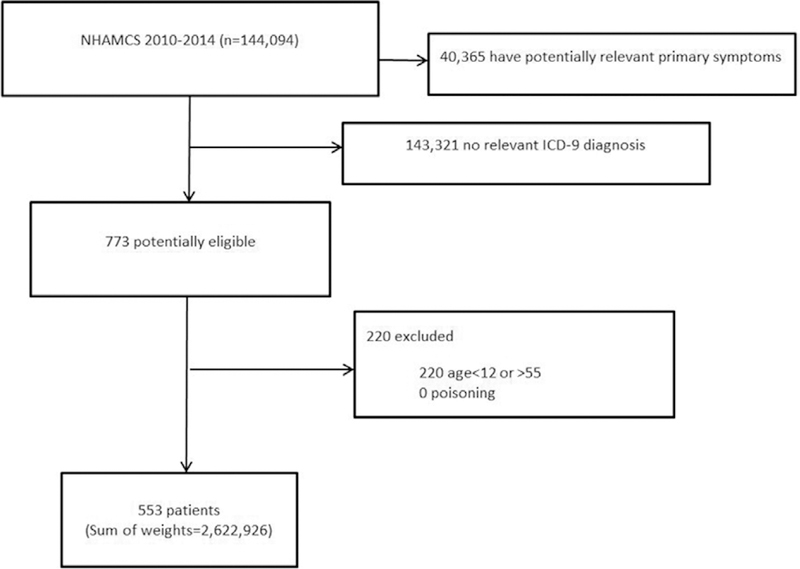
Flow chart illustrating excluded and included patients. Sum of weights: NHAMCS uses a 4-stage probability design to allow each visit to represent a larger number of individual visits to attain a national estimate of representative patient visits.13 ICD-9 indicates International Classification of Diseases, Ninth Revision; NHAMCS, National Hospital Ambulatory Medical Care Survey.
Our primary outcome was receipt of opioid analgesic medication. A list of medications was initially developed by practicing anesthesiologists on the research staff (J.M.R., D.A.A., V.E.O.); E.K., a practicing ED physician, used his clinical expertise and experience to refine the list. Opioids included fentanyl, morphine, hydromorphone/Dilaudid, oxycodone, hydrocodone, hydrocodone-acetaminophen/Vicodin, tramadol, and oxycodone-acetaminophen/ Percocet. Secondary-dependent variables included receipt of nonopioid medications, antiemetic medications, wait time to see a provider (in minutes), and length of visit in the ED (in minutes). Nonopioids included acetaminophen/Tylenol, ibuprofen/Motrin, and ketorolac/Toradol. Antiemetics included ondansetron/Zofran, famotidine/Pepcid, and metoclopramide/Reglan.
To better isolate the association between the receipt of opioid medications and race/ethnicity, we adjusted this association for several covariates that were also related to the receipt of opioids. We adjusted for initial pain score (0–10 score) and age as a continuous variable, emergent or nonemergent status, visit time during working hours or not during working hours (defined at 8 AM–5 PM), visit day of the week (Monday–Sunday), visit month of the year (January–December), visit year (2010–2014), US region (Northeast, Midwest, South, West), and number of comorbidities as categorical covariates. These covariates were chosen based on clinical feasibility (initial pain score, emergent status, age, and number of comorbidities) and previous epidemiologic evidence. In particular, studies have shown that time of visit and location of hospital may impact ED care.14–16 NHAMCS uses immediate, emergent, urgent, semiurgent, and nonurgent as triage scores; we initially examined whether emergent status was associated with race/ethnicity or sex. Because it was not, we included both emergent and nonemergent cases. Insurance status (private/nonprivate) was included for sensitivity analysis only.
This article adheres to the Strengthening the Reporting of Observational Studies in Epidemiology (STROBE) guidelines.
Statistical Analysis
Statistical analysis was planned a priori, but went through several revisions during the peer review process. Following the peer review process, we were alerted to and subsequently corrected a statistical coding of the plan of analysis.17 The NHAMCS data utilize a complex sampling design. To accommodate this, the sampling weights were used in the estimation of descriptive statistics and modeling. The calculated effects and confidence intervals represent adjusted estimates based on the sampling design: the estimates represent unbiased (ie, representative of the population) values and the confidence intervals retain the precision associated with the actually observed sample size. Thus, although the estimates represent a much larger group than sampled in the survey, the uncertainty of these estimates is proportional to that observed in the sample.
Subject demographics and characteristics were reported as weighted mean (standard deviation) or frequency count (%), as appropriate. Because of the large weighted sample size, differences between racial groups were assessed using the standardized mean difference in addition to the t test, Mantel-Haenszel, χ2, and Fisher exact test. All analyses were conducted using either SAS (version 9.4) or R statistical software (version 3.2.2), and all hypothesis testing was 2 tailed with significance interpreted as P < .05. The śurveyʹ package was used in combination with the ʹtableoneʹ package to estimate all descriptive statistics (svyCreateTableOne function) and to conduct the statistical modeling (svyglm). To accommodate the ultimate cluster design for variance estimation used in the survey package, the sampling units from NHAMCS (ie, CPSUM, CSTRATM) were used in combination with patient weights (ie, PATWT) in both the estimation of descriptive statistics and modeling. There were no missing data in the exposure or outcome and dummy variable adjustment creating a class for ˝missing˝ was utilized for confounders with >5% missing data. No a priori power calculation was performed as all available data that met inclusion criteria were analyzed.
The primary outcome of interest was the probability of receiving an opioid analgesic with the exposure of interest being the interaction between sex (male, female) and race/ethnicity (non-Hispanic Caucasian, non-Caucasian). A multivariable generalized linear regression model was utilized with quasibinomial distribution and logit link (ie, similar to logistic regression but allowing extra variance in the out-come) to assess the association among sex, race/ethnicity, and their interaction on drug administration, adjusting for the a priori defined set of covariates.
We estimated several models of increasing size to evaluate the associations under a context of differing confounder variables. Secondary outcomes of interest included receipt of nonopioid medication, receipt of antiemetic medication, patient wait time to see a provider, and length of visit. To further examine the association between sex, race/ethnicity, and opioid administration, ethnic groups were expanded (ie, non-Hispanic Caucasian, non-Hispanic African American, Hispanic, non-Hispanic other) in a sensitivity analysis. Sensitivity analyses were also used to assess interactions between race/ethnicity and insurance type and among race/ethnicity, sex, and age. Results are reported as odds ratios (ORs) with 95% CIs.
RESULTS
Based on our a priori inclusion/exclusion criteria, a weighted sample of 553 patients representing a total of 2,622,926 patients was included, composed of 1,858,035 (70.8%) females and 1,535,794 (58.6%) Caucasian non-Hispanics. The average age was 33.3 (standard deviation = 11.4) years and 170,975 (6.5 %) cases were emergent. The sample included patients from all 4 geographical regions in the United States and 44.0% patients had private insurance (Table 1; Supplemental Digital Content 1, Table, http://links.lww.com/AA/C432). Overall, 61.4% of patients received opioids (Table 2).
Table 1.
Weighted Patient Demographics
| Variable | Overall (N = 2,622,926) |
Non-Hispanic Caucasian (N = 1,535,794) |
Non-Hispanic African American (N = 356,582) |
Hispanic (N = 665,173) |
Non-Hispanic Other (N = 65,377) |
SMDa |
|---|---|---|---|---|---|---|
| Patient age in years, mean (SD) | 33.98 (11.57) | 34.83 (11.70) | 29.86 (10.18) | 32.65 (11.28) | 39.67 (10.76) | 0.553 |
| Waiting time to see physician,mean (SD) | 53.17 (100.79) | 47.74 (105.69) | 71.27 (62.60) | 61.53 (102.59) | 51.43 (37.33) | 0.078 |
| Length of visit, mean (SD) | 306.79 (346.89) | 291.03 (376.73) | 312.22 (159.84) | 351.82 (321.57) | 288.07 (210.39) | 0.190 |
| Presenting level of pain, mean (SD) | 7.43 (2.68) | 7.25 (2.72) | 7.79 (2.48) | 7.77 (2.61) | 7.49 (2.72) | 0.066 |
| Patient sex = male, n (%) | 764,891 (29.2%) | 525,434 (34.2%) | 41,247 (11.6%) | 180,754 (27.2%) | 17,456 (26.7%) | 0.280 |
| Geographic region, n (%) | 1.051 | |||||
| Northeast | 295,689 (11.3%) | 211,072 (13.7%) | 5293 (1.5%) | 79,324 (11.9%) | 0 (0.0%) | |
| Midwest | 675,728 (25.8%) | 438,103 (28.5%) | 141,208 (39.6%) | 89,011 (13.4%) | 7406 (11.3%) | |
| South | 883,832 (33.7%) | 511,692 (33.3%) | 166,079 (46.6%) | 200,280 (30.1%) | 5781 (8.8%) | |
| West | 767,677 (29.3%) | 374,927 (24.4%) | 44,002 (12.3%) | 296,558 (44.6%) | 52,190 (79.8%) | |
| Expected insurance, n (%) | 0.542 | |||||
| Private insurance | 1,155,652 (44.1%) | 823,347 (53.6%) | 125,341 (35.2%) | 166,197 (25.0%) | 24,610 (37.6%) | |
| Nonprivate insurance | 1,311,991 (50.0%) | 662,818 (43.2%) | 187,303 (52.5%) | 437,260 (65.7%) | 0 (0.0%) | |
| Emergent = Yes, n (%) | 170,975 (6.5%) | 109,522 | (7.1%) 18,726 (5.3%) | 39,684 (6.0%) | 3043 (4.7%) | 0.541 |
| Number of comorbidities, n (%) | 0.236 | |||||
| 0 | 2,478,209 (94.5%) | 1,432,417 (93.3%) | 348,417 (97.7%) | 631,998 (95.0%) | 65,377 (100.0%) | |
| 1 | 134,588 (5.1%) | 93,248 (6.1%) | 8165 (2.3%) | 33,175 (5.0%) | 0 (0.0%) | |
| 2 | 8367 (0.3%) | 8367 (0.5%) | 0 (0.0%) | 0 (0.0%) | 0 (0.0%) | |
| 3 | 1762 (0.1%) | 1762 (0.1%) | 0 (0.0%) | 0 (0.0%) | 0 (0.0%) | |
| Standard work hours (8 AM–5 PM), n (%) | 1,092,739 (41.7%) | 638,787 (41.6%) | 196,936 (55.2%) | 241,824 (36.4%) | 15,192 (23.2%) | 0.382 |
| Year, n (%) | 0.830 | |||||
| 2010 | 534,283 (20.4%) | 306,877 (20.0%) | 71,098 (19.9%) | 126,414 (19.0%) | 29,894 (45.7%) | |
| 2011 | 621,863 (23.7%) | 455,615 (29.7%) | 30,661 (8.6%) | 120,080 (18.1%) | 15,507 (23.7%) | |
| 2012 | 549,445 (21.9%) | 303,723 (19.8%) | 70,217 (19.7%) | 155,529 (23.4%) | 19,976 (30.6%) | |
| 2013 | 361,917 (13.8%) | 194,154 (12.6%) | 66,953 (18.8%) | 100,810 (15.2%) | 0 (0.0%) | |
| 2014 | 555,418 (21.2%) | 275,425 (17.9%) | 117,653 (33.0%) | 162,340 (24.4%) | 0 (0.0%) | |
| Month of visit, n (%) | 0.864 | |||||
| January | 266,466 (10.2%) | 114,379 (7.4%) | 27,422 (7.7%) | 117,533 (17.7%) | 7132 (10.9%) | |
| February | 191,216 (7.3%) | 127,659 (8.3%) | 18,354 (5.1%) | 40,303 (6.1%) | 4900 (7.5%) | |
| March | 334,234 (12.7%) | 206,129 (13.4%) | 45,344 (12.7%) | 80,175 (12.1%) | 2586 (4.0%) | |
| April | 289,386 (11.0%) | 134,016 (8.7%) | 88,800 (24.9%) | 61,839 (9.3%) | 4731 (7.2%) | |
| May | 228,030 (8.7%) | 118,631 (7.7%) | 67,424 (18.9%) | 30,121 (4.5%) | 11,854 (18.1%) | |
| June | 126,621 (4.8%) | 84,738 (5.5%) | 12,358 (3.5%) | 20,490 (3.1%) | 9035 (13.8%) | |
| July | 150,450 (5.7%) | 100,051 (6.5%) | 11,041 (3.1%) | 38,451 (5.8%) | 907 (1.4%) | |
| August | 202,645 (7.7%) | 155,656 (10.1%) | 8114 (2.3%) | 37,071 (5.6%) | 1804 (2.8%) | |
| September | 304,628 (11.6%) | 223,622 (14.6%) | 8643 (2.4%) | 72,363 (10.9%) | 0 (0.0%) | |
| October | 230,242 (8.8%) | 119,862 (7.8%) | 15,294 (4.3%) | 82,614 (12.4%) | 12,472 (19.1%) | |
| November | 152,020 (5.8%) | 91,847 (6.0%) | 31,510 (8.8%) | 24,613 (3.7%) | 4050 (6.2%) | |
| December | 146,988 (5.6%) | 59,204 (3.9%) | 22,278 (6.2%) | 59,600 (9.0%) | 5906 (9.0%) | |
| Day of visit, n (%) | 0.736 | |||||
| Sunday | 358,751 (13.7%) | 170,502 (11.1%) | 105,668 (29.6%) | 82,124 (12.3%) | 457 (0.7%) | |
| Monday | 456,759 (17.4%) | 292,701 (19.1%) | 33,766 (9.5%) | 112,480 (16.9%) | 17,812 (27.2%) | |
| Tuesday | 363,415 (13.9%) | 177,228 (11.5%) | 41,706 (11.7%) | 119,747 (18.0%) | 24,734 (37.8%) | |
| Wednesday | 429,814 (16.4%) | 247,526 (16.1%) | 63,325 (17.8%) | 114,344 (17.2%) | 4619 (7.1%) | |
| Thursday | 361,836 (13.8%) | 235,130 (15.3%) | 38,329 (10.7%) | 81,332 (12.2%) | 7045 (10.8%) | |
| Friday | 381,795 (14.6%) | 249,840 (16.3%) | 59,331 (16.6%) | 67,820 (10.2%) | 4804 (7.3%) | |
| Saturday | 270,556 (10.3%) | 162,867 (10.6%) | 14,457 (4.1%) | 87,326 (13.1%) | 5906 (9.0%) | |
Abbreviations: MSA, metropolitan statistical area; SD, standard deviation; SMD, standardized mean difference.
All differences were statistically significant, SMD are shown.
Table 2.
Weighted Medications Administered
| Variable | Overall (N = 2,622,926) |
Non-Hispanic Caucasian (N = 1,535,794) |
Non-Hispanic African American (N = 356,582) |
Hispanic (N = 665,173) |
Non-Hispanic Other (N = 65,377) |
SMD |
|---|---|---|---|---|---|---|
| Opioids, n (%) | 1,609,895 (61.4%) | 939,065 (61.1%) | 252,180 (70.7%) | 378,674 (56.9%) | 39,976 (61.1%) | 0.145 |
| Nonopioids, n (%) | 666,151 (25.4%) | 391,693 (25.5%) | 91,533 (25.7%) | 150,431 (22.6%) | 32,494 (49.7%) | 0.293 |
| Antiemetics, n (%) | 1,770,863 (67.5%) | 1,035,718 (67.4%) | 246,335 (69.1%) | 438,257 (65.9%) | 50,553 (77.3%) | 0.134 |
Abbreviation: SMD, standardized mean difference.
In our primary analysis, there was no interaction detected in a covariable-adjusted sampling-weighted model between sex and race/ethnicity on the odds of receiving opioids (interaction P = .74). There were no associations found for opioid receipt for non-Caucasians as compared to Caucasians (OR = 0.99, 95% CI, 0.89–1.10; P = .84) or for more males as compared to females (OR = 0.96, 95% CI, 0.87–1.06; P = .42). Further, there were no differences detected among any of the study groups (non-Caucasian females, non-Caucasian males, Caucasian females, and Caucasian males) on receiving opioids. There was no difference detected in opioid receipt by non-Caucasian males as compared to Caucasian males (aOR = 0.88, 95% CI, 0.39–1.99; P = .75) or for non-Caucasian females as compared to Caucasian females (aOR = 1.01, 95% CI, 0.53–1.90; P = .98) (Figure 2).
Figure 2.
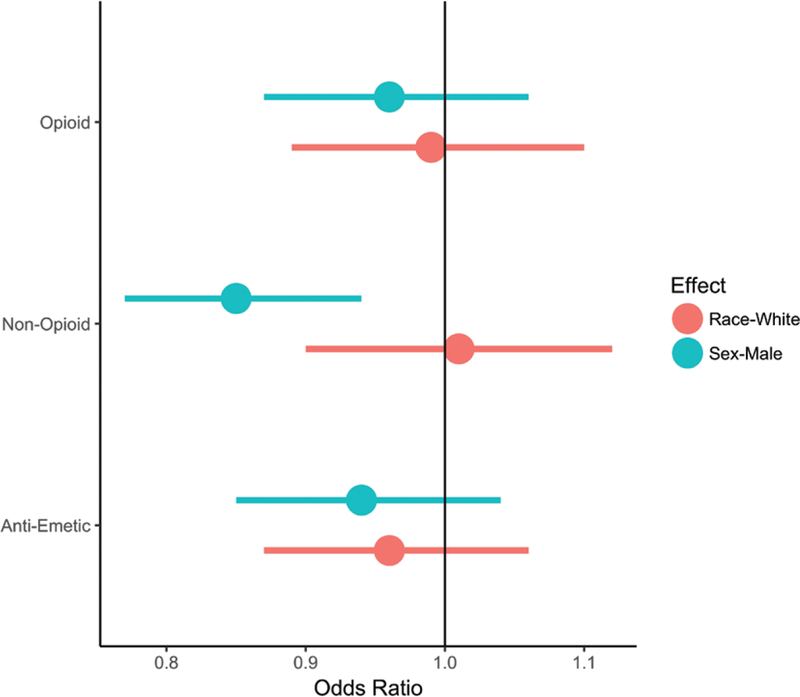
Opioid receipt, race/ethnicity, and sex. No interaction was found between race and sex for the administration of opioids, nonopioid analgesics, or antiemetic medications. There was no difference in the odds of receiving opioids or antiemetics between females and males or between Caucasians and non-Caucasians. Males were less likely to receive nonopioid analgesics than females. Figure displays 95% confidence intervals.
Regarding our secondary outcomes, we did not detect an interaction between sex and race/ethnicity on the odds of receiving nonopioid analgesics (interaction P = .50) or antiemetic medications (interaction P = .30). There was no significant difference in the odds of nonopioid analgesic receipt for Caucasians as compared to non-Caucasians (1.01, 95% CI, 0.90–1.12; P = .89). Males were, however, less likely to receive nonopioids than females (0.85, 95% CI, 0.77–0.94; P = .003). In both sex groups, the odds of receiving nonopioids did not differ between non-Caucasian and Caucasian patients (males: aOR = 1.70, 95% CI, 0.46–6.22; P = .42; females: aOR = 0.92, 95% CI, 0.47–1.81; P = .82). Similarly, there was no significant difference in the odds of antiemetic medication administration for non-Caucasians as compared to Caucasians (OR = 0.96, 95% CI, 0.87–1.06; P = .42) or males as compared to females (0.94, 95% CI, 0.85–1.04; P = .24). Across both sex groups, non-Caucasian and Caucasian patients did not differ on the odds of receiving antiemetics (males: aOR = 0.82, 95% CI, 0.33–2.03; P = .646; females: aOR = 1.71, 95% CI, 0.93–3.12; P = .085). Neither wait time to see a provider nor the length of the hospital visit was meaningfully different between sexes (male, female) or ethnicities (non-Hispanic Caucasian, non-Caucasian).
Sensitivity analyses for expanded race/ethnicity confirmed that females did not differ from males in the odds of receiving opioids for any of the studied ethnicities (Caucasian non-Hispanic; African American non-Hispanic; Hispanic). In additional sensitivity analyses, there was no interaction between race and insurance status (interaction P = .51) or between race and age (interaction P = .76) for the primary outcome of opioid receipt (Figure 3).
Figure 3.
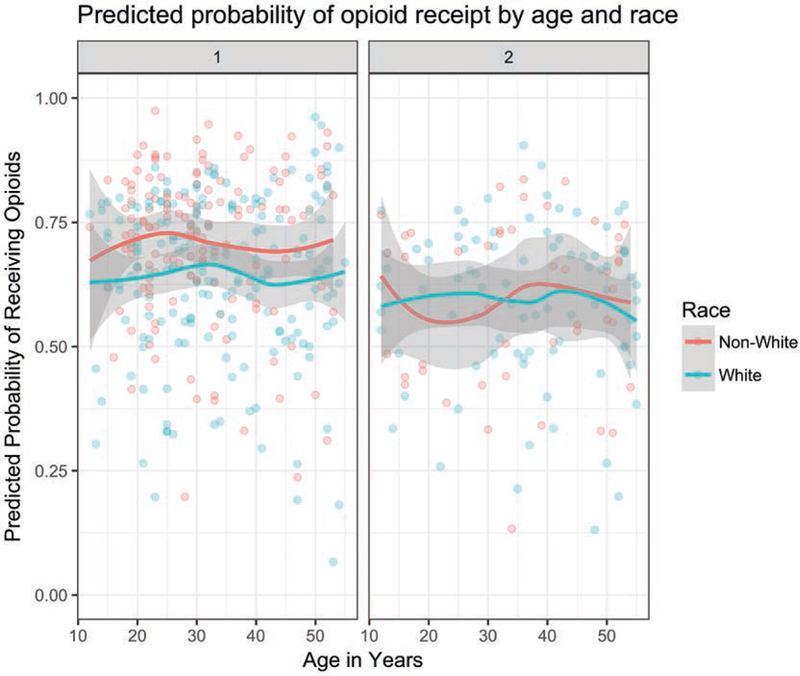
Sensitivity analysis of age-related effects. In adjusted analysis, Caucasian and non-Caucasian patients did not differ on the odds of receiving opioids across the age range of the study sample. The curves were generated using a GAM smoother from ggplot2 in R. Figure displays 95% CIs.
DISCUSSION
In this study of patients with diagnosed appendicitis or gallbladder disease, we examined the association of 2 sociodemographic factors—both race/ethnicity and sex together—on opioid administration in the ED. There was not a synergistic effect of race/ethnicity and sex on receipt of opioid analgesia in the ED. Further, we did not find a difference between non-Caucasian and Caucasian patients on the odds of receiving opioid analgesia. Caucasians and non-Caucasians across both sexes did not differ on odds of receiving nonopioid analgesics or antiemetic medications. We did not find a significant difference for males as compared to females or for Caucasians as compared to non-Caucasians with respect to wait time to see a provider or stay in the ED.
Several studies have examined the association between race/ethnicity and analgesic receipt in the ED among adult and pediatric populations. Pletcher et al’s2 study averaged NHAMCS data from 1993 to 2005 and revealed that African American, Hispanic, and Asian patients were less likely to receive opioids than Caucasian patients for “pain-related” visits (OR = 0.66, 95% CI, 0.62–0.70; 0.67, 95% CI, 0.63–0.72; 0.79, 95% CI, 0.67–0.93, respectively).2 A more recent study of 2006–2010 NHAMCS data showed that African American non-Hispanics were 0.78 (95% CI, 0.67–0.90) times less likely to receive any analgesia and 0.83 (95% CI, 0.71–0.96) times less likely to receive opioids than Caucasian non-Hispanics when presenting to the ED with acute abdominal pain.3 However, Hispanic patients were no less likely to receive analgesics than Caucasian non-Hispanics (OR = 0.93, 95% CI, 0.79–1.10).3 In another study, Hostetler et al8 analyzed 6 years of NHAMCS data to show that among all ED patients, African American patients were less likely to receive intravenous analgesia or sedation than Caucasian patients (OR = 0.9, 95% CI, 0.8–1.00). But this difference did not remain when the population was stratified into those with orthopedic or wound-related injuries.8 Single-institution studies have provided further understanding of how race/ethnicity might play into treatment in the ED.6,7 Mills6 did not find a difference in receipt of any form of analgesia among Caucasian and non-Caucasian patients in the ED for back and abdominal pain, but Caucasian patients were more likely to receive opioids (OR = 1.10, 95% CI, 1.06–1.13) and have shorter wait times to receive them (98 vs 90 minutes, P = .004).6 Similarly, Heins et al7 demonstrated that Caucasian and African American patients were equally likely to receive analgesics, but Caucasian patients are more likely to receive opioids during their visit (OR = 1.9, 95% CI, 1.2–2.8) and at discharge (OR = 2.0, 95% CI, 1.3–2.9).7 Large database research among pediatric populations has shown a significant association between race/ethnicity and analgesia in the ED. Johnson et al5 showed a lower odds of analgesic or opioid administration for abdominal pain to African American as compared to Caucasian children (OR = 0.61, 95% CI, 0.43–0.87; OR = 0.38, 95% CI, 0.18– 0.81).5 Likewise, Goyal e al4 demonstrated a lower odds of opioid administration to African American as compared to Caucasian patients who presented with appendicitis to the ED (OR = 0.2, 95% CI, 0.06–0.8).4
The literature on sex disparities in analgesic administration to adults is ambiguous. Of studies focusing on EDs, some have demonstrated that women are more likely to receive analgesia for acute pain, with ORs from 1.16 to 1.7.3,8 Other literature has suggested that women are less likely to receive analgesia or opioids. In a study from the University of Pennsylvania, women were 13%–25% less likely to receive opioid analgesia for abdominal pain and waited longer for any form of analgesia than male patients.10 Siddiqui et al9 showed that women with abdominal pain were less likely to receive analgesia within the first 180 minutes of a visit (OR = 0.91, 95% CI, 0.84–0.97) as compared to men, but there was no such sex discrepancy for patients with fracture pain,9 and there is still further literature that does not show any difference for female as compared to male patients.2,7 We do not know of any studies that have examined sex-based disparities in analgesic administration among pediatric populations.
We know of only 1 study which examined the interaction of sex and race/ethnicity on the administration or receipt of analgesia in the ED. Pletcher et al2 analyzed 1993–2005 NHAMCS data with regards to opioid prescription both to all patients and to Caucasian as compared to other racial groups to document trends over time.2 As part of the analysis, the researchers checked for a sex–race/ethnicity interaction and did not find one.2 Our findings serve as confirmation of Pletcher et al’s2 prior investigation— but for a surgical patient population. On the one hand, in covering recent data, our study may reflect effective discourse about minority sociodemographic groups as well as increased awareness of health care disparities. On the other hand, it is interesting to note the trend of our results, even if they are not statistically significant. Non-Caucasian males were less likely to receive opioids and antiemetics and more likely to receive nonopioids than Caucasian males; non-Caucasian females were much more likely to receive antiemetics and less likely to receive nonopioids than Caucasian females. Further studies, perhaps using data sets designed to answer such questions, might be able to elucidate whether these findings do, in fact, reflect a difference in care.
Our sample population consisted of patients with select surgical conditions and from a narrow age range. We were interested in potential surgical patients given our fields of practice in Emergency Medicine and Anesthesiology. We also limited our diagnoses to include those for which opioids are considered standard of care. In our clinical experience, patients with appendicitis or gallbladder disease present to medical care with a degree of pain that requires and is usually treated with opioids. The age range of our sample was selected to avoid comorbidities and the particular physiology associated with younger or older patients. Moreover, we were interested in how age might affect racial differences in opioid administration, especially given the changing demographics of the US population. One of the interesting findings of our study was that non-Caucasian and Caucasian patients did not differ in the odds of receiving opioids across the age range of our sample.
One of the consequences of undertaking this research was grappling with the complexity involved in using NHAMCS database, particularly when answering questions about non-Caucasian populations. Our first analysis mistakenly coded sampling weights as frequency weights, and this resulted in far too narrow variance estimates. The database was not designed to examine questions about sub-populations (racial/ethnic or otherwise) and as such the precision around the estimates creates difficulty in generating inferences. These issues speak to the complexity of the NHAMCS database, the necessity of careful precision in analyzing and reading analyses of it, and the limitations of using it.
Our study has several limitations. First, NHAMCS assigns each visit a weight so that 1 visit represents many unobserved visits, introducing the possibility of selection bias. This is a known shortcoming in using this database, but it has been used to explore and demonstrate important findings. Second, as with any clinical study, our inclusion/exclusion criteria based on surgical diagnosis, age, and even race/ethnicity may limit generalizability to other populations. Third, we lacked access to a range of variables that might have revealed additional nuance. Further information about patients’ primary language or chronic opioid use, for example, might influence opioid administration by an ED provider. Likewise, without medication doses, it was impossible to compare received quantities: a different picture might emerge if, for example, non-Caucasian males were to receive larger doses than other groups. Similarly, NHAMCS only supplies pain score at intake so we could not assess for the clinical consequences of pain medication administered during an ED visit. In fact, the database includes the ED visit, but excludes the rest of the perioperative and postoperative period; the effect of this scope is that we cannot study further how pre-operative opioid use may be a risk factor for prolonged postoperative opioid use.18 The absence of key variables prevents us from a perfectly complete assessment of opioid management in the ED. Moreover, NHAMCS does not yet include transgender as a variable. Indeed, clinical research is only beginning to explore the unique set of challenges transgendered patients face. Future studies might involve multiple centers, allowing for both generalizability and inclusion of such important and evolving variables.
In our modeling approach, the events per variable ratio were lower than the traditional rule of thumb (1:10). To address this limitation, we estimated several models with increasing size (Table 3). The events/predictor ratio was smallest (4.0) for the fully adjusted nonopioid model. Although there was no evidence of sparse data bias, the interpretation of this model becomes more difficult.
Table 3.
Adjusted Odds of Receiving Drugs for Non-Caucasians as Compared to Caucasians.
| Outcome | Sex | Model 1a OR (95% CI) |
P | Model 2b OR (95% CI) |
P | Model 3c OR (95% CI) |
P |
|---|---|---|---|---|---|---|---|
| Opioids | Female (ref = Caucasian) | 1.14 (0.59–2.21) | .694 | 1.13 (0.61–2.11) | .696 | 1.01 (0.53–1.90) | .984 |
| Male (ref = Caucasian) | 0.69 (0.30–1.59) | .388 | 0.94 (0.40–2.22) | .885 | 0.88 (0.39–1.99) | .752 | |
| Nonopioids | Female (ref = Caucasian) | 0.83 (0.37–1.85) | .647 | 0.97 (0.48–1.98) | .936 | 0.92 (0.47–1.81) | .818 |
| Male (ref = Caucasian) | 1.25 (0.44–3.53) | .677 | 1.51 (0.47–4.86) | .495 | 1.70 (0.46–6.22) | .425 | |
| Antiemetics | Female (ref = Caucasian) | 0.97 (0.50–1.88) | .935 | 1.42 (0.78–2.58) | .250 | 1.71 (0.93–3.12) | .085 |
| Male (ref = Caucasian) | 1.07 (0.47–2.41) | .878 | 0.82 (0.35–1.92) | .642 | 0.82 (0.33–2.03) | .664 | |
| Degrees of freedom | 3 | 13 | 34 |
Abbreviations: CI, confidence interval; OR, odds ratio.
Unadjusted.
Adjusted for: age, pain scale, region, number of comorbidities.
Adjusted for: model 2 + emergent, working hours, day, month, year.
We did not find a statistically significant difference in opioid and nonopioid analgesic administration to patients with appendicitis or gallbladder disease: non-Caucasian patients did not differ from Caucasian patients on the odds of receiving opioid analgesics across both sexes. Our work also serves to demonstrate both the possibility and limitations of utilizing large national databases like NHAMCS to examine ED care of surgical patients. Given that such databases are not designed for observational studies nor have the sample sizes to test questions about racial/ethnic disparities, future studies might employ other sources, including single-center databases and multicenter collaborations. These projects might also hone in on patient care provided by anesthetists: the effect of race-sex interaction during the preoperative, intraoperative, or postoperative period.
Supplementary Material
KEY POINTS.
Question: What is the association between administration of opioid analgesics in the emergency department and the interaction of race/ethnicity and sex?
Findings: There was no interaction between sex and race for administration of opioids and there was no difference in opioid administration to males as compared to females or to non-Caucasians as compared to Caucasians. In adjusted weighted analysis, non-Caucasian and Caucasian non-Hispanic males did not differ on receipt of opioids, with aOR = 0.88, 95% CI, 0.39–1.99; P = .752; non-Caucasian females also did not differ from Caucasian females on receipt of opioids, aOR = 1.01, 95% CI, 0.53–1.90; P = .984.
Meaning: Across both sexes, non-Caucasians were just as likely to receive opioids as Caucasians. We found no interaction between race and sex for opioid administration in the emergency department.
ACKNOWLEDGMENTS
The authors gratefully acknowledge Hovig Chitilian, MD, Assistant Professor, Department of Anesthesia, Critical Care, and Pain Medicine, Massachusetts General Hospital, Boston, MA; Jeanine Wiener-Kronish, MD, Professor and Chief, Department of Anesthesia, Critical Care, and Pain Medicine, Massachusetts General Hospital, Boston, MA.
Footnotes
Supplemental digital content is available for this article. Direct URL citations appear in the printed text and are provided in the HTML and PDF versions of this article on the journal’s website (www.anesthesia-analgesia.org).
DISCLOSURES
Name: Julia M. Rosenbloom, MD.
Contribution: This author helped conceive, design, and conduct the study, coordinate the data, contribute to the statistical analysis plan, interpret the data, and write and revise the manuscript.
Name: Sara M. Burns, MS.
Contribution: This author helped conceive, design, and conduct the study, coordinate the data, contribute to the statistical analysis plan, perform the statistical analysis, interpret the data, and write and revise the manuscript.
Name: Eugene Kim, MD.
Contribution: This author helped design the study, interpret the data, and write and revise the manuscript.
Name: David A. August, MD, PhD.
Contribution: This author helped design the study, interpret the data, and write and revise the manuscript.
Name: Vilma E. Ortiz, MD.
Contribution: This author helped design the study, interpret the data, and write and revise the manuscript.
Name: Timothy T. Houle, PhD.
Contribution: This author helped conceive, design, and conduct the study, coordinate the data, contribute to the statistical analysis plan, perform the statistical analysis, interpret the data, and revise the manuscript.
The authors declare no conflicts of interest.
REFERENCES
- 1.Smedley BD, Stith AY, Nelson AR. Unequal Treatment: Confronting Racial and Ethnic Disparities in Health Care. Washington DC: NAP; 2003. [PubMed] [Google Scholar]
- 2.Pletcher MJ, Kertesz SG, Kohn MA, Gonzales R. Trends in opioid prescribing by race/ethnicity for patients seeking care in US emergency departments. JAMA. 2008;299:70–78. [DOI] [PubMed] [Google Scholar]
- 3.Shah AA, Zogg CK, Zafar SN, et al. Analgesic access for acute abdominal pain in the emergency department among racial/ethnic minority patients: a nationwide examination. Med Care. 2015;53:1000–1009. [DOI] [PubMed] [Google Scholar]
- 4.Goyal MK, Kuppermann N, Cleary SD, Teach SJ, Chamberlain JM. Racial disparities in pain management of children with appendicitis in emergency departments. JAMA Pediatr. 2015;169:996–1002. [DOI] [PMC free article] [PubMed] [Google Scholar]
- 5.Johnson TJ, Weaver MD, Borrero S, et al. Association of race and ethnicity with management of abdominal pain in the emergency department. Pediatrics. 2013;132:e851–e858. [DOI] [PMC free article] [PubMed] [Google Scholar]
- 6.Mills AM, Shofer FS, Boulis AK, Holena DN, Abbuhl SB. Racial disparity in analgesic treatment for ED patients with abdominal or back pain. Am J Emerg Med. 2011;29:752–756. [DOI] [PubMed] [Google Scholar]
- 7.Heins JK, Heins A, Grammas M, Costello M, Huang K, Mishra S. Disparities in analgesia and opioid prescribing practices for patients with musculoskeletal pain in the emergency department. J Emerg Nurs. 2006;32:219–224. [DOI] [PubMed] [Google Scholar]
- 8.Hostetler MA, Auinger P, Szilagyi PG. Parenteral analgesic and sedative use among ED patients in the United States: combined results from the National Hospital Ambulatory Medical Care Survey (NHAMCS) 1992–1997. Am J Emerg Med. 2002;20: 139–143. [DOI] [PubMed] [Google Scholar]
- 9.Siddiqui A, Belland L, Rivera-Reyes L, et al. A multicenter evaluation of the impact of sex on abdominal and fracture pain care. Med Care. 2015;53:948–953. [DOI] [PMC free article] [PubMed] [Google Scholar]
- 10.Chen EH, Shofer FS, Dean AJ, et al. Gender disparity in analgesic treatment of emergency department patients with acute abdominal pain. Acad Emerg Med. 2008;15:414–418. [DOI] [PubMed] [Google Scholar]
- 11.Fingar KR, Stocks C, Weiss AJ, Steiner CA. Most frequent operating room procedures performed in US hospitals, 2003–2012. HCUP Statistical Brief #186. December 2014. Agency for Healthcare Research and Quality, Rockville MD: Available at: https://www.hcup-us.ahrq.gov/reports/statbriefs/sb186-0perating-Room-Procedures-United-States-2012.pdf. Accessed September 6, 2017. [PubMed] [Google Scholar]
- 12.Steiner CA, Karaca Z, Moore BJ, Imshaug MC, Pickens G. Surgeries in hospital-based ambulatory surgery and hospital inpatient settings, 2014 HCUP Statistical Brief #223. May 2017. Agency for Healthcare Research and Quality; Rockville, MD: www.hcup-us.ahrq.gov/reports/statbriefs/sb223-Ambulatory-Inpatient-Surgeries-2014.pdf. Accessed September 6, 2017. [PubMed] [Google Scholar]
- 13.Centers for Disease Control and Prevention. Ambulatory Health Care Data. Available at: https://www.cdc.gov/nchs/ahcd/ahcd.htm. Accessed August 31, 2017.
- 14.Jones SS, Thomas A, Evans RS, Welch SJ, Haug PJ, Snow GL. Forecasting daily patient volumes in the emergency department. Acad Emerg Med. 2008;15:159–170. [DOI] [PubMed] [Google Scholar]
- 15.Marcilio I, Hajat S, Gouveia N. Forecasting daily emergency department visits using calendar variables and ambient temperature readings. Acad Emerg Med. 2013;20:769–777. [DOI] [PubMed] [Google Scholar]
- 16.Weiss AJ, Wier LM, Stocks C, Blanchard J. Overview of emergency department visits in the United States, 2011 HCUP Statistical Brief #174. June 2014. Agency for Healthcare Research and Quality; Rockville, MD: Available at: http://www.hcup-us.ahrq.gov/reports/statbriefs/sb174-Emergency-Department-Visits-Overview.pdf. Accessed September 6, 2017. [PubMed] [Google Scholar]
- 17.Tumin D, Tobias JD. Comment on “Race/ethnicity and sex and opioid administration in the emergency room.” Anesth Analg. 2019;128:e79. [DOI] [PubMed] [Google Scholar]
- 18.Bedard NA, Pugely AJ, Westermann RW, Duchman KR, Glass NA, Callaghan JJ. Opioid use after total knee arthroplasty: trends and risk factors for prolonged use. J Arthroplasty. 2017;32:2390–2394. [DOI] [PubMed] [Google Scholar]
Associated Data
This section collects any data citations, data availability statements, or supplementary materials included in this article.