

Abstract
The administration of exogenous insulin into the hippocampus has the potential to enhance cognitive function and exert other beneficial effects. Elucidating the neurobiological substrates of insulin action and its underlying physiological mechanisms may further improve treatment efficacy. Previous work has shown that insulin affects synaptic plasticity, however there are discrepancies and contradictory conclusions between studies. Here, we used extracellular field recordings in mouse hippocampal slices to investigate how insulin acutely modulates synaptic transmission and synaptic plasticity, both of which are correlated with learning and memory processes. Our data demonstrate that insulin application inhibited basal excitatory synaptic transmission and promoted long-term potentiation (LTP) induction at hippocampal Schaffer collateral-CA1 synapses. Under similar conditions, insulin strongly activated the PI3K/AKT pathway, but had only a weak effect on the MAPK/ERK pathway. Although insulin-induced inhibition of field excitatory post-synaptic potentials (fEPSPs) was previously termed insulin-long-term depression (insulin-LTD), insulin application potentiated recovery from classically induced LTD. Further analysis suggests suppression of presynaptic neurotransmitter release contributed to the insulin-LTD. At low concentrations, insulin primarily inhibited fEPSPs; however, at high concentration, its effects were of mixed inhibition and enhancement in different recordings. Moreover, a broad spectrum protein kinase C blocker, cannabinoid receptor type 1 activator, or a high glucose concentration inhibited fEPSPs per se, and disturbed insulin’s effect on fEPSP. Insulin also caused depotentiation during LTP expression and triggered depression during LTD recovery. Given the essential roles of dynamic synaptic transmission and plasticity in learning and memory, our data provide more evidence that insulin application may actively modulate hippocampal-dependent cognitive events.
Keywords: hippocampus, insulin, LTP, LTD
Introduction
Insulin, insulin-like growth factors (IGFs), and their corresponding receptors, are present in broad brain areas including the hypothalamus, hippocampus, and olfactory bulbs. Insulin and IGFs may act as neuropeptides to exert pleiotropic functions (Huang et al., 2010, Duarte et al., 2012, Lee et al., 2016, Konishi et al., 2017). In the hypothalamus, the role of insulin signaling on energy expenditure and the regulation of feeding behavior is well known. In the hippocampus, insulin signaling is believed to be associated with learning and memory processes (Ghasemi et al., 2013). Moreover, insulin resistance has a causal link with obesity, diabetes, age-related cognitive decline, and dementia (Candeias et al., 2012, Boucher et al., 2014, Biessels and Reagan, 2015, Stranahan, 2015, Chami et al., 2016). Dysfunctional insulin signaling in the brain often manifests as the decline of insulin levels and the impairment of insulin receptor signaling. Therefore, research and clinical practice have attempted to ameliorate impaired cognitive performance by intraventricular administration of exogenous insulin; intranasally, or intraperitoneal injection. Although such investigations have yielded encouraging results at the behavioral level (Benedict et al., 2007, Shemesh et al., 2012), some controversies remain (Maimaiti et al., 2016, Bell and Fadool, 2017). In particular, it is not clear whether, at which condition, or how administration of exogenous insulin improves hippocampal cognitive activity. In fact, reports regarding the impact of exogenous insulin on hippocampal activity have been somewhat contradictory. The purpose of this study is to investigate the effect of insulin on different aspects of hippocampal function in the hopes that this will help solidify specific conclusions within the field.
The hippocampus performs learning and memory functions. Its distinct neuronal activities, circuitry, and synaptic plasticity are believed to be the anatomic and physiological bases that correlate with many aspects of the cognitive process. Insulin accumulation in the hippocampus is derived not only from the periphery, penetrating through the blood-brain barrier, but also from activity-dependent release of neurons as well as various glial cells (Ghasemi et al., 2013). Investigations in neuronal cultures and in vivo manipulation of insulin receptor expression have revealed the roles of insulin in the regulation of neuronal growth, survival, proliferation, and differentiation. Whole cell recording studies in brain slices, dissociated neurons, and HEK293 cells demonstrate insulin affecting voltage-gated ion channel expression and electrophysiological activity (Wan et al., 1997, Liao and Leonard, 1999, Skeberdis et al., 2001, Spicarova and Palecek, 2010, Lo et al., 2016). All these results suggest insulin affects central nervous system (CNS) activity at the structural as well as functional level.
Learning and memory processes are based on neural circuit dynamic activities. Synaptic plasticity rather than single neuronal activity is critical for information processing, encoding, and storage. Synaptic plasticity changes such as LTP and LTD in the hippocampal CA1 region are well-known models to study cognitive performance (Malenka and Bear, 2004). Although there is evidence demonstrating modulation of insulin on various ion channels at the single-cell level and modification of synaptic plasticity at neural circuitry activity, these data are insufficient to illuminate insulin’s modulation on brain activity at a higher level. The mechanisms by which insulin inhibits neural activity at single cell and circuit levels (Palovcik et al., 1984, Jin et al., 2011), while promoting integral brain activity and enhancing learning and memory (Kullmann et al., 2017) remain poorly understood. To address this seeming contradiction, we set out to test the impact of insulin on basal fEPSP and synaptic plasticity in hippocampal slices using a variety of experimental paradigms and interventions. We discovered that the effects of insulin are complex, with the outcome of studies dependent on concentration and experimental paradigm.
Experimental Procedures
Mice.
Two hundred and one C57BL/6 male mice, 2-5 months old, (Charles River) were used to conduct this project. Use of all animals was approved by and in accordance with the Ohio State University Animal Care and Use committee.
Brain slice and fEPSP recordings.
Mice were anesthetized with isoflurane before decapitation. Brains were rapidly removed and placed in an ice-cold cutting solution containing the following (in mM): Sucrose 250, D-Glucose 25, KCl 2.5, NaHCO3 24, NaH2PO4 1.25, CaCl22.0, MgSO4 1.5, and Kynurenic acid 1.0 (pH; 7.3-7.4). Hippocampal coronal slices (400 μm) were prepared with a Vibratome (VT1200S, Leica). Brain slices were transferred to chambers filled with artificial CSF (aCSF; bubbled with 95% O2 and 5% CO2) containing the following (in mM): NaCl 124, KCl 3, NaHCO3 24, NaH2PO4 1.25, CaCl22, MgSO4 1.0, and D-Glucose 10, (pH; 7.3-7.4), and allowed to recover at 37°C for 30 min. Slices were then moved to room temperature for at least 1 hour. Slices were then transferred to a submerged chamber maintained at 32°C and a gravity perfusion system drove solution exchange with oxygenated aCSF at rate of 2-3 ml/min during recording.
Local field excitatory synaptic postsynaptic potentials (fEPSPs) from the stratum radiatum of the CA1 area were recorded with Borosilicate glass electrodes (1.5-5 MΩ, filled with aCSF containing 100 μM Picrotoxin) and evoked by electrical stimulation (100 μS duration, every 20 s) of the Schaffer collateral fibers (SC-CA1). Stimulation was delivered through a custom-made twisted nichrome wire stimulating electrode placed near the CA3-CA1 border. Input–output (I/O) curves were generated for each slice with stimulation intensity varying from 0-1.0 mA at each 0.1 mA step. The stimulation intensity which evokes around 50% of the maximum response, without emergence of population spikes, was chosen to conduct the experiments. Synaptic field potentials were low-pass filtered at 1 kHz and digitally sampled at 50 kHz. The baseline was monitored for 15-20 min to establish a consistent response. The peak of the evoked fEPSPs was measured and normalized to the preconditioning 5 min averaged baseline. The ratio of paired-pulse facilitation (PPF) was calculated on trace 2 divided by trace 1. The burst ratio with 5 pulses at different frequencies were evaluated as the response in trace 5 divided by trace 1. Data were monitored on-line and analyzed off-line using Clampex 10.6 software. Further analysis and graph creation were conducted with Microsoft Excel.
Western Blotting.
Isolated hippocampal slices were separated into two groups. One set received no insulin and the other set was incubated with 10 nM insulin at 32 °C for 30 min in oxygenated aCSF. After treatment, tissue samples were homogenized in ice-cold Pierce RIPA buffer containing 1× Roche Phosstop and Calbiochem protease inhibitor cocktail III. Tissue lysates (30 μg/lane) were loaded into and separated using a gradient gel (4-20%, Mini-PROTEAN TGX, Bio-Rad), and transferred to a nitrocellulose membrane (BIO-RAD). Blots were incubated overnight at 4 °C with the following primary antibodies from Cell Signaling, P-AKT (S473) (#9271, 1:1000), total ART (#9272, 1:1000), P-p44/42 MAPK (T202/Y204) (#9101, 1:1000), and p44/42 MAPK (#9102, 1:1000). Blots were rinsed and incubated with HRP-conjugate secondary antibody (1:3000, BIO-RAD). Chemiluminescence signal was detected and visualized by LI-COR Odyssey Fc imaging system (LI-COR Biotechnology, Lincoln, NE). Quantification analysis was carried out with image studio software version 5.2 (LI-COR Biotechnology).
Reagents.
Insulin (Sigma) was prepared with distilled water (pH; 2.47) and aliquoted and stored at −20 °C. Working concentrations of insulin were diluted with aCSF and applied to the slice through gravity perfusion. Other chemicals: kynurenic acid and picrotoxin (Sigma); indinavir sulfate, chelerythrine, Win 55-212-2, AM251, 6-cyano-7-nitroquinoxaline-2, 3-dione (CNQX) (Tocris), and D-(−)-2-Amino-5-phosphonopentanoic acid (D-AP5) (Santa Cruz), were prepared following manufacturer’s instruction.
LTP.
LTP was induced with 4 trains consisting of 100 pulses (4×100) at an interval of 20 s. LTD was induced by a conventional protocol constituted by delivery of 900 pulses, at 1 Hz, for 15 min. 5 Hz and 10 Hz protocols to evoke LTD were conducted for 3 min and 1.6 min to deliver 900 pulses in total. The paired-pulse low-frequency stimulation (PP-LFS, 50 mS interval) to evoke LTD (PP-LTD) was delivered for 15 min and the total number of pulses reached was 1800. Strong low-frequency stimulation (SLFS, 50 mS interval) was also used to induce LTD. This SLFS was delivered for 15 min and the final pulses reached 2700. Stimulation intensity and duration were constant throughout the entire experiment. The effect of insulin was calculated from the lowest fEPSP value obtained during application normalized to the point just prior to starting the insulin application. LTP induction and expression was calculated from the 2 min averaged value around the 30 min period after LTP induction. LTD induction and recovery were assessed by normalizing the lowest point after induction and the 30 min point to preconditioning 5 min averaged. All data were digitized using an Axopatch 200B amplifier, Digidata 1440A, and pClamp 10.6 software (Molecular Devices).
Statistical analysis.
All data are expressed as mean ± SEM. Statistical analysis was performed using Graphpad Prism. The number of mice utilized is reported and the “n” value represents the number of slices recorded in total. No correction was made for nested data. All data were tested for normality using the Shapiro-Wilk test and significance was determined with either parametric (normally distributed) or non-parametric (not normally distributed) methods as appropriate. Any potential difference in the standard deviation between samples was also taken into account in the use of the statistical analysis. Unpaired t test (two-tailed; 95% confidence interval, with or without Welch’s correction due to non-equal standard deviation) or two tailed Man-Whitney test (non-parametric) was employed for analysis of two individual samples. One-sample Wilcoxon test, was used for determining significance of normalized data (to either 1 or 100 as appropriate). Either a standard ANOVA analysis with Tukey’s multiple comparison test or a non-parametric Kruskal-Wallis AVOVA was utilized for analyzing multiple values. The specific statistical analysis used is reported within the figure legends.
Results
Insulin inhibits basal fEPSPs
We first examined the effect of insulin on neurotransmission in the SC-CA1 pathway of the hippocampus by focusing on basal fEPSPs. Recordings were conducted in adult mice (2-5 months old) to focus on the impact of insulin on mature circuits rather than the developmental influence of insulin (Zhao et al., 2010). In agreement with previous reports, insulin inhibited the basal fEPSPs (Huang et al., 2004, van der Heide et al., 2005) (Fig. 1A–C). The effect manifested within several minutes of application and often remained as long as insulin was within the bath, although some recordings showed evidence of a persistent effect (Fig. 1B). Applications of 0.5, 1, 10, and 100 nM insulin all inhibited basal fEPSP (Fig. 1 A–D). The effect also appeared concentration dependent (Fig. 1D) as 0.5 nM insulin inhibited fEPSP to 61.2% of control (n=5 slices from 3 mice), 10 nM to 47.95 % (n=29 slices from 12 animals), 100 nM to 33.76 % (n=3 slices from 5 animals).
Fig. 1. Insulin inhibits local field excitatory synaptic postsynaptic potentials (fEPSPs) in the hippocampus.
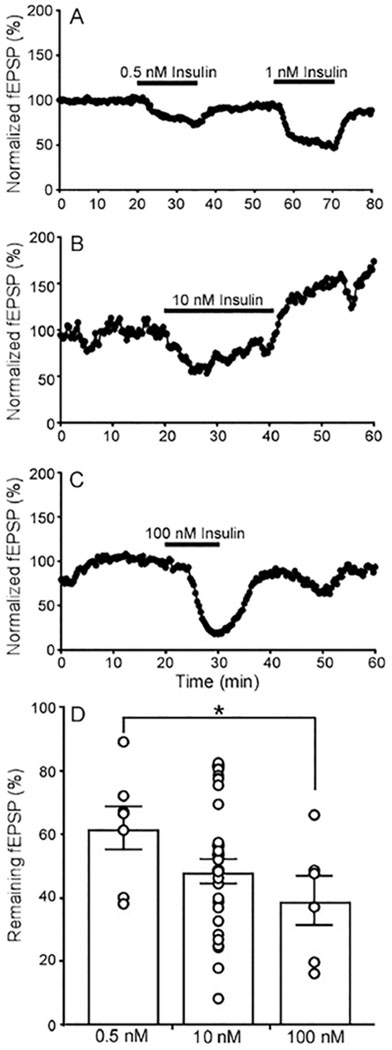
fEPSPs were measured from the stratum radiatum of the CA1 area and evoked by electrical stimulation of the Schaffer collateral fibers (100 μs duration, every 20 s). (A-C) Representative recordings of fEPSPs with insulin application (black bar above trace) at 0.5 and 1 nM (A), 10 nM (B), and 100 nM (C). (D) Quantification of the percentage of the fEPSP remaining during insulin additional at different concentrations. Circles represent individual recording; bars are the mean and s.e.m., 0.5 nM (n=7 slices from 3 mice), 10 nM (n=29 from 12 mice), 100 nM (n=6 slices from 3 mice). Insulin has a significant effect in all samples (0.5 nM insulin P = 0.0014, t=5.605, df=6; 10 nM insulin P<0.0001, t=13.67,df=28; and 100 nM insulin P = 0.0005, t=7.856, df=5; One sample t test compared to 100 value). *P < 0.05 0.5 nM compared to 100nM insulin unpaired parametric two-tailed t-test, t = 2.226, df = 11; P = 0.0479.
The insulin receptor is broadly expressed in hippocampal synaptic areas. In order to determine whether insulin affects pre- or post-synaptic components of fEPSPs, a five pulse burst stimulating protocol at four different frequencies was applied (Abramov et al., 2009, Murakami et al., 2013) (Fig. 2A). The physiological concentration of insulin in the brain is reported to be less than 1 nM. However, local accumulation of insulin can come from plasma circulation as well as activity-dependent insulin release from neurons and various glial cells (Ghasemi et al., 2013). Thus, the concentration of insulin could be 10-100 times higher than that measured in the blood within specific microdomains in the brain. For these experiments we chose to focus on the effects of 10 nM insulin as this concentration produced a robust response and is within concentrations that might be experienced locally in the brain, and has been used to study the effects of insulin in the brain previously. In the 5, 25, 50, and 100 Hz burst stimulating protocols (5 pulses), 10 nM insulin application significantly increased the ratio of trace 5/1 (Fig. 2A–D). This suggests that insulin depressed fEPSPs, at least in part, by inhibiting presynaptic neurotransmitter release. Pooling data reveal the augmentation of the burst ratio was positively correlated with burst stimulation frequencies (Fig. 2D).
Fig. 2. Insulin affects neurotransmitter release evaluated with 5 pulse bursts.
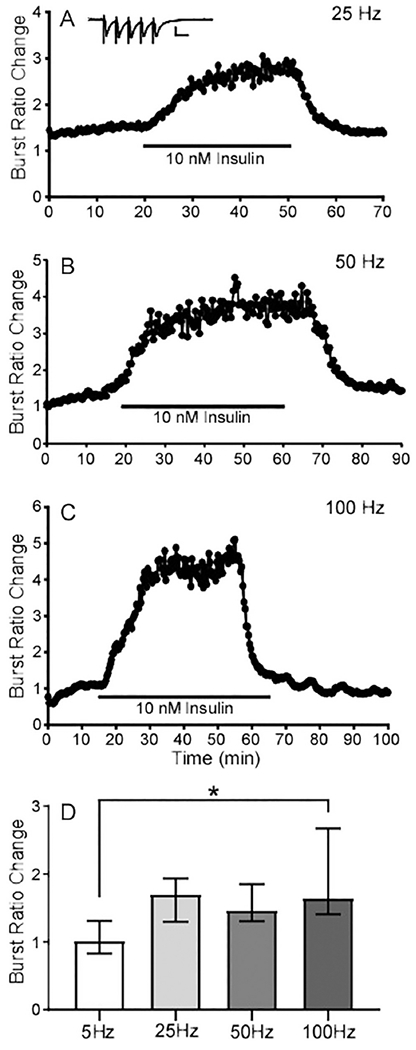
(A) Representative recording of relative change in fEPSP during a 5 pulse burst (25Hz) in the presence of 10 nM insulin. The burst ratio was obtained by calculating the 5th fEPSP relative to the first (5/1). Inset graph shows one example of a burst recording with scale bars representing 1 mV (y axis) and 10 mS (x axis). (B) Representative recording of 10 nM insulin and the burst ratio with 50 Hz stimulation. (C) Representative recording of 10 nM insulin and the burst ratio with 100 Hz stimulation. (D) Median of the burst ratio change with four different frequencies; 5 Hz (n=5 slices from 4 mice), 25 Hz (n=8 slices from 4 mice), 50 Hz (n=12 slices from 7 mice), and 100 Hz (n=30 slices from 13 mice). Error bars represent the interquartile range. * Adjusted P value = 0.0045 between 5 Hz and 100Hz using Kruskal-Wallis AVOVA with Dunns multiple comparison.
High concentrations of insulin have diverse effects on basal fEPSP
A dramatic change in insulin levels could have different effects on fEPSPs. Further, some experiments have used very high concentration of insulin for experimental analysis (Spicarova and Palecek, 2010, Mebel et al., 2012). In testing higher concentrations of insulin (500 nM and 1μM), we found that the impact of insulin on fEPSPs was variable (Fig. 3, A–D). Specifically, application of 500 nM insulin inhibited fEPSPs by approximately 50% in 43% (n=29/67 from 19 mice) of recordings (Fig. 3A); enhanced fEPSPs substantially in 22% (n=15/67 from 12 mice) of recordings (Fig. 3B), and had little to no effect in 34% of recordings (n=23/67 from 15 mice). When averaged together, 500 nM insulin created a neutral mean due to this potential bimodal or trimodal modulation (Fig. 3E). Similar results were observed with even higher concentrations of insulin. Applying 1 μM insulin decreased fEPSPs (Fig. 3C) in 6/12 slices from 3 mice and increased fEPSPs in 6/12 slices in another 3 mice (Fig. 3D). Thus, there was also no average change in fEPSPs across slices with 1 μM insulin (Fig. 3E), although most slices showed a definite change in fEPSPs with the administration of 1 μM insulin.
Fig. 3. High concentrations of insulin exert different effects on fEPSPs.
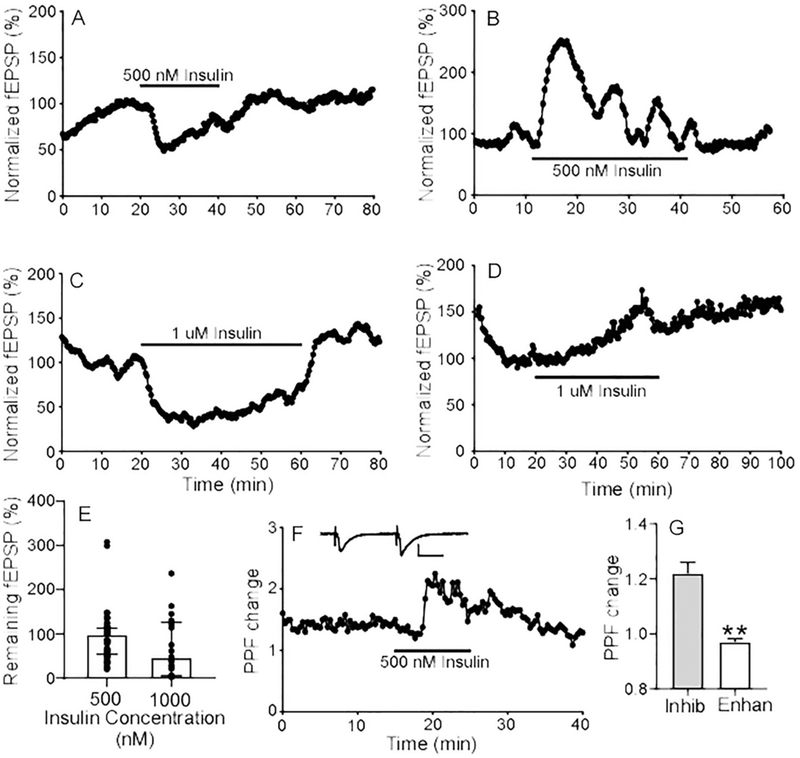
Representative recordings of 500 nM insulin inhibiting fEPSP magnitude in one recording (A) and enhancing fEPSPs in another recording (B). Representative recordings of 1 μM insulin inhibiting fEPSP (C) and enhancing fEPSP (D). (E) Quantification of the change in fEPSPs with administration of 500 nM and 1 μM insulin. Circles represent the value of individual recordings; Graph is the median and error bars represent the interquartile range with 500 nM (n=67 slices from 46 mice) and 1 μM insulin (n=12 slices from 6 mice). Overall, there is no significant effect of 0.5 uM insulin (P = 0.055, One sample Wilcoxon test compared to 100) or 1 uM insulin (P = 0.1037, one sample t test compared to 100) (F) Representative recording of 500 nM insulin on PPF. The paired pulse ratio (PPF change) was calculated from the response to pulse 2 relative to pulse 1. Inset recording shows a representative trace for PPF measurement (scale bar indicates 1 mV (y axis) and 10 mS (x axis)). (G) Analysis of the molecular differences in insulin response between recordings. Graph shows quantification of average PPF ratio change with 500 nM insulin in recordings where insulin either enhanced fEPSPs (left) or inhibited fEPSPs (right). Error bars represent the SEM. Note that there was a significant difference in the paired pulse ratio between recordings where insulin enhanced fEPSPs versus inhibited fEPSPs. ** P<0.0001, unpaired two-sided t-test (unpaired t-test with Welch’s correction due to unequal standard deviation, F = 11.66, DFn = 25, and Dfd = 21).
In order to determine whether high concentrations of insulin affect pre- or post-synaptic components of fEPSPs, a standard pair-pulse facilitation (PPF) paradigm was applied (Abramov et al., 2009, Murakami et al., 2013). As shown in Fig. 3F, high concentrations of insulin (500 nM) enhanced the paired-pulse ratio 122% (n=26 slices from 24 animals). An increase in paired pulse ratio (PPF) is generally considered to reflect inhibition of presynaptic release. As mentioned above, high concentrations of insulin exert bimodal or trimodal effects on fEPSPs. Therefore, we focused on the correlation between changes of PPF and fEPSPs. In a dataset in which 500 nM insulin application decreased fEPSPs to 50.92% (n=20 slices from 15 animals), the corresponding change in the PPF was 1.21 (Fig. 3G). We also assessed the effects of insulin on fiber volley (FV) in a subset of recordings where 500 nM insulin inhibited fEPSPs. Application of 500 nM insulin affecting fEPSPs in these slices but had no effect on FV (FV changed to 99.83%, n=37 slices from 15 animals), indicating that insulin modulation of synaptic activity is not mediated by altering the number of presynaptic fibers recruited. Together, these data imply that presynaptic release was inhibited by exposure to insulin in slices that showed a decrease in fEPSPs with insulin. In contrast, the PPF was unchanged in slices exposed to 500 nM insulin where the fEPSPs were enhanced or unchanged. In this group, fEPSPs were increased to 177.9% (n=12 slices from 10 animals) while the PPF was 1.05 (Fig. 3G). This suggests that insulin’s enhancing effect on fEPSPs might not arise from potentiation of presynaptic release, but rather from other mechanisms such as alterations in postsynaptic channels or astrocyte activity (Ji et al., 2011, Fernandez et al., 2017).
The variable responses to high concentrations of insulin we observed might partially explain the conflicting results reported by others (Ramsey et al., 2005, Diogenes et al., 2012). It is also possible that the divergent effects of high concentrations of insulin are due to differences in the signaling pathways predominately affected by insulin within different recordings. Interestingly, supra-physiological amounts of insulin were recently reported to reactivate PI3K signaling after this pathway was inhibited and potentially trigger other PI3K-independent responses (Hopkins et al., 2018). Based on the diverse impacts of insulin at high concentration and the fact that these concentrations are not likely to be physiological and occurs only when insulin is directly injected into the brain for study, we chose to focus on lower concentrations of insulin (10 nM) for the remainder of the manuscript.
Insulin activates the PI3K/AKT pathway in hippocampal slices
Phosphoinositide 3 kinase (PI3K/AKT) and Ras/mitogen-activated protein kinase (MAPK/ERK) are two canonical pathways activated following insulin receptor activation and mediate different functions. The ART pathway initiates GLUT4 trafficking and modulates ion channels activity. The ERK pathway modulates cell growth and survival. To determine which pathways were activated, we analyzed AKT as well as ERK1/2 phosphorylation states following 10 nM insulin administration (Fig. 4A). Exposure to 10 nM insulin significantly increased phospho-AKT levels while had little effect on phospho-ERK1/2 (Fig. 4B, C). Consistent with previous reports, this result indicates that insulin signaling in hippocampal slices within our studies is mainly mediated through the AKT pathway (Wrighten and G. Piroli, 2016, Kubota et al., 2018).
Fig. 4. Western blotting analysis of AKT and ERK1/2 activation in isolated hippocampal slices after 10 nM insulin stimulation.

(A). Western Blot analysis of slices exposed to vehicle or insulin (10 nM) showing the amounts of phopho-AKT, total AKT, phospho- ERK, and total ERK. (B) Quantifications of the relative amount of phospho-AKT (relative to total AKT) with control or insulin. **P = 0.0003 unpaired t- test with Welch’s correction due to unequal standard deviation, F=534.1. DFn=3, Dfd = 3. (C) Quantifications of the relative amount of phospho-ERK (relative to total ERK) with control or insulin. P = .3622 with unpaired t test, t = 0.9860, df = 6. Bars are mean and s.e.m, n=4 mice per group,
Insulin enhances NMDA components
A typical fEPSP from the hippocampal CA1 region is due to potential activation of two types of glutamate receptor: the AMPA receptor (AMPAR) and the NMDA receptor (NMDAR). The basal fEPSP is mainly mediated by AMPARs, particularly the GluR2 subunit (Terashima et al., 2017). Yet, NMDAR-dependent signaling is critical for initiating synaptic plasticity and learning and memory (Li et al., 2007). To allow measurement of the NMDAR component, Mg-free ACSF was used to remove Mg2+ inhibition of NMDAR at the basal resting state. Use of the NMDAR antagonist D-AP5 (10 μM) and AMPAR antagonist CNQX (10 μM) confirmed both the AMPAR and NMDAR components could be assessed in our fEPSP recordings from CA1 (Fig 5A). With Mg-free ACSF, 10 nM insulin significantly enhanced fEPSPs to 185.98 % (n=9 slices from 7 animals, Fig. 5B, D). This is in contrast to our previous studies done in the presence of magnesium (Fig. 1B), which showed 10 nM insulin inhibited fEPSPs. In order to further investigate the molecular mechanisms of this alteration, we perfused insulin (10 nM) along with the NMDAR antagonist D-AP5 (10 μM) in the same magnesium free conditions. As shown in Fig. 5C and D, insulin did not increase the fEPSPs in the absence of NMDAR. In fact, fEPSPs were profoundly inhibited by insulin (20.57±3.09%, n=3/15). These results suggest that insulin has distinct effects under different conditions. When the NMDA receptor is unblocked, fEPSPs are enhanced suggesting that NMDA receptor activity is enhanced by insulin. However, when the NMDA receptor is inhibited by the presence of magnesium (or D-AP5), insulin inhibits fEPSPs mediated by the AMPA receptors. Such a result might provide a direct causal link between the divergent effects of insulin in the hippocampus.
Fig. 5. Insulin enhances fEPSPs under magnesium free conditions.
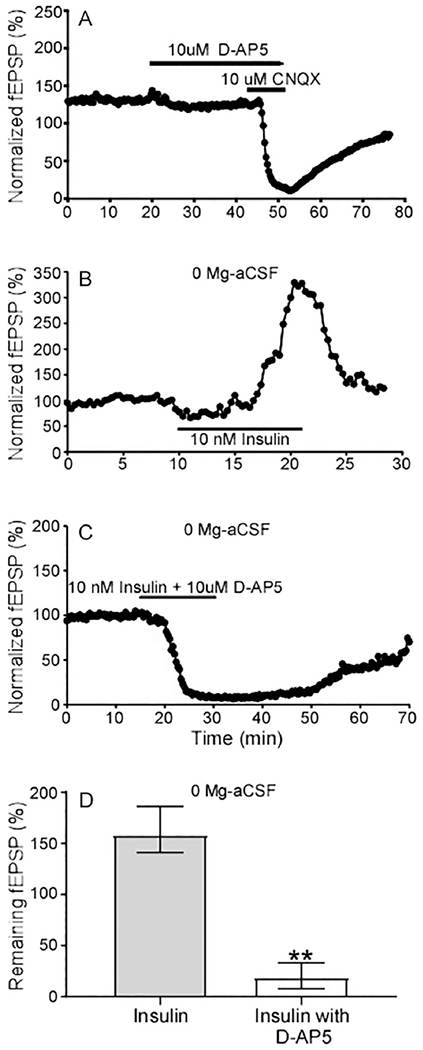
(A) Representative recording of the impact of the AMPAR blocker CNQX and the NMDAR blocker D-AP5 during fEPSP recording. (B) Representative recording of the effect of insulin addition on fEPSPs in Mg-free ACSF. (C) Representative recording of the effect of insulin in magnesium free conditions in the presence of the NMDAR inhibitor 10 μM D-AP5. (D) Quantification of results of the impact of insulin in magnesium free conditions with (n=15 slices from 3 mice) and without D-AP5 (n=9 slices from 7 mice). Data are medians and the error bars represent the interquartile range, ** P<0.0001, nonparametric two tailed Mann-Whitney test.
Insulin can inhibit, or be switched to enhancing fEPSPs under some conditions
As described above, insulin predominantly inhibits fEPSPs under basal states. However, insulin can induce distinct effects on synaptic transmission in the hippocampus. Thus, the response to insulin may be modulated by many physiological and pathological factors, for example, insulin resistance develops under diabetic as well as obese conditions. In this section, we investigated whether PKC signaling or endocannabinoids might affect insulin’s electrophysiological property.
First, we examined the potential modulation of PKC on insulin using a broad-spectrum PKC antagonist, chelerythrine (1 μM). The exposure to chelerythrine decreased fEPSPs progressively. After the remaining fEPSPs were stable, 10 nM insulin increased fEPSPs to 178.73% (n=4/6) in the presence of PKC antagonist (Fig. 6A, D). This suggests that PKC blockade converts the effects of insulin from inhibition to enhancement. Next, we investigated whether endocannabinoids were involved in insulin signaling modulation. Endocannabinoids are released with neuronal activity, modulate synaptic plasticity, and serve as an important retrograde messenger involved in hippocampal learning and cognition. In the ventral tegmental area (VTA), endocannabinoids are reported to mediate the inhibition of insulin signaling (Labouebe et al., 2013). To assess whether endocannabinoids were involved in insulin inhibition of fEPSP, cannabinoid receptor 1 (CB1R) antagonist AM251 (2 μM) was added to block CB1R, which is, expressed in both GABA and glutamate presynaptic terminals. Upon fEPSP reaching a stable state in the presence of AM251 (Fig. 6B), 10 nM insulin inhibited remaining fEPSP to 61% (n=11 slices from 5 animals), indicating that CB1R blockade failed to abolish the inhibitory effects of insulin on basal fEPSP (Fig. 6B, D). Conversely, CB1R agonist Win 55-212-2 (1 μM) was perfused to activate CB1R. This reduced the fEPSPs substantially (Fig. 6C). After the fEPSPs stabilized in the presence of CB1R agonist, 10 nM insulin enhanced remaining basal fEPSP to 193.49 % (n=10 slices from seven animals) (Fig. 6D).
Fig. 6. PKC and cannabinoid receptor modulators affect insulin effects on fEPSP.

(A) Representative recording of the impact of chelerthrine (1μM) and insulin (10 nM) on fEPSPs. (B) Individual recording of insulin addition in the presence of the cannabinoid receptor antagonist AM 251. (C) Representative recording of the effect of the cannabinoid receptor agonist Win 55-212-2 and insulin (10 nM). (D) Quantification of the effect of insulin when administered alone (Ins, n = 29 slices from 12 mice) or in the presence of the PKC inhibitor chelerythrine (n=6 slices from 4 animals, P = 0.0083 compared to insulin alone), the cannabinoid receptor antagonist AM251 (n=11 slices from 5 mice, P = 0.4756 compared to insulin alone), or the cannabinoid receptor agonist Win 55-212-2 (n=10 slices from 7 mice, P = 0.0007 compared to Insulin alone). Data are mean and s.e.m, ** P<0.0001, Welch ANOVA (W = 20.66, DFn = 3.00, DFd = 12.38) with Dunnett’s T3 multiple comparisons to insulin only control.
The effect of insulin can be regulated by high glucose concentration
To determine whether insulin’s effects on fEPSP require its promotion of glucose uptake, three modes of manipulating glucose influx were employed before insulin application. First, indinavir (50 μM) was used to block glucose uptake mediated by glucose transporter 4 (GLUT4), which is expressed in hippocampal neurons and is sensitive to insulin in peripheral tissues (Pearson-Leary et al., 2018). Perfusion of indinavir alone inhibited fEPSP to 56.27% (n=4/11), and this effect was reversible after washout. Once indinavir’s inhibition became stable, application of 10 nM insulin still inhibited the remaining fEPSP to 56.27% (n=4/11) and its pattern of inhibition was similar to that observed in control analysis (Fig. 7A, D). This suggests that blocking glucose influx does not prevent insulin-mediated inhibition of fEPSPs. Given that the effects of insulin on neurons in certain brain regions can be modulated by changes in glucose concentrations (Suyama et al., 2016), we also tested low glucose conditions by reducing the normal glucose concentration of 10 mM to 5 mM (low dose). Low glucose concentration (5 mM) inhibited fEPSP to 58.62 % (n=5/15), which was comparable to that found with indinavir administration. Under these low glucose conditions, 10 nM insulin further reduced the fEPSPs an additional 50% (Fig. 7B, D). These results suggest that insulin-mediated reductions in fEPSPs were insensitive to low glucose. In physiological conditions, brain insulin accumulation is usually accompanied by a concomitant rise in glucose (Molnar et al., 2014). Therefore, we tested a high glucose condition (20 mM). High dose glucose itself in ACSF inhibited basal fEPSP to 59.31% (n=11 slices from 3 animals) (Fig 7C). The addition of 10 nM insulin under high glucose conditions increased the remaining fEPSP to 165.2% (n=9 slices from 3 animals) (Fig. 7C, D). These results are contrary to those obtained under normal or low glucose conditions where insulin inhibited fEPSPs. Together, these results indicate that the result of insulin exposure is dynamic and modified by extracellular glucose conditions.
Fig. 7. Glucose concentrations influence insulin effects on remaining fEPSP.
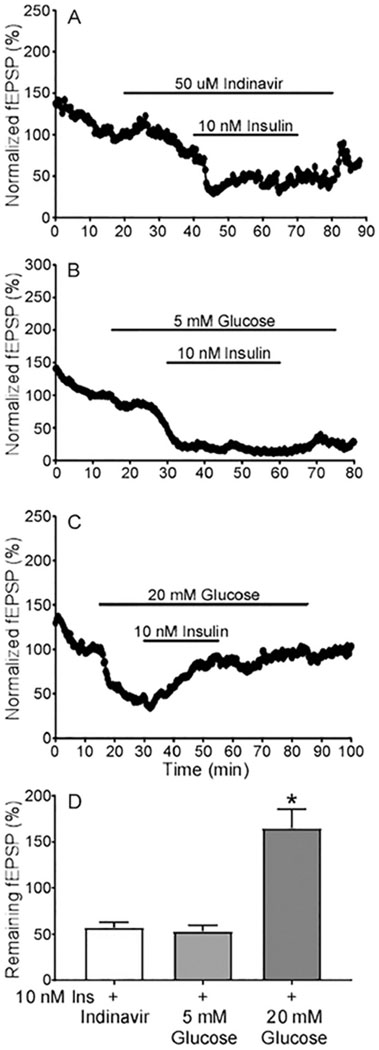
(A) Representative recording illustrating the impact of insulin after treatment of Glut4 blocker indinavir. (B) Trace showing the effect of lowering the glucose concentration (from 10 mM to 5 mM) during recording fEPSPs and the impact of insulin under these lower glucose concentrations. (C) Representative recording showing the effect of raising the glucose concentration (from 10 mM to 20 mM) during recording fEPSPs and the impact of insulin under these higher glucose concentrations. (D) Quantification of the effect of insulin when glucose levels are altered. Data are means ± SEM, indinavir + insulin (n= 13 slices from 4 mice), 5mM glucose + insulin (n=11 slices from 5 mice), and 20 mM glucose + insulin (n=9 slices from 3 mice). Welch ANOVA (W = 13.10, DFn = 2.000, DFd = 15.94) with multiple comparison test, *P = 0.0017 Indinavir relative to 20 mM glucose, **P = 0.0013 5mM glucose relative to 20mM glucose, P = 0.8876 indinavir versus 5mM Glucose.
Insulin promotes LTP induction
Insulin inhibits fEPSPs and induces one kind of LTD (insulin-LTD), which contrasts with LTP expression. The potential effect of insulin on LTP induction, however, is poorly understood. Therefore, we incubated brain slices with insulin until obtaining a stable fEPSP recording, and then applied a classical LTP inducing protocol (100 Hz; 4 trains, 1 min) in the continued presence of insulin. In one set of experiments, we stimulated and recorded basal fEPSPs prior to adding insulin. Under these conditions, insulin inhibited fEPSPs and LTP induction was impaired. Generally, if the remaining fEPSP was sizable enough, a second high frequency stimulation induced LTP. In a second set of experiments, we incubated brain slices with insulin and then initiated stimulation and fEPSP recording. Under these conditions, the impact of insulin was different. Specifically, fEPSPs in slices incubated with insulin prior to stimulation were not substantially different compared to those measured in the absence of insulin. There appeared to be some subtle difference in the I-O curve in slices exposed to insulin in this manner (Fig. 8A), however the data did not reach statistical significance. These effects are similar to that of NMDAR blocker MK-801, in which treatment at rest minimally affects subsequent evoked NMDA-eEPSCs (Atasoy et al., 2008). To induce LTP in slices exposed to insulin before recordings occurred, a classic stimulation protocol (100 Hz; 4 trains, 1 min) was employed. As shows in Fig. 8B, slices exposed to 10 nM insulin displayed enhanced LTP expression at later time points compared to control slices. Specifically, a four-train protocol induced LTP to 128.63% (n=40 slices from 22 animals) in control recordings. With 10 nM insulin treatment, LTP reached 153.07% (n=31 slices from 16 animals) (Fig. 8B, G). In some recordings, even though LTP induction was not successful at early period, LTP eventually developed at later period under insulin treatment (Fig. 8C). Together, these results indicate that the presence of insulin can enhance LTP induction and maintenance. However, the experimental design and timing is critical to observing these effects.
Fig. 8. Insulin modulates LTP.
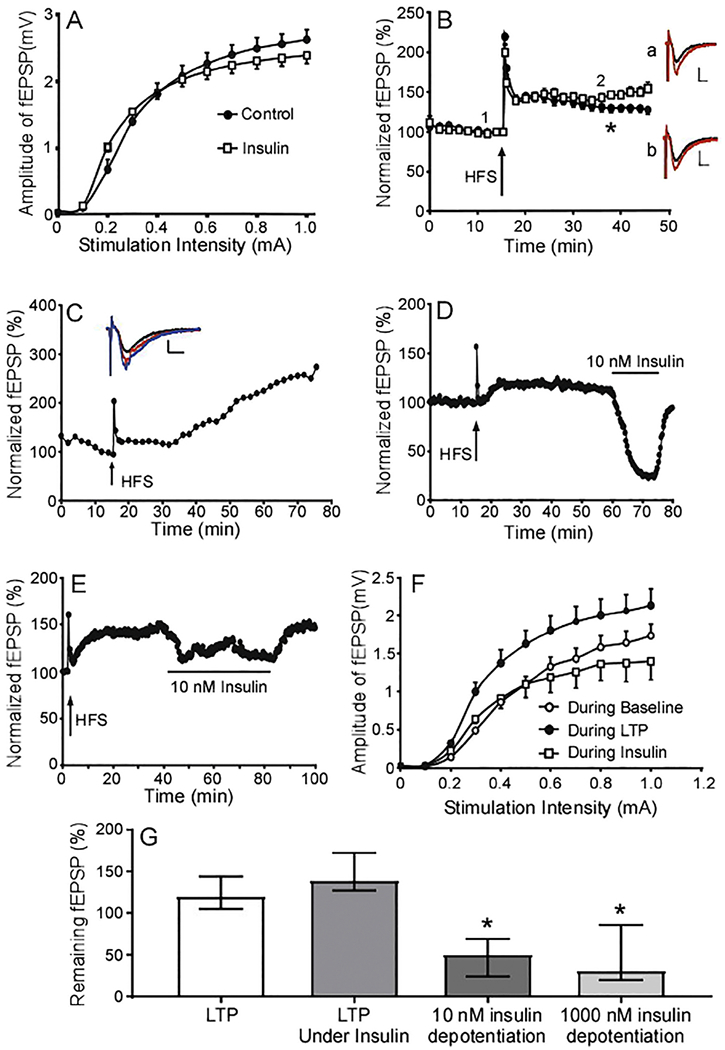
(A) Averaged I-V curves in control slices (circles, n = 22 slices from 9 mice) and those exposed to 10 nM insulin (squares, n = 55 from 12 mice). Note; there is no statistical difference in I/V curves between control and insulin (Mixed-effects analysis, F(1,75) = 0.2065). (B) Averaged profiles of LTP induction with high frequency stimulation (HFS, 4×100) in control slices (circle, n=40 slices from 22 mice) and those exposed to 10 nM insulin (square, n=31 from 16 mice). Insets represent overlays of fEPSP recordings at point 1 (black) relative to point 2 (red). Slices treated with insulin are illustrated in “a” and “b” show the overlay fEPSP traces in control. (C) The long-term impact of insulin following LTP induction with HFS (n=10 slices from 7 mice). Inset graph displays representative overlay fEPSP traces from points 1 (black), 2 (red), and 3 (blue) in the LTP plot below. Scale bar represents 5 mS (x axis) and 0.5 mV (y axis). (D) Representative recording of fEPSPs when insulin (10nM) was administered following LTP development (black bar above trace). (E) The impact of high concentrations of insulin (1 μM) when administered following LTP induction. (F) The averaged I-V curves measured during baseline, after LTP induction, and during 10 nM insulin application following LTP induction. (G) The combined effect of insulin when administered under different conditions. “LTP” represents the median of fEPSP values 30 minutes following LTP induction under control conditions (n = 40 slices from 22 mice). “LTP under insulin” represents median fEPSP value 30 minutes after is LTP induced in the presence of insulin (n=31 slices from 16 mice). “10nM Insulin depotentiation” is the median response to insulin addition following LTP induction (n=10 slices from 5 mice, P = 0.004 compared to LTP, P <0.0001 compared to LTP under insulin 0.01). 1 μM depotentiation represents the impact of high concentrations of insulin following LTP induction (n=7 slices from 7 mice, P < 0.0001 compared to LTP and P < 0.0001 compared to LTP under insulin). Error bars represent the interquartile range. Kruskal-Wallis Multiple comparisons test P < 0.0001, 45.59.
Insulin induces depotentiation during the LTP maintenance period
Previous research has demonstrated that basal fEPSP and the strengthened fEPSP during the LTP period employ different AMPAR components and/or ratios, and use different intracellular molecular mechanisms (Carroll et al., 2001). Our results showed that insulin inhibited fEPSP in hippocampal slices. To assess the effect of insulin on fEPSPs following LTP induction, insulin was perfused during LTP expression after induction with the classic protocol (100 Hz, 4 trains). The application of 10 nM insulin strongly inhibited fEPSP to 48.84% (n=10 slices from 5 animals), and 1 μM insulin inhibited fEPSP to 47.04% (n=7 slices from 7 animals) (Fig. 8D, E, G). This effect is similar to that of insulin inhibiting of basal fEPSP. To determine whether reducing synaptic transmission underlies insulin’s depotentiation, we measured I-O curves prior to LTP induction during baseline recordings, after LTP induction during LTP expression, and after LTP induction with the administration of insulin. As expected, LTP induction increased the I-O ratio compared to baseline (Fig. 8F). Interestingly, administration of insulin reversed these effects while decreasing synaptic transmission.
Insulin modulates LTD induction and recovery
LTD is another critical mechanism for synaptic plasticity, and akin to LTP, also correlates with learning and memory in the hippocampus. Further, LTD was documented to simultaneously develop along with LTP induction (El-Boustani and Ip, 2018). Here we focused on the potential effects of insulin on classic LTD, utilizing several protocols that can induce LTD via different mechanisms. During these experiments, insulin was first applied to the slice prior to stimulation and remained during the entire recording period. Under control conditions, the classical protocol (900 pulses, 1 Hz, 15 min), caused fEPSP to decline to 59.66% (n=17 slices from 11 animals), and after 30 min, fEPSP reached 117.09%. In the presence of 10 nM insulin, the corresponding numbers were 69.78% (n=23 slices from 15 animals) and 125.97%, respectively (Fig. 9A, F, G). The induction threshold of LTD/LTP is not static, however, and affected by many factors in addition to neuronal activity (Megill et al., 2015). The dynamic range of frequency to switch LTD to LTP induction is 1~10 Hz. After establishing a 1-Hz protocol promoting LTD, we tested whether insulin acted similarly with 5- and 10- Hz protocols. (Fig. 9D– G). In this control group (n=6 slices from 3 animals), the fEPSP magnitude after induction of LTD with 5 Hz (900 pluses, 3 min) protocol was 53.83% and 96.34% percent following a 30 min recovery. In the presence of 10 nM insulin (n=7 sides from 3 animals), the corresponding magnitudes were 51% and 173.11%. With the 10 Hz (900 pulses, 1.5 min) protocol, in control recordings (n=14 slices from 3 animals), the magnitude of fEPSP after induction and after 30 min development were 47.86% and 98.69%, respectively. In the presence of insulin (n=11 slices from 4 animals), the corresponding numbers were 49.31% and 126.71%.
Fig. 9. Insulin modulates LTD.

(A-E) Averaged recordings of LTD elicited by distinct protocols under control conditions (dark circles) or in the continued presence of insulin (open squares). Inset graphs show overlayed representative fEPSPs at positions 1 (black), 2 (red), and 3 (blue) of the main recording, “a” are recordings in the presence of insulin and “b” are control. Scale bar indicates 5 mS (x axis) and 0.5 mV (y axis). (A) LTD induced with a classic protocol (900 pulses, 1 Hz) in control (closed circles, n=17 slices from 11 mice) and in the continued presence of insulin (open squares, n=23 slices from 15 mice). (B) LTD induced by 2×900 pluses (interval 50 mS) in control (closed circles, n=8 slices from 4 mice) or insulin (open squares, n=9 slices from 3 mice) conditions. (C) Averaged profiles of LTD induction 3×900 pulses (interval 50 mS) in the presence of insulin (open squares, n=6 slices from 3 mice) and control conditions (closed circles, n=7 slices from 3 mice). (D) Averaged profiles of LTD induction 900 pulses (5 Hz) in the presence of insulin (open squares, n=7 slices from 3 mice) and control conditions (closed circles, n=6 slices from 3 mice). (E) Averaged profiles of LTD induction 900 pulses (10 Hz) in the presence of insulin (open squares, n=11 slices from 4 mice) and control conditions (closed circles, n=11 slices from 3 mice). (F) Graph showing the averaged maximum LTD value elicited by the five protocols above. White columns are control and black columns indicate results obtained in the presence of 10 nM insulin. Note that there is no significant effect of insulin on maximal LTD induction (Unpaired t-test between control and insulin for each induction paradigm). (G) Median data of LTD recovery as measured 30 min after LTD induction (error bars represent the interquartile range). White columns are control and black columns indicate results obtained in the presence of 10 nM insulin. *P = 0.0274 Mann Whitney Test for 2 × 900, P = 0.0379 Mann Whitney Test for 3 × 900). (H) The combined effect of insulin (10nM) on fEPSPs as it relates to the stimulation paradigm as measured 30 minutes after stimulation (error bars are SEM). Control data: closed circle; Insulin data: closed square. Note that in the presence of insulin, stimulation at 0.05, 1, 5, and 10 Hz elicited LTD, whereas 100 Hz elicited LTP. Under control conditions, the effect of stimulation with 0.05, 5 and 100 Hz were less marked. (I) Representative recording of the impact of insulin administered following LTD induction elicited by 2×900 pulses. (J) Median of the impact of insulin when applied following LTD induction (error bars represent the interquartile range) with 1×900 pulses (n=14 slices from 9 animals, **P= 0.0001 compared to control), 2×900 pulses (n=8 slices from 3 mice, **P = 0.0078 compared to control), 3×900 pulses (n=6 slices form 3 mice, P = 0.0311 compared to control), and 5 Hz (n=4 from 3 mice, *P= 0.125 compared to control using the one sample Wilcoxon test compared to the control value of 1.0). Note that the stimulation paradigm used to induce LTD does not alter the impact of insulin when administered following stimulation and the effect of insulin in the different paradigms is not statistically different (Kruskal-Wallis multiple comparisons test).
Although LTD is difficult to induce in mature hippocampal slices with the classic protocol, a protocol with paired and triple pulses can induce a relatively clear LTD profile in most mature slices. Paired-pulse low-frequency stimulation (PP-LFS, 2×900) induces LTD via mGluR-LTD (PP-LTD) (Gladding et al., 2009). To further identify the effect of insulin on LTD induction, we performed PP-LFS. With the PP-LTD (2×900, 15 min) protocol, the fEPSP in the control group (n=8 slices from 4 animals) declined to 33.66% and 84.38% (Fig. 9B). In 10 nM insulin group (n=9 slices from 3 animals), the corresponding fEPSP changes were 37.2% and 167.51%. We also tested LTD when induced by a strong low-frequency stimulation (SLFS), termed SLFS-LTD (Li et al., 2017). With the SLFS-LTD (3×900, 15 min) protocol, the fEPSP declined to 24.38% and 50%in the control group (n=7 slices from 3 animals). With insulin application (n=7 slices from 3 animals), the corresponding numbers were 28% and 89.84% (Fig. 9C). Together, these data suggest that insulin does not affect the development of LTD. However, insulin does promote LTD recovery following induction and can even foster long lasting potentiation following protocols to induce LTD. Based on our data of insulin’s influences on basal fEPSP, LTP, and LTD developing, we created a frequency-response curve (Fig. 9H) demonstrating that insulin enhances circuitry response under physiological frequency range (1-10 Hz) (Paulsen and Sejnowski, 2000). This function is similar to that of BDNF’s effect on synaptic plasticity in the hippocampus (Ikegaya et al., 2002).
Insulin inhibits fEPSP during LTD recovery
After LTD is successfully induced and allowed to enter the recovery period, the magnitude of fEPSP declines and then progressively increases. Here we assessed the effect of insulin specifically on the LTD recovery process by applying 10 nM insulin into bath 20 min post-LTD induction. Insulin inhibited fEPSP with various protocols including the classic LTD protocol, the PP-LTD protocol, and the SLFS-LTD protocol (Fig. 9I, J). This effect, we termed as re-depression, is similar to that of insulin’s depotentiation on LTP.
Discussion
Insulin signaling in the hippocampus has been targeted to improve impaired cognitive activity associated with Alzheimer’s disease (AD), Type 2 diabetes mellitus (T2DM), and obesity (Fernandez and Torres-Aleman, 2012). Insights into the underlying electrophysiological mechanisms of insulin-mediated changes in synaptic transmission and plasticity may further refine treatment efficacy. Our studies in hippocampal slices demonstrate that insulin application inhibited fEPSP in CA1 (insulin-LTD). This effect was mediated in part by inhibition of presynaptic neurotransmitter release. It has been reported that the mechanisms underlying insulin-LTD are insulin-mediated endocytosis of postsynaptic AMPARs as well as GABAA exocytosis (Wan et al., 1997, Man et al., 2000). Thus, our work suggests that insulin may target both pre- and post-synaptic membranes to affect basal synaptic transmission. Increasing insulin concentration results in a complex pattern of modulation which shifts from fEPSP inhibition to fEPSP enhancement. Moreover, our study confirms that insulin enhances the activity of postsynaptic NMDARs, which could account for insulin’s positive effects on learning and memory processes in the hippocampus. In addition, our data show that insulin’s effect on synaptic plasticity depends on signaling factors and can switch from depression to enhancement by PKC inhibition, CB1R activation, and high glucose pre-conditioning. Finally, our data show that insulin promoted LTP induction and LTD recovery. After LTP and LTD were induced by conventional stimulating protocols, insulin application was found to exert a similar inhibition, namely depotentiation of LTP expression and re-depression of LTD recovery. These data collectively suggest that insulin dynamically modulates synaptic transmission and synaptic plasticity, and its modulation relies upon the history of neural circuit and insulin concentration.
Hippocampus-dependent learning process relies on strengthening or weakening of synapses (Citri and Malenka, 2008). AMPAR removal and insertion in the postsynaptic membrane are thought to mediate the acute change in basal fEPSP, with GluR1 insertion fostering LTP and GluR2 export facilitating LTD (Zhou et al., 2017) . Basal fEPSPs are primarily mediated by heterodimers of GluR1/2 and GluR2/3 (Korte et al., 2016). Insulin has been previously shown to promote GluR2 endocytosis and thereby inhibit basal fEPSPs (Wang and Linden, 2000). Our PPF data combined with burst stimulation suggest that presynaptic suppression of glutamate might also contribute to insulin-induced fEPSP reduction. In the VTA, insulin is thought to inhibit presynaptic glutamate release and mediate insulin-LTD by triggering endogenous cannabinoids release from dopaminergic neurons(Labouebe et al., 2013). CB1R is expressed in inhibitory and excitatory nerve terminals within the hippocampus and cannabinoids can be released by CA1 pyramidal neurons (Carlson et al., 2002, Ho et al., 2011). However, we found that the CB1R antagonist AM 251 failed to block insulin’s inhibition on basal fEPSP. These results suggest that insulin-mediated LTD in the hippocampus occurs through a different mechanism compared to the VTA. Our results also confirm that LTD in the CA1 is insensitive to CB1 blockers. Given that the insulin receptor localizes to the postsynaptic membrane in neurons (Ghasemi et al., 2013), our data indicating that insulin suppresses presynaptic glutamate release might have two further meanings. In one side, insulin activates IGF-1 receptor which is distributed in presynaptic terminals and likely responds to insulin at high concentrations (Gazit et al., 2016). Central application of insulin or IGF1 exerts several overlapping physiological outcomes which vary in strength. However, disruption of the corresponding insulin or IGF1 receptors in the brain leads to remarkably different effects on physiology (Kleinridders, 2016). In another side, insulin might promotes released transmitter uptake by astrocytes in proximity, which also express abundant insulin receptor and form a tripartite synapse with multiple pre- and post-synaptic components (Oliveira da Cruz et al., 2016). It was documented insulin can exert a receptor-dependent impact on astrocytic glutamate uptake via activating the excitatory amino acid transporter (Poblete-Naredo et al., 2009). However, our fEPSP recording approach cannot further distinguish whether the primary effect of insulin is mediated by neurons or astrocytes. Future patch recordings of astrocytes or synaptosomes from pyramidal neurons would provide more information to better narrow these possibilities.
Insulin application promotes GluR2 internalization at a rapid rate while facilitating GluR1 surface expression through a slower process (Man et al., 2000, Adzovic and Domenici, 2014, Viswaprakash et al., 2015). Considering basal fEPSPs mainly involves the GluR2 subunit, insulin-mediated inhibition of fEPSPs could be explained by reductions in surface expression of GluR2. In some recordings, however, insulin was found to enhance fEPSP following inhibition. Further, the fEPSP magnitude was increased in a subset of recordings with higher insulin concentrations (Fig. 3B, D). These results could be caused by enhanced GluR1 surface expression. Intriguingly, almost all neuroactive molecules that improve cognition at the behavioral level, including insulin, have been reported to significantly enhance GluR1 expression as well as other postsynaptic signaling elements (Viswaprakash et al., 2015, Zhang et al., 2016). Nevertheless, the exact change in GluR2 surface localization is unclear. Previous work indicates that insulin-mediated GluR1 localization to the postsynaptic membrane appears to correlate more with early learning and memory processes (Zhao et al., 2004, Adzovic and Domenici, 2014). Specifically, GluR1 exocytosis is involved in LTP induction, and later LTP expression requires GluR2 exocytosis (Tanaka and Hirano, 2012, Penn et al., 2017).
Postsynaptic NMDAR activation and the consequent rise in intracellular Ca2+ concentration is the critical step to initiate formation of learning and memory in the hippocampus (Huganir and Nicoll, 2013, Antunes et al., 2016). Our study shows that insulin application enhanced synaptic transmission in the absence of magnesium, when the NMDAR activity is unencumbered. This suggests that insulin enhances the NMDA component of the fEPSPs and agrees with previous reports (Huang et al., 2004). Combined with insulin’s inhibition on GluR2 and enhancement of GluR1 and GABAA, insulin’s activation on NMDAR forms the fundamental basis for neural circuitry and brain area to process information (Ferrario and Reagan, 2017). Further, our data suggest insulin application can influence both LTP and LTD. LTP is defined as strengthening fEPSP after high frequency stimulation (Rumpel et al., 2005, Whitlock et al., 2006). In our study, insulin was found to inhibit basal fEPSP but promote LTP induction later. At first glimpse, these findings seem to be contradictory. However, there is an inverse relationship between basal fEPSP and LTP induction and development (Jia et al., 1996, Slutsky et al., 2004, Dine et al., 2015). In addition, synaptic scaling is an important mechanism to adjust basal synaptic activity to prevent LTP induction and expression from reaching a saturated state and preventing responses to additional consecutive learning tasks (Moser et al., 1998). Therefore, inhibiting basal fEPSPs and promoting LTP induction are beneficial for encoding information. This regulatory mechanism of insulin is similar to that of astrocytic purinergic signaling, which coordinates synaptic networks and enhances the dynamic range for LTP induction (Pascual et al., 2005). Of note, inhibiting basal fEPSPs may not be sufficient to promote LTP induction. Further, reduction of basal fEPSPs and LTP induction is not always aligned. For example, glucocorticoids, which mediate the stress response, depress both basal excitatory synaptic transmission and LTP induction (Wosiski-Kuhn et al., 2014). Moreover, soluble amyloid-β protein oligomers have no effect on basal fEPSP but inhibit LTP induction (Shankar et al., 2008). Similarly, alcohol addiction leads to increased excitatory synaptic transmission and decreased levels of LTP (Almonte et al., 2017). Among agents known to enhance cognition, leptin inhibits fEPSP but enhances LTP (Xu et al., 2008, Malekizadeh et al., 2017). IGF-2 and norepinephrine have no effect on fEPSP but also increase LTP (Hu et al., 2007, Chen et al., 2011). BDNF increases both basal fEPSP and LTP induction (Kang and Schuman, 1996, Leal et al., 2017). Overall, molecular mediators, such as insulin, can have variable effects on fEPSPs and LTP.
Besides prompting LTP, our results also show that insulin modulates LTD. Although insulin inhibits basal fEPSPs and induces one kind of LTD (insulin-LTD), our data suggest that insulin-LTD does not completely occlude LTD induced by several conventional stimulation protocols. However, our results suggest that insulin promotes LTD recovery. In mature hippocampal slices, classic LTD cannot always be induced successfully with standard protocols (15 min, 1 Hz) (Dong et al., 2012). The developmental switch of NMDA receptor subunit 2B (NR2B) to 2A (NR2A) expression may be associated with this change, as NR2B helps to mediate LTD while NR2A promotes LTP induction (Korte et al., 2016). Insulin is known to activate both NR2A and NR2B subunits (Christie et al., 1999). This might explain insulin facilitating LTD recovery after induction because NR2A expression predominates in mature hippocampal slices (Korte et al., 2016). Although LTD induction with the classic stimulation protocol can be difficult, strengthening low frequency stimulation from 900 pulses to a paired-pulse (PP, 2×900 pulses) even to more strong low-frequency stimulation (SLFS, 3×900 pulses), we could induce relatively typical PP-LTD and SLFS-LTD, respectively. Under such conditions, insulin application again promoted LTD recovery, van der Heide and colleagues report that the frequency–response curve of synaptic plasticity is shifted to the left in the presence of insulin, which could contribute to the insulin-induced enhancement of cognition (van der Heide et al., 2005). The frequency range for the LTD to LTP switch is 1~10 Hz (Bear, 1995). We modified the 1 Hz LTD evoking protocol to 5 Hz or 10 Hz. Under both conditions, LTD induction in the beginning appeared similar to that induced by 1 Hz, whereas insulin application more clearly promoted LTD recovery, particularly at 5 Hz. This finding further indicates that insulin potentiates LTP induction within the LTD-induced frequency range. A common theory is that LTP establishes the connectivity within a network, whereas LTD accomplishes the fine-tuning of these connections (Korte et al., 2016). In vivo recordings reveal that novel environment exploration induces LTD (Xu et al., 1998). Insulin alone induces LTD at low frequency (at 0.05 Hz in our recordings), but promotes LTD recovery at a slightly higher frequency range (van der Heide et al., 2006). Interestingly, our data hints without stimulation (before stimulation), insulin application doesn’t significantly inhibit the following fEPSP recording even though in such condition insulin was demonstrated to activate signaling pathway and GluR2 endocytosis. This strongly indicates the potential endocytosis site located in extrasynaptic area, and therefore, no clear inhibition on following fEPSP recording. Collectively, insulin exerts broad modulation on synaptic plasticity.
LTP and LTD are induced within a narrow time window. However, after induction, LTP and LTD expression (maintenance) can persist for various periods of time. The maintenance aspect of LTP is thought to underlie the storage of memory (Nabavi et al., 2014). LTD is correlated with novelty exploration (Kemp and Manahan-Vaughan, 2004). Our study found that insulin application resulted in depotentiation during LTP maintenance and re-depression during LTD development. Depotentiation is an activity-dependent process that weakens synapses. This process is thought to work in conjunction with LTP and LTD (Nabavi et al., 2014). Depotentiation is actively involved in erasing some memory formation and extinction processes (Moult et al., 2009). In this regard, insulin appears to exert opposite actions. However, depotentiation is more relevant to memory consolidation than it is to memory formation or LTD (Cooper and Bear, 2012). Together, insulin’s modulation on cognitive function not only correlates with learning and memory processes, but also exhibits a different role at different stages of cognition. At early stages of learning and memory formation, insulin is proposed to play a memory-enhancing effect (Zhao et al., 2004), but it is also proposed that the plasticity-mediating effect of insulin on the CNS exerts a detrimental effect on the capacity to learn new content (Feld et al., 2016). Insulin’s re-depression during LTD might reflect this intervening effect on some cognition (Feld et al., 2016).
Physiological and pathological conditions as well as life habits can influence insulin signaling and efficacy. For instance, insulin resistance progressively develops in T2DM and obesity. In order to address how insulin signaling is acutely regulated by other transduction elements and under different physiological conditions, we specifically probed the effects of PKC antagonist, CB1R activator, and low and high glucose concentration on insulin-induced changes of basal fEPSP. Our results provide a few answers but at same time raise several questions. First, our findings indicate that PKC inhibitors could switch insulin’s inhibition of fEPSP in the basal state to enhancement and also inhibit insulin’s depotentiation during LTP expression. Conventional PKC-coupled-signaling is reported to be involve in the induction of insulin-LTD (Huang et al., 2004). Protein kinase M zeta (ΡΚΜζ) is a persistently active PKC isoform proposed to maintain late-LTP and long-term memory (Sacktor and Hell, 2017). Insulin-induced upregulation of ΡΚΜζ contributes to its memery-enhancing effect (Adzovic and Domenici, 2014). Reconciling the inhibition of PKC with enhancement of fEPSP in our study remains to be solved. Second, activating CB1R in presynaptic terminals is usually expected to inhibit neurotransmission. In our present investigation, insulin reduced presynaptic release. Therefore, under Win 55-212-2 treatment, insulin was expected to exert more inhibition on fEPSP. Surprisingly, our data showed CB1R agonists increased remaining fEPSP. This result indicates the putative target might be the transmission between pyramidal neurons and astrocytes. Indeed, there is abundant CB1R and insulin receptor expression in astrocytes (Malarkey and Parpura, 2008, Navarrete and Araque, 2008). The physiological property of this neuron-astrocyte communication is different from classic pre- and post-neurotransmission. More importantly, our data directly demonstrates CB1R activation, which occurs in the context of drug use or addiction, might disturb insulin’s effect. Third, our data suggest that insulin’s effects on fEPSP are not mediated by enhancing glucose influx, but rather could be modulated by glucose concentration. This indicates insulin’s effects on the hippocampus are influenced by the physiological and/or pathological-state. Indeed, hippocampal physiology is sensitive to signals of hunger and satiety (Mucellini et al., 2017).
Altogether, our studies indicate that several manipulations do not simply negate insulin-induced fEPSP inhibition, but rather convert the effect of insulin to enhancement. These results are inconsistent with the classic dichotomic paradigm of the mode of action for insulin. Insulin receptor is broadly expressed in various types of cells within each neural circuit, and each receptor may have different affinity to insulin. For example, between the two isoforms for insulin receptor, the IR-A isoform is expressed in neurons and exhibits a two-fold higher affinity to insulin compared to the IR-B isoform, which is predominately expressed in glial cells (Kleinridders, 2016). Thus, it is feasible to postulate insulin’s homeostasis action to be disturbed under variable conditions, which warrants future investigations.
In summary, previous research has investigated insulin’s modulation on cognitive function in pro-conditions in which insulin receptor, insulin receptor substrates, and insulin sources are selectively manipulated. In addition, aging, AD, obese, or diabetic animals are frequently served as the model to illustrate insulin’s necessity for cognition. We investigated how insulin acutely modulated basal synaptic transmission and synaptic plasticity under normal physiological conditions. Our results show that insulin played a significant and acute role in modulating basal fEPSP, and consequently extended its influence to LTP and LTD induction and expression. After LTP and LTD were induced, insulin exerted a different role. Furthermore, insulin modulation of fEPSP could be reversed by manipulation of PKC and glucose concentration. More importantly, a CB1R activator could divert insulin’s electrophysiological property. Although further data are needed to tease out the molecular mechanisms responsible for these effects, our investigation provides new insights for understanding the electrophysiological mechanism of insulin modulation on learning and memory processes in the hippocampus.
Highlights.
Insulin exerts diverse effects on fEPSPs at CA3-CA1 synapse
The insulin-LTD is dependent on the concentrations of insulin
Insulin’s effect on fEPSP are affected by PKC blocker, CB1 agonist, or high glucose
Insulin can potentiate LTP and alter LTD, but the timing of application is critical
Acknowledgement:
This work was supported by the National Institutes of Health grants CA163640, CA166590, and AG041250. Electrophysiological experiments were conducted at facility of the OSU neuroscience center core supported by NIH/NINDS grant (P30 NS104177).
Abbreviations:
- LTP
long-term potentiation
- LTD
long-term depression
- fEPSPs
field excitatory post-synaptic potentials
- PPF
paired-pulse facilitation
- PP-LFS
Paired-pulse low-frequency stimulation
- PKC
protein kinase C
- CB1R
cannabinoid receptor 1
- GLUT4
glucose transporter 4
- VAT
ventral tegmental area
- AD
Alzheimer’s disease
- T2DM
type 2 diabetes mellitus
Footnotes
Publisher's Disclaimer: This is a PDF file of an unedited manuscript that has been accepted for publication. As a service to our customers we are providing this early version of the manuscript. The manuscript will undergo copyediting, typesetting, and review of the resulting proof before it is published in its final citable form. Please note that during the production process errors may be discovered which could affect the content, and all legal disclaimers that apply to the journal pertain.
Reference
- Abramov E, Dolev I, Fogel H, Ciccotosto GD, Ruff E, Slutsky I (2009) Amyloid-beta as a positive endogenous regulator of release probability at hippocampal synapses. Nature neuroscience 12:1567–1576. [DOI] [PubMed] [Google Scholar]
- Adzovic L, Domenici L (2014) Insulin induces phosphorylation of the AMPA receptor subunit GluR1, reversed by ZIP, and over-expression of Protein Kinase M zeta, reversed by amyloid beta. Journal of neurochemistry 131:582–587. [DOI] [PubMed] [Google Scholar]
- Almonte AG, Ewin SE, Mauterer MI, Morgan JW, Carter ES, Weiner JL (2017) Enhanced ventral hippocampal synaptic transmission and impaired synaptic plasticity in a rodent model of alcohol addiction vulnerability. Scientific reports 7:12300. [DOI] [PMC free article] [PubMed] [Google Scholar]
- Antunes G, Roque AC, Simoes-de-Souza FM (2016) Stochastic Induction of Long-Term Potentiation and Long-Term Depression. Scientific reports 6:30899. [DOI] [PMC free article] [PubMed] [Google Scholar]
- Atasoy D, Ertunc M, Moulder KL, Blackwell J, Chung C, Su J, Kavalali ET (2008) Spontaneous and evoked glutamate release activates two populations of NMDA receptors with limited overlap. The Journal of neuroscience 28:10151–10166. [DOI] [PMC free article] [PubMed] [Google Scholar]
- Bear MF (1995) Mechanism for a sliding synaptic modification threshold. Neuron 15:1–4. [DOI] [PubMed] [Google Scholar]
- Bell GA, Fadool DA (2017) Awake, long-term intranasal insulin treatment does not affect object memory, odor discrimination, or reversal learning in mice. Physiology & behavior 174:104–113. [DOI] [PMC free article] [PubMed] [Google Scholar]
- Benedict C, Hallschmid M, Schultes B, Born J, Kern W (2007) Intranasal insulin to improve memory function in humans. Neuroendocrinology 86:136–142. [DOI] [PubMed] [Google Scholar]
- Biessels GJ, Reagan LP (2015) Hippocampal insulin resistance and cognitive dysfunction. Nature reviews Neuroscience 16:660–671. [DOI] [PubMed] [Google Scholar]
- Boucher J, Kleinridders A, Kahn CR (2014) Insulin receptor signaling in normal and insulin-resistant states. Cold Spring Harbor perspectives in biology 6. [DOI] [PMC free article] [PubMed] [Google Scholar]
- Candeias E, Duarte AI, Carvalho C, Correia SC, Cardoso S, Santos RX, Placido AI, Perry G, Moreira PI (2012) The impairment of insulin signaling in Alzheimer’s disease. IUBMB life 64:951–957. [DOI] [PubMed] [Google Scholar]
- Carlson G, Wang Y, Alger BE (2002) Endocannabinoids facilitate the induction of LTP in the hippocampus. Nature neuroscience 5:723–724. [DOI] [PubMed] [Google Scholar]
- Carroll RC, Beattie EC, von Zastrow M, Malenka RC (2001) Role of AMPA receptor endocytosis in synaptic plasticity. Nature reviews Neuroscience 2:315–324. [DOI] [PubMed] [Google Scholar]
- Chami B, Steel AJ, De La Monte SM, Sutherland GT (2016) The rise and fall of insulin signaling in Alzheimer’s disease 31:497–515. [DOI] [PubMed] [Google Scholar]
- Chen DY, Stern SA, Garcia-Osta A, Saunier-Rebori B, Pollonini G, Bambah-Mukku D, Blitzer RD, Alberini CM (2011) A critical role for IGF-II in memory consolidation and enhancement. Nature 469:491–497. [DOI] [PMC free article] [PubMed] [Google Scholar]
- Christie JM, Wenthold RJ, Monaghan DT (1999) Insulin causes a transient tyrosine phosphorylation of NR2A and NR2B NMDA receptor subunits in rat hippocampus. Journal of neurochemistry 72:1523–1528. [DOI] [PubMed] [Google Scholar]
- Citri A, Malenka RC (2008) Synaptic plasticity: multiple forms, functions, and mechanisms. Neuropsychopharmacology 33:18–41. [DOI] [PubMed] [Google Scholar]
- Cooper LN, Bear MF (2012) The BCM theory of synapse modification at 30: interaction of theory with experiment. Nature reviews Neuroscience 13:798–810. [DOI] [PubMed] [Google Scholar]
- Dine J, Ionescu IA, Avrabos C, Yen YC, Holsboer F, Landgraf R, Schmidt U, Eder M (2015) Intranasally applied neuropeptide S shifts a high-anxiety electrophysiological endophenotype in the ventral hippocampus towards a “normal”-anxiety one. PloS one 10:e0120272. [DOI] [PMC free article] [PubMed] [Google Scholar]
- Diogenes MJ, Dias RB, Rombo DM, Vicente Miranda H, Maiolino F, Guerreiro P, Nasstrom T, Franquelim HG, Oliveira LM, Castanho MA, Lannfelt L, Bergstrom J, Ingelsson M, Quintas A, Sebastiao AM, Lopes LV, Outeiro TF (2012) Extracellular alpha-synuclein oligomers modulate synaptic transmission and impair LTP via NMDA-receptor activation. The Journal of neuroscience 32:11750–11762. [DOI] [PMC free article] [PubMed] [Google Scholar]
- Dong Z, Gong B, Li H, Bai Y, Wu X, Huang Y, He W, Li T, Wang YT (2012) Mechanisms of hippocampal long-term depression are required for memory enhancement by novelty exploration. The Journal of neuroscience 32:11980–11990. [DOI] [PMC free article] [PubMed] [Google Scholar]
- Duarte AI, Moreira PI, Oliveira CR (2012) Insulin in central nervous system: more than just a peripheral hormone. Journal of aging research 2012:384017. [DOI] [PMC free article] [PubMed] [Google Scholar]
- El-Boustani S, Ip JPK (2018) Locally coordinated synaptic plasticity of visual cortex neurons in vivo. Science 360:1349–1354. [DOI] [PMC free article] [PubMed] [Google Scholar]
- Feld GB, Wilhem I, Benedict C, Rudel B, Klameth C, Born J, Hallschmid M (2016) Central Nervous Insulin Signaling in Sleep-Associated Memory Formation and Neuroendocrine Regulation. Neuropsychopharmacology 41:1540–1550. [DOI] [PMC free article] [PubMed] [Google Scholar]
- Fernandez AM, Hernandez E, Guerrero-Gomez D, Miranda-Vizuete A, Torres Aleman I (2017) A network of insulin peptides regulate glucose uptake by astrocytes: Potential new druggable targets for brain hypometabolism. Neuropharmacology. [DOI] [PubMed] [Google Scholar]
- Fernandez AM, Torres-Aleman I (2012) The many faces of insulin-like peptide signalling in the brain. Nature reviews Neuroscience 13:225–239. [DOI] [PubMed] [Google Scholar]
- Ferrario CR, Reagan LP (2017) Insulin-mediated synaptic plasticity in the CNS: Anatomical, functional and temporal contexts. Neuropharmacology 136(Pt B):182–191 [DOI] [PMC free article] [PubMed] [Google Scholar]
- Gazit N, Vertkin I, Shapira I, Helm M, Slomowitz E, Sheiba M, Mor Y, Rizzoli S, Slutsky I (2016) IGF-1 Receptor Differentially Regulates Spontaneous and Evoked Transmission via Mitochondria at Hippocampal Synapses. Neuron 89:583–597. [DOI] [PMC free article] [PubMed] [Google Scholar]
- Ghasemi R, Haeri A, Dargahi L, Mohamed Z, Ahmadiani A (2013) Insulin in the brain: sources, localization and functions. Molecular neurobiology 47:145–171. [DOI] [PubMed] [Google Scholar]
- Gladding CM, Fitzjohn SM, Molnar E (2009) Metabotropic glutamate receptor-mediated long-term depression: molecular mechanisms. Pharmacological reviews 61:395–412. [DOI] [PMC free article] [PubMed] [Google Scholar]
- Ho VM, Lee JA, Martin KC (2011) The cell biology of synaptic plasticity. Science 334:623–628. [DOI] [PMC free article] [PubMed] [Google Scholar]
- Hopkins BD, Pauli C, Du X, Wang DG, Li X, Wu D, Amadiume SC, Goncalves MD, Hodakoski C, Lundquist MR, Bareja R, Ma Y, Harris EM, Sboner A, Beltran H, Rubin MA, Mukherjee S, Cantley LC (2018) Suppression of insulin feedback enhances the efficacy of PI3K inhibitors. Nature. [DOI] [PMC free article] [PubMed] [Google Scholar]
- Hu H, Real E, Takamiya K, Kang MG, Ledoux J, Huganir RL, Malinow R (2007) Emotion enhances learning via norepinephrine regulation of AMPA-receptor trafficking. Cell 131:160–173. [DOI] [PubMed] [Google Scholar]
- Huang CC, Lee CC, Hsu KS (2004) An investigation into signal transduction mechanisms involved in insulin-induced long-term depression in the CA1 region of the hippocampus. Journal of neurochemistry 89:217–231. [DOI] [PubMed] [Google Scholar]
- Huang CC, Lee CC, Hsu KS (2010) The role of insulin receptor signaling in synaptic plasticity and cognitive function. Chang Gung medical journal 33:115–125. [PubMed] [Google Scholar]
- Huganir RL, Nicoll RA (2013) AMPARs and synaptic plasticity: the last 25 years. Neuron 80:704–717. [DOI] [PMC free article] [PubMed] [Google Scholar]
- Ikegaya Y, Ishizaka Y, Matsuki N (2002) BDNF attenuates hippocampal LTD via activation of phospholipase C: implications for a vertical shift in the frequency-response curve of synaptic plasticity. The European journal of neuroscience 16:145–148. [DOI] [PubMed] [Google Scholar]
- Ji YF, Xu SM, Zhu J, Wang XX, Shen Y (2011) Insulin increases glutamate transporter GLT1 in cultured astrocytes. Biochemical and biophysical research communications 405:691–696. [DOI] [PubMed] [Google Scholar]
- Jia Z, Agopyan N, Miu P, Xiong Z, Henderson J, Gerlai R, Taverna FA, Velumian A, MacDonald J, Carlen P, Abramow-Newerly W, Roder J (1996) Enhanced LTP in mice deficient in the AMPA receptor GluR2. Neuron 17:945–956. [DOI] [PubMed] [Google Scholar]
- Jin Z, Jin Y, Kumar-Mendu S, Degerman E, Groop L, Birnir B (2011) Insulin reduces neuronal excitability by turning on GABA(A) channels that generate tonic current. PloS one 6:e16188. [DOI] [PMC free article] [PubMed] [Google Scholar]
- Kang H, Schuman EM (1996) A requirement for local protein synthesis in neurotrophin-induced hippocampal synaptic plasticity. Science 273:1402–1406. [DOI] [PubMed] [Google Scholar]
- Kemp A, Manahan-Vaughan D (2004) Hippocampal long-term depression and long-term potentiation encode different aspects of novelty acquisition. Proceedings of the National Academy of Sciences of the United States of America 101:8192–8197. [DOI] [PMC free article] [PubMed] [Google Scholar]
- Kleinridders A (2016) Deciphering Brain Insulin Receptor and Insulin-Like Growth Factor 1 Receptor Signalling. Journal of neuroendocrinology 28. [DOI] [PMC free article] [PubMed] [Google Scholar]
- Konishi M, Sakaguchi M, Lockhart SM, Cai W, Li ME, Homan EP, Rask-Madsen C, Kahn CR (2017) Endothelial insulin receptors differentially control insulin signaling kinetics in peripheral tissues and brain of mice. Proceedings of the National Academy of Sciences of the United States of America 114:E8478–E8487. [DOI] [PMC free article] [PubMed] [Google Scholar]
- Korte M, Korte M, Schmitz D (2016) Cellular and System Biology of Memory: Timing, Molecules, and Beyond. Proceedings of the National Academy of Sciences of the United States of America 96:647–693. [DOI] [PubMed] [Google Scholar]
- Kubota H, Uda S, Matsuzaki F, Yamauchi Y, Kuroda S (2018) In Vivo Decoding Mechanisms of the Temporal Patterns of Blood Insulin by the Insulin-AKT Pathway in the Liver. Cell systems 7:118–128.e113. [DOI] [PubMed] [Google Scholar]
- Kullmann S, Heni M, Veit R, Scheffler K, Machann J, Haring HU, Fritsche A, Preissl H (2017) Intranasal insulin enhances brain functional connectivity mediating the relationship between adiposity and subjective feeling of hunger. Scientific report 7(1):1627. [DOI] [PMC free article] [PubMed] [Google Scholar]
- Labouebe G, Liu S, Dias C, Zou H, Wong JC, Karunakaran S, Clee SM, Phillips AG, Boutrel B, Borgland SL (2013) Insulin induces long-term depression of ventral tegmental area dopamine neurons via endocannabinoids. Nature neuroscience 16:300–308. [DOI] [PMC free article] [PubMed] [Google Scholar]
- Leal G, Bramham CR, Duarte CB (2017) BDNF and Hippocampal Synaptic Plasticity. Vitamins and hormones 104:153–195. [DOI] [PubMed] [Google Scholar]
- Lee SH, Zabolotny JM, Huang H, Lee H, Kim YB (2016) Insulin in the nervous system and the mind: Functions in metabolism, memory, and mood. Molecular metabolism 5:589–601. [DOI] [PMC free article] [PubMed] [Google Scholar]
- Li Q, Navakkode S, Rothkegel M, Soong TW, Sajikumar S (2017) Metaplasticity mechanisms restore plasticity and associativity in an animal model of Alzheimer’s disease. Proceedings of the National Academy of Sciences of the United States of America 114(21):5527–5532. [DOI] [PMC free article] [PubMed] [Google Scholar]
- Li R, Huang FS, Abbas AK, Wigstrom H (2007) Role of NMDA receptor subtypes in different forms of NMDA-dependent synaptic plasticity. BMC neuroscience 8:55. [DOI] [PMC free article] [PubMed] [Google Scholar]
- Liao GY, Leonard JP (1999) Insulin modulation of cloned mouse NMDA receptor currents in Xenopus oocytes. Journal of neurochemistry 73:1510–1519. [DOI] [PubMed] [Google Scholar]
- Lo FS, Erzurumlu RS, Powell EM (2016) Insulin-Independent GABAA Receptor-Mediated Response in the Barrel Cortex of Mice with Impaired Met Activity. The Journal of neuroscience 36:3691–3697. [DOI] [PMC free article] [PubMed] [Google Scholar]
- Maimaiti S, Anderson KL, DeMoll C, Brewer LD, Rauh BA, Gant JC, Blalock EM, Porter NM, Thibault O (2016) Intranasal Insulin Improves Age-Related Cognitive Deficits and Reverses Electrophysiological Correlates of Brain Aging. The journals of gerontology Series A, Biological sciences and medical sciences 71:30–39. [DOI] [PMC free article] [PubMed] [Google Scholar]
- Malarkey EB, Parpura V (2008) Mechanisms of glutamate release from astrocytes. Neurochemistry international 52:142–154. [DOI] [PMC free article] [PubMed] [Google Scholar]
- Malekizadeh Y, Holiday A, Redfearn D, Ainge JA, Doherty G, Harvey J (2017) A Leptin Fragment Mirrors the Cognitive Enhancing and Neuroprotective Actions of Leptin. Cerebral cortex 27:4769–4782. [DOI] [PMC free article] [PubMed] [Google Scholar]
- Malenka RC, Bear MF (2004) LTP and LTD: an embarrassment of riches. Neuron 44:5–21. [DOI] [PubMed] [Google Scholar]
- Man HY, Lin JW, Ju WH, Ahmadian G, Liu L, Becker LE, Sheng M, Wang YT (2000) Regulation of AMPA receptor-mediated synaptic transmission by clathrin-dependent receptor internalization. Neuron 25:649–662. [DOI] [PubMed] [Google Scholar]
- Mebel DM, Wong JC, Dong YJ, Borgland SL (2012) Insulin in the ventral tegmental area reduces hedonic feeding and suppresses dopamine concentration via increased reuptake. The European journal of neuroscience 36:2336–2346. [DOI] [PMC free article] [PubMed] [Google Scholar]
- Megill A, Tran T, Eldred K (2015) Defective Age-Dependent Metaplasticity in a Mouse Model of Alzheimer’s Disease. The Journal of neuroscience 35:11346–11357. [DOI] [PMC free article] [PubMed] [Google Scholar]
- Molnar G, Farago N, Kocsis AK, Rozsa M, Lovas S, Boldog E, Baldi R, Csajbok E, Gardi J, Puskas LG, Tamas G (2014) GABAergic neurogliaform cells represent local sources of insulin in the cerebral cortex. The Journal of neuroscience 34:1133–1137. [DOI] [PMC free article] [PubMed] [Google Scholar]
- Moser EI, Krobert KA, Moser MB, Morris RG (1998) Impaired spatial learning after saturation of long-term potentiation. Science 281:2038–2042. [DOI] [PubMed] [Google Scholar]
- Moult PR, Milojkovic B, Harvey J (2009) Leptin reverses long-term potentiation at hippocampal CA1 synapses. Journal of neurochemistry 108:685–696. [DOI] [PMC free article] [PubMed] [Google Scholar]
- Mucellini AB, Fonseca N, Manfro GG, Silveira PP (2017) Hippocampal insulin resistance and altered food decision-making as players on obesity risk. Neuroscience and biobehavioral reviews 77:165–176. [DOI] [PubMed] [Google Scholar]
- Murakami J, Okada R, Fujito Y, Sakakibara M, Lukowiak K, Ito E (2013) Paired pulse ratio analysis of insulin-induced synaptic plasticity in the snail brain. The Journal of experimental biology 216:1771–1773. [DOI] [PubMed] [Google Scholar]
- Nabavi S, Fox R, Proulx CD, Lin JY, Tsien RY, Malinow R (2014) Engineering a memory with LTD and LTP. Nature 511:348–352. [DOI] [PMC free article] [PubMed] [Google Scholar]
- Navarrete M, Araque A (2008) Endocannabinoids mediate neuron-astrocyte communication. Neuron 57:883–893. [DOI] [PubMed] [Google Scholar]
- Oliveira da Cruz JF, Robin LM, Drago F, Marsicano G, Metna-Laurent M (2016) Astroglial type-1 cannabinoid receptor (CB1): A new player in the tripartite synapse. Neuroscience 323:35–42. [DOI] [PubMed] [Google Scholar]
- Palovcik RA, Phillips MI, Kappy MS, Raizada MK (1984) Insulin inhibits pyramidal neurons in hippocampal slices. Brain research 309:187–191. [DOI] [PubMed] [Google Scholar]
- Pascual O, Casper KB, Kubera C, Zhang J, Revilla-Sanchez R, Sul JY, Takano H, Moss SJ, McCarthy K, Haydon PG (2005) Astrocytic purinergic signaling coordinates synaptic networks. Science 310:113–116. [DOI] [PubMed] [Google Scholar]
- Paulsen O, Sejnowski TJ (2000) Natural patterns of activity and long-term synaptic plasticity. Current opinion in neurobiology 10:172–179. [DOI] [PMC free article] [PubMed] [Google Scholar]
- Pearson-Leary J, Jahagirdar V, Sage J, McNay EC (2018) Insulin modulates hippocampally-mediated spatial working memory via glucose transporter-4. Behavioural brain research 338:32–39. [DOI] [PMC free article] [PubMed] [Google Scholar]
- Penn AC, Zhang CL, Georges F, Royer L, Breillat C, Hosy E, Petersen JD, Humeau Y, Choquet D (2017) Hippocampal LTP and contextual learning require surface diffusion of AMPA receptors. Nature 549:384–388. [DOI] [PMC free article] [PubMed] [Google Scholar]
- Poblete-Naredo I, Angulo C, Hernandez-Kelly L, Lopez-Bayghen E, Aguilera J, Ortega A (2009) Insulin-dependent regulation of GLAST/EAAT1 in Bergmann glial cells. Neuroscience letters 451:134–138. [DOI] [PubMed] [Google Scholar]
- Ramsey MM, Adams MM, Ariwodola OJ, Sonntag WE, Weiner JL (2005) Functional characterization of des-IGF-1 action at excitatory synapses in the CA1 region of rat hippocampus. J Neurophysiol 94:247–254. [DOI] [PubMed] [Google Scholar]
- Rumpel S, LeDoux J, Zador A, Malinow R (2005) Postsynaptic receptor trafficking underlying a form of associative learning. Science 308:83–88. [DOI] [PubMed] [Google Scholar]
- Sacktor TC, Hell JW (2017) The genetics of PKMzeta and memory maintenance. Science signaling 10. [DOI] [PMC free article] [PubMed] [Google Scholar]
- Shankar GM, Li S, Mehta TH, Garcia-Munoz A, Shepardson NE, Smith I, Brett FM, Farrell MA, Rowan MJ, Lemere CA, Regan CM, Walsh DM, Sabatini BL, Selkoe DJ (2008) Amyloid-beta protein dimers isolated directly from Alzheimer’s brains impair synaptic plasticity and memory. Nature medicine 14:837–842. [DOI] [PMC free article] [PubMed] [Google Scholar]
- Shemesh E, Rudich A, Harman-Boehm I, Cukierman-Yaffe T (2012) Effect of intranasal insulin on cognitive function: a systematic review. The Journal of clinical endocrinology and metabolism 97:366–376. [DOI] [PubMed] [Google Scholar]
- Skeberdis VA, Lan J, Zheng X, Zukin RS, Bennett MV (2001) Insulin promotes rapid delivery of N-methyl-D-aspartate receptors to the cell surface by exocytosis. Proceedings of the National Academy of Sciences of the United States of America 98:3561–3566. [DOI] [PMC free article] [PubMed] [Google Scholar]
- Slutsky I, Sadeghpour S, Li B, Liu G (2004) Enhancement of synaptic plasticity through chronically reduced Ca2+ flux during uncorrelated activity. Neuron 44:835–849. [DOI] [PubMed] [Google Scholar]
- Spicarova D, Palecek J (2010) Modulation of AMPA excitatory postsynaptic currents in the spinal cord dorsal horn neurons by insulin. Neuroscience 166:305–311. [DOI] [PubMed] [Google Scholar]
- Stranahan AM (2015) Models and mechanisms for hippocampal dysfunction in obesity and diabetes. Neuroscience 309:125–139. [DOI] [PMC free article] [PubMed] [Google Scholar]
- Suyama S, Maekawa F, Maejima Y, Kubota N, Kadowaki T, Yada T (2016) Glucose level determines excitatory or inhibitory effects of adiponectin on arcuate POMC neuron activity and feeding. Scientific reports 6:30796. [DOI] [PMC free article] [PubMed] [Google Scholar]
- Tanaka H, Hirano T (2012) Visualization of subunit-specific delivery of glutamate receptors to postsynaptic membrane during hippocampal long-term potentiation. Cell reports 1:291–298. [DOI] [PubMed] [Google Scholar]
- Terashima A, Suh YH, Isaac JTR (2017) The AMPA Receptor Subunit GluAl is Required for CA1 Hippocampal Long-Term Potentiation but is not Essential for Synaptic Transmission. Neurochem Res pp 1–13 [DOI] [PubMed] [Google Scholar]
- van der Heide LP, Kamal A, Artola A, Gispen WH, Ramakers GM (2005) Insulin modulates hippocampal activity-dependent synaptic plasticity in a N-methyl-d-aspartate receptor and phosphatidyl-inositol-3-kinase-dependent manner. Journal of neurochemistry 94:1158–1166. [DOI] [PubMed] [Google Scholar]
- van der Heide LP, Ramakers GM, Smidt MP (2006) Insulin signaling in the central nervous system: learning to survive. Progress in neurobiology 79:205–221. [DOI] [PubMed] [Google Scholar]
- Viswaprakash N, Vaithianathan T, Viswaprakash A, Judd R, Parameshwaran K, Suppiramaniam V (2015) Insulin treatment restores glutamate (alpha-amino-3-hydroxy-5-methyl-4-isoxazolepropionic acid) receptor function in the hippocampus of diabetic rats. Journal of neuroscience research 93:1442–1450. [DOI] [PubMed] [Google Scholar]
- Wan Q, Xiong ZG, Man HY, Ackerley CA, Braunton J, Lu WY, Becker LE, MacDonald JF, Wang YT (1997) Recruitment of functional GABA(A) receptors to postsynaptic domains by insulin. Nature 388:686–690. [DOI] [PubMed] [Google Scholar]
- Wang YT, Linden DJ (2000) Expression of cerebellar long-term depression requires postsynaptic clathrin-mediated endocytosis. Neuron 25:635–647. [DOI] [PubMed] [Google Scholar]
- Whitlock JR, Heynen AJ, Shuler MG, Bear MF (2006) Learning induces long-term potentiation in the hippocampus. Science 313:1093–1097. [DOI] [PubMed] [Google Scholar]
- Wosiski-Kuhn M, Erion JR, Gomez-Sanchez EP, Gomez-Sanchez CE, Stranahan AM (2014) Glucocorticoid receptor activation impairs hippocampal plasticity by suppressing BDNF expression in obese mice. Psychoneuroendocrinology 42:165–177. [DOI] [PMC free article] [PubMed] [Google Scholar]
- Wrighten SAG Piroli G (2016) Insulin Age-Dependently Modulates Synaptic Transmission and AMPA Receptor Trafficking in Region CA1 of the Rat Hippocampus. Open Journal of Molecular and Integrative Physiology 06:19–33. [Google Scholar]
- Xu L, Anwyl R, Rowan MJ (1998) Spatial exploration induces a persistent reversal of long-term potentiation in rat hippocampus. Nature 394:891–894. [DOI] [PubMed] [Google Scholar]
- Xu L, Rensing N, Yang XF, Zhang HX, Thio LL, Rothman SM, Weisenfeld AE, Wong M, Yamada KA (2008) Leptin inhibits 4-aminopyridine- and pentylenetetrazole-induced seizures and AMPAR-mediated synaptic transmission in rodents. The Journal of clinical investigation 118:272–280. [DOI] [PMC free article] [PubMed] [Google Scholar]
- Zhang Y, Dai CL, Chen Y, Iqbal K, Liu F, Gong CX (2016) Intranasal Insulin Prevents Anesthesia-Induced Spatial Learning and Memory Deficit in Mice. Scientific reports 6:21186. [DOI] [PMC free article] [PubMed] [Google Scholar]
- Zhao W, Wu X, Xie H, Ke Y, Yung WH (2010) Permissive role of insulin in the expression of long-term potentiation in the hippocampus of immature rats. Neuro-Signals 18:236–245. [DOI] [PubMed] [Google Scholar]
- Zhao WQ, Chen H, Quon MJ, Alkon DL (2004) Insulin and the insulin receptor in experimental models of learning and memory. European journal of pharmacology 490:71–81. [DOI] [PubMed] [Google Scholar]
- Zhou Z, Liu A, Xia S, Leung C, Qi J, Meng Y, Xie W (2018) The C-terminal tails of endogenous GluA1 and GluA2 differentially contribute to hippocampal synaptic plasticity and learning. Nature neuroscience 21(1):50–62 [DOI] [PubMed] [Google Scholar]