

Abstract
Acute Intermittent Porphyria (AIP), an autosomal dominant hepatic disorder, results from hydroxymethylbilane synthase (HMBS) mutations that decrease the encoded enzymatic activity, thereby predisposing patients to life-threatening acute neurovisceral attacks. The ~1% penetrance of AIP suggests that other genetic factors modulate the onset and severity of the acute attacks. Here, we characterized the hepatic transcriptomic response to phenobarbital (PB) administration in AIP mice, which mimics the biochemical attacks of AIP. At baseline, the mRNA profiles of 14,138 hepatic genes prior to treatment were remarkably similar between AIP and the congenic wild-type (WT) mice. After PB treatment (~120mg/kg × 3d), 1,347 and 1,120 genes in AIP mice and 422 and 404 genes in WT mice were uniquely up- and down-regulated, respectively, at a False Discovery Rate <0.05. As expected, the ALAS1 expression increased 4.5- fold and 15.9-fold in the WT and AIP mice, respectively. ALA-dehydrogenase also was induced ~1.7-fold in PB-induced AIP mice, but was unchanged in PB-induced WT mice. There was no statistically significant difference in the overall expression of 155 hepatic cytochrome P450 enzymes, although Cyp2c40, Cyp2c68, Cyp2c69, Mgst3 were upregulated only in PB-induced AIP mice (>1.9-fold) and Cyp21a1 was upregulated only in PB-induced WT mice (>9-fold). Notably, the genes differentially expressed in induced AIP mice were enriched in circadian rhythm, mitochondria biogenesis and electron transport, suggesting these pathways were involved in AIP mice responding to PB treatment. These results advance our understanding of the hepatic metabolic changes in PB-induced AIP mice and have implications in the pathogenesis of AIP acute attacks.
Keywords: Acute Intermittent Porphyria, mouse model, phenobarbital, RNA-seq, transcriptome
1. Introduction
Acute intermittent porphyria (AIP), the most common of the acute hepatic porphyrias, is an autosomal dominant inborn error of heme biosynthesis. The disease is caused by loss-of-function mutations in hydroxymethylbilane synthase (HMBS), the third enzyme in the heme biosynthetic pathway. Clinically, AIP is characterized by life-threatening neurovisceral attacks that are precipitated by various porphyrinogenic factors, including certain drugs, stress, fasting and hormonal changes (1, 2). Exposure to these factors increases the hepatic heme demand and decreases the hepatic free heme pool, which, through a negative feedback mechanism, induces the expression of hepatic 5-aminolevulinic acid synthase (ALAS1), the first and rate-limiting enzyme of the pathway. The increased ALAS1 enzymatic activity results in the accumulation of the neurotoxic porphyrin precursors, 5-aminolevulinic acid (ALA) and porphobilinogen (PBG), due to the metabolic bottleneck caused by the decreased HMBS enzymatic activity. Of note, the attacks generally occur after puberty and >80% occur in women (3–5).
The prevalence of AIP was estimated in a recent European study to be ~1 in 200,000 individuals (6), with notable exceptions in the Scandinavian countries where a founder mutation is more frequent (7–9). The clinical penetrance of the dominant disease has estimated to range from 5-30% among heterozygotes. Of note, a French study of 3,350 healthy blood donors (10) and our recent genomic study of 45,955 Caucasians (11) estimated the frequency of pathogenic HMBS mutations in the general population to be ~ 1 in 1,600 to 1,800. Based on the disease prevalence (6), the penetrance of AIP was estimated to be 1% or less (11, 12). This extremely low disease penetrance indicates that other genetic and/or environmental factors presumably play a significant role in predisposing HMBS heterozygotes to acute attacks.
To identify the genetic factors that may play a role in precipitating the acute attacks, we used the AIP mouse model (13) to investigate the changes in the hepatic transcriptome after induction of a phenobarbital (PB)-induced attack. The AIP mice have ~30% of residual HMBS activity and exhibit the characteristic biochemical changes of markedly elevated plasma and urinary ALA and PBG levels following the porphyrinogenic drug administration, mimicking the biochemical changes in AIP patients during acute attacks (13,14). In addition, neuropathological investigation found that these mice exhibited markedly decreased large-caliber axons and other signs of motor axon degeneration, findings resembling the pathology in the affected nerves of AIP patients (15). Here, we report our findings of the hepatic transcriptomic profiles between congenic wild-type (WT) mice and AIP mice resulting from the porphyrinogenic challenge.
2. Materials and Methods
Murine Tissue Preparation
Animal procedures were reviewed and approved by the Mount Sinai Institutional Animal Care and Use Committee. The previously described T1/T2 AIP mice (13) were bred and housed in a barrier facility at the Icahn School of Medicine at Mount Sinai. Phenoba rbital (PB) induction was performed on non-fasted 2-3-month-old T1/T2 and C57BI6 wildtype males as previously described (14). In brief, 110, 120 and 130 mg/kg/day of PB were administered intraperitoneally over three consecutive days. Mice were sacrificed 16 hr after the third PB induction and perfused with PBS via the left ventricle under ketamine/xylazine anesthesia. Livers were harvested, snap-frozen in liquid nitrogen, and stored in the dark at −80 °C until use.
RNA Extraction and Sequencing
Total RNA was isolated from liver tissue using TRIzol reagent (Life Technologies) according to the manufacturer’s instructions. RNA (>2 μg) was submitted to the Genomics Core Facilities at Icahn School of Medicine at Mount Sinai for library preparation and sequencing. Briefly, rRNA was depleted from about 1 ug of total RNA using the Ribo-Zero Magnetic Gold kit (lllumina/Epicenter Cat # MRZG12324) to enrich for polyadenylated coding RNA and non-coding RNA. The sequencing library was prepared using the TruSeq RNA Sample Preparation Kit v2 (lllumina Cat # RS-122–2001). The insert size and DNA concentration of the sequencing library was determined on an Agilent Bioanalyzer and Qubit, respectively. A pool of 12 barcoded libraries were layered on a lane of the lllumina flow cell bridge amplified to ~250 million raw clusters.
RNA-Seq Pipeline and Data Analysis
The automated RNA-seq pipeline of the Genomics Core Facilities at the Icahn School of Medicine at Mount Sinai was used. The single-ended raw sequencing reads were aligned to mouse mm10 genome using STAR aligner (version 2.4.0g1). Following read alignment, featureCounts (v1.4.4) was used to quantify expression at the gene level based on the UCSC gene model. Genes with at least 1 count per million (CPM) in at least one sample were considered expressed (16, 17) and hence retained for further analysis; others were removed. The gene read counts data were normalized using the trimmed mean of M-values normalization (TMM) method (18) to adjust for sequencing library size differences. Hierarchical cluster analysis was performed using R programming language. Differential gene expression between different sample groups was calculated by a linear model analysis using the Bioconductor package limma (19). To adjust for multiple tests, false discovery rate (FDR) was estimated using the Benjamini-Hochberg (BH) method (20). Genes showing at least 1.2-fold changes and FDR adjusted P values less than 0.05 were considered significant (21, 22). Gene functional enrichment analysis was executed using hypergeometric test based on Broad Institute’s MSigDB annotation (23) and NCI’s DAVID resources (24).
3. Results
Overview
RNA from four groups of mouse livers (designated C-WT and PB-WT for saline-treated and PB-treated WT mice, respectively, and C-AIP and PB-AIP for saline-treated and PB-treated AIP mice, respectively), with three livers in each group, were sequenced in the NGS-based protocol, generating on average 45,650,831 raw sequencing reads, of which 42,045,590 reads were mapped to reference sequences with the alignment rate of 92.1%. On average, 21,252 transcripts from 14,138 genes were identified from each liver. The mapped sequencing reads have a ~6% intronic rate and a ~10% intergenic rate, which render the expression profiling efficiency to be ~83.9%. The efficiency was comparable to those in the literature (25–27).
Similar Baseline Expression Profiles in WT and AIP Mice
To assess the differential expression patterns among the four groups of livers, an unsupervised hierarchical clustering analysis was performed. A heatmap that summarized the expression of all 14,138 genes showed comparable profiles among the six livers in C-WT and C-AIP (Fig. 1A). No gene was found to be differentially expressed between the two groups at FDR ≤0.05.
Fig. 1.

Expression profiles of the hepatic transcriptome of 14,138 genes in WT and AIP mice before and after PB treatment. (A) At baseline, the gene expression profiles were similar between WT and AIP mice. Each column represents the expression profile from one mouse. (B) After PB induction, differential expression profiles were observed between WT and AIP mice. Each column represents the expression profile from one mouse. (C) A Circos-styled heatmap shows the number of genes overlapped among different combinations of the differential expression signatures. The green areas on each spoke of the Circos plot correspond to the groups whose differential expression signatures were compared for an overlap. The numbers at the periphery of the spoke represent the number of overlapped genes among the differential expression signatures of the selected (greened) groups. The shades of red at the outer area of the spoke indicate the statistical significance of the overlap.
Differential Transcriptomic Profiles Following PB Treatment
In contrast, a heatmap revealed two distinct patterns among the five livers in PB-WT and PB-AIP mice (Fig. 1B). A total of 904 and 610 genes were up- and down-regulated, respectively, between C-WT and PB-WT mice. In contrast, a total of 1,829 and 1,326 genes were up- and down-regulated, respectively, between C-AIP and PB-AIP mice. Fig. 1C summarizes the number of genes overlapped among different combinations of the differential expression signatures as computed by the R package SuperExactTest (28). Many genes responded in the same manner (up- or down-regulated) between (PB-WT vs. C-WT) and (PB-AIP vs. C-AIP) comparisons: a total of 482 genes and 206 were up- or down-regulated in both groups. These genes likely represent the general hepatic transcriptomic response to the PB treatment. In contrast, a total of 992 down-regulated genes in PB-AIP vs PB-WT comparison were also down-regulated in PB-AIP vs C-AIP comparison (an ~4-fold enrichment) and a total of 672 up-regulated genes in PB-AIP vs PB-WT comparison were also up-regulated in PB-AIP vs C-AIP comparison (an ~4.5-fold enrichment). These genes may represent the heightened effects to PB treatment in the AIP mice. Of note, one outlier liver sample in PB-AIP group (mouse #10) was removed from further analyses as it showed a similar transcriptomic profile to those in PB-WT (Supplementary Fig. 1).
Expression of the Heme Biosynthetic Genes Following PB Treatment
At baseline, of the nine genes in the heme biosynthetic pathway, only Alas1 and Hmbs showed a significant difference between C-WT and C-AIP: Alas1 a 2.3-fold increase and Hmbs a ~70% reduction in the C-AIP group, as expected (13) (Fig. 2A & 2B). After PB treatment, Alas1 was induced in both PB-WT (4.3-fold, FDR adjusted p value = 5.2E-3) and PB-AIP (15.9-fold, FDR adjusted p value = 3.1E-4) mice, and a ~8.7-fold difference was observed between the PB-WT and PB-AIP mice (FDR adjusted p value = 5.7E-3) (Fig. 2A). The expressions of all other heme biosynthetic genes were comparable, except a small, but significant induction of Alad (1.7-fold) in PB-AIP mice. Interestingly, there was a small reduction of Ppox in both PB-WT and PB-AIP mice, although there was no statistical difference between them (Fig 2B).
Fig. 2.

Expression of the heme biosynthetic genes. (A) Expression of hepatic Alas1 in WT and AIP mice before and after PB treatment. (B) Expression of eight other heme biosynthetic genes in WT and AIP mice before and after PB treatment. Data are presented as means ± SD.
Responses of the Cytochrome P450 Genes to PB Treatment
Previously, it was shown that ~70% reduced HMBS activity resulted in decreased hepatic heme content in the AIP mice (29). Since over 50% of the heme synthesized in the liver is used for the synthesis of P450 enzymes (30,31), the expression profiles of a total of 155 cytochrome P450-related genes were investigated. The PB treatment induced, as expected, the expression of many P450 genes. However, none but six of the 155 genes was significantly differentially expressed between congenic PB-WT and PB-AIP mice (Fig. 3). These six genes showed a greater than 2-fold difference in the effect of PB treatment between the WT mice (PB-WT vs. C-WT) and the AIP mice (PB-AIP vs. C-AIP) (Table 1).
Fig. 3.
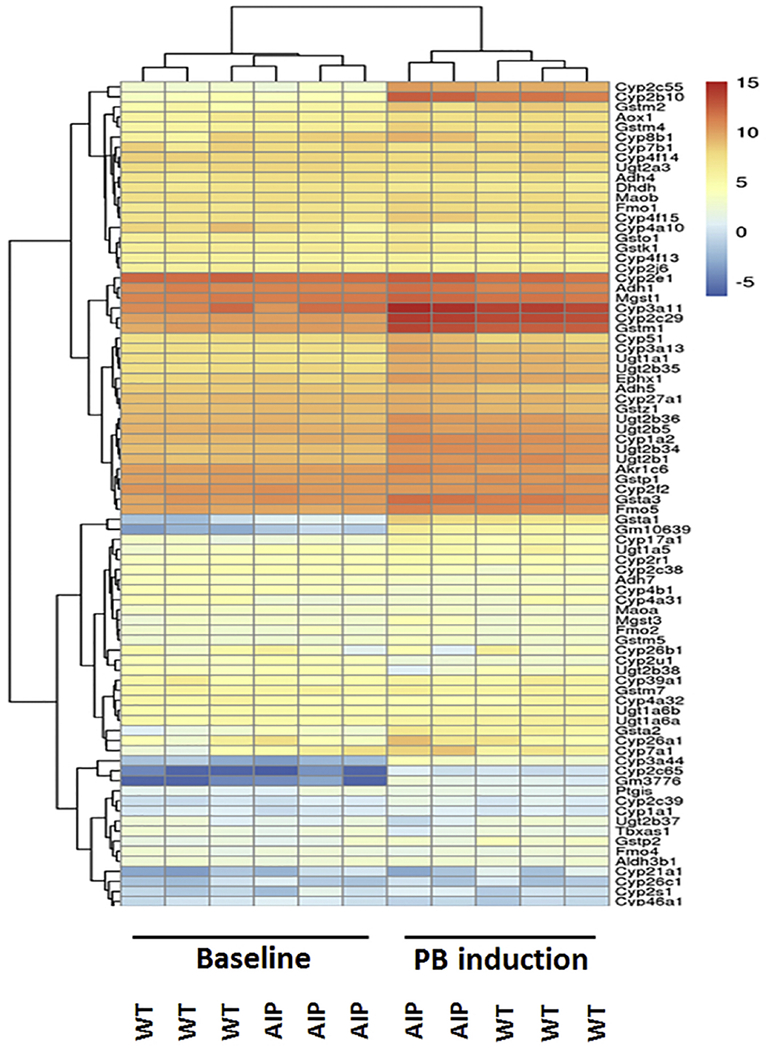
Expression profiles of 155 CYP450 genes. Heatmap shows an induction of several CYP450 genes before and after PB treatment but no discernable differential patterns between induced WT and AIP mice. Each column represents the expression profile from one mouse.
Table 1.
Selected CYP450s that responded differently to PB treatment in AIP and WT mice
| Relative Hepatic Expression | (Δ expression) | |||||||
|---|---|---|---|---|---|---|---|---|
| GeneID | PB-AIP | C-AIP | PB-WT | C-WT | AIP | WT | logFC | p.Value |
| Cyp21a1 | −2.392 | −0.453 | 0.205 | −3.027 | −1.939↓ | 3.232↑ | −5.171 | 0.002 |
| Ugt2b38 | 1.794 | 4.141 | 3.905 | 4.242 | −2.347↓ | −0.337↓ | −2.01 | 0.023 |
| Mgst3 | 4.202 | 3.057 | 2.984 | 2.993 | 1.145↑ | −0.009↓ | 1.154 | 0.023 |
| Cyp2c68 | 7.592 | 6.604 | 7.287 | 7.704 | 0.989↑ | −0.417↓ | 1.405 | 0.007 |
| Cyp2c40 | 2.073 | 0.971 | 2.440 | 4.971 | 1.102↑ | −2.531↓ | 3.633 | 0.004 |
| Cyp2c69 | 0.959 | −0.775 | 0.587 | 3.325 | 1.734↑ | −2.738↓ | 4.472 | 0.001 |
For CYP2C40, CYP2C68 and CYP2C69, PB treatment suppressed their expressions in WT mice but induced the expressions in AIP mice. In contrast, for CYP21A1, PB induced its expression in WT mice but suppressed it in AIP mice. For Mgst3, PB treatment did not affect its expression in WT mice, but had a >2-fold induction in AIP mice. For Ugt2b38, PB treatment suppressed its expression in both WT and AIP mice, but the extent of suppression was greater (>2-fold) in the AIP mice than that in the WT mice. Table 1 summarizes the average relative expression of each of these six genes, the changes of the expression before and after PB treatment, the differences (logFC) in the PB effect, and the p-values. These results indicated that although there was a partial heme deficiency in AIP mouse livers, transcriptomic responses of the P450 family members to PB treatment were not significantly impacted.
Identification of Functional Pathways Disrupted in PB-WT and PB-AIP Mice
Of the 1,514 and 3,155 genes that were altered in (C-WT vs PB-WT) and (C-AIP vs PB-AIP) comparisons, 826 and 2,467 genes were uniquely regulated only in PB-WT and PB-AIP mice, respectively. Of the 826 genes in PB-WT mice, 404 (49%) were downregulated, and 422 (51%) were upregulated. Of the 2,467 genes in PB-AIP mice, 1,120 (45%) and 1,347 (55%) genes were down- and up-regulated, respectively. The 826 genes unique to PB-WT vs C-WT comparison were involved in the cell cycle-related pathways (cell cycle checkpoint, DNA replication, G1-S specific transcription, microtubule spindle, and mitosis) (Fig.4A). In contrast, the 2,467 genes unique to PB-AIP vs. C-AIP comparison were associated with the respiratory electron transport chain, mitochondria biogenesis, the circadian cycle, and nonsense-mediated RNA decay (Fig. 4B). Supplementary Table 1 shows the enrichment for the over-represented pathways.
Fig. 4.

Enriched functional pathways of those differentially expressed genes in the WT mice and AIP mice. (A) No pathway was associated with uniquely down-regulated genes in the induced WT mice, while cell cycle-related pathways were associated with uniquely up-regulated genes in the induced WT mice. (B) Distinct functional pathways were enriched for the down- and up-regulated genes in the induced AIP mice.
Hepatic Gluconeogenesis Pathway but Not Ketone Metabolism, Had a Differential Response to PB Treatment between WT and AIP Mice
A recent study showed that fasting induced gluconeogenesis and ketogenesis in the AIP mice but not in the WT mice (32). To examine if these pathways showed differential responses to PB treatment, we analyzed the transcriptional changes of genes in ketone body homeostasis and in gluconeogenesis. The hierarchical clustering analysis of the 53 genes in ketone body homeostasis indicated that PB-treatment caused significant transcriptomic changes in these 53 genes. For example, the expression of genes such as Cyp2b10 and Cyp17a1 was significantly induced (Fig. 5A). Although the clustering analysis separated the PB-AIP mice and PB-WT mice into two distinct groups, the 53 genes did not show differential expression. In contrast, the hierarchical clustering analysis of the 142 genes in gluconeogenesis revealed that PB-AIP mice had a statistically distinct expression pattern from that of the other three groups of mice, PB-WT, C-WT and C-AIP (Fig. 5B). These results suggested that in AIP mice, the gluconeogenesis pathway may play a bigger role than ketone homeostasis in the response to PB treatment.
Fig. 5.

Expression profiles of 53 genes in the ketone metabolism pathway and 142 genes in the gluconeogenesis pathway. (A) PB treatment changes the expression profile of the ketone metabolism pathway but there is no clear differential expression pattern between the WT and AIP mice. Each column represents the expression profde from one mouse. (B) PB-induced AIP mice showed a statistically distinct expression pattern of the gluconeogenesis pathway from the other three groups of mice. Each column represents the expression profile from one mouse.
4. Discussion
Currently, most porphyria experts agree that AIP acute attacks result from the hepatic overproduction of neurotoxic ALA and/or PBG, due to the markedly induced ALAS1 mRNA and activity and the metabolic block from the half-normal HMBS activity (1). Our recent study using whole exome information from >40,000 Caucasians indicated that AIP has an attack penetra nce of ~1% of HMBS heterozygotes (11). This finding implies that other genetic and/or environmental factors are involved in the precipitation or protection of an acute attack. To gain insight into the pathogenesis of the AIP acute attacks, we used the AIP murine model to investigate the hepatic transcriptome changes between WT and AIP mice after administration of three porphyrinogenic doses of PB. The PB treatment triggers the biochemical attacks in AIP mice, characterized by markedly elevated plasma and urinary ALA and PBG [e.g., reference (14)]. A major limitation of this exploratory study was the small sample size analyzed.
Transcriptomic analyses of hepatic mRNA indicated that in untreated mice, the mRNA expression profiles were virtually indistinguishable between WT and AIP mice, indicating that the 70% reduction of HMBS activity had minimal effects on the overall liver biology at baseline among these otherwise congenic mice. In contrast, PB treatment induced different hepatic expression profiles in WT and AIP mice, indicating that AIP and WT mice of the same strain respond to PB differently. Notably, of the 9 heme biosynthetic genes, only Alas1 showed a significantly different response (8-fold over WT) to PB treatment. Interestingly, there was a small, but significant, increase (1.7-fold) of the Alad transcript only in the induced AIP mice. The significance of the Alad mRNA induction in the PB-induced AIP mice is not clear, but a similar increase in ALAD activity was observed in the livers from AIP patients (33).
Although some studies have suggested that hepatic cytochrome P450 genes mayplay a role in AIP acute attacks (34), the expression profile of 155 P450 genes failed to support this concept, as the gene family as a whole did not show a statistical difference between WT and AIP mice after PB treatment. It should be noted that an earlier study found that the degree of induction of Cyp2a5 mRNA and activity was lower in the AIP mice compared to wildtype mice following PB administration (29). In our studies, there were no statistical differences in the extent of the mRNA increase (data not shown). It is not clear why our observations differ, although the early report used a different schedule for PB induction and organ harvest. Despite the similar P450 expression patterns in induced AIP mice and WT mice, several P450 genes did show differential expressions between WT and AIP mice. Cyp2c40, Cyp2c68 and Cyp2c69 were upregulated in induced AIP mice but downregulated in WT mice. These P450 genes are the human homologs of CYP2C8, CYP2C9 or CYP2C19, three major human CYP450 enzymes responsible for the drug metabolism (35–37). In contrast, Cyp21a1 was downregulated in the induced AIP mice but upregulated in WT mice. Cyp21a1 is the mouse homolog of human CYP21A2 or CYP17A1 (−37), key enzymes in corticosteroid and sex hormone synthesis (38). These results support the concept that differences in drug metabolism or in corticosteroid or sex hormone syntheses may play a role in the pathogenesis of AIP acute attacks.
Functional enrichment analysis of differentially expressed genes identified that cell cycle-related pathways were over-represented only in PB-induced WT mice, but not in PB-induced AIP mice. A transient elevation of cell cycle-related pathways in these WT mice had been previously demonstrated (39). The lack of enrichment of these pathways in induced AIP mice suggests that AIP livers may be defective in launching the cell cycle-related programs. Whether these programs are crucial for AIP acute attacks is unknown and remains to be examined. Of note, histologic studies in humans have not documented any cellular abnormality in AIP livers (33, 40). Thus, if cell cycle-related programs were involved in precipitating or protecting acute attacks, they were likely a transient response to porphyrinogenic stimuli.
Morphological and functional abnormalities in mitochondria have been observed in AIP livers in humans (41) and mice (42). Consistent with these observations, our data now show that many genes in hepatic mitochondria biogenesis and in the respiratory electron transport chain were upregulated in induced AIP mice, further supporting the concept that mitochondria play a critical role in AIP attack pathogenesis. Upregulation of genes in the mitochondria biogenesis pathway (e.g. Atp5a1, Atp5c1, Atp5f1) in induced AIP mice suggests that hepatocytes attempt to produce more mitochondria after PB treatment. Lack of sufficient functional mitochondria may contribute to AIP acute attacks.
A recent study indicated that women with active AIP, defined by an elevated (>3-fold) urinary PBG level, showed signs of disturbed circadian rhythm markers (43). Our data in the murine hepatic transcriptome demonstrated that genes involved in the circadian pathways were enriched in the induced AIP mice. In particular, genes such as NR1D1 that are needed for normal wakefulness were downregulated. These findings were compatible with the clinical observation in women with AIP and suggest that aberration of the circadian cycle may be a common defect in AIP patients, especially the insomnia and fatigue that often precedes acute attacks (44).
It is interesting that many dysregulated genes and pathways in AIP mice are also regulated by PPARGCIA/PGC-1α, a nuclear factor critical for multiple metabolic processes. ALAS1 expression, gluconeogenesis, ketogenesis, mitochondria biogenesis and circadian cycle all have been shown to be regulated by PPARGC1A (45–50). The expressions of PPARGC1A were comparable in the WT pair but were reduced in induced AIP mice (~1.96-fold). The reduction was close to statistical significance (p=0.051), and presumably would have been if more mice were analyzed. PPARGC1A is a complex transcriptional coactivator that not only regulates different sets of transcription target genes, but its expression is regulated by multiple different proteins (51,52). The gene has different tissue-specific isoforms, two reported in the human liver, which are dependent on the fed or fast state of the host (53). Therefore, it is conceivable a dysregulated hepatic PGC-1α pathway may be involved in precipitating AIP acute attacks (Fig. 6).
Fig. 6.

PGC-1α is a nuclear factor that has been shown to regulate those differentially expressed genes or pathways between WT and AIP mice.
In summary, the comparison of the hepatic transcriptomes in congenic WT and AIP mice before and after PB administration provides further understanding of the PB effect on hepatic gene expression. The functional enrichment analyses of the differentially expressed genes indicated that genes in multiple biologic pathways were uniquely enriched in PB-induced AIP mouse livers. Future studies of these pathways may provide an increased understanding of the roles of these pathways in human AIP acute attacks.
Supplementary Material
Acknowledgements
This work was supported in part by the Department of Genetics and Genomic Sciences at the Icahn School of Medicine at Mount Sinai, and by grants from the National Institutes of Health (NIH), including a Career Development Award (K01 DK087971) to M.Y. and a cooperative grant (U54 DK0839) for the Porphyrias Consortium (PC). The PC is a part of the NCATS Rare Diseases Clinical Research Network (RDCRN) of the National Institutes of Health. RDCRN is an initiative of the Office of Rare Diseases Research (ORDR), NCATS, funded through collaboration between NCATS and the NIDDK.
Conflicts of Interest
MY and RJD are past recipients of research grants from Alnylam Pharmaceuticals and Recordati Rare Diseases. They are co-inventors of a patent licensed to Alnylam Pharmaceuticals for RNAi therapy of the acute hepatic porphyrias. RJD is a consultant for Alnylam Pharmaceuticals, Mitsubishi Tanabe Pharma Development America and Recordati Rare Disease. The other authors have no conflicts.
Footnotes
Publisher's Disclaimer: This is a PDF file of an unedited manuscript that has been accepted for publication. As a service to our customers we are providing this early version of the manuscript. The manuscript will undergo copyediting, typesetting, and review of the resulting proof before it is published in its final citable form. Please note that during the production process errors may be discovered which could affect the content, and all legal disclaimers that apply to the journal pertain.
Contributor Information
Brenden Chen, Email: brenden.chen@mssm.edu.
Minghui Wang, Email: minghui.wang@mssm.edu.
Lin Gan, Email: lin.gan@mssm.edu.
Bin Zhang, Email: bin.zhang@mssm.edu.
Robert J Desnick, Email: robert.desnick@mssm.edu.
Makiko Yasuda, Email: makiko.yasuda@mssm.edu.
References
- 1.Anderson KE Sassa S, Bishop DF, Desnick RJ. Disorders of Heme Biosynthesis: X-Linked Sideroblastic Anemia and the Porphyrias In: Valle D, Beaudet AL, Vogelstein B, Kinzler KW, Antonarakis SE, Ballabio A, Gibson K, Mitchell G. eds. New York, NY: McGraw-Hill; 2014. http://ommbid.mhmedical.com/content.aspx?bookid=971&Sectionid=62638866 8th ed. New York: McGraw-Hill, 2001 [Google Scholar]
- 2.Puy H, Gouya L, Deybach JC. Porphyrias. Lancet 375 (2010) 924–937. [DOI] [PubMed] [Google Scholar]
- 3.Hift RJ, Meissner PN. An analysis of 112 acute porphyric attacks in Cape Town, South Africa: Evidence that acute intermittent porphyria and variegate porphyria differ in susceptibility and severity. Medicine (Baltimore) 84(2005) 48–60. [DOI] [PubMed] [Google Scholar]
- 4.Innala E, Backstrom T, Bixo M, Andersson C. Evaluation of gonadotropin-releasing hormone agonist treatment for prevention of menstrual-related attacks in acute porphyria. Acta Obstet Gynecol Scand 89 (2010) 95–100. [DOI] [PubMed] [Google Scholar]
- 5.Bonkovsky HL, Maddukuri VC, Yazici C, Anderson KE, Bissell DM, Bloomer JR, Phillips JD, et al. Acute porphyrias in the USA: features of 108 subjects from porphyrias consortium. Am J Med 127 (2014) 1233–1241. [DOI] [PMC free article] [PubMed] [Google Scholar]
- 6.Elder G, Harper P, Badminton M, Sandberg S, Deybach JC. The incidence of inherited porphyrias in Europe. J Inherit Metab Dis 36 (2013)849–857. [DOI] [PubMed] [Google Scholar]
- 7.Gu XF, de Rooij F, Lee JS, Te Velde K, Deybach JC, Nordmann Y, Grandchamp B. High prevalence of a point mutation in the porphobilinogen deaminase gene in Dutch patients with acute intermittent porphyria. Hum Genet 91 (1993) 128–130. [DOI] [PubMed] [Google Scholar]
- 8.Floderus Y, Shoolingin-Jordan PM, Harper P. Acute intermittent porphyria in Sweden. Molecular, functional and clinical consequences of some new mutations found in the porphobilinogen deaminase gene. Clin Genet 62 (2002) 288–297. [DOI] [PubMed] [Google Scholar]
- 9.Kauppinen R, von und zu Fraunberg M. Molecular and biochemical studies of acute intermittent porphyria in 196 patients and their families. Clin Chem 48 (2002) 1891–1900. [PubMed] [Google Scholar]
- 10.Nordmann Y, Puy H, Da Silva V, Simonin S, Robreau AM, Bonaiti C, Phung LN, et al. Acute intermittent porphyria: prevalence of mutations in the porphobilinogen deaminase gene in blood donors in France. J Intern Med 242 (1997) 213–217. [DOI] [PubMed] [Google Scholar]
- 11.Chen B, Solis-Villa C, Hakenberg J, Qiao W, Srinivasan RR, Yasuda M, Balwani M, et al. Acute Intermittent Porphyria: Predicted Pathogenicity of HMBS Variants Indicates Extremely Low Penetrance of the Autosomal Dominant Disease. Hum Mutat 37 (2016) 1215–1222. [DOI] [PMC free article] [PubMed] [Google Scholar]
- 12.Lenglet H, Schmitt C, Grange T, Manceau H, Karboul N, Bouchet-Crivat F, Robreau AM, et al. From a dominant to an oligogenic model of inheritance with environmental modifiers in acute intermittent porphyria. Hum Mol Genet 27 (2018) 1164–1173. [DOI] [PubMed] [Google Scholar]
- 13.Lindberg RL, Porcher C, Grandchamp B, Ledermann B, Burki K, Brandner S, Aguzzi A, et al. Porphobilinogen deaminase deficiency in mice causes a neuropathy resembling that of human hepatic porphyria. Nat Genet 12 (1996) 195–199. [DOI] [PubMed] [Google Scholar]
- 14.Yasuda M, Gan L, Chen B, Kadirvel S, Yu C, Phillips JD, New MI, et al. RNAi-mediated silencing of hepatic Alas1 effectively prevents and treats the induced acute attacks in acute intermittent porphyria mice. Proc Natl Acad Sci U S A 111 (2014) 7777–7782. [DOI] [PMC free article] [PubMed] [Google Scholar]
- 15.Lindberg RL, Martini R, Baumgartner M, Erne B, Borg J, Zielasek J, Ricker K, et al. Motor neuropathy in porphobilinogen deaminase-deficient mice imitates the peripheral neuropathy of human acute porphyria. J Clin Invest 103 (1999) 1127–1134. [DOI] [PMC free article] [PubMed] [Google Scholar]
- 16.Kozlenkov A, Wang M, Roussos P, Rudchenko S, Barbu M, Bibikova M, Klotzle B, et al. Substantial DNA methylation differences between two major neuronal subtypes in human brain. Nucleic Acids Res 44 (2016) 2593–2612 [DOI] [PMC free article] [PubMed] [Google Scholar]
- 17.Douvaras P, Sun B, Wang M, Kruglikov I, Lallos G, Zimmer M, Terrenoire C, et al. Directed Differentiation of Human Pluripotent Stem Cells to Microglia. Stem Cell Reports 8 (2017) 1516–1524. [DOI] [PMC free article] [PubMed] [Google Scholar]
- 18.Robinson MD, Oshlack A. A scaling normalization method for differential expression analysis of RNA-seq data. Genome Biol 11 (2010) R25. [DOI] [PMC free article] [PubMed] [Google Scholar]
- 19.Smyth GK. limma: Linear Models for Microarray Data In: Gentleman RCVJ, Huber W, Irizarry RA, Dudoit S, editor. Bioinformatics and Computational Biology Solutions Using R and Bioconductor. New York, NY: Springer; 2005. p. 397–420. [Google Scholar]
- 20.Hochberg Y, Benjamini Y. More powerful procedures for multiple significance testing. Stat Med 9 (1990) 811–818. [DOI] [PubMed] [Google Scholar]
- 21.Stathias V, Pastori C, Griffin TZ, Komotar R, Clarke J, Zhang M, Ayad NG. Identifying glioblastoma gene networks based on hypergeometric test analysis. PLoS One 9 (2014) e115842. [DOI] [PMC free article] [PubMed] [Google Scholar]
- 22.Forst CV, Zhou B, Wang M, Chou TW, Mason G, Song WM, Schadt E, Ghedin E, Zhang B. Integrative gene network analysis identified key signatures, intrinsic networks and host factors for influenze virus A infections. NPJ Syst Biol Appl 3 (2017) 35. [DOI] [PMC free article] [PubMed] [Google Scholar]
- 23.Subramanian A, Tamayo P, Mootha VK, Mukherjee S, Ebert BL, Gillette MA, Paulovich A, et al. Gene set enrichment analysis: a knowledge-based approach for interpreting genome-wide expression profiles. Proc Natl Acad Sci U S A 102 (2005) 15545–15550. [DOI] [PMC free article] [PubMed] [Google Scholar]
- 24.Huang DW, Sherman BT, Tan Q, Collins JR, Alvord WG, Roayaei J, Stephens R, et al. The DAVID Gene Functional Classification Tool: a novel biological module-centric algorithm to functionally analyze large gene lists. Genome Biol 8 (2007) R183. [DOI] [PMC free article] [PubMed] [Google Scholar]
- 25.Dobin A, Davis CA, Schlesinger F, Drenkow J, Zaleski C, Jha S, Batut P, et al. STAR: ultrafast universal RNA-seq aligner. Bioinformatics 29 (2013) 15–21. [DOI] [PMC free article] [PubMed] [Google Scholar]
- 26.Consortium SM-I. A comprehensive assessment of RNA-seq accuracy, reproducibility and information content by the Sequencing Quality Control Consortium. Nat Biotechnol 32 (2014) 903–914. [DOI] [PMC free article] [PubMed] [Google Scholar]
- 27.Li B, Qing T, Zhu J, Wen Z, Yu Y, Fukumura R, Zheng Y, et al. A Comprehensive Mouse Transcriptomic BodyMap across 17 Tissues by RNA-seq. Sci Rep 7 (2017) 4200. [DOI] [PMC free article] [PubMed] [Google Scholar]
- 28.Wang M, Zhao Y, Zhang B. Efficient Test and Visualization of Multi-Set Intersections. Sci Rep 5 (2015) 16923. [DOI] [PMC free article] [PubMed] [Google Scholar]
- 29.Jover R, Hoffmann F, Scheffler-Koch V, Lindberg RL. Limited heme synthesis in porphobilinogen deaminase-deficient mice impairs transcriptional activation of specific cytochrome P450 genes by phenobarbital. Eur J Biochem 267 (2000) 7128–7137. [DOI] [PubMed] [Google Scholar]
- 30.Meyer UA. Endo-xenobiotic crosstalk and the regulation of cytochromes P450. Drug Metab Rev 39 (2007) 639–646. [DOI] [PubMed] [Google Scholar]
- 31.Correia MA, Sinclair PR, De Matteis F. Cytochrome P450 regulation: the interplay between its heme and apoprotein moieties in synthesis, assembly, repair, and disposal. Drug Metab Rev 43 (2011) 1–26. [DOI] [PMC free article] [PubMed] [Google Scholar]
- 32.Collantes M, Serrano-Mendioroz I, Benito M, Molinet-Dronda F, Delgado M, Vinaixa M, Sampedro A, et al. Glucose metabolism during fasting is altered in experimental porphobilinogen deaminase deficiency. Hum Mol Genet 25 (2016) 1318–1327. [DOI] [PubMed] [Google Scholar]
- 33.Perlroth MG, Tschudy DP, Marver HS, Berard CW, Zeigel RF, Rechcigl M, Collins A. Acute intermittent porphyria. New morphologic and biochemical findings. Am J Med 41 (1966) 149–162. [DOI] [PubMed] [Google Scholar]
- 34.De Matteis F, Marks GS. Cytochrome P450 and its interactions with the heme biosynthetic pathway. Can J Physiol Pharmacol 74 (1996) 1–8. [PubMed] [Google Scholar]
- 35.Zanger UM, Turpeinen M, Klein K, Schwab M. Functional pharmacogenetics/genomics of human cytochromes P450 involved in drug biotransformation. Anal Bioanal Chem 392 (2008) 1093–1108. [DOI] [PubMed] [Google Scholar]
- 36.Ingelman-Sundberg M, Sim SC. Pharmacogenetic biomarkers as tools for improved drug therapy; emphasis on the cytochrome P450 system. Biochem Biophys Res Commun 396 (2010) 90–94. [DOI] [PubMed] [Google Scholar]
- 37.Nelson DR, Zeldin DC, Hoffman SM, Maltais LJ, Wain HM, Nebert DW. Comparison of cytochrome P450 (CYP) genes from the mouse and human genomes, including nomenclature recommendations for genes, pseudogenes and alternative-splice variants. Pharmacogenetics 14 (2004) 1–18. [DOI] [PubMed] [Google Scholar]
- 38.Idkowiak J, Cragun D, Hopkin RJ, Arlt W: Cytochrome P450 Oxidoreductase Deficiency In: Adam MP, Ardinger HH, Pagon RA, Wallace SE, Bean LJH, Stephens K, Amemiya A, eds. GeneReviews((R)). Seattle (WA), 1993. [Google Scholar]
- 39.Luisier R, Lempiainen H, Scherbichler N, Braeuning A, Geissler M, Dubost V, Muller A, et al. Phenobarbital induces cell cycle transcriptional responses in mouse liver humanized for constitutive androstane and pregnane × receptors. Toxicol Sci 139 (2014) 501–511. [DOI] [PubMed] [Google Scholar]
- 40.Jean G, Lambertenghi G, Ranzi T. Ultrastructural study of the liver in hepatic prophyria. J Clin Pathol 21(1968) 501–507. [DOI] [PMC free article] [PubMed] [Google Scholar]
- 41.Ostrowski J, Kostrzewska E, Michalak T, Zawirska B, Medrzejewski W, Gregor A. Abnormalities in liver function and morphology and impaired aminopyrine metabolism in hereditary hepatic porphyrias. Gastroenterology 85 (1983) 1131–1137. [PubMed] [Google Scholar]
- 42.Homedan C, Laafi J, Schmitt C, Gueguen N, Lefebvre T, Karim Z, Desquiret-Dumas V, et al. Acute intermittent porphyria causes hepatic mitochondrial energetic failure in a mouse model. Int J Biochem Cell Biol 51 (2014) 93–101. [DOI] [PubMed] [Google Scholar]
- 43.Larion S, Caballes FR, Hwang SI, Lee JG, Rossman WE, Parsons J, Steuerwald N, et al. Circadian rhythms in acute intermittent porphyria--a pilot study. Eur J Clin Invest 43 (2013) 727–739. [DOI] [PMC free article] [PubMed] [Google Scholar]
- 44.Ridley A The neuropathy of acute intermittent porphyria. QJ Med 38 (1969) 307–333. [PubMed] [Google Scholar]
- 45.Handschin C, Lin J, Rhee J, Peyer AK, Chin S, Wu PH, Meyer UA, et al. Nutritional regulation of hepatic heme biosynthesis and porphyria through PGC-1alpha. Cell 122 (2005) 505–515. [DOI] [PubMed] [Google Scholar]
- 46.Yoon JC, Puigserver P, Chen G, Donovan J, Wu Z, Rhee J, Adelmant G, et al. Control of hepatic gluconeogenesis through the transcriptional coactivator PGC-1. Nature 413 (2001) 131–138. [DOI] [PubMed] [Google Scholar]
- 47.Herzig S, Long F, Jhala US, Hedrick S, Quinn R, Bauer A, Rudolph D, et al. CREB regulates hepatic gluconeogenesis through the coactivator PGC-1. Nature 413 (2001) 179–183. [DOI] [PubMed] [Google Scholar]
- 48.Vega RB, Huss JM, Kelly DP. The coactivator PGC-1 cooperates with peroxisome proliferator-activated receptor alpha in transcriptional control of nuclear genes encoding mitochondrial fatty acid oxidation enzymes. Mol Cell Biol 20 (2000) 1868–1876. [DOI] [PMC free article] [PubMed] [Google Scholar]
- 49.Wu Z, Puigserver P, Andersson U, Zhang C, Adelmant G, Mootha V, Troy A, et al. Mechanisms controlling mitochondrial biogenesis and respiration through the thermogenic coactivator PGC-1. Cell 98 (1999) 115–124. [DOI] [PubMed] [Google Scholar]
- 50.Liu C, Li S, Liu T, Borjigin J, Lin JD. Transcriptional coactivator PGC-1alpha integrates the mammalian clock and energy metabolism. Nature 447 (2007) 477–481. [DOI] [PubMed] [Google Scholar]
- 51.Martinez-Redondo V, Pettersson AT, Ruas JL. The hitchhiker’s guide to PGC-1alpha isoform structure and biological functions. Diabetologia 58 (2015) 1969–1977. [DOI] [PubMed] [Google Scholar]
- 52.Liu C, Lin JD. PGC-1 coactivators in the control of energy metabolism. Acta Biochim Biophys Sin (Shanghai) 43 (2011) 248–257. [DOI] [PMC free article] [PubMed] [Google Scholar]
- 53.Felder TK, Soyal SM, Oberkofler H, Hahne P, Auer S, Weiss R, Gadermaier G, et al. Characterization of novel peroxisome proliferator-activated receptor gamma coactivator-1alpha (PGC-1alpha) isoform in human liver. J Biol Chem 286 (2011) 42923–42936. [DOI] [PMC free article] [PubMed] [Google Scholar]
Associated Data
This section collects any data citations, data availability statements, or supplementary materials included in this article.