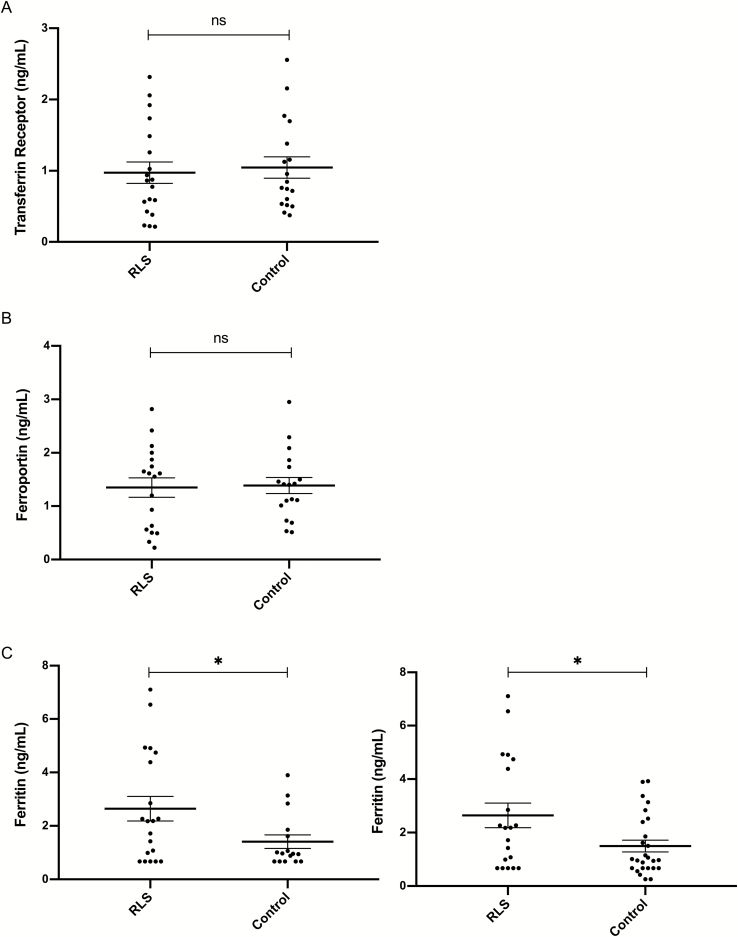
Figure 1.
Iron management proteins in L1CAM + nEVs. Graphs depict values (mean ± SD) of Transferrin Receptor (TfR) (A), Ferroportin (B), and Ferritin (C) in 20 RLS and 18 Control participants—except for 17 and 28 Control participants for Ferritin (C) (ns = nonsignificant). In (C) * depicts p = 0.032 in the first graph (including RLS and Control participants from JH) and p = 0.017 in the second graph (including additional Control participants from the NIA); values below the LLoQ with CV < 15% were assigned the LLoQ value. Group differences remained significant, even if we analyzed raw signal or did not set concentration values to the LLoQ.

