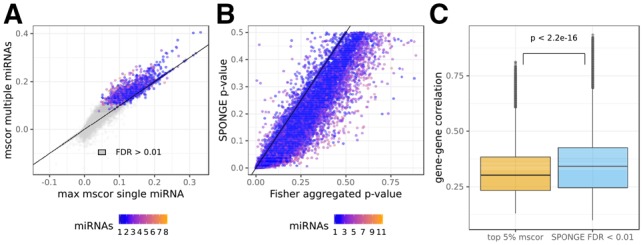
Fig. 2.

Comparison of sensitivity correlation and SPONGE FDR control on liver cancer data. (A) mscor values (y-axis) compared to maximal scor values (x-axis) for the same gene–gene interaction. (B) mscor P-values obtained from sampling compared to P-value summarization of scor values using Fisher’s method. (C) Boxplot of gene–gene correlations for gene–miRNA–gene triplets obtained after selecting the top 5% ceRNA interactions according to the raw scor values (orange) or based on FDR corrected P-values from SPONGE (blue). t-test P-value between both distributions is shown on top
